A Review of Dietary Selenium Intake and Selenium Status in Europe and the Middle East


Abstract
:1. Introduction
2. Experimental Section
3. Results
3.1. Selenium Intake Studies
3.1.1. Selenium Intake Studies: European Countries/UK

| Country | Study | Subject No./Age/Samples Details | Se Intake/Water and Food Content |
|---|---|---|---|
| UK [20] | A longitudinal analysis of Se intakes in UK South Asian and Caucasian women | 135 Caucasian premenopausal (19–40 years), 135 Caucasian postmenopausal (55–70 years), 39 Asian premenopausal (19–40 years) and 39 Asian postmenopausal (55–70 years) women | Se intake in a large proportion of subjects was less than the UK RNI (60 μg/day), the US DRI (55 μg/day) and UK LRNI (40 μg/day). Most women (all ethnicities) failed to meet UK RNI, US DRI and UK LRNI respectively |
| Poland [25] | Nutritive value of Olsztyn University students’ diet | 30 students; female and male; ages: 19–25 | Median Se intake from the diet, 20 μg; average, 25 μg; standard deviation (SD), 0.00175 |
| Spain [26] | Food intake using 1-year food frequency questionnaire (FFQ) and serum Se concentration in elderly people | 205 institutionalized elderly women (n = 125) and men (n = 125) | Se intake μg/day: women, 94.4 ± 23.6; men, 107.1 ± 32.2; animal, but not vegetable protein, contributed to serum Se |
| Spain [27] | Cross-sectional analysis using a 3-day food record | 483 children (216 boys and 267 girls) aged between 8 and 13 years. | 91.0 μg/day (above the recommended level in 99.4% of subjects); the main dietary sources were cereals, meats, fish and milk products |
| Spain [28,29] | Cross-sectional analysis using a 24-h dietary food recall | 20 nonagenarian subjects of 90–102 years (92.5 ± 3.5 years; 80% women) and sixty-three 80–90-year-olds (84.0 ± 2.7 years; 58.7% women); all non-institutionalised | Nonagenarians had higher Se intake than the 80–90-year-old group. Se intake was equal to (in the 80–90-year-old group) or slightly above (in the nonagenarians) the recommended intake and was negatively associated with anxiety/depression |
| Spain [30] | Cross-sectional analysis using 24-h diet recall questionnaire | 280 healthy women grouped into three major groups: women aged ≤35 years; women aged 36–45, and finally, women aged >45 years. | 74.66 μg/day in 18–35-year-olds; 50.71 μg/day in 36–45-year-olds; 20.56 μg/day in >45-year-olds. There was a significant and positive association between bone mineral density and dietary intake of Se |
| France [31] | Case-control study of Se in people exposed to Se concentration in drinking water greater than the maximum recommended limit (10 μg/L) using an FFQ | 40 exposed subjects and 40 non-exposed controls | Exposed subjects intake 64 ± 14 μg/day; non-exposed 52 ± 14 μg/day |
| Belgium [32] | To determine the Se status of the population | Intake calculated from analysis of 800 food products combined with food intake records | The mean dietary Se intake was calculated to be 60 μg/day; the major sources of Se intake were meat and meat products (31%), fish and shellfish (20%), pasta and rice (12%) and bread and breakfast cereals (11%) |
| Republic of Slovenia [33] | Cross-sectional to assess Se status during 3 months of basic military training in a group of recruits using analysis of diet samples | 15 recruits | 48 ± 10 μg/day |
| Italy [34] | Cross-sectional study of Se concentration in human milk after delivery compared to infant intake of Se from breast milk | 242 women and their breast feeding infants | Mean Se concentration in milk samples was 12.1 ± 3.0 ng/g (lower than that noted in other international studies); mean Se intake in infants was 9.5 ± 2.4 μg/day |
| Italy [35] | A cross-sectional analysis using a 3-day diet diary | 128 haemodialysis patients | 28.3 ± 18.1 μg/day |
| UK [36] | Headline results from Year 1 of the Rolling Programme (2008/2009) | Various age groups | Roughly 50% of adult women and older girls and 20% of men and older boys had Se intakes below the LRNI level |
| UK [37] | Longitudinal study of healthy British adults using biochemical and molecular biomarkers | Women (n = 24, mean age 45 years), males (n = 39, mean age 45 years) | Women had a baseline Se intake of 43 μg/day; males had a baseline Se intake of 54 μg/day. The average intake of both sexes was 1.13 μmol/L (89.22 μg/L) |
| Northern Ireland [38] | Case-control study of chronic heart failure patients using a 4 day food diary | 39 subjects and 27 healthy controls | 73% of subjects were consuming less than the recommended amount of Se |
| UK [39] | Cross-sectional analysis using a self-reported 12-month dietary intake questionnaire | 1,798 subjects evaluated for prostate cancer risk | A 25% increase in Se was associated with higher insulin-like growth factor I (IGF-I), elevating prostate cancer risk |
| The Netherlands [40] | To assess the contribution of dairy products to the intake in several life stages | Data derived from 3 Dutch food consumption surveys and the Leiden Longevity Study | In young children, dairy products contributed 21% to the Se intake; in adults and the elderly, the contribution of dairy products to intake was 18%–19% |
| Northern Italy [41] | Prospective analysis of data from the Hormones and Diet and the Etiology of Breast Cancer (ORDET) cohort using a semi-quantitative FFQ | 7182 subjects | 55.7 μg/day |
| Spain [42] | A cross-sectional study analysis using a 3-day food diary | 573 Madrid schoolchildren aged 8–13 years | Se intake was also lower in obese children (1.99 ± 0.62 μg/kg) compared to normal weight children (2.73 ± 0.88 μg/kg) |
| Italy [43] | Semi-quantitative FFQ data from a population-based case-control study to determine the relationship between Se exposure and risk of cutaneous melanoma | 54 melanoma patients and 56 controls | Median Se intake was 54 μg/day in the cases and 57 μg/day in the controls |
| Country | Study | Subject No./Age/Samples Details | Se Intake/Water and Food Content |
|---|---|---|---|
| Turkey [44] | Se Content of human breast milk in lactating women; dairy milk products of Turkey | Breast milk samples from 10 healthy lactating women collected during 2 months; colostrum milk 7 days and transitional milk 8–15 days postpartum; mature milk on the 15th day postpartum; cow milk samples collected from cities in Turkey from 1994 to 1996; other milk samples collected from various cities in Turkey | Average Se concentration (mean ± SD) in human breast milk: colostrum 13.8 ± 4.71 ng/g; transitional 11.52 ± 1.92 ng/g; mature 11.16 ± 6.15 ng/g; cow milk ranged from 5.78 to 32.02 ng/g, lowest in Van and highest in Aksaray; the overall mean in cow milk was 15.24 ± 5.54 ng/g; other milk: goat milk 39.28 ± 30.11 ng/g; sheep milk 32.28 ± 17.98 ng/g; water buffalo 32.89 ± 15.32 ng/g; goat milk contained almost twice that in cow’s milk |
| Turkey [45] | Systematic review of trace elements in growth | Summary of various studies investigating Se levels in children | Estimated daily intakes: 30–40 μg/day |
| Turkey [46] | Trace metal levels in milk and dairy products consumed in middle Anatola, Turkey | Samples collected reflected the potential consumption by the Turkish population. | Highest average Se found in Tulum cheese (0.434 mg/kg); butter averaged 0.315 mg/kg, followed by Kaşar cheese, with 0.276 mg/kg and milk with 0.232 mg/kg; white cheese and drained yoghurt contained 0.159 mg/kg and 0.082 mg/kg, respectively; ice cream, milk and whey powders, yogurt, Ayran or Lor cheese contained no Se. |
| Jordan [47] | Survey of ground water in semi-arid areas: Amman Zarqa Basin | Se concentration (in μg/L) in the different aquifers in the Amman Zarqa Basin | Total Se content varied markedly in the aquifers; the Se concentration ranged from 2 to 441 μg/L, and the average was 30.8 μg/L |
| KSA [48] | The distribution of Se in dairy farms: a preliminary report from Al-Kharj | The concentration of Se in wheat grain grown in KSA | Se ranged from 8 to 293 μg/kg (average 78.4 μg/kg); the lowest average, 50.6 μg/kg, was the Wadi Al-Dowasir area, while the highest average, 285.5 μg/kg, was in Al-Jouf |
| KSA [49] | Survey of foods from the KSA market and estimation of the daily intake | Foods for residents of Jeddah | Intake of 75–121.65 μg Se/person per day |
| KSA [50,51] | Survey of infant milk formula | Infant formulas | Contained adequate Se for infants up to 6 months |
| KSA [51,52] | Survey of breast milk and cow’s milk | Breast milk | Breast-fed infants had Se intakes between 0.9 and 15 μg/day |
| Jordan [53] | Case-control study of colorectal cancer patients using a semi-quantitative FFQ | 220 patients and 220 age- and gender-matched controls | Colorectal cancer patients had significantly lower dietary intake of Se than controls (38.75 ± 11.42 μg/day versus 59.26 ± 8.91 μg/day) |
| Tehran, Iran [54] | Cross-sectional analysis of 24-h food recalls | 100 female university students aged 18-25 years | Se intake was 54.5 ± 38.7 μg/day |
| Shahin Shahr and Meymeh, Iran [55] | Cross-sectional analysis of 24-h food recalls | Seventy one 6–7-year-old normal weight children | Se intake was within recommendations |
| Iran [56] | Case-control analysis of 24-h dietary recall data | 445 coronary artery disease patients divided into those with significant disease (>50% occlusion) (Angio+ (n = 273)) and those with <50% coronary artery occlusion (Angio− (n = 172)) and 443 healthy controls | Se intake in the control 34.98 ± 22.93 mg/day, Angio—48.70 ± 23.53 mg/day and Angio+ 49.63 ± 29.75 mg/day * |
| Iran [57] | Case-control analysis of a 24-h validated FFQ | 47 cases with oesophageal squamous cell carcinoma patients and 96 controls | The calorie adjusted mean Se intakes were categorized into 3 tertiles; controls consumed 623.5-times higher Se than patients |
| KSA [58] | Quantification of Se in food from local markets of Riyadh. | Primary sources of Se in the diet were: meat and meat products (31%), egg (20.4%), cereals and cereal products (16%), legumes (8.7%), fruits (6.8%), milk and dairy products (2.0%), beverages (2%), sweets (1.8%), pickles (0.2%) and oil (0.02%). | Daily intake of Se was estimated to be 93 μg/day |
| Iran [59] | Cross-sectional analysis to determine Se intake using a 3-day food record in postmenopausal women | 30 postmenopausal women | Daily intake of Se was estimated to be 40 μg/day |
3.1.2. Selenium Intake Studies: Middle Eastern Countries
3.2. Selenium Status Studies
| Country | Study Description | Subject Details/Number | Se Status by Body Compartment |
|---|---|---|---|
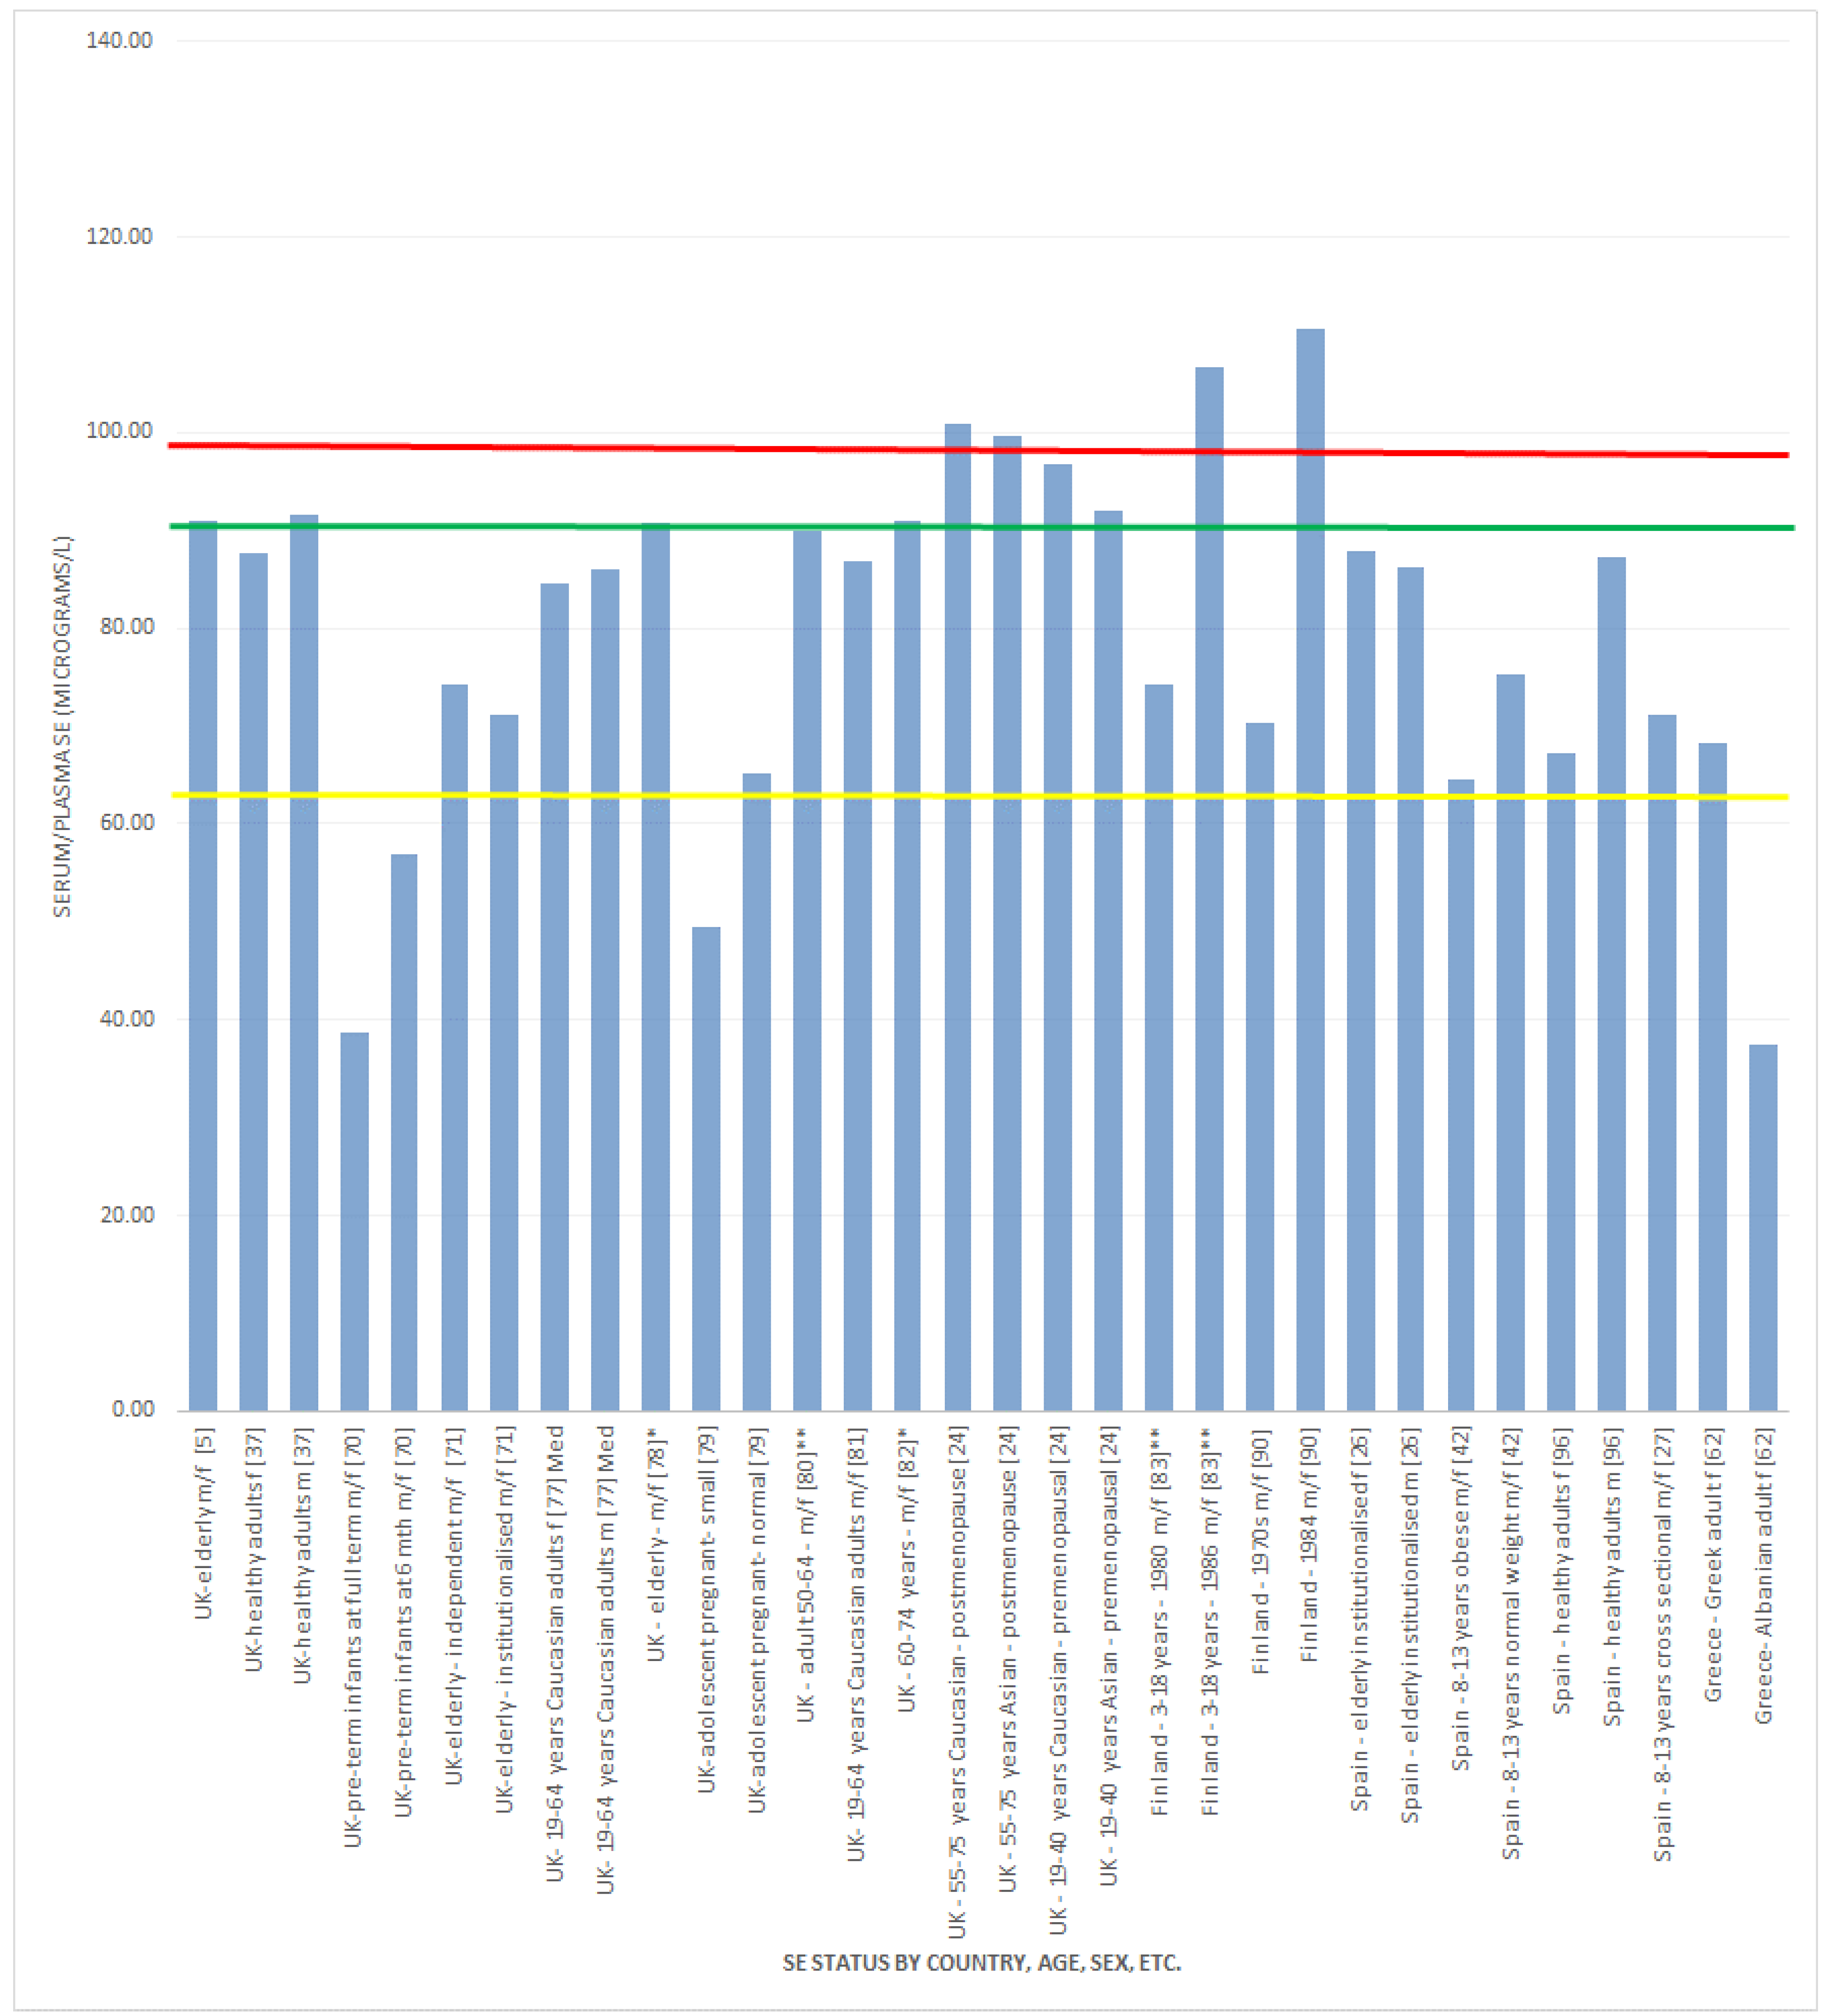
| UK [5] | Randomised, double-blind, placebo-controlled trial of Se supplementation on thyroid function | 501 males and females aged 60–74 years | Mean baseline plasma Se, 91 μg/L |
| UK [20,60] | A longitudinal analysis of Se intakes in UK South Asian and Caucasian women: oral presentation | 135 Caucasian premenopausal (19–40 years), 135 Caucasian postmenopausal (55–70 years), 39 Asian premenopausal (19–40 years) and 39 Asian postmenopausal (55–70 years) women. | Full plasma GPx expression (serum or plasma Se level of 98.7 μg/L [8] was not achieved by 51.1% of the UK (Caucasian and Asian), 63.3% of UK Asian and 45.2% of UK Caucasian subjects |
| UK [24] | Retrospective cohort, including previously reported indices of bone health and dietary Se intake and Se analysis (during 2010) of previously collected plasma and serum in the D-FINES study [60]. | 51 UK resident postmenopausal women (35 Caucasian; 16 Asian, 55–75 years; 41 UK resident premenopausal women (27 Caucasian; 14 Asian), 19–40 years | Mean serum or plasma Se status μg/L in postmenopausal Caucasian and Asian women, respectively, was 100.91 ± 16.94 μg/L and 99.69 ± 23.73 μg/L; in premenopausal Caucasian and Asian women, respectively, it was 96.68 ± 11.76 μg/L and 92.10 ± 17.22 μg/L |
| Spain [26] | Cross-sectional analysis of food intake and serum Se in elderly people | Dietary intake assessed in 205 institutionalized elderly using 1-year FFQ: women (n = 125); men (n = 125) | Mean serum Se levels μg/L: women 87.9 ± 16.6; men 86.2 ± 17; bakery, fish and shellfish, meat, meat products and dairy products were associated with serum Se; animal, but not vegetable protein contributed to serum Se |
| Spain [27] | Cross-sectional analysis using a 3-day food record and serum analysis | 483 children (216 boys and 267 girls) aged between 8 and 13 years | The mean serum Se was 71.1 μg/L; however, it was <60 μg/L in 13.9% of subjects, and <45 μg L/ in 5.6% |
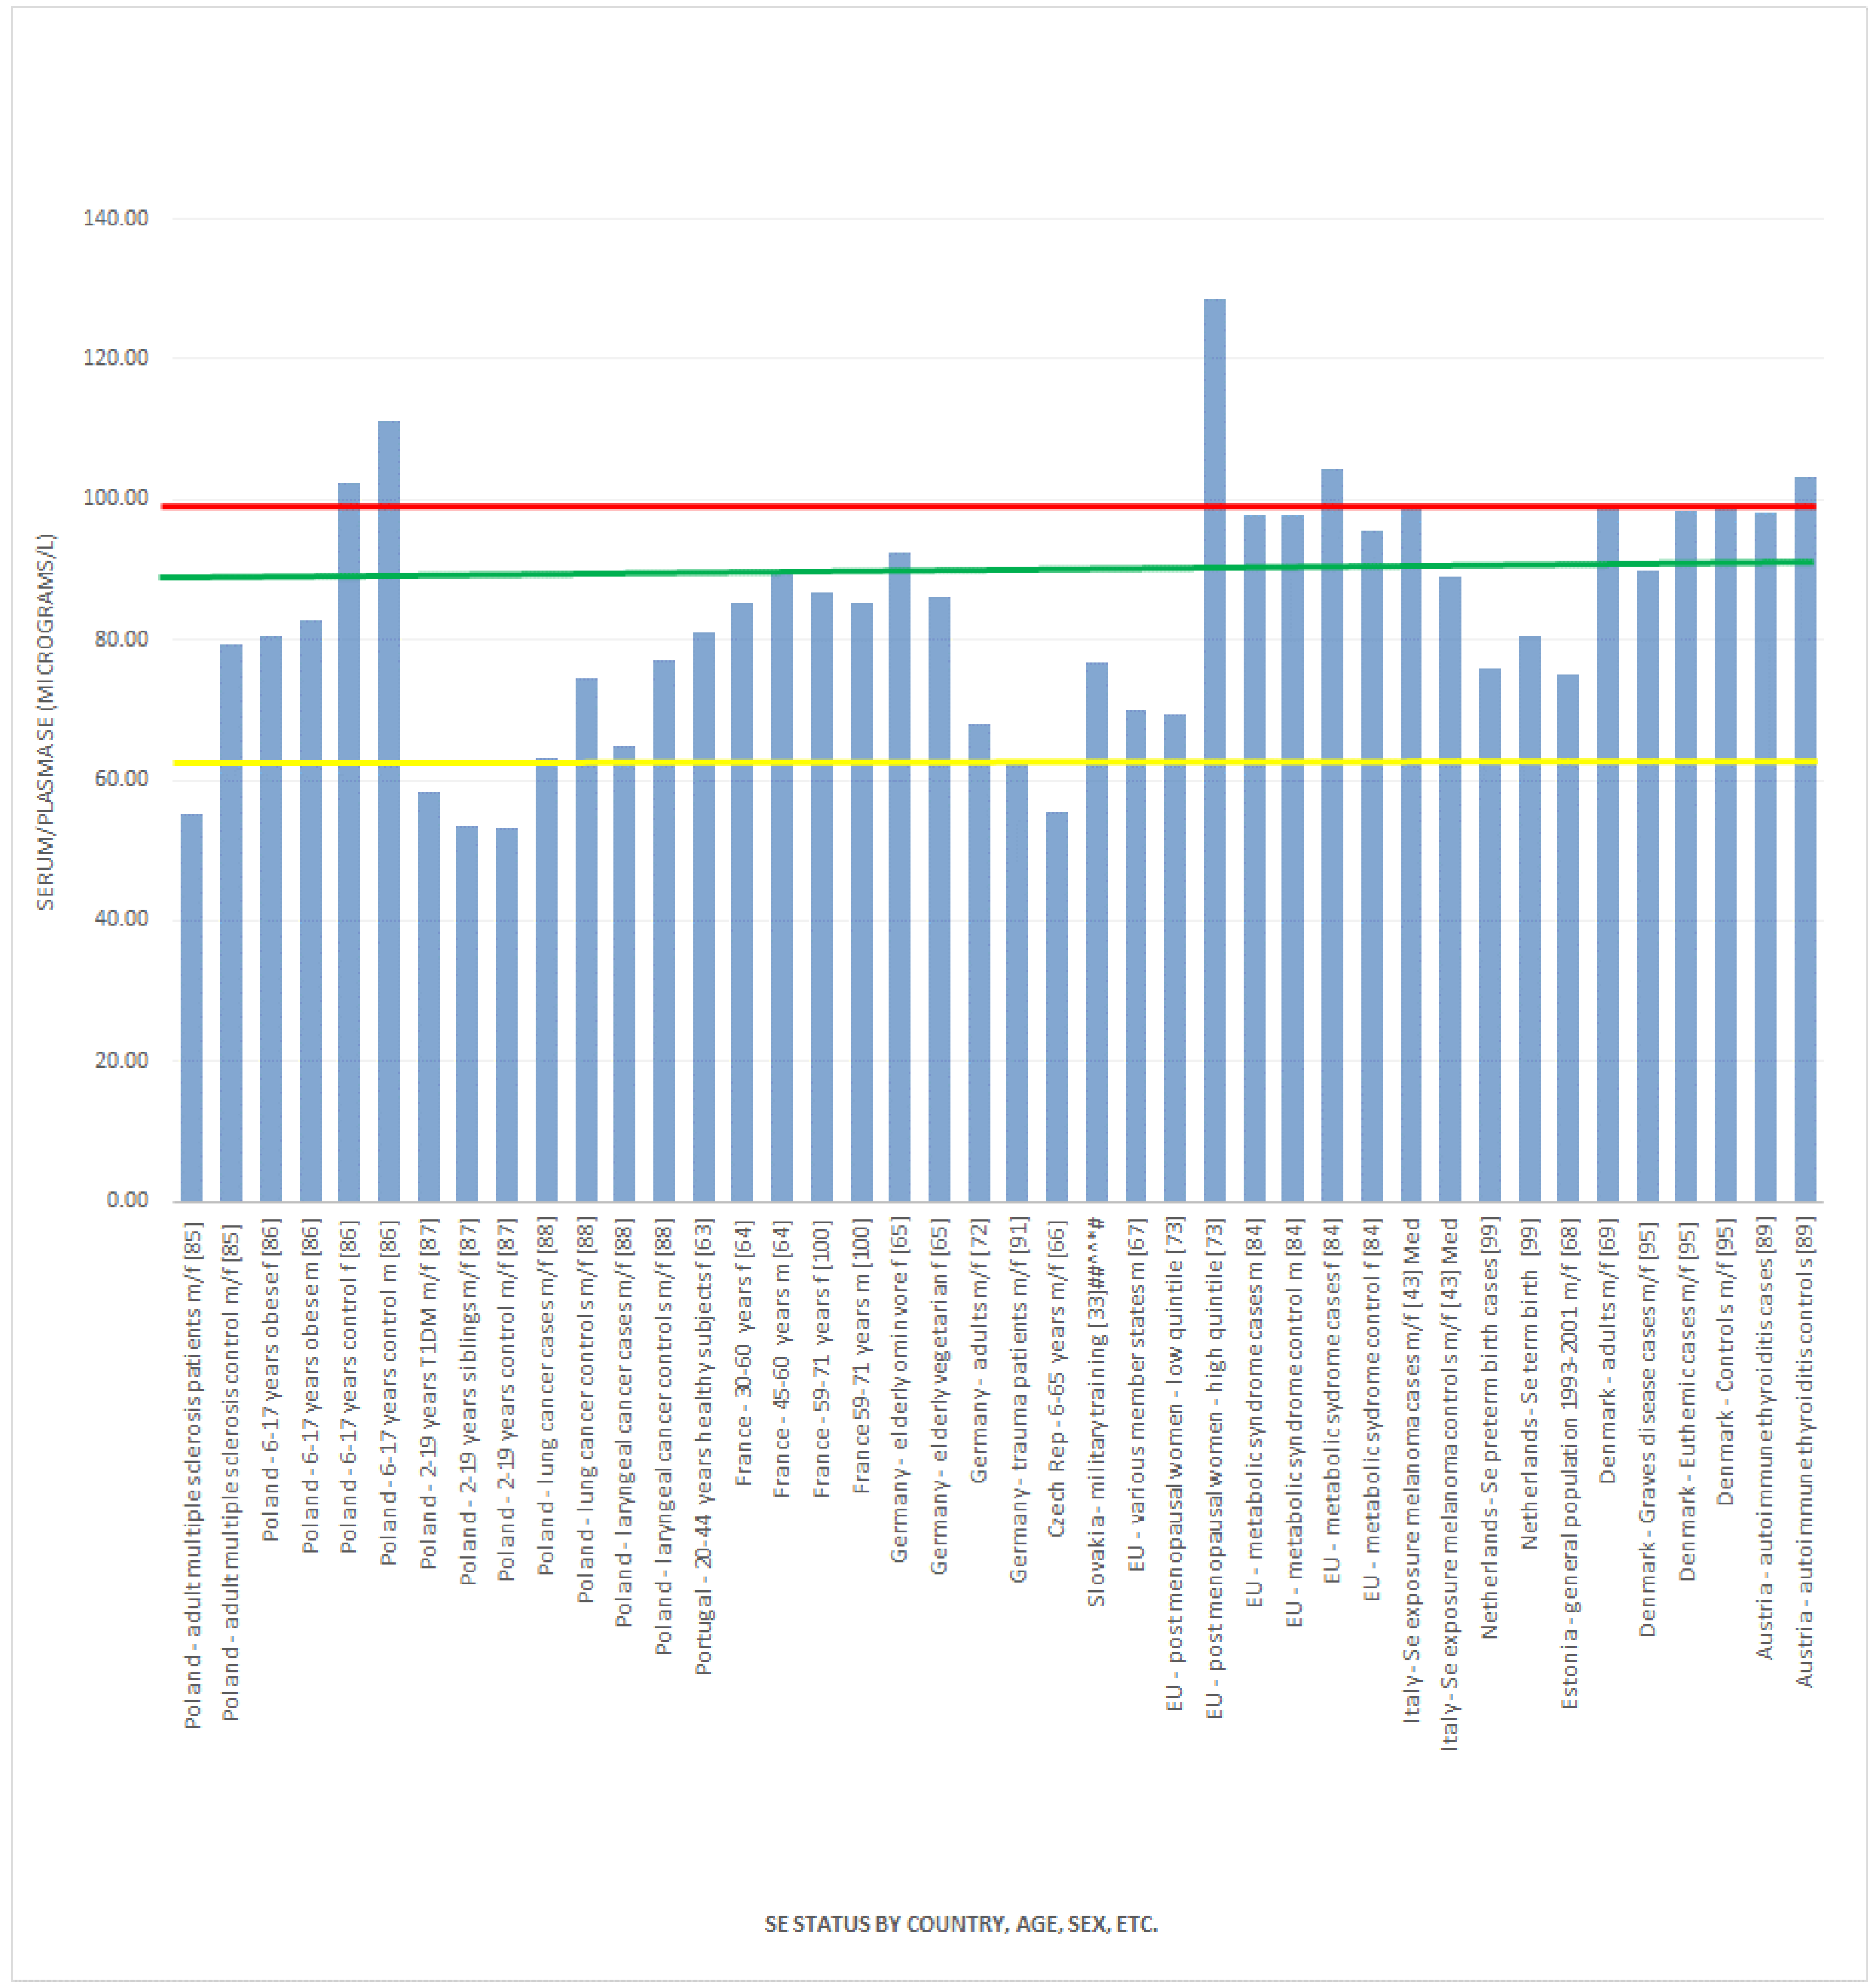
| Republic of Slovenia [33] | A cohort study to assess Se status during 3 months of basic military training | 15 recruits | Plasma Se was between 70 and 80 ng/g (** 71.75–82 μg/L; ##, ^^, # 76.87 μg/L) |
| UK [37] | Longitudinal Se status in healthy British adults: assessment using biochemical and molecular biomarkers | 24 women, mean age 45 years; 39 males, mean age 45 years | Women’s baseline plasma Se was 1.11 μmol/L (* 87.65 μg/L). Male’s baseline plasma Se was 1.16 μmol/L (* 91.59 μg/L) |
| Spain [42] | Cross-sectional study to determine whether being overweight/obesity is associated with children’s Se status | 573 Madrid schoolchildren aged 8–13 years | Children with excess weight (BMI > P85) had lower serum Se than those of normal weight (64.6 ± 16.8 μg/L compared to 75.3 ± 12.2 μg/L) |
| Italy [43] | Population-based case-control series to determine the relationship between Se exposure and risk of cutaneous melanoma | 54 melanoma patients and 56 controls | Median plasma Se was 99 μg/L in the cases and 89 μg/L in the controls; median toenail Se was 0.64 μg/g in the cases and 0.65 μg/g in the controls |
| Greece [62] | Cross-sectional analysis of maternal-neonatal serum Se and copper levels in Greeks and Albanians | Subjects: 1118 Greek and 820 Albanian immigrant mothers | Mean serum Se in Greek mothers was 68.3 ± 8.5 μg/L and Greek new-borns 37.2 ± 8.9 μg/L; mean serum Se in Albanian mothers was 37.4 ± 8.9 μg/L and Albanian new-borns 34.33 ± 9.1 μg/L |
| Portugal [63] | Cross-sectional analysis of data from healthy Portuguese subjects of the Lisbon population | 136 women aged 20–44 years; 47 men aged 45–70 years | Mean serum Se 81 ± 14 μg/L in women; the oldest subjects had the highest concentrations (regardless of gender), although higher serum Se values were noted in men |
| France [64] | Cross-sectional study: The SUpplementation en VItamines et Mineraux AntioXydants SU.VI.MAX) study | 1821 women (30–60 years) and 1307 men (45–60 years) | Baseline mean serum Se for men was 1.13 ± 0.20 μmol/L (* 89.22 ± 15.79 μg/L) and women 1.08 ± 0.19 μmol/L (* 85.28 ± 15.00 μg/L) |
| Germany [65] | Cross-sectional analysis of Se and antioxidant vitamin status | 178 elderly women (absence of severe disease; mean age: 63.2 years (SD ± 2.73) | Mean serum Se in omnivores (n = 159) 1.17 ± 0.22 μmol/L (* 92.38 μg/L) and vegetarians 1.09 ± 0.22 μmol/L (* 86.07 μg/L); sixty five (38.9%) women had serum Se concentrations below 1.1 μmol/L (* 86.86 μg/L) and 153 (91.6%) below 1.5 μmol/L (* 118.44 μg/L) |
| Czech Republic (West Bohemia) [66] | Cross-sectional analysis to assess Se deficiency of West Bohemia population | Age: 6–65 years; sex: male and female | Serum mean Se: 55.4 ± 13.8 μg/L; urine: 15.4 ± 5.7 μg/L; 13.6 ± 6.0 μg/g creatinine. hair: 0.268 ± 0.051 μg/g Se indexes were concluded to be low |
| EU, various countries [67] | Nested case-control assessing plasma Se and prostate cancer risk: results from the European Prospective Investigation into Cancer and Nutrition (EPIC) | 959 men (with incident prostate cancer) 1059 matched controls | Mean plasma Se in controls ranged from 63.2 μg/L to 76.6 μg/L; lowest levels in Greece and Germany and highest in the UK and Sweden; plasma concentrations in EPIC (mean: 70 μg/L) |
| Estonia [68] | Cross-sectional analysis of 5 studies between 1993 and 2001 | 404 subjects included women, pregnant women and men aged 19.5 to 52 years, but not declared in all studies | Serum Se concentration ranged from 26 to 116 μg/L (mean: 75 μg/L), which were comparable to analyses that were completed in the Finnish population prior to the use of Se-enriched fertilizers |
| Denmark [69] | Cross-sectional analysis of serum Se and selenoprotein P status in adult Danes within an 8-year follow up | 817 subjects: women, 18–22 years, 40–45 years, 60–65 years; men, 60–65 years. | Mean serum Se 98.7 ± 19.8 μg/L; serum Se increased with age in both sexes and decreased by 5% on average from 1997 to 1998; there was a weak correlation between serum Se and fish intake; Se status was concluded to be acceptable |
| UK [70] | Cross-sectional analysis of Se blood levels | 68 pre-term infants (35 boys and 33 girls) | Mean plasma Se at term and 6 months were 0.49 ± 0.15 μmol/L (* 38.69 μg/L) and 0.72 ± 0.14 μmol/L (* 56.85 μg/L) and red blood cell Se 1.68 ± 0.40 μmol/L (* 132.65 μg/L) and 1.33 ± 0.19 μmol/L (* 105.02 μg/L), respectively |
| UK [71] | Cross-sectional analysis of Se status and its correlates in a British National Diet and Nutrition Survey (NDNS) | 883 independent and 251 institution living men and women, aged 65 years and over | Plasma mean Se 0.94 μmol/L (* 74.22 μg/L) for independents and plasma mean Se 0.90 μmol/L (* 71.06 μg/L) for those in the institutional setting |
| Germany [72] | Cross-sectional analysis of participants in the Lipid Analytic Cologne cohort | 792 participants who never smoked, who did not use antihypertensives and who did not have diabetes or known atherosclerotic disease | Mean serum Se concentration was 68 ± 32 μg/L |
| 5 European Cities [73] | A 6-year prospective study of fracture-related factors: the Osteoporosis and Ultrasound Study (OPUS) | 2374 postmenopausal women | Mean baseline serum Se was 94.3 (range 54.4–161.2) μg/L; the mean of the low quintile was 69.50 (range 39.46–77.06) μg/L, and the mean of the high quintile was 128.43 (range 115.99–205.25) μg/L; higher Se was associated with higher hip bone mineral density (BMD) at study entry |
| The Netherlands [74] | A 16.2-year prospective longitudinal study of The Netherlands cohort | 120,852 subjects aged 55–69 years completed a dietary and lifestyle questionnaire on dietary habits and provided toenail clippings for baseline Se determination | Mean Se concentration was approximately 0.563 μg/g at baseline and did not change significantly throughout the study |
| Denmark [75] | A 16-year longitudinal follow up of the Copenhagen Male Study | 3333 males aged 53–74 years | 167 (5.1%) subjects died of lung cancer: 5.0% of them with low serum Se (0.4–1.0 μmol/L) (* 31.58–78.96 μg/L), 5.1% with medium serum Se 1.1–1.2 μmol/L (* 86.86–94.75 μg/L) and 5.1% with high serum Se 1.3–3.0 μmol/L (* 102.65–236.88 μg/L) |
| UK [76] | Baseline data from a double-blind, placebo-controlled, pilot trial | 230 primiparous pregnant women | The overall median whole-blood Se concentration at baseline was 1.31 (* 103.44 μg/L) (range 0.84–3.33) μmol/L (* 66.33–262.94 μg/L) |
| UK [77] | Cross-sectional analysis of anthropometric indices with Se-status biomarkers using data from 2000 to 2001 (NDNS) | 1045 (577 female, 468 male) British Caucasian adults ages 19–64 | Median plasma and erythrocyte Se concentrations were 1.08 (0.98, 1.20) μmol/L (* 85.28 (77.38, 94.75) μg/L) and 1.62 (1.38, 1.91) μmol/L (*127.92 (108.96, 150.81) μg/L), respectively; for males, values were 1.09 (0.99, 1.22) μmol/L (* 86.07 (78.17, 96.33) μg/L) and 1.54 (1.34, 1.79) μmol/L (* 121.60 (105.81, 141.34) μg/L), respectively; for females 1.07 (0.97, 1.18) μmol/L (* 84.49 (76.59, 93.17) μg/L) and 1.71 (1.43, 1.99) μmol/L (* 135.02 (112.91, 157.13) μg/L), respectively |
| UK [78] | Data from the UK PRECISE (Prevention of Cancer by Intervention with Selenium) pilot, randomized, double-blind, placebo-controlled trial | 501 elderly volunteers | Mean plasma Se concentration was 88.5 ng/g (** 90.71 μg/L) at baseline |
| UK [79] | Data from the about Teenage Eating Study, a prospective observational study | 126 pregnant adolescents (14–18-year-olds) between 28 and 32 weeks gestation | Plasma Se (mean ± (SD)) was lower in the small-for-gestational-age group (n = 19: 49.4 ± 7.3 μg/L) compared with the appropriate-for-gestational-age group (n = 107: 65.1 ± 12.5 μg/L); smokers had lower Se compared with non-smokers (p = 0.01), and Afro-Caribbean women had higher Se compared with white Europeans (p = 0.02) |
| UK [80] | Randomised, double-blind, placebo-controlled trial | 119 free-living, non-smoking men and women, aged 50–64 years | Mean baseline plasma Se was approximately 90 ng/mL = 90 μg/L |
| UK [81] | Cross-sectional analysis of Se status with cardio-metabolic risk factors in the general population | 1042 white participants (aged 19–64 year) from the 2000–2001 UK NDNS | Mean plasma Se concentration was 1.10 ± 0.19 μmol/L (* 86.86 ± 15 μg/L) |
| UK [82] | Randomized, placebo-controlled, parallel-group study stratified by age and sex | 501 volunteers aged 60 to 74 years | Mean plasma Se was 88.8 ng/g (** 91.02μg/L) at baseline |
| Finland [83] | Cross-sectional and longitudinal associations of serum Se with cardiovascular risk factors | 1235 young Finns aged 3–18 years and followed from 1980 until 1986 | Mean (±SD) serum Se was 74.3 ± 14.0 ng/mL = 74.3 ± 14.0 μg/L at baseline and 106.6 ± 12.5 ng/mL = 106.6 ± 12.5 μg/L six years later |
| UK, Belgium, Italy [84] | Cross-sectional analysis of data from the Dietary Habit Profile in European Communities with Different Risk of Myocardial Infarction: the Impact of Migration as a Model of Gene-Environment Interaction (IMMIDIET) study to evaluate the effect of genetic and dietary habits on cardiovascular disease risk factors in non-diabetic subjects | Couples randomly recruited from general practice in southeast London, England (n = 263), the Flemish territory of Belgium (n = 267) and the Abruzzo region of Italy (n = 271) | The mean (SD) plasma Se (in μmol/L) in men without metabolic syndrome was 1.24 (* 97.91 μg/L) (0.23) and with metabolic syndrome was 1.24 (* 97.91 μg/L) (0.23); similar results for women without metabolic syndrome were 1.21 (* 95.54 μg/L) (0.23) and with metabolic syndrome 1.32 (* 104.23 μg/L) (0.28) |
| Poland [85] | Case-control to estimate Se concentration, glutathione peroxidase activity and total antioxidant status in patients with multiple sclerosis and the influence of dietary habits | 101 patients with relapsing-remitting MS (aged 18–58 years) and 63 healthy people (aged 19–65 years) | Serum Se in patients was 55.2 ± 16.2 μg/L compared with controls 79.2 ± 20.6 μg/L |
| Poland [86] | Cross-sectional study to determine serum and urinary Se in children with and without obesity | 80 children (age 6–17; 40 boys, 40 girls) | Serum Se (in μg/L) in control girls 102.3 ± 7.9, control boys 111.1 ± 9.5, obese girls 80.4 ± 8.2, obese boys 82.8 ± 10.3; urine Se (in μg/L) in control girls 55.9 ± 9.4 in control boys 60.3 ± 11.5, in obese girls 36.0 ± 7.5, in obese boys 36.7 ± 5.6 |
| Poland [87] | Case-control analysis of anti-oxidant defences in pubertal patients with type 1 diabetes mellitus (T1DM) and their siblings | 87 children with T1DM, 2–19 years old and their siblings comprised of 27 and 41 children, aged 4.5–16.5 years and 10.5–18 years, respectively, and 41 healthy children aged from 10.5 to 18 years | Plasma mean Se (μg/L) in T1DM children was 58.4, in their sibling was 53.45 and in the controls was 53.3 |
| Poland [88] | Case-control study in Szczecin, a region of northwestern Poland | 95 lung cancer cases, 113 laryngeal cancer cases and corresponding healthy controls | Among lung cancer cases, mean serum Se was 63.2 μg/L, compared to 74.6 μg/L for their matched controls. Among laryngeal cancer cases, the mean serum Se was 64.8 μg/L, compared to 77.1 μg/L for their matched controls |
| Austria [89] | Case-control study of people with autoimmune thyroiditis | Patients with autoimmune thyroiditis and matched group of healthy persons | Serum Se in the patients was 98.0 ± 15.6 μg/L and in controls was 103.2 ± 12.4 μg/L |
| Finland [90] | Systematic review | Sampling of human blood from the same 60 adults, annually | Mean plasma Se increased from 0.89 μmol/L (* 70.27 μg/L) in the 1970s to a general level of 1.40 μmol/L (* 110.54 μg/L) since introducing Se-supplemented fertilizers in 1984 |
| Germany [91] | Cross-sectional study in disorders in wound healing | 44 trauma patients with disorders in wound healing | Mean plasma Se was 0.79 ± 0.19 μmol/L (* 62.38 ± 15.00 μg/L) |
| Germany [92] | Prospective observational study to assess the effects of perioperative sodium-selenite administration on Se blood concentrations in cardiac surgical patients | 104 cardiac surgical patients | Whole blood Se was 89.05 ± 12.65 μg/L pre-surgery and 70.84 ± 10.46 μg/L post-surgery |
| Germany [93] | Prospective observational study in the development of multi-organ dysfunction in cardiac surgical patients | 60 patients (age 65 ± 14 years) undergoing cardiac surgery with the use of cardiopulmonary bypass | Fifty patients exhibited a significant Se deficiency already before surgery. Se was significantly reduced after the end of surgery when compared to preoperative values (89.05 ± 12.65 to 70.84 ± 10.46 μg/L) |
| Greece [94] | A prospective cross-sectional study to assess the relationship of urine Se levels with thyroid function and autoimmunity in pregnant women | 47 euthyroid women in uncomplicated singleton pregnancies (mean age + SD: 30 + 5 years) | Urine Se in μg/L: 1st trimester 91 ± 60, 2nd trimester 82 ± 59, 3rd trimester 69 ± 57 |
| Denmark [95] | Case-control study in patients with newly-diagnosed autoimmune thyroid disease | 97 patients with newly-diagnosed Graves’ disease, 96 with hypothyroidism, 92 euthyroid subjects with high serum thyroid peroxidase antibody and 830 controls | Mean serum Se in Graves’ disease was 89.9 μg/L, in euthymic subjects 98.4 μg/L and in controls 98.8 μg/L |
| Spain [96] | Cross-sectional study of a healthy population | 84 healthy adults (31 males and 53 females) from the province of Granada | Mean plasma Se was 76.6 ± 17.3 μg/L (87.3 ± 17.4 μg/L in males, 67.3 ± 10.7 μg/L in females), whereas the mean erythrocyte Se was 104.6 μg/L (107.9 ± 26.1 μg/L in males and 101.7 ± 21.7 μg/L in females) |
| Spain [97] | Cross-sectional study of a healthy population in southern Spain | 340 subjects | 86.5% had plasma Se below 125 μg/L |
| Hungary [98] | A single-centre cross-sectional clinical survey following cardiac surgery | 197 consecutive patients undergoing on-pump operation | Mean blood Se was significantly lower in non-survivors 102.2 ± 19.5 μg/L compared with survivors 111.1 ± 16.9 μg/L |
| The Netherlands [99] | Prospective cross-sectional analysis during early gestation to determine the impact of Se status on the risk of preterm births | 1197 white Dutch women with a singleton pregnancy followed from 12 weeks’ gestation | Serum Se at 12 weeks’ gestation was significantly lower among women who had a preterm birth than among those who delivered at term mean 0.96 ± 0.14 μmol/L vs. 1.02 ± 0.13 μmol/L (* 75.80 ± 11.05 μg/L vs. * 80.54 ± 10.26 μg/L) |
| France [100] | The prospective, longitudinal Epidemiology of Vascular Ageing (EVA) study | 1389 subjects aged 59–71 years followed for 9 years | Mean baseline plasma Se was 1.08 ± 0.21 μmol/L (* 85.28 ± 16.58 μg/L) in men and 1.10 ± 0.20 μmol/L (* 86.86 ± 15.79 μg/L) in women |
| Italy, Slovenia, Croatia, Greece [101] | Prospective cohort with four recruitments areas to assess Se exposure due to fish consumption in the Mediterranean area | Various tissue samples from 900 Italian, 584 Slovenian, 234 Croatian and 484 Greek women | Mean Se concentrations: Italian mother’s blood 117 ng/g, Italian cord blood 113 ng/g Italian breast milk 18 ng/g; Slovenian cord blood 76 ng/g, Slovenian breast milk 17 ng/g; Croatian mother’s blood 90 ng/g, Croatian cord blood 96 ng/g, Croatian breast milk 18 ng/g; Greek cord blood 104 ng/g, Greek breast milk 21 ng/g; Italian urine 31 μg/g; Croatian urine 4 μg/g, Greek urine 24 μg/g |
| Country | Study Description | Subject Details/Number | Se Status by Body Compartment |
|---|---|---|---|
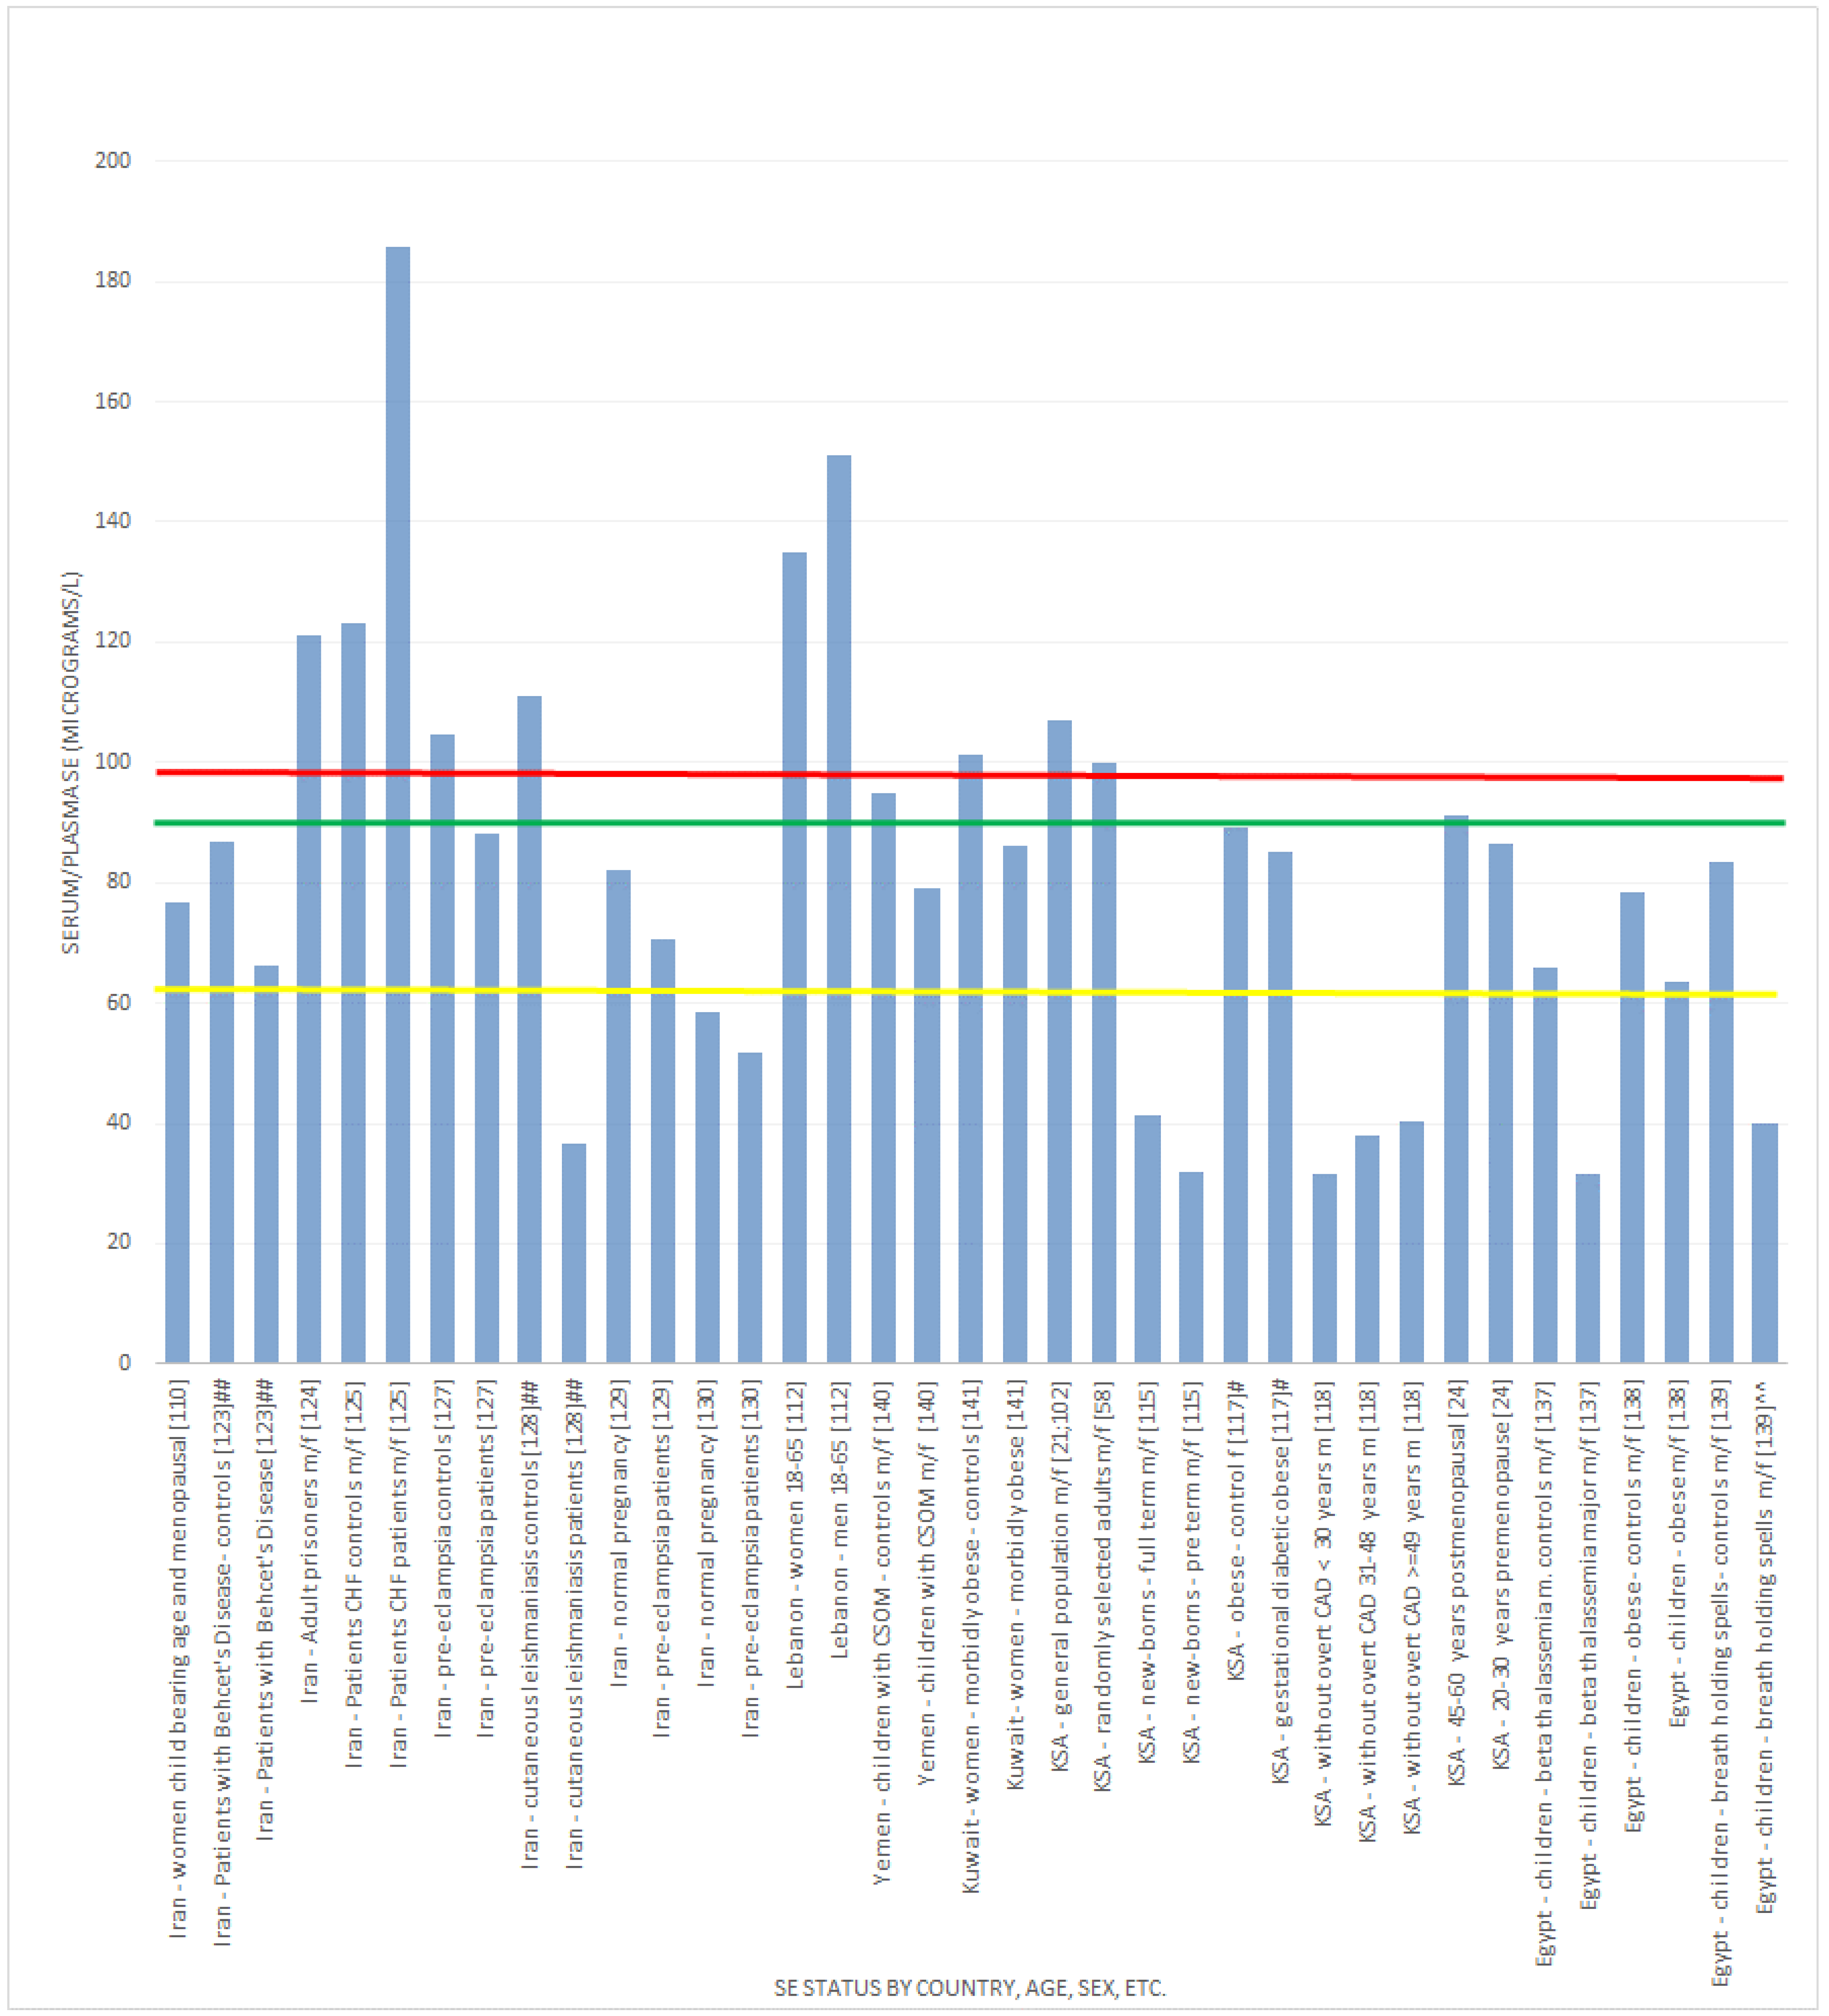
| KSA [21,102] | Cross-sectional analysis of Serum and toenail Se in the Al-Kharj district | Males and females 743 serum and 691 toenail samples | Mean serum Se: 107.045 ± 23.045 μg/L and toenail Se 0.634 ± 0.221 μg/g |
| Kuwait [22] | Cross-sectional analysis of Se and its chemical forms in the milk of Kuwaiti and Non-Kuwaiti lactating mothers | 34 donors (age 25 to 40 years) Kuwaitis n = 17, non-Kuwaitis n = 17 | Mean ± SD of milk Se (μg/L) 0–6-month lactation period were 20 ± 0.8 and 16 ± 0.4 in Kuwaiti and non-Kuwaiti women, respectively; mean ± SD of milk Se (μg/L) 6–12-month lactation period were 18 ± 0.4 and 15 ± 0.2 in Kuwaiti and non-Kuwaiti women, respectively; in both Kuwaiti and non-Kuwaiti women, the milk Se was significantly lower at the 6–12-month lactation period compared to the 0-6-month one (p < 0.05); in addition, Kuwaiti women had significantly higher milk Se levels during both the 0–6-month and 0–12-month lactation periods |
| Turkey [23] | Cross-sectional analysis of Se in mothers and their neonates using hair, breast milk, meconium and maternal and umbilical cord blood | 29 pairs of mothers and their new-born babies | Average Se concentrations in blood plasma: 68.5 ± 3.6 ng/g (~70 μg/L using density of blood plasma 1.025 g/mL) |
| Turkey [45] | Systematic review of trace elements in growth: iodine and Se status of Turkish children | Summary of a number of studies investigating Se status in children | 1989 study: 76 children aged 2 months–13 years had serum Se of 88 ± 12 μg/L; 1994 study: mean cord blood Se 45 ± 10 μg/L, 2–12 month infants 69 ± 13 μg/L, children >12 months and up to age 16 years 77 ± 12 μg/L; 1996 study: serum Se in boys of 75 ± 9 μg/L and in girls 65 ± 10 μg/L; 2001 study involving 250 children from 4 regions found average serum Se of 51–58 μg/L; a 2004 study of 43 healthy children had a mean serum Se of 74 ± 11 μg/L; a 2002 study in school children from an endemic goitre area 31 ± 23 μg/L; taking into account all of the available data, the estimated range for serum Se was ~50–70 μg/L |
| KSA [58] | Cross-sectional analysis of serum Se in randomly-selected, healthy, non-smoking adults | 140 men and 120 women | Mean serum Se was 100 ± 30.5 μg/L |
| Turkey [103] | Cross-sectional analysis of serum Se in healthy residents of different ages in Ankara | 218 healthy individuals at different ages; cord blood at birth; 2-month infants, 12-month infants; children from >12 months to 16 years; adults 18 to 48 years | Mean Se in cord blood at birth: 45 ± 10 μg/L; mean serum Se 2 months and 12 months: 69 ± 13 μg/L; children >12 to 16 years: 77 ± 12 μg/L; adults 18 to 48 years: 74 ± 16 μg/L |
| Turkey [104] | Cross-sectional, prospective study to evaluate serum Se in women with gestational diabetes mellitus, glucose intolerants and normal controls | 178 pregnant women undergoing 50-g oral glucose tolerance test (OGTT) between 24 and 28 weeks of gestation; age range 24–25 years | Group A (control, n = 101) mean serum Se 50 ± 9.8 μg/L; Group B (abnormal 50-g and abnormal 100-g OGTT, n = 30) mean serum Se 34.7 ± 8.7 μg/L; Group C (glucose intolerant (GIT), n = 49) mean serum Se level 39.9 ± 6.5 μg/L |
| Iran [105] | Cross-sectional analysis of serum Se in healthy individuals living in Tehran | 184 healthy inhabitants, male and female; 24 women (over 16 years) | Mean ± SD serum Se level was 93.9 ± 13.6 μg/L for women and 102.2 ± 12 μg/L for men. The intake in men was statistically significantly higher than in women p < 0.0005 |
| Iran [106] | Cross-sectional analysis of serum Se concentration in healthy children living in Tehran | Serum samples of 216 healthy children were analysed; age 0–16 years | Mean ± SD of serum Se (μg/L); <4 years (n = 67), male and female, 63.72 ± 20.29; ≥4 years (n = 149), male and female, 75.82 ± 13.42 |
| Iran [107] | Cross-sectional analysis of serum Se as a possible factor for persistent goitre in Iranian school children | Schoolchildren were assessed for serum Se concentration as part of an assessment for thyroid health; n = 1188 total; serum Se assessment n = 500; male and female | Mean ± SD of serum Se (μg/L); overall 119.1 ± 31; boys 108.4 ± 26.2; girls 127.7 ± 32.1; the difference between the sexes was statistically significant |
| Iran [108] | Cross-sectional analysis of serum Se in healthy volunteers living in Tehran | 60 females and 55 males living in Tehran; age 6–62 | Mean serum Se was 99.10 ± 21.78 μg/L; there was a significant difference between males and females (males 104.31 ± 24.70 μg/L and females 94.33 ± 17.6 μg/L (p < 0.05) |
| Iran [109] | Cross-sectional analysis of serum Se and glutathione peroxidase concentrations in Iranian patients with angiography-defined coronary artery disease (CAD) | 99 males and 53 females with CAD; 31 males and 30 females with normal angiogram; 37 male and 33 female healthy controls | Mean serum Se for the 3 groups was 1.118 ± 0.394 μmol/L (* 88.28 ± 31.11 μg/L), 1.123 ± 0.360 μmol/L (* 88.67 ± 28.43 μg/L) and 1.042 ± 0.364 μmol/L (* 82.28 ± 28.74 μg/L), respectively; serum Se was not significantly different between patients with or without CAD and the control group |
| Iran [110] | Cross-sectional analysis of Se in healthy women in Tabriz, Iran | 60 women of child bearing age and 60 post-menopausal women | Women of child-bearing age mean serum Se 77.72 ± 16.96 μg/L; post-menopausal mean serum Se 72.60 ± 19.08 μg/L; average serum Se was 76.67 ± 17.98 μg/L; no significant difference between age groups; 57.5% had serum Se concentrations under 80 μg/L |
| Iran [111] | Randomised, double-blind placebo-controlled trial in premature (pre-labour) rupture of membranes | 166 primigravid women within age range 16–35 years | Active participants: Serum Se 122.5 ± 23.2 μg/L; controls: 122.9 ± 26.9 μg/L; no significant difference between groups |
| Lebanon [112] | Cross-sectional analysis of Se and correlates with metabolic syndrome components | 159 men and 284 women; age 18–65 years from health centres across Lebanon | Mean ± SD plasma levels were: men 151.2 ± 25.7 μg/L; women 135.0 ± 24.4 μg/L; combined 141.5 ± 26.1 μg/L |
| Yemen [113] | Cross-sectional analysis of Se status in respiratory syncytial virus (RSV) and human metapneumovirus (HM) | 136 males and 36 females with RSV, median age 2 months; 28 male and 11 female children with HM, median age 7 months; 18 male and 6 female that were co-infected, median age 3 months | Se concentrations were low regardless of the virus identified, did not vary with C-reactive protein, and there was no association between the viruses and Se status |
| Jordan [114] | Cross-sectional analysis of Se in blood | Subjects: 73 total; 56 smokers; 17 non-smokers | Mean blood Se in smokers ranged from 0.269 mg/L (269 μg/L) to 0.368 mg/L (368 μg/L), with an average of 0.332 mg/L (332 μg/L); non-smokers mean blood Se ranged from 0.154 mg/L (154 μg/L) to 0.216 mg/L (216 μg/L), with an average of 0.187 mg/L (187 μg/L) |
| KSA [115] | Cross-sectional analysis of Se in blood and serum | New-borns of 300 women living in the Al-Kharj district | Mean umbilical cord blood Se levels were 40.8 ± 8.96 μg/L; serum Se in pre-term 32 ± 8.029 μg/L and full-term infants 41.323 ± 8.784 μg/L |
| KSA [116] | Cross-sectional analysis of Se in serum and toenails in the Al-Kharj district | 513 children | Only 1.4% of children had serum Se levels below 45 μg/L; however, 53.4% of the tested children had toenail Se below 56 μg/g |
| KSA [117] | Case-control study | 11 control obese >30 BMI and gestational diabetic obese >30 BMI | Serum Se concentrations for the obese control and diabetic groups were 89 μg/L and 85.1 μg/L, respectively |
| KSA [118] | Cross-sectional analysis to determine the relationship between Se, thyroid function and other coronary risk factors | 140 subjects without overt coronary heart disease stratified by age | Mean serum Se (μmol/L) was 0.4 in <30-year-olds (* 31.58 μg/L), 0.48 in 31–48 year olds (* 37.90 μg/L), 0.51 in ≥49 year olds (* 40.27 μg/L); mean urine Se (μmol/mol creatinine) was 1.48 in <30-year-olds, 1.29 in 31–48-year-olds, 1.07 in ≥49-year-olds |
| KSA [119] | Case-control study | 170 diabetics (19 type I and 151 type 2) with an equal number of controls | Mean (Standard error of mean (SEM)) urinary Se concentration was 0.394 (0.017) μM or (31.1 (1.3) μg/L) and mean (SEM) urinary Se/mol creatine concentration was 56 (2.9) μM or (39.1 (2) μg/g creatinine) |
| KSA [24] | Retrospective cohort, including previously reported indices of bone health and dietary Se intake and Se analysis (during 2010) of previously collected plasma and serum in Jeddah;Saudi Arabian Bone Health Study (SABHS) study [120]. | 42 Saudi postmenopausal (45–60 years) and 34 Saudi premenopausal (20–30 years) women living in Jeddah, KSA | Mean plasma or serum levels for postmenopausal 91.24 ± 15.54 μg/L and premenopausal 86.63 ± 10.52 μg/L |
| Iran [121] | Randomized, double-blind, placebo-controlled trial to examine the effect of prenatal Se on postpartum depression | 166 primigravid pregnant women in the first trimester of pregnancy | Baseline mean serum Se in the treatment group was 122.5 ± 23.2 μg/dL (1,225 ± 232 μg/L) and in the control group was 122.9 ± 26.9 μg/dL (1229 ± 269 μg/L) ** |
| Iran [122] | Case-control study to determine the relationship between serum Se and simple febrile seizures in children | 30 children with simple febrile seizures and 30 controls (febrile children without seizure) | Mean serum Se in the case and control groups was 44.4 ± 10.9 (444 ± 109 μg/L) and 63 ± 9.78 μg/dL (630 ± 97.8 μg/L), respectively ** |
| Iran [123] | Case-control study to evaluate the correlation of serum Se in patients with Behcet’s disease | 46 Behcet’s disease patients and 46 healthy controls | Mean serum Se of patients was 66.4 ± 15.38 μg/L, significantly lower than in the healthy controls (86.87 ± 17.18 μg/L) |
| Iran [124] | Cross-sectional analysis to determine the serum Se among prisoners in the central jail of Mashhad, northeast Iran | 435 prisoners (387 men (34.5 ± 10 years) and 48 women (36.4 ± 11 years)) | Mean serum Se was 121 ± 20 μg/L; the prevalence of Se deficiency was 9.7% in the selected sample and was more prevalent in women than men |
| Iran [125] | Case-control study to determine serum Se in congestive heart failure | 77 patients (68.4 ± 10.4 years old; 40.3% female) and 73 healthy volunteers (64.9 ± 4.7 years old; 35.6% female) | Mean serum Se patients 185.9 ± 781.2 μg/L; mean serum Se controls 123.3 ± 115.5 μg/L |
| Iran [126] | Case-control study to determine serum Se in pemphigus vulgaris patients | 43 newly-diagnosed pemphigus vulgaris patients and 58 healthy controls | Mean serum Se in patients 80.34 ± 1.55 μg/dL (803.40 ± 15.50 μg/L); in controls 92.85 ± 1.73 μg/dL (928.50 ± 17.30 μg/L) ** |
| Iran [127] | Case-control study to compare serum Se status in women with or without pre-eclampsia | 60 pre-eclampsia patients and 60 healthy subjects | Mean serum Se was 8.82 ± 2.10 μg/dL (88.20 ± 21.00 μg/L) in patients and 10.47 ± 2.78 μg/dL (104.70±27.80 μg/L) in controls |
| Iran [128] | Case-control study to determine serum Se in different forms of leishmaniasis | 95 patients with cutaneous leishmaniasis, 60 with visceral leishmaniasis and 100 controls | Mean serum Se was 3.65 ± 0.88 μg/dL (36.50 ± 8.80 μg/L) in leishmaniasis patients and 11.10 ± 2.37 μg/dL (111.00 ± 23.70 μg/L) in controls |
| Iran [129] | A nested case-control study to determine changes in plasma Se in women with preeclampsia compared to those with normal pregnancy | 38 women with preeclampsia and 38 women having a normal pregnancy | Mean plasma Se was 70.63 ± 21.41 μg/L in preeclampsia women and 82.03 ± 15.54 μg/L in women with normal pregnancy |
| Iran [130] | Case-control study to determine plasma Se in women with preeclampsia compared to those with normal pregnancy | 40 preeclamptic and 40 healthy pregnant women in 34–39th week of gestation | Mean plasma Se in preeclampsia women was 51.75 ± 11.62 μg/L and in controls was 58.51 ± 11.85 μg/L |
| Turkey [131] | Case-control study to evaluate the possible associations between serum Se and idiopathic intractable epilepsy | 70 idiopathic intractable epilepsy patients and 60 healthy matched children | Mean serum Se was 4.40 ± 1.75 μmol/L (* 347.42 μg/L ± 138.18) in epileptic and 5.77 ± 1.88 (* 455.60 ± 148.44 μg/L) in controls μmol/L ** |
| Turkey [132] | Case-control study to evaluate the effects of pica and iron-deficiency anaemia on oxidative stress and antioxidant capacity | 47 children with iron-deficiency anaemia plus pica, 22 children with iron-deficiency anaemia only and 21 non-anaemic children as controls | Mean serum Se was 57.5 + 11.2 μg/L in those with pica, 62 + 11 μg/L in those with iron-deficient anaemia only and 80.9 + 13.1 μg/L in controls |
| Turkey [133] | Case-control study to evaluate serum Se in relation with hyperandrogenism and insulin resistance in women with polycystic ovary syndrome (PCOS) | 36 cases with a diagnosis of PCOS and 33 age- and BMI-matched healthy women | Mean serum Se was 41.8 ± 1.8 μg/L in the PCOS women and 49.7 ± 1.6 μg/L in controls |
| Turkey [134] | Case-control study to investigate the plasma and erythrocyte Se in H1N1-infected children | 11 infected children (4 girls, 7 boys; mean age 9.3 ± 4.5 years) and 12 controls (6 girls, 6 boys; mean age 10.8 ± 2.6 years) | Mean plasma Se was 117.54 μg/L in infected children and 132.27 μg/L in controls; erythrocyte Se was 529.71 μg/L in infected children and 599.72 μg/L in controls |
| Turkey [135] | Case-control study aimed at investigating serum Se in postmenopausal women with osteoporosis and osteopenia | 37 osteopenic and 35 osteoporotic women and 35 healthy controls | Mean serum Se was 66.89 ± 15.52 μg/L in osteopenic, 66.16 ± 12.13 μg/L in osteoporotic and 67.12 ± 11.61 μg/L in control subjects |
| Turkey [136] | A case-control study to evaluate the serum and seminal plasma Se in men with idiopathic infertility | 44 patients with idiopathic male infertility and abnormal sperm parameters and 15 subjects with normal sperm parameters and proven fertility | Mean serum Se in μg/L was 138.1 ± 12.3 in normozoospermia, 81.9 ± 36.3 in oligozoospermia; mean semen Se in μg/L was: 81.4 ± 5.4 in normozoospermia, 33 ± 18.2 in oligozoospermia |
| Egypt [137] | A case-control study to estimate serum sein beta-thalassemia-major patients | 108 patients with beta-thalassemia-major and 60 age- and sex-matched healthy children | Mean serum Se was 31.5 ± 19.1 μg/L in cases and 65.9 ± 6.3 μg/L in controls |
| Egypt [138] | A case-control study to assess Se in obese children and the relationships with serum leptin and metabolic risk factors of obesity | 80 obese children (BMI ≥95th percentile for age and gender) and 80 healthy, age- and gender-matched, non-obese controls | Mean serum Se was 63.6 ± 15 μg/L in the obese compared to 78.3 ± 18 μg/L in controls |
| Egypt [139] | A case-control study to evaluate the oxidant-antioxidant status in children with breath-holding spells | 67 children with breath-holding spells (18 pallid and 49 cyanotic) were compared with 60 healthy children | Mean serum Se in μg/dL was 4.01 ± 2.62; in pallid (40.10 ± 26.20 μg/L) 3.98 ± 1.86; in cyanotic (39.80 ± 18.60 μg/L) 8.33 ± 2.16; in controls (83.30 ± 21.60 μg/L) |
| Yemen [140] | A case-control study to evaluate nutritional factors associated with chronic suppurative otitis media (CSOM) | 75 children with CSOM and 74 healthy controls | Mean serum Se was 1.0 μmol/L (* 78.96 μg/L) in cases and 1.2 μmol/L (* 94.75 μg/L) in controls |
| Kuwait [141] | A case-control study to compare serum Se in morbidly obese female patients seeking bariatric surgery with those of age-matched females with body mass index ≤30. | 66 morbidly obese female patients and 44 female controls | Mean serum Se was 86.08 μg/L in the obese group and 101.14 μg/L in the control group |
 , indicates concentration required to optimise plasma GPx activity according to Alfthan et al. (98.7 μg/L) [8]. The green line
  , indicates concentration required to optimise plasma GPx activity according to Duffield et al. (90.01 μg/L) [7]. The yellow line
  , indicates concentration required to optimise plasma GPx activity according to the WHO (63.16 μg/L) [61]
, indicates concentration required to optimise plasma GPx activity according to Alfthan et al. (98.7 μg/L) [8]. The green line , indicates concentration required to optimise plasma GPx activity according to Duffield et al. (90.01 μg/L) [7]. The yellow line , indicates concentration required to optimise plasma GPx activity according to the WHO (63.16 μg/L) [61]
, indicates concentration required to optimise plasma GPx activity according to the WHO (63.16 μg/L) [61]
, indicates concentration required to optimise plasma GPx activity according to Alfthan et al. (98.7 μg/L) [8]. The green line , indicates concentration required to optimise plasma GPx activity according to Duffield et al. (90.01 μg/L) [7]. The yellow line , indicates concentration required to optimise plasma GPx activity according to the WHO (63.16 μg/L) [61]
 , indicates concentration required to optimise plasma GPx activity according to Alfthan et al. (98.7 μg/L) [8]. The green line , indicates concentration required to optimise plasma GPx activity according to Duffield et al. (90.01 μg/L) [7]. The yellow line , indicates concentration required to optimise plasma GPx activity according to the WHO (63.16 μg/L) [61].
, indicates concentration required to optimise plasma GPx activity according to Alfthan et al. (98.7 μg/L) [8]. The green line , indicates concentration required to optimise plasma GPx activity according to Duffield et al. (90.01 μg/L) [7]. The yellow line , indicates concentration required to optimise plasma GPx activity according to the WHO (63.16 μg/L) [61].
, indicates concentration required to optimise plasma GPx activity according to Alfthan et al. (98.7 μg/L) [8]. The green line , indicates concentration required to optimise plasma GPx activity according to Duffield et al. (90.01 μg/L) [7]. The yellow line , indicates concentration required to optimise plasma GPx activity according to the WHO (63.16 μg/L) [61].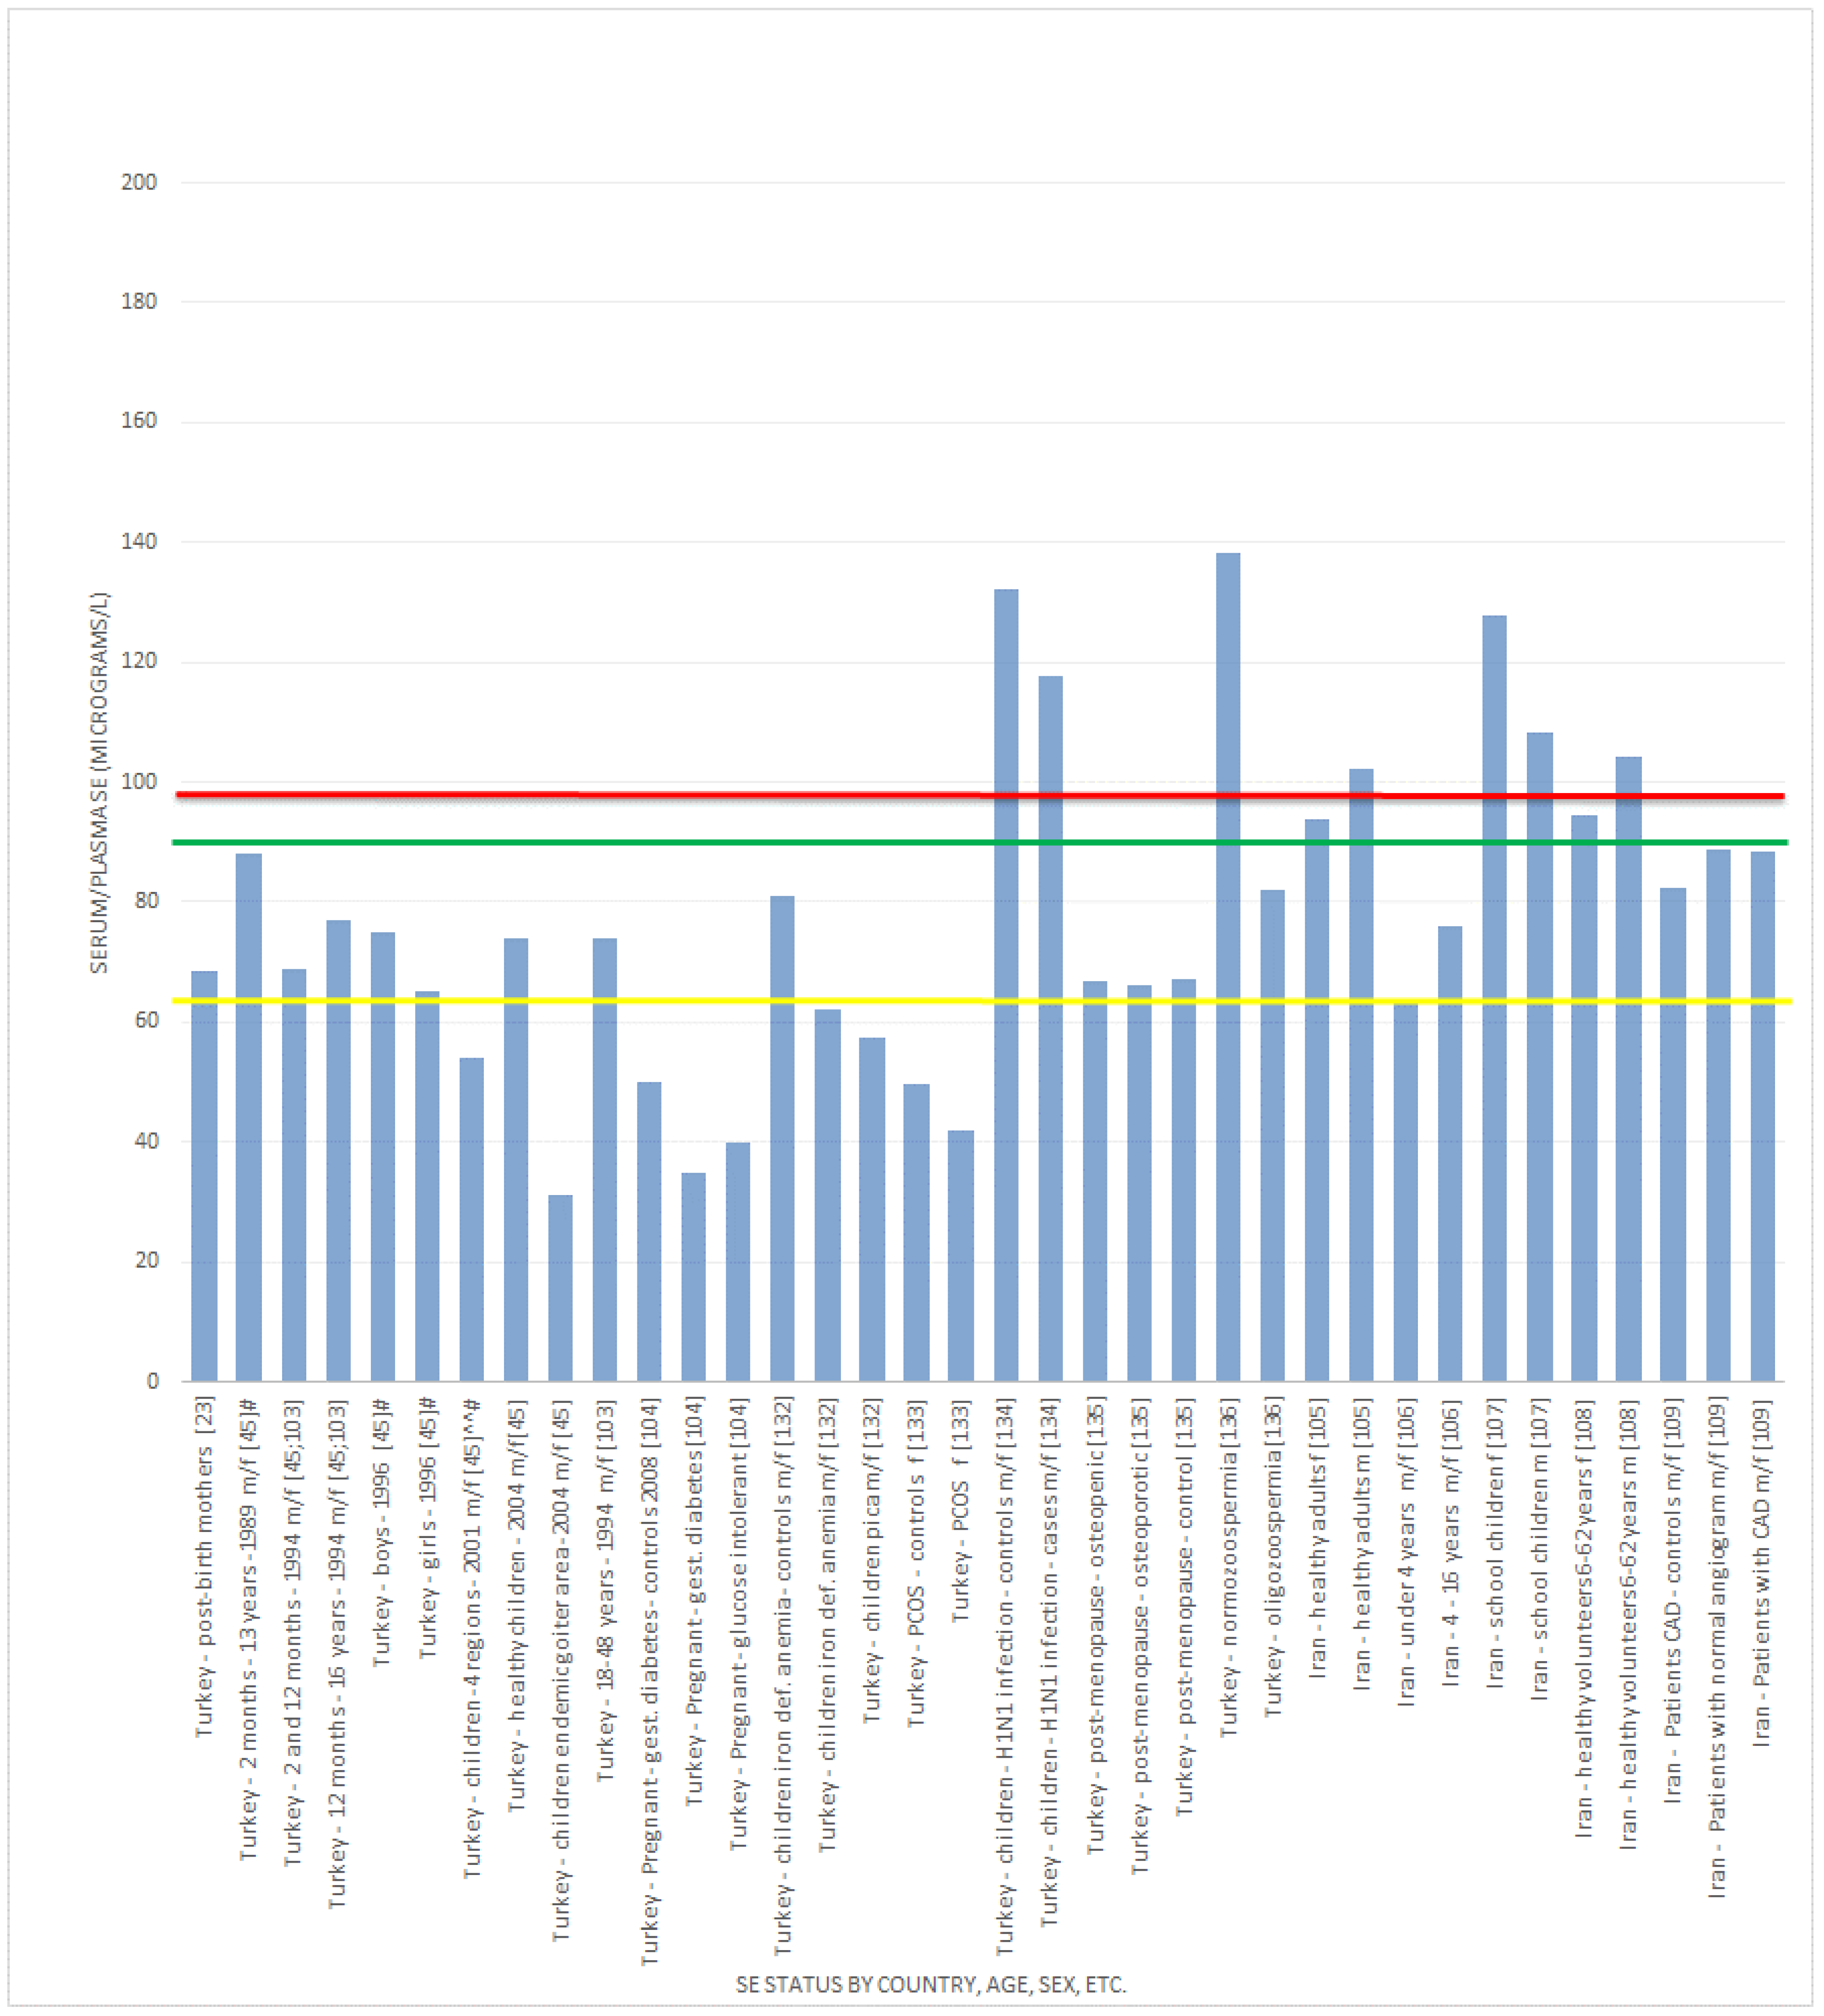

3.2.1. Selenium Status Studies: European Countries/UK
3.2.2. Selenium Status Studies: Middle Eastern Countries
4. Discussion
5. Conclusions
Acknowledgments
Author Contributions
Conflicts of Interest
References
- Combs, G.F. Selenium in global food systems. Br. J. Nutr. 2001, 85, 517–547. [Google Scholar] [CrossRef] [PubMed]
- Rayman, M.P. The argument for increasing selenium intake. Proc. Nutr. Soc. 2002, 61, 203–215. [Google Scholar] [CrossRef] [PubMed]
- Surai, P. Selenium in food and feed: Selenomethionine and beyond. In Selenium in Nutrition and Health; Nottingham University Press: Nottingham, UK, 2006; pp. 151–212. [Google Scholar]
- Sunde, R.A. Selenium. In Present Knowldege in Nutrition, 8th ed.; Bowman, B., Russel, R., Eds.; ILSI Press: Washington, DC, USA, 2001; p. 361. [Google Scholar]
- Rayman, M.P.; Thompson, A.J.; Bekaert, B.; Catterick, J.; Galassini, R.; Hall, E.; Warren-Perry, M.; Beckett, G.J. Randomised controlled trial of the effect of selenium supplementation on thyroid function in the elderly in the United Kingdom. Am. J. Clin. Nutr. 2008, 87, 370–378. [Google Scholar] [PubMed]
- Elsom, R.; Sanderson, P.; Hesketh, J.E.; Jackson, M.J.; Fairweather-Tait, S.J.; Akesson, B.; Handy, J.; Arthur, J.R. Functional markers of selenium status: UK Food Standards Agency Workshop Report. Br. J. Nutr. 2006, 96, 980–984. [Google Scholar] [CrossRef] [PubMed]
- Duffield, A.J.; Thomson, C.D.; Hill, K.E.; Williams, S. An estimation of selenium requirements for New Zealanders. Am. J. Clin. Nutr. 1999, 70, 896–903. [Google Scholar] [PubMed]
- Alfthan, G.; Aro, A.; Arvilommi, H.; Huttunen, J.K. Selenium metabolism and platelet glutathione peroxidase activity in healthy Finnish men: Effects of selenium yeast, selenite, and selenate. Am. J. Clin. Nutr. 1991, 53, 120–125. [Google Scholar] [PubMed]
- Scientific Opinion on Dietary Reference Values for Selenium. EFSA Panel on Dietetic Products, Nutrition and Allergies (NDA). Available online: http://www.efsa.europa.eu/en/efsajournal/doc/3846.pdf (accessed on 27 November 2014).
- Rayman, M.P. Selenium and human health. Lancet 2012, 397, 1256–1268. [Google Scholar] [CrossRef]
- Ebert, R.; Ulmer, M.; Zeck, S.; Meissner-Weig, J.; Schneider, D.; Stopper, H.; Schupp, N.; Kassem, M.; Jakob, F. Selenium supplementation restores the antioxidative capacity and prevents cell damage in bone marrow stromal cells in vitro. Stem Cells 2006, 24, 1226–1235. [Google Scholar] [CrossRef] [PubMed]
- Moreno-Reyes, R.; Egrise, D.; Nève, J.; Pasteels, J.L.; Schoutens, A. Selenium deficiency—Induced growth retardation is associated with an impaired bone metabolism and osteopenia. J. Bone Miner. Res. 2001, 16, 1556–1563. [Google Scholar] [CrossRef] [PubMed]
- Bianco, P.; Riminucci, M.; Gronthos, S.; Robey, P.G. Bone marrow stromal stem cells: Nature, biology, and potential applications. Stem Cells 2001, 19, 180–192. [Google Scholar] [CrossRef] [PubMed]
- Dreher, I.; Schütze, N.; Baur, A.; Hesse, K.; Schneider, D.; Köhrle, J.; Jakob, F. Selenoproteins are expressed in fetal human osteoblast-like cells. Biochem. Biophys. Res. Commun. 1998, 245, 101–107. [Google Scholar] [CrossRef]
- Rayman, M.P.; Infante, H.G.; Sargent, M. Food-chain selenium and human health: Spotlight on speciation. Br. J. Nutr. 2008, 100, 238–253. [Google Scholar] [PubMed]
- Institute of Medicine. Dietary Reference Intakes for Vitamin C, Vitamin E, Selenium and Carotenoids; National Academy Press: Washington, DC, USA, 2000; p. 7. [Google Scholar]
- Whanger, P.D. Selenium and its relationship to cancer: An update. Br. J. Nutr. 2004, 91, 11–28. [Google Scholar] [CrossRef] [PubMed]
- Department of Health. Dietary reference values for food, energy and nutrients for the UK: Report of the panel on dietary reference values of the committee on medical aspects of food policy, 8th ed.Stationery Office: London, UK, 1991; pp. 1–210. [Google Scholar]
- Joint Food Safety and Standards Group. Food Surveillance Information Sheet No. 126; Joint Food Safety and Standards Group; Ministry of Agriculture, Fisheries, and Food: London, UK, 1997; p. 58. [Google Scholar]
- Darling, A.; Bath, S.; Hakim, O.; Stoffaneller, R.; Rayman, M.P.; Lanham-New, S.A. Selenium intakes in UK South Asian and Caucasian women: A longitudinal analysis. Oral presentation. In Proceedings of the Nutrition Society Summer Meeting, Edinburgh, UK, 29 June–2 July 2010.
- Al-Saleh, I.; El-Doush, I.; Billedo, G.; Mohamed, G.E.; Yosef, G. Status of selenium, vitamin E, and vitamin A among Saudi adults: Potential links with common endemic diseases. J. Environ. Pathol. Toxicol. Oncol. 2007, 26, 221–243. [Google Scholar] [CrossRef] [PubMed]
- Al-Awadi, F.M.; Srikumar, T.S. Determination of selenium concentration and its chemical forms in the milk of Kuwaiti and non-Kuwaiti lactating mothers. J. Trace Elem. Exp. Med. 2001, 14, 57–67. [Google Scholar] [CrossRef]
- Ozdemir, H.; Karadas, F.; Pappas, A.C.; Cassey, P.; Oto, G.; Tuncer, O. The selenium levels of mothers and their neonates using hair, breast milk, meconium, and maternal and umbilical cord blood in Van Basin. Biol. Trace Elem. Res. 2008, 122, 206–215. [Google Scholar] [CrossRef] [PubMed]
- Stoffaneller, R.; Morse, N.; Research consultant to Wassen International Ltd, Wakefield, UK. Unpublished work. 2015.
- Skibniewska, K.A.; Dymkowska-Malesa, M.; Siwik, P.; Kot, A.; Jabłońska, E. Nutritive value of Olsztyn University student’s diet. Prz. Lek. 2007, 64, 15–18. [Google Scholar] [PubMed]
- González, S.; Huerta, J.M.; Fernández, S.; Patterson, E.M.; Lasheras, C. Food intake and serum selenium concentration in elderly people. Ann. Nutr. Metab. 2006, 50, 126–131. [Google Scholar] [CrossRef] [PubMed]
- Navia, B.; Ortega, R.M.; Perea, J.M.; Aparicio, A.; López-Sobaler, A.M.; Rodríguez-Rodríguez, E. Research Group: UCM 920030 (VALORNUT). Selenium status in a group of schoolchildren from the region of Madrid, Spain. J. Hum. Nutr. Diet. 2014, 27, 239–246. [Google Scholar] [CrossRef] [PubMed]
- Jiménez-Redondo, S.; Beltrán de Miguel, B.; Gómez-Pavón, J.; Cuadrado Vives, C. Non-institutionalized nonagenarians health-related quality of life and nutritional status: Is there a link between them? Nutr. Hosp. 2014, 30, 602–608. [Google Scholar] [CrossRef] [PubMed]
- Jiménez-Redondo, S.; Beltrán de Miguel, B.; Gavidia Banegas, J.; Guzmán Mercedes, L.; Gómez-Pavón, J.; Cuadrado Vives, C. Influence of nutritional status on health-related quality of life of non-institutionalized older people. J. Nutr. Health Aging 2014, 18, 359–364. [Google Scholar] [CrossRef] [PubMed]
- Rivas, A.; Romero, A.; Mariscal-Arcas, M.; Monteagudo, C.; López, G.; Lorenzo, M.L.; Ocaña-Peinado, F.; Olea-Serrano, F. Association between dietary antioxidant quality score (DAQs) and bone mineral density in Spanish women. Nutr. Hosp. 2012, 27, 1886–1893. [Google Scholar] [PubMed]
- Emmanuelle, B.; Virginie, M.; Fabienne, S.; Isabelle, I.; Martine, P.G.; Bernard, L.; Sylvie, R. Selenium exposure in subjects living in areas with high selenium concentrated drinking water: Results of a French integrated exposure assessment survey. Environ. Int. 2012, 40, 155–161. [Google Scholar] [CrossRef] [PubMed]
- Waegeneers, N.; Thiry, C.; de Temmerman, L.; Ruttens, A. Predicted dietary intake of selenium by the general adult population in Belgium. Food Addit. Contam. Part A Chem. Anal. Control Expo. Risk Assess. 2013, 30, 278–285. [Google Scholar] [PubMed]
- Pograjc, L.; Stibilj, V.; Falnoga, I. Impact of intensive physical activity on selenium status. Biol. Trace Elem. Res. 2012, 145, 291–299. [Google Scholar] [CrossRef] [PubMed]
- Valent, F.; Horvat, M.; Mazej, D.; Stibilj, V.; Barbone, F. Maternal diet and selenium concentration in human milk from an Italian population. J. Epidemiol. 2011, 21, 285–292. [Google Scholar] [CrossRef] [PubMed]
- Bossola, M.; di Stasio, E.; Viola, A.; Leo, A.; Carlomagno, G.; Monteburini, T.; Cenerelli, S.; Santarelli, S.; Boggi, R.; Miggiano, G.; et al. Dietary intake of trace elements, minerals, and vitamins of patients on chronic hemodialysis. Int. Urol. Nephrol. 2014, 46, 809–815. [Google Scholar] [CrossRef] [PubMed]
- National Diet and Nutrition Survey: Headline Results from Years 1, 2 and 3 (combined) of the Rolling Programme (2008/2009–2010/2011). Available online: http://www.natcen.ac.uk/media/175123/national-diet-and-nutrition-survey-years-1-2-and-3.pdf (accessed on 11 December 2014).
- Sunde, R.A.; Paterson, E.; Evenson, J.K.; Barnes, K.M.; Lovegrove, J.A.; Gordon, M.H. Longitudinal selenium status in healthy British adults: Assessment using biochemical and molecular biomarkers. Br. J. Nutr. 2008, 99, 37–47. [Google Scholar] [PubMed]
- Hughes, C.M.; Woodside, J.V.; McGartland, C.; Roberts, M.J.; Nicholls, D.P.; McKeown, P.P. Nutritional intake and oxidative stress in chronic heart failure. Nutr. Metab. Cardiovasc. Dis. 2012, 22, 376–382. [Google Scholar] [CrossRef] [PubMed] [Green Version]
- Young, N.J.; Metcalfe, C.; Gunnell, D.; Rowlands, M.A.; Lane, J.A.; Gilbert, R.; Avery, K.N.; Davis, M.; Neal, D.E.; Hamdy, F.C. A cross-sectional analysis of the association between diet and insulin-like growth factor (IGF)-I, IGF-II, IGF-binding protein (IGFBP)-2, and IGFBP-3 in men in the United Kingdom. Cancer Causes Control 2012, 23, 907–917. [Google Scholar] [CrossRef] [PubMed]
- Vissers, P.A.; Streppel, M.T.; Feskens, E.J.; de Groot, L.C. The contribution of dairy products to micronutrient intake in the Netherlands. J. Am. Coll. Nutr. 2011, 30, 415S–421S. [Google Scholar] [CrossRef] [PubMed]
- Stranges, S.; Sieri, S.; Vinceti, M.; Grioni, S.; Guallar, E.; Laclaustra, M.; Muti, P.; Berrino, F.; Krogh, V. A prospective study of dietary selenium intake and risk of type 2 diabetes. BMC Public Health 2010, 10, 564. [Google Scholar] [CrossRef] [PubMed]
- Ortega, R.M.; Rodríguez-Rodríguez, E.; Aparicio, A.; Jiménez-Ortega, A.I.; Palmeros, C.; Perea, J.M.; Navia, B.; López-Sobaler, A.M. Young children with excess of weight show an impaired selenium status. Int. J. Vitam. Nutr. Res. 2012, 82, 121–129. [Google Scholar] [CrossRef] [PubMed]
- Vinceti, M.; Crespi, C.M.; Malagoli, C.; Bottecchi, I.; Ferrari, A.; Sieri, S.; Krogh, V.; Alber, D.; Bergomi, M.; Seidenari, S.; et al. A case-control study of the risk of cutaneous melanoma associated with three selenium exposure indicators. Tumori 2012, 98, 287–295. [Google Scholar] [PubMed]
- Yanardağ, R.; Orak, H. Selenium content of milk and milk products of Turkey. II. Biol. Trace Elem. Res. 1999, 68, 79–95. [Google Scholar] [CrossRef]
- Hincal, F. Trace elements in growth: Iodine and selenium status of Turkish children. J. Trace Elem. Med. Biol. 2007, 21, 40–43. [Google Scholar] [PubMed]
- Ayar, A.; Sert, D.; Akin, N. The trace metal levels in milk and dairy products consumed in middle Anatolia-Turkey. Environ. Monit. Assess. 2009, 152, 1–12. [Google Scholar] [CrossRef] [PubMed]
- Kuisi, M.A.; Abdel-Fattah, A. Groundwater vulnerability to selenium in semi-arid environments: Amman Zarqa Basin, Jordan. Environ. Geochem. Health 2010, 32, 107–128. [Google Scholar] [CrossRef] [PubMed]
- Al-Saleh, I.; Al-Jaloud, A.; Al-Doush, I.; El-Din, G. The distribution of selenium levels in Saudi dairy farms: A preliminary report from Al-Kharj. J. Environ. Pathol. Toxicol. Oncol. 1999, 18, 37–46. [Google Scholar] [PubMed]
- Al-Ahmary, K.M. Selenium content in selected foods from the Saudi Arabian market and estimation of the daily intake. Arabian J. Chem. 2009, 2, 95–99. [Google Scholar] [CrossRef]
- Al-Saleh, I.; Al-Doush, I. Selenium levels in infant milk formula. Biometals 1997, 10, 299–302. [Google Scholar] [CrossRef] [PubMed]
- Al-Saleh, I. Selenium status in Saudi Arabia. J. Trace Elem. Med. Biol. 2000, 14, 154–160. [Google Scholar] [CrossRef] [PubMed]
- Al-Saleh, I.; Al-Doush, I.; Faris, R. Selenium levels in breast milk and cow’s milk: A preliminary report from Saudi Arabia. J. Environ. Pathol. Toxicol. Oncol. 1997, 16, 41–46. [Google Scholar] [PubMed]
- Arafa, M.A.; Waly, M.I.; Jriesat, S.; al Khafajei, A.; Sallam, S. Dietary and lifestyle characteristics of colorectal cancer in Jordan: A case-control study. Asian Pac. J. Cancer Prev. 2011, 12, 1931–1936. [Google Scholar] [PubMed]
- Mirzaeian, S.; Ghiasvand, R.; Sadeghian, F.; Sheikhi, M.; Khosravi, Z.S.; Askari, G.; Shiranian, A.; Yadegarfar, G. Assessing the micronutrient and macronutrient intakes in female students and comparing them with the set standard values. J. Educ. Health Promot. 2013, 2, 1. [Google Scholar] [CrossRef] [PubMed]
- Darvishi, L.; Ghiasvand, R.; Ashrafi, M.; Ashrafzadeh, E.; Askari, G.; Shiranian, A.; Hasanzadeh, A. Relationship between junk foods intake and weight in 6–7 years old children, Shahin Shahr and Meymeh, Iran. J. Educ. Health Promot. 2013, 2, 2. [Google Scholar] [CrossRef] [PubMed]
- Nazeminezhad, R.; Tajfard, M.; Latiff, L.A.; Mouhebati, M.; Esmaeily, H.; Ferns, G.A.; Ghayour-Mobarhan, M.; Rahimi, H.R. Dietary intake of patients with angiographically defined coronary artery disease and that of healthy controls in Iran. Eur. J. Clin. Nutr. 2014, 68, 109–113. [Google Scholar] [CrossRef] [PubMed]
- Jessri, M.; Rashidkhani, B.; Hajizadeh, B.; Jessri, M.; Gotay, C. Macronutrients, vitamins and minerals intake and risk of esophageal squamous cell carcinoma: A case-control study in Iran. Nutr. J. 2011, 10, 1–15. [Google Scholar] [CrossRef] [PubMed]
- Al-Othman, A.M.; Al-Othman, Z.A.; El-Desoky, G.E.; Aboul-Soud, M.A.; Habila, M.A.; Giesy, J.P. Daily intake of selenium and concentrations in blood of residents of Riyadh City, Saudi Arabia. Environ. Geochem. Health 2012, 34, 417–431. [Google Scholar] [CrossRef] [PubMed]
- Mansour, A.; Ahadi, Z.; Qorbani, M.; Hosseini, S. Association between dietary intake and seasonal variations in postmenopausal women. J. Diabetes Metab. Disord. 2014, 13, 1–6. [Google Scholar] [CrossRef] [PubMed]
- Lanham-New, S.; (Department of Nutritional Sciences at University of Surrey, Guildford, UK); Stoffaneller, R.; (Wassen International Ltd., Wakefield, WF4 3DB, UK). Personal Communication, 2010.
- Joint FAO/WHO Expert Consultation. Vitamin and Mineral Requirement in Human Nutrition: Selenium, 2nd ed.; World Health Organization: Geneva, Switzerland, 2004; pp. 194–216. [Google Scholar]
- Schulpis, K.H.; Karakonstantakis, T.; Gavrili, S.; Chronopoulou, G.; Karikas, G.A.; Vlachos, G.; Papassotiriou, I. Maternal-neonatal serum selenium and copper levels in Greeks and Albanians. Eur. J. Clin. Nutr. 2004, 58, 1314–1318. [Google Scholar] [CrossRef] [PubMed]
- Lopes, P.A.; Santos, M.C.; Vicente, L.; Rodrigues, M.O.; Pavão, M.L.; Nève, J.; Viegas-Crespo, A.M. Trace element status (Se, Cu, Zn) in healthy Portuguese subjects of Lisbon population: A reference study. Biol. Trace Elem. Res. 2004, 101, 1–17. [Google Scholar] [CrossRef] [PubMed]
- Galan, P.; Viteri, F.E.; Bertrais, S.; Czernichow, S.; Faure, H.; Arnaud, J.; Ruffieux, D.; Chenal, S.; Arnault, N.; Favier, A.; et al. Serum concentrations of betacarotene, vitamins C and E, zinc and selenium are influenced by sex, age, diet, smoking status, alcohol consumption and corpulence in a general French adult population. Eur. J. Clin. Nutr. 2005, 59, 1181–1190. [Google Scholar] [CrossRef] [PubMed]
- Wolters, M.; Hermann, S.; Golf, S.; Katz, N.; Hahn, A. Selenium and antioxidant vitamin status of elderly German women. Eur. J. Clin. Nutr. 2006, 60, 85–91. [Google Scholar] [CrossRef]
- Kvícala, J.; Jiránek, V.; Nmecek, J.; Cerovská, J.; Dvoráková, M.; Bílek, R. Selenium deficiency of west Bohemia population. Vnitr. Lek. 2006, 52, 873–880. [Google Scholar] [PubMed]
- Allen, N.E.; Appleby, P.N.; Roddam, A.W.; Tjønneland, A.; Johnsen, N.F.; Overvad, K.; Boeing, H.; Weikert, S.; Kaaks, R.; Linseisen, J.; et al. Plasma selenium concentration and prostate cancer risk: Results from the European Prospective Investigation into Cancer and Nutrition (EPIC). Am. J. Clin. Nutr. 2008, 88, 1567–1575. [Google Scholar] [CrossRef] [PubMed]
- Rauhamaa, P.; Kantola, M.; Viitak, A.; Kaasik, T.; Mussalo-Rauhamaa, H. Selenium levels of Estonians. Eur. J. Clin. Nutr. 2008, 62, 1075–1078. [Google Scholar] [CrossRef] [PubMed]
- Rasmussen, L.B.; Hollenbach, B.; Laurberg, P.; Carlé, A.; Hög, A.; Jørgensen, T.; Vejbjerg, P.; Ovesen, L.; Schomburg, L. Serum selenium and selenoprotein P status in adult Danes—8-year follow up. J. Trace Elem. Med. Biol. 2009, 23, 265–271. [Google Scholar] [CrossRef] [PubMed]
- Marriott, L.D.; Foote, K.D.; Kimber, A.C.; Delves, H.T.; Morgan, J.B. Zinc, copper, selenium and manganese blood levels in preterm infants. Arch. Dis. Child. Fetal Neonatal Ed. 2007, 92, F494–F497. [Google Scholar] [CrossRef] [PubMed]
- Bates, C.J.; Thane, C.W.; Prentice, A.; Delves, H.T. Selenium status and its correlates in a British National Diet and Nutrition Survey: People aged 65 years and over. J. Trace Elem. Med. Biol. 2002, 16, 1–8. [Google Scholar] [CrossRef]
- Berthold, H.K.; Michalke, B.; Krone, W.; Guallar, E.; Gouni-Berthold, I. Influence of serum selenium concentrations on hypertension: The Lipid Analytic Cologne cross-sectional study. J. Hypertens. 2012, 30, 1328–1335. [Google Scholar] [CrossRef] [PubMed]
- Hoeg, A.; Gogakos, A.; Murphy, E.; Mueller, S.; Köhrle, J.; Reid, D.M.; Glüer, C.C.; Felsenberg, D.; Roux, C.; Eastell, R.; et al. Bone turnover and bone mineral density are independently related to selenium status in healthy euthyroid postmenopausal women. J. Clin. Endocrinol. Metab. 2012, 97, 4061–4070. [Google Scholar] [CrossRef]
- Steevens, J.; Schouten, L.J.; Driessen, A.; Huysentruyt, C.J.; Keulemans, Y.C.; Goldbohm, R.A.; van den Brandt, P.A. Toenail selenium status and the risk of Barrett’s esophagus: The Netherlands Cohort Study. Cancer Causes Control 2010, 21, 2259–2268. [Google Scholar] [CrossRef]
- Suadicani, P.; Hein, H.O.; Gyntelberg, F. Serum selenium level and risk of lung cancer mortality: A 16-year follow-up of the Copenhagen Male Study. Eur. Respir. J. 2012, 39, 1443–1448. [Google Scholar] [CrossRef] [PubMed]
- Rayman, M.P.; Searle, E.; Kelly, L.; Johnsen, S.; Bodman-Smith, K.; Bath, S.C.; Mao, J.; Redman, C.W. Effect of selenium on markers of risk of pre-eclampsia in UK pregnant women: A randomised, controlled pilot trial. Br. J. Nutr. 2014, 112, 99–111. [Google Scholar] [CrossRef] [PubMed]
- Spina, A.; Guallar, E.; Rayman, M.P.; Tigbe, W.; Kandala, N.B.; Stranges, S. Anthropometric indices and selenium status in British adults: The UK National Diet and Nutrition Survey. Free Radic. Biol. Med. 2013, 65, 1315–1321. [Google Scholar] [CrossRef] [PubMed]
- Rayman, M.P.; Blundell-Pound, G.; Pastor-Barriuso, R.; Guallar, E.; Steinbrenner, H.; Stranges, S. A randomized trial of selenium supplementation and risk of type-2 diabetes, as assessed by plasma adiponectin. PLoS One 2012, 7, e45269. [Google Scholar] [CrossRef] [PubMed]
- Mistry, H.D.; Kurlak, L.O.; Young, S.D.; Briley, A.L.; Pipkin, F.B.; Baker, P.N.; Poston, L. Maternal selenium, copper and zinc concentrations in pregnancy associated with small-for-gestational-age infants. Matern. Child Nutr. 2014, 10, 327–334. [Google Scholar] [CrossRef] [PubMed]
- Goldson, A.J.; Fairweather-Tait, S.J.; Armah, C.N.; Bao, Y.; Broadley, M.R.; Dainty, J.R.; Furniss, C.; Hart, D.J.; Teucher, B.; Hurst, R. Effects of selenium supplementation on selenoprotein gene expression and response to influenza vaccine challenge: A randomised controlled trial. PLoS One 2011, 6, e14771. [Google Scholar] [CrossRef] [PubMed]
- Stranges, S.; Laclaustra, M.; Ji, C.; Cappuccio, F.P.; Navas-Acien, A.; Ordovas, J.M.; Rayman, M.; Guallar, E. Higher selenium status is associated with adverse blood lipid profile in British adults. J. Nutr. 2010, 140, 81–87. [Google Scholar] [CrossRef] [PubMed]
- Rayman, M.P.; Stranges, S.; Griffin, B.A.; Pastor-Barriuso, R.; Guallar, E. Effect of supplementation with high-selenium yeast on plasma lipids: A randomized trial. Ann. Intern. Med. 2011, 17, 656–665. [Google Scholar] [CrossRef]
- Stranges, S.; Tabák, A.G.; Guallar, E.; Rayman, M.P.; Akbaraly, T.N.; Laclaustra, M.; Alfthan, G.; Mussalo-Rauhamaa, H.; Viikari, J.S.; Raitakari, O.T.; et al. Selenium status and blood lipids: The cardiovascular risk in Young Finns study. J. Intern. Med. 2011, 270, 469–477. [Google Scholar] [CrossRef] [PubMed]
- Arnaud, J.; de Lorgeril, M.; Akbaraly, T.; Salen, P.; Arnout, J.; Cappuccio, F.P.; van Dongen, M.C.; Donati, M.B.; Krogh, V.; Siani, A.; et al. Gender differences in copper, zinc and selenium status in diabetic-free metabolic syndrome European population—The IMMIDIET study. Nutr. Metab. Cardiovasc. Dis. 2012, 22, 517–524. [Google Scholar] [CrossRef] [PubMed]
- Socha, K.; Kochanowicz, J.; Karpińska, E.; Soroczyńska, J.; Jakoniuk, M.; Mariak, Z.; Borawska, M.H. Dietary habits and selenium, glutathione peroxidase and total antioxidant status in the serum of patients with relapsing-remitting multiple sclerosis. Nutr. J. 2014, 13, 1–6. [Google Scholar] [CrossRef] [PubMed]
- Błażewicz, A.; Klatka, M.; Astel, A.; Korona-Glowniak, I.; Dolliver, W.; Szwerc, W.; Kocjan, R. Serum and urinary selenium levels in obese children: A cross-sectional study. J. Trace Elem. Med. Biol. 2015, 29, 116–122. [Google Scholar] [CrossRef] [PubMed]
- Salmonowicz, B.; Krzystek-Korpacka, M.; Noczyńska, A. Trace elements, magnesium, and the efficacy of antioxidant systems in children with type 1 diabetes mellitus and in their siblings. Adv. Clin. Exp. Med. 2014, 23, 259–268. [Google Scholar] [CrossRef] [PubMed]
- Jaworska, K.; Gupta, S.; Durda, K.; Muszyńska, M.; Sukiennicki, G.; Jaworowska, E.; Grodzki, T.; Sulikowski, M.; Waloszczyk, P.; Wójcik, J.; et al. A low selenium level is associated with lung and laryngeal cancers. PLoS One 2013, 8, e59051. [Google Scholar] [CrossRef] [PubMed]
- Wimmer, I.; Hartmann, T.; Brustbauer, R.; Minear, G.; Dam, K. Selenium levels in patients with autoimmune thyroiditis and controls in lower Austria. Horm. Metab. Res. 2014, 46, 707–709. [Google Scholar] [CrossRef] [PubMed]
- Alfthan, G.; Eurola, M.; Ekholm, P.; Venäläinen, E.R.; Root, T.; Korkalainen, K.; Hartikainen, H.; Salminen, P.; Hietaniemi, V.; Aspila, P.; et al. Effects of nationwide addition of selenium to fertilizers on foods, and animal and human health in Finland: From deficiency to optimal selenium status of the population. J. Trace Elem. Med. Biol. 2014. [Google Scholar] [CrossRef]
- Blass, S.C.; Goost, H.; Burger, C.; Tolba, R.H.; Stoffel-Wagner, B.; Stehle, P.; Ellinger, S. Extracellular micronutrient levels and pro-/antioxidant status in trauma patients with wound healing disorders: Results of a cross-sectional study. Nutr. J. 2013, 12, 1–7. [Google Scholar] [CrossRef] [PubMed]
- Stoppe, C.; Spillner, J.; Rossaint, R.; Coburn, M.; Schälte, G.; Wildenhues, A.; Marx, G.; Rex, S. Selenium blood concentrations in patients undergoing elective cardiac surgery and receiving perioperative sodium selenite. Nutrition 2013, 29, 158–165. [Google Scholar] [CrossRef] [PubMed]
- Stoppe, C.; Schälte, G.; Rossaint, R.; Coburn, M.; Graf, B.; Spillner, J.; Marx, G.; Rex, S. The intraoperative decrease of selenium is associated with the postoperative development of multiorgan dysfunction in cardiac surgical patients. Crit. Care Med. 2011, 39, 1879–1885. [Google Scholar] [CrossRef] [PubMed]
- Koukkou, E.; Ilias, I.; Alexiou, M.; Mamali, I.; Nicopoulou, S.; Alevizaki, M.; Markou, K. Urine selenium changes during pregnancy do not correlate with thyroid autoantibodies in a mildly iodine deficient population. Biol. Trace Elem. Res. 2014, 157, 9–13. [Google Scholar] [CrossRef] [PubMed]
- Bülow Pedersen, I.; Knudsen, N.; Carlé, A.; Schomburg, L.; Köhrle, J.; Jørgensen, T.; Rasmussen, L. Serum selenium is low in newly diagnosed Graves’ disease: A population-based study. Clin. Endocrinol. (Oxf.) 2013, 79, 584–590. [Google Scholar] [CrossRef]
- Millán Adame, E.; Florea, D.; Sáez Pérez, L.; Molina López, J.; López-González, B.; Pérez de la Cruz, A.; Planells del Pozo, E. Deficient selenium status of a healthy adult Spanish population. Nutr. Hosp. 2012, 27, 524–528. [Google Scholar] [CrossRef] [PubMed]
- Sánchez, C.; López-Jurado, M.; Aranda, P.; Llopis, J. Plasma levels of copper, manganese and selenium in an adult population in southern Spain: Influence of age, obesity and lifestyle factors. Sci. Total Environ. 2010, 408, 1014–1020. [Google Scholar] [CrossRef] [PubMed]
- Koszta, G.; Kacska, Z.; Szatmári, K.; Szerafin, T.; Fülesdi, B. Lower whole blood selenium level is associated with higher operative risk and mortality following cardiac surgery. J. Anesth. 2012, 26, 812–821. [Google Scholar] [CrossRef] [PubMed]
- Rayman, M.P.; Wijnen, H.; Vader, H.; Kooistra, L.; Pop, V. Maternal selenium status during early gestation and risk for preterm birth. CMAJ 2011, 183, 549–555. [Google Scholar] [CrossRef] [PubMed]
- Akbaraly, T.N.; Arnaud, J.; Rayman, M.P.; Hininger-Favier, I.; Roussel, A.M.; Berr, C.; Fontbonne, A. Plasma selenium and risk of dysglycemia in an elderly French population: Results from the prospective Epidemiology of Vascular Ageing Study. Nutr. Metab. 2010, 7, 1–7. [Google Scholar] [CrossRef] [Green Version]
- Miklavčič, A.; Casetta, A.; Snoj Tratnik, J.; Mazej, D.; Krsnik, M.; Mariuz, M.; Sofianou, K.; Spirić, Z.; Barbone, F.; Horvat, M. Mercury, arsenic and selenium exposure levels in relation to fish consumption in the Mediterranean area. Environ. Res. 2013, 120, 7–17. [Google Scholar] [CrossRef] [PubMed]
- Al-Saleh, I.; Billedo, G. Determination of selenium concentration in serum and toenail as an indicator of selenium status. Bull. Environ. Contam. Toxicol. 2006, 77, 155–163. [Google Scholar] [CrossRef] [PubMed]
- Hincal, F.; Baaran, N.; Yetgin, S.; Gökmen, O. Selenium status in Turkey. II. Serum selenium concentration in healthy residents of different ages in Ankara. J.Trace Elem. Electrolytes Health Dis. 1994, 8, 9–12. [Google Scholar] [PubMed]
- Kilinc, M.; Guven, M.A.; Ezer, M.; Ertas, I.E.; Coskun, A. Evaluation of serum selenium levels in Turkish women with gestational diabetes mellitus, glucose intolerants, and normal controls. Biol. Trace Elem. Res. 2008, 123, 35–40. [Google Scholar] [CrossRef] [PubMed]
- Safaralizadeh, R.; Kardar, G.; Pourpak, Z.; Moin, M.; Zare, A.; Teimourian, S. Serum concentration of Selenium in healthy individuals living in Tehran. Nutr. J. 2005, 4, 32. [Google Scholar] [CrossRef] [PubMed]
- Safaralizadeh, R.; Sirjani, M.; Pourpak, Z.; Kardar, G.; Teimourian, S.; Shams, S.; Namdar, Z.; Kazemnejad, A.; Moin, M. Serum selenium concentration in healthy children living in Tehran. Biofactors 2007, 31, 127–131. [Google Scholar] [CrossRef] [PubMed]
- Dabbaghmanesh, M.H.; Sadegholvaad, A.; Ejtehadi, F.; Omrani, G. Low serum selenium concentration as a possible factor for persistent goiter in Iranian school children. Biofactors 2007, 29, 77–82. [Google Scholar] [CrossRef] [PubMed]
- Farzin, L.; Moassesi, M.E.; Sajadi, F.; Amiri, M.; Shams, H. Serum levels of antioxidants (Zn, Cu, Se) in healthy volunteers living in Tehran. Biol. Trace Elem. Res. 2009, 129, 36–45. [Google Scholar] [CrossRef] [PubMed]
- Parizadeh, S.M.R.; Moohebati, M.; Ghafoori, F.; Ghayour-Mobarhan, M.; Kazemi-Bajestani, S.M.; Tavallaie, S.; Azimi-Nezhad, M.; Ferns, G.A. Serum selenium and glutathione peroxidase concentrations in Iranian patients with angiography-defined coronary artery disease. Angiology 2009, 60, 186–191. [Google Scholar] [PubMed]
- Rafraf, M.; Mahdavi, R.; Rashidi, M.R. Serum selenium levels in healthy women in Tabriz, Iran. Food Nutr. Bull. 2008, 29, 83–86. [Google Scholar] [PubMed]
- Tara, F.; Rayman, M.P.; Boskabadi, H.; Ghayour-Mobarhan, M.; Sahebkar, A.; Yazarlu, O.; Ouladan, S.; Tavallaie, S.; Azimi-Nezhad, M.; Shakeri, M.T.; et al. Selenium supplementation and premature (pre-labour) rupture of membranes: A randomised double-blind placebo-controlled trial. J. Obstet. Gynaecol. 2010, 30, 30–34. [Google Scholar] [CrossRef] [PubMed]
- Obeid, O.; Elfakhani, M.; Hlais, S.; Iskandar, M.; Batal, M.; Mouneimne, Y.; Adra, N.; Hwalla, N. Plasma copper, zinc, and selenium levels and correlates with metabolic syndrome components of lebanese adults. Biol. Trace Elem. Res. 2008, 123, 58–65. [Google Scholar] [CrossRef] [PubMed]
- Al-Sonboli, N.; Al-Aghbari, N.; Al-Aryani, A.; Atef, Z.; Brabin, B.; Shenkin, A.; Roberts, E.; Harper, G.; Hart, C.A.; Cuevas, L.E. Micronutrient concentrations in respiratory syncytial virus and human metapneumovirus in Yemeni children. Ann. Trop. Paediatr. 2009, 29, 35–40. [Google Scholar] [CrossRef] [PubMed]
- Massadeh, A.; Gharibeh, A.; Omari, K.; Al-Momani, I.; Alomary, A.; Tumah, H.; Hayajneh, W. Simultaneous determination of Cd, Pb, Cu, Zn, and Se in human blood of Jordanian smokers by ICP-OES. Biol. Trace Elem. Res. 2010, 133, 1–11. [Google Scholar] [CrossRef] [PubMed]
- Al-Saleh, I.; Al-Doush, I.; Ibrahim, M.; Rabbah, A. Serum selenium levels in Saudi new-borns. Int. J. Environ. Health Res. 1998, 8, 269–275. [Google Scholar] [CrossRef]
- Al-Saleh, I.; Billedo, G.; El-Doush, I.; El-Din, M.; Yosef, G. Selenium and vitamins status in Saudi children. Clin. Chim. Acta 2006, 368, 99–109. [Google Scholar] [CrossRef] [PubMed]
- Al-Saleh, E.; Nandakumaran, M.; Al-Rashdan, I.; Al-Harmi, J.; Al-Shammari, M. Maternal-foetal status of copper, iron, molybdenum, selenium and zinc in obese gestational diabetic pregnancies. Acta Diabetol. 2007, 44, 106–113. [Google Scholar] [CrossRef] [PubMed]
- Alissa, E.M.; Ahmed, W.H.; Al-ama, N.; Ferns, G.A. Selenium status and cardiovascular risk profile in healthy adult Saudi males. Molecules 2008, 14, 141–159. [Google Scholar] [CrossRef] [PubMed]
- El-Yazigi, A.; Legayada, E. Urinary selenium in healthy and diabetic Saudi Arabians. Biol. Trace Elem. Res. 1996, 52, 55–63. [Google Scholar] [CrossRef] [PubMed]
- Khoja, S.O.; Khan, J.A.; Maimani, A.A.; Berry, J.L.; Lanham-New, S.A.; Dehlawi, F.M.A. Extensive hypovitaminosis D in partly veiled Saudi Arabian premenopausal and postmenopausal women: Influence on bone health. Life Sci. J. 2013, 10, 3159–3166. [Google Scholar]
- Mokhber, N.; Namjoo, M.; Tara, F.; Boskabadi, H.; Rayman, M.P.; Ghayour-Mobarhan, M.; Sahebkar, A.; Majdi, M.R.; Tavallaie, S.; Azimi-Nezhad, M.; et al. Effect of supplementation with selenium on postpartum depression: A randomized double-blind placebo-controlled trial. J. Matern. Fetal Neonatal Med. 2011, 24, 104–108. [Google Scholar] [CrossRef] [PubMed]
- Mahyar, A.; Ayazi, P.; Fallahi, M.; Javadi, A. Correlation between serum selenium level and febrile seizures. Pediatr. Neurol. 2010, 43, 331–334. [Google Scholar] [CrossRef] [PubMed]
- Esalatmanesh, K.; Jamshidi, A.; Shahram, F.; Davatchi, F.; Masoud, S.A.; Soleimani, Z.; Salesi, M.; Ghaffarpasand, I. Study of the correlation of serum selenium level with Behcet’s disease. Int. J. Rheum. Dis. 2011, 14, 375–378. [Google Scholar] [CrossRef] [PubMed]
- Ehteshamfar, S.M.; Shapouri-Moghaddam, A.; Safarian, M.; Nematy, M.; Bahrami-Taghanaki, H.; Azizi, H. Serum selenium concentration in Mashhad prisoners, Iran. Saudi Med. J. 2012, 33, 859–862. [Google Scholar] [PubMed]
- Ghaemian, A.; Salehifar, E.; Shiraj, H.; Babaee, Z.A. A comparison of selenium concentrations between congestive heart failure patients and healthy volunteers. J. Tehran Heart Cent. 2012, 7, 53–57. [Google Scholar] [PubMed]
- Javanbakht, M.; Daneshpazhooh, M.; Chams-Davatchi, C.; Eshraghian, M.; Zarei, M.; Chamari, M. Serum selenium, zinc, and copper in early diagnosed patients with pemphigus vulgaris. Iran J. Public Health 2012, 41, 105–109. [Google Scholar] [PubMed]
- Farzin, L.; Sajadi, F. Comparison of serum trace element levels in patients with or without pre-eclampsia. J. Res. Med. Sci. 2012, 17, 938–941. [Google Scholar] [PubMed]
- Farzin, L.; Moassesi, M.E. A comparison of serum selenium, zinc and copper level in visceral and cutaneous leishmaniasis. J. Res. Med. Sci. 2014, 19, 355–357. [Google Scholar] [PubMed]
- Ghaemi, S.Z.; Forouhari, S.; Dabbaghmanesh, M.H.; Sayadi, M.; Bakhshayeshkaram, M.; Vaziri, F.; Tavana, Z. A prospective study of selenium concentration and risk of preeclampsia in pregnant Iranian women: A nested case-control study. Biol. Trace Elem. Res. 2013, 152, 174–179. [Google Scholar] [CrossRef] [PubMed]
- Maleki, A.; Fard, M.K.; Zadeh, D.H.; Mamegani, M.A.; Abasaizadeh, S.; Mazloomzadeh, S. The relationship between plasma level of Se and preeclampsia. Hypertens. Pregnancy 2011, 30, 180–187. [Google Scholar] [CrossRef] [PubMed]
- Seven, M.; Basaran, S.Y.; Cengiz, M.; Unal, S.; Yuksel, A. Deficiency of selenium and zinc as a causative factor for idiopathic intractable epilepsy. Epilepsy Res. 2013, 104, 35–39. [Google Scholar] [CrossRef] [PubMed]
- Bay, A.; Dogan, M.; Bulan, K.; Kaba, S.; Demir, N.; Öner, A.F. A study on the effects of pica and iron-deficiency anemia on oxidative stress, antioxidant capacity and trace elements. Hum. Exp. Toxicol. 2013, 32, 895–903. [Google Scholar] [CrossRef] [PubMed]
- Coskun, A.; Arikan, T.; Kilinc, M.; Arikan, D.C.; Ekerbiçer, H.Ç. Plasma selenium levels in Turkish women with polycystic ovary syndrome. Eur. J. Obstet. Gynecol. Reprod. Biol. 2013, 168, 183–186. [Google Scholar] [CrossRef] [PubMed]
- Erkekoğlu, P.; Aşçı, A.; Ceyhan, M.; Kızılgün, M.; Schweizer, U.; Ataş, C.; Kara, A.; Koçer Giray, B. Selenium levels, selenoenzyme activities and oxidant/antioxidant parameters in H1N1-infected children. Turk. J. Pediatr. 2013, 55, 271–282. [Google Scholar] [PubMed]
- Arikan, D.C.; Coskun, A.; Ozer, A.; Kilinc, M.; Atalay, F.; Arikan, T. Plasma selenium, zinc, copper and lipid levels in postmenopausal Turkish women and their relation with osteoporosis. Biol. Trace Elem. Res. 2011, 144, 407–417. [Google Scholar] [CrossRef] [PubMed]
- Eroglu, M.; Sahin, S.; Durukan, B.; Ozakpinar, O.B.; Erdinc, N.; Turkgeldi, L.; Sofuoglu, K.; Karateke, A. Blood serum and seminal plasma selenium, total antioxidant capacity and coenzyme q10 levels in relation to semen parameters in men with idiopathic infertility. Biol. Trace Elem. Res. 2014, 159, 46–51. [Google Scholar] [CrossRef] [PubMed]
- Sherief, L.M.; Abd El-Salam, S.M.; Kamal, N.M.; El Safy, O.; Almalky, M.A.; Azab, S.F.; Morsy, H.M.; Gharieb, A.F. Nutritional biomarkers in children and adolescents with Beta-thalassemia-major: An Egyptian center experience. Biomed. Res. Int. 2014, 2014, 1–7. [Google Scholar]
- Azab, S.F.; Saleh, S.H.; Elsaeed, W.F.; Elshafie, M.A.; Sherief, L.M.; Esh, A.M. Serum trace elements in obese Egyptian children: A case-control study. Ital. J. Pediatr. 2014, 10, 1–7. [Google Scholar]
- Saad, K.; Farghaly, H.S.; Badry, R.; Othman, H.A. Selenium and antioxidant levels decreased in blood of children with breath-holding spells. J. Child. Neurol. 2014, 29, 1339–1343. [Google Scholar] [CrossRef] [PubMed]
- Elemraid, M.A.; Mackenzie, I.J.; Fraser, W.D.; Harper, G.; Faragher, B.; Atef, Z.; Al-Aghbari, N.; Brabin., B.J. A case-control study of nutritional factors associated with chronic suppurative otitis media in Yemeni children. Eur. J. Clin. Nutr. 2011, 65, 895–902. [Google Scholar] [CrossRef] [PubMed]
- Alasfar, F.; Ben-Nakhi, M.; Khoursheed, M.; Kehinde, E.O.; Alsaleh, M. Selenium is significantly depleted among morbidly obese female patients seeking bariatric surgery. Obes. Surg. 2011, 21, 1710–1713. [Google Scholar] [CrossRef] [PubMed]
- Barclay, M.N.I.; MacPherson, A.; Dixon, J. Selenium content of a range of UK foods. J. Food Compost. Anal. 1995, 8, 307–318. [Google Scholar] [CrossRef]
- Saudi Arabia—Retail Food Sector Update 2009. USDA Foreign Agriculture Service, GAIN Report (No. SA9026). Available online: http://www.chilealimentos.com/medios/Servicios/Normas_internacionales/Norma_otros_paises/Normativa_Arabia_SAudita/retail_Arabia_saudita_USDA.pdf (accessed on 15 December 2014).
© 2015 by the authors; licensee MDPI, Basel, Switzerland. This article is an open access article distributed under the terms and conditions of the Creative Commons Attribution license (http://creativecommons.org/licenses/by/4.0/).
Share and Cite
Stoffaneller, R.; Morse, N.L. A Review of Dietary Selenium Intake and Selenium Status in Europe and the Middle East. Nutrients 2015, 7, 1494-1537. https://doi.org/10.3390/nu7031494
Stoffaneller R, Morse NL. A Review of Dietary Selenium Intake and Selenium Status in Europe and the Middle East. Nutrients. 2015; 7(3):1494-1537. https://doi.org/10.3390/nu7031494
Chicago/Turabian StyleStoffaneller, Rita, and Nancy L. Morse. 2015. "A Review of Dietary Selenium Intake and Selenium Status in Europe and the Middle East" Nutrients 7, no. 3: 1494-1537. https://doi.org/10.3390/nu7031494