Micronutrient Supplement Use and Diet Quality in University Students

 , ,
, ,
Abstract
:1. Introduction
2. Materials and Methods
2.1. Participants and Recruitment
2.2. Ethics
2.3. Food and Diet Questionnaire (FDQ)
2.4. Food Frequency Questionnaire (FFQ)
2.5. Diet Quality Assessment
2.6. Micronutrient Supplement Use Assessment
2.7. Statistical Analysis
3. Results

| Demographic | Total | Non-User | User | p a |
|---|---|---|---|---|
| Total (n) | 1306 | 571 (44) | 731 (56) | |
| Sex | ||||
| Female (n(%)) | 1026 (79) | 422 (75) | 601 (83) | <0.001 |
| Male (n(%)) | 267 (21) | 144 (25) | 122 (17) | |
| Age (Years) | ||||
| Mean (SD) | 20.5 (4.5) | 20.4 (4.3) | 20.7 (4.7) | 0.212 b |
| 17–19 (n(%)) | 769 (59) | 340 (60) | 426 (59) | |
| 20–25 (n(%)) | 421 (33) | 188 (33) | 233 (32) | 0.310 |
| ≥26 (n(%)) | 107 (8) | 39 (7) | 67 (9) | |
| BMI | ||||
| Mean (SD) | 22.3 (3.2) | 22.4 (3.1) | 22.3 (3.2) | 0.758 b |
| Underweight (<18.5kg/m2) (n(%)) | 75 (6) | 35 (7) | 40 (6) | |
| Healthy (18.5–24.9 kg/m2) (n(%)) | 929 (78) | 400 (77) | 527 (79) | |
| Overweight (25–29.9 kg/m2) (n(%)) | 160 (14) | 74 (14) | 86 (13) | 0.849 |
| Obese (≥30) (n(%)) | 27 (2) | 12 (2) | 15 (2) | |
| Nationality | ||||
| Australian (n(%)) | 1090 (85) | 477 (84) | 610 (86) | |
| Asian (n(%)) | 98 (8) | 47 (8) | 50 (7) | 0.556 |
| Other (n(%)) | 90 (7) | 43 (8) | 47 (7) | |
| Maternal Education | ||||
| Year 12 or less (n(%)) | 499 (41) | 229 (42) | 269 (39) | |
| Trade/Apprenticeship or Certificate/Diploma (n(%)) | 271 (22) | 116 (22) | 155 (23) | 0.565 |
| University Degree or Higher (n(%)) | 457 (37) | 195 (36) | 259 (38) | |
| Health Behaviour | Total | Non-User | User | p a |
|---|---|---|---|---|
| Total (n) | 1306 | 571 (44) | 731 (56) | |
| Smoking | ||||
| Yes (n(%)) | 41 (3) | 15 (3) | 26 (4) | 0.346 |
| No (n(%)) | 1263 (97) | 554 (97) | 705 (96) | |
| Alcohol | ||||
| Yes (n(%)) | 1091 (84) | 480 (84) | 607 (83) | 0.608 |
| No (n(%)) | 213 (16) | 90 (16) | 123 (17) | |
| Perceived Health of Diet | ||||
| Very Unhealthy/Unhealthy (n(%)) | 127 (10) | 72 (13) | 54 (8) | 0.001 |
| Healthy/Very Healthy (n(%)) | 1132 (90) | 478 (87) | 651 (92) | |
| Source of Information On Food, Nutrition and Health | ||||
| Health Professionals | ||||
| Yes (n(%)) | 120 (9) | 39 (7) | 81 (11) | 0.009 |
| No (n(%)) | 1164 (91) | 521 (93) | 639 (89) | |
| General Public | ||||
| Yes (n(%)) | 502 (39) | 214 (38) | 286 (40) | 0.632 |
| No (n(%)) | 781 (61) | 344 (62) | 435 (60) | |
| Peer Group | ||||
| Yes (n(%)) | 980 (76) | 439 (78) | 538 (75) | 0.180 |
| No (n(%)) | 309 (24) | 125 (22) | 183 (25) | |
| Follow a Specific Diet | ||||
| Vegetarian/Vegan | ||||
| Yes (n(%)) | 103 (9) | 34 (7) | 69 (11) | 0.013 |
| No (n(%)) | 1065 (91) | 485 (93) | 576 (91) | |
| Low Fat/Low Sugar/Diabetic | ||||
| Yes (n(%)) | 484 (40) | 170 (32) | 311 (46) | <0.001 |
| No (n(%)) | 738 (60) | 364 (68) | 373 (54) | |
| Yeast/Gluten/Lactose Free | ||||
| Yes (n(%)) | 132 (11) | 37 (7) | 95 (15) | <0.001 |
| No (n(%)) | 1031 (89) | 476 (93) | 551 (85) | |
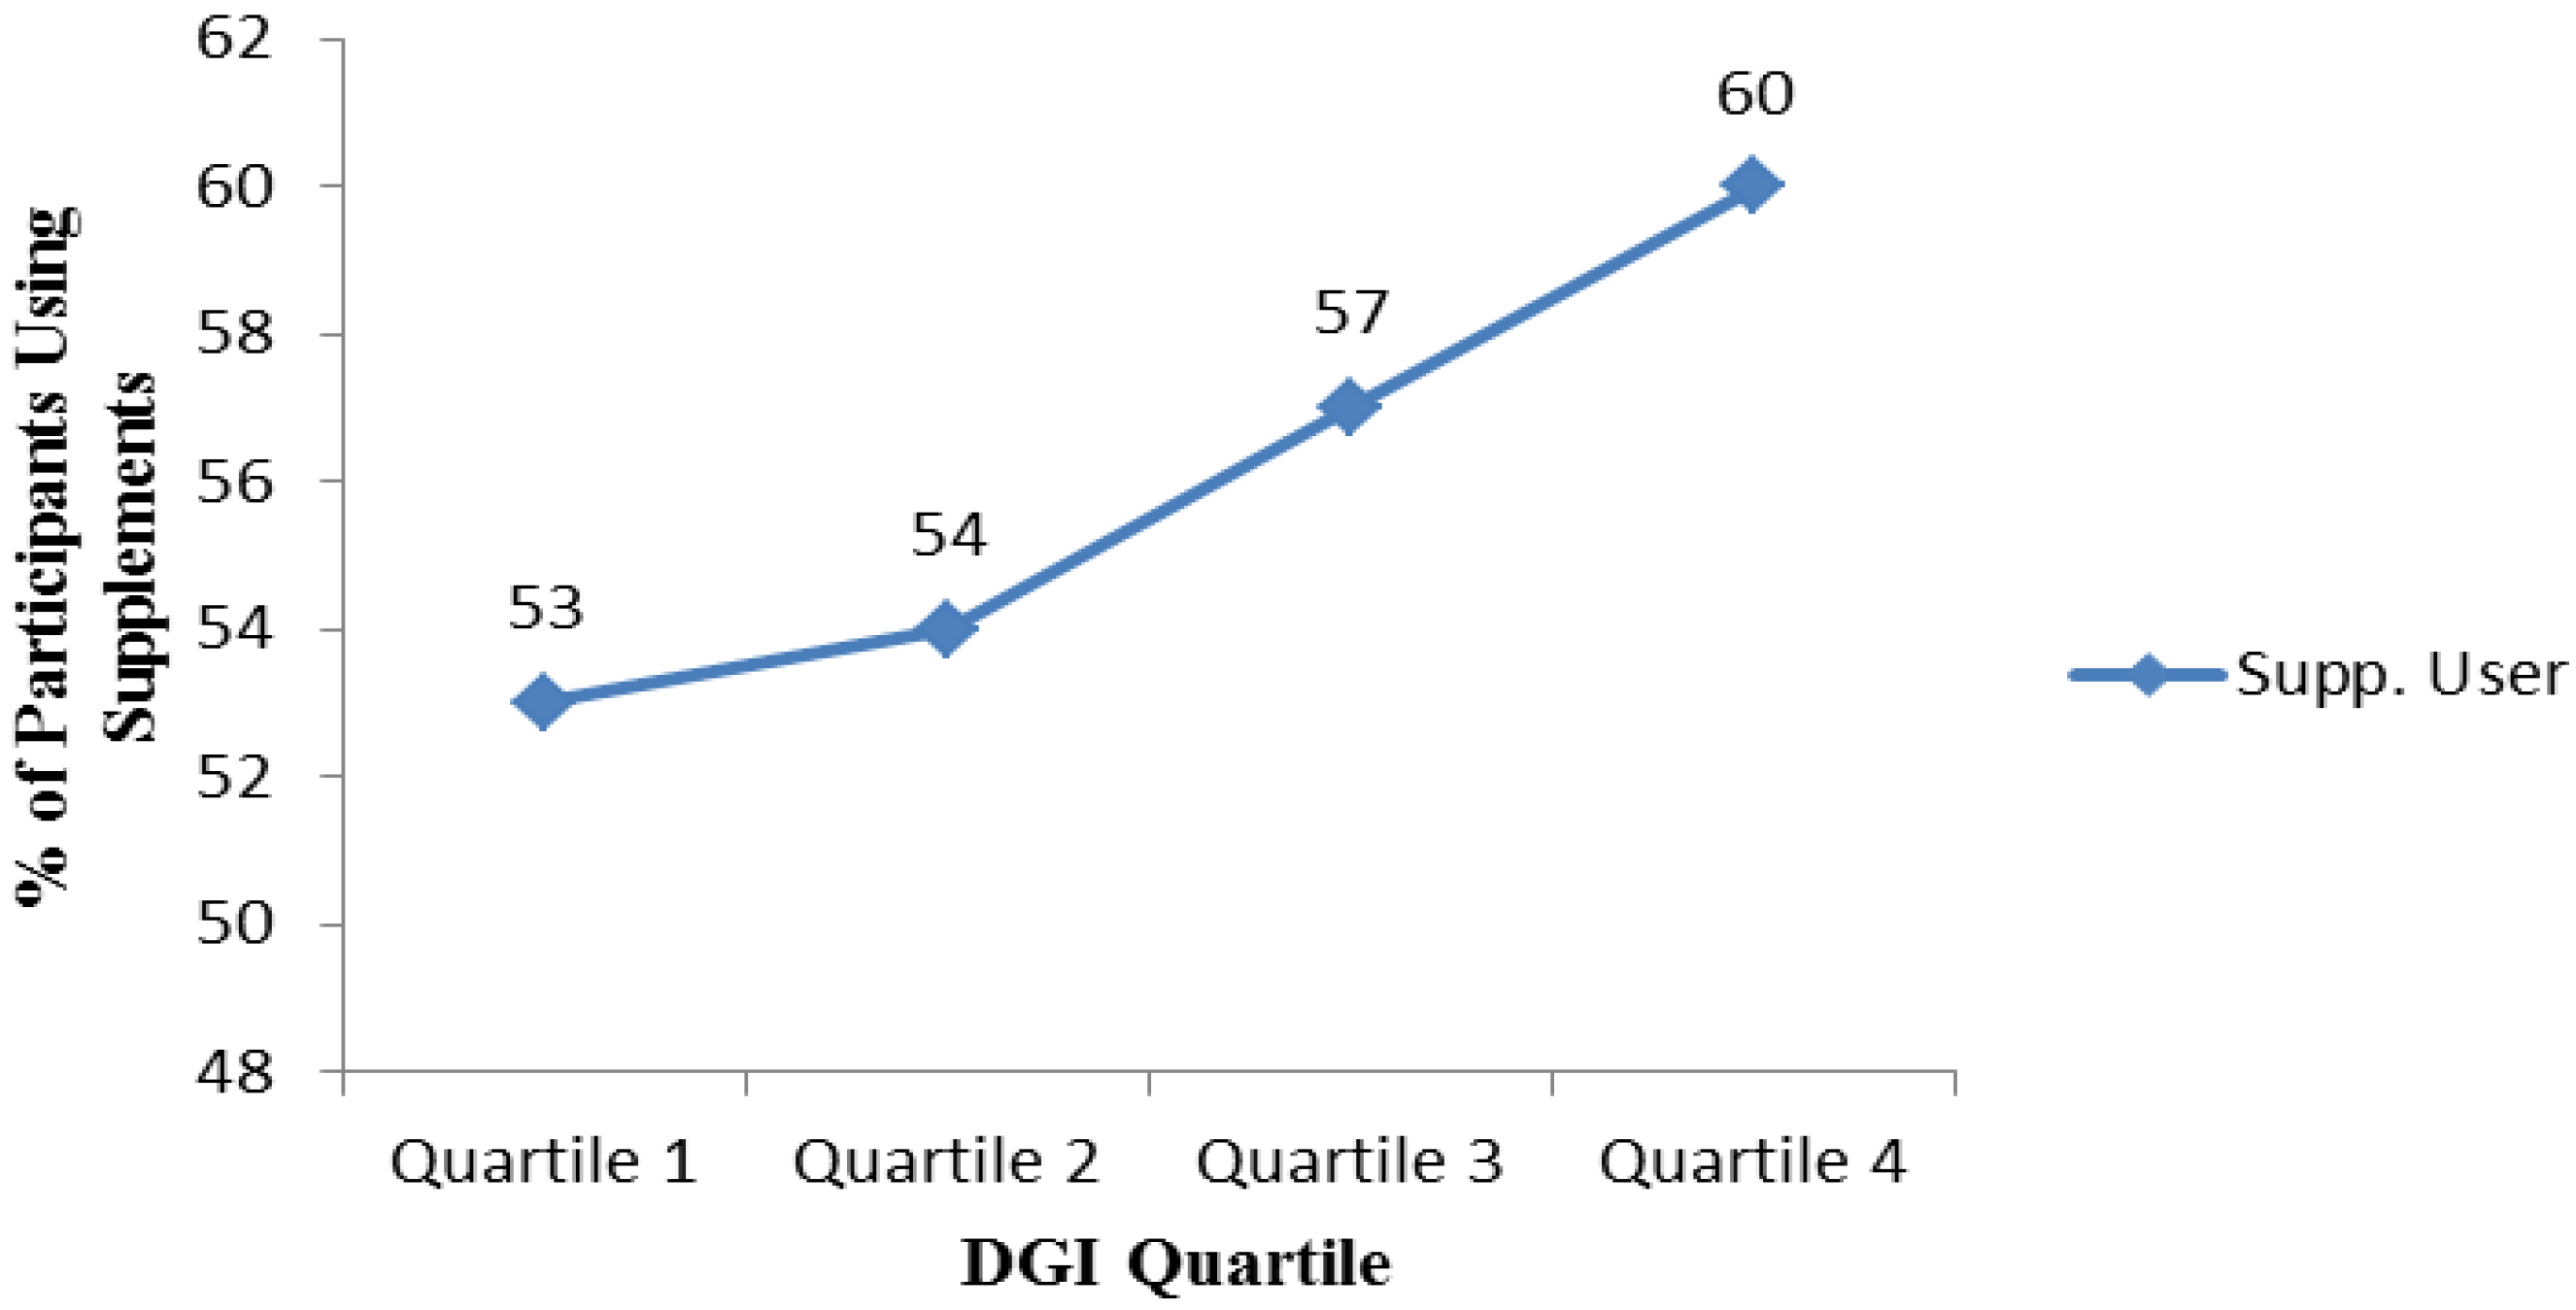
| Dietary Guideline Index (DGI) | ||||
| Mean (SD) | 107 (18) | 105 (18) | 109 (17) | 0.001b |
| Quartile 1: 19.9–95.1 (n(%)) | 326 (25) | 158 (28) | 167 (23) | |
| Quartile 2: 95.1–108.9 (n(%)) | 327 (25) | 153 (27) | 171 (23) | 0.019 |
| Quartile 3: 108.9–120.6 (n(%)) | 327 (25) | 137 (24) | 190 (26) | |
| Quartile 4: 120.6–141.7 (n(%)) | 326 (25) | 123 (21) | 203 (28) | |


4. Discussion
4.1. Overview
4.2. Prevalence and Trends of Supplement Use: Comparison with Australian and US Population
4.3. Characteristics of Supplement Users
4.4. Limitations
5. Conclusions
Acknowledgments
Author Contributions
Conflicts of Interest
References
- National Health and Medical Research Council. Nutrient Reference Values for Australia and New Zealand Including Recommended Dietary Intakes; National Health and Medical Research: Canberra, Australia, 2006.
- National Health and Medical Research Council. Australian Dietary Guidelines; National Health and Medical Research Council: Canberra, Australia, 2013.
- World Cancer Research Fund. Second Expert Report—Part 3: Public Healh Goals and Personal Recommendations; WCRF: London, England, 2007; Chapter 12. [Google Scholar]
- World Health Organisation. Diet, Nutrition and the Prevention of Chronic Diseases; World Health Organisation: Geneva, Swizerland, 2002; Volume 7. [Google Scholar]
- National Health and Medical Research Council. Folic Acid Encouraging Periconceptional Use of Folic Acid Supplements: National Health and Medical Research Council; NHMRC: Canberra, Australia, 2005.
- National Health and Medical Research Council. Nhmrc Public Statement: Iodine Supplements: National Health and Medical Research Council; NHMRC: Canberra, Australia, 2010.
- Euromonitor International. Vitamins and Dietary Supplements in Australia; Euromonitor International: Sydney, Australia, 2013. [Google Scholar]
- Australian Bureau of Statistics. National Nutrition and Physical Activity Survey; ABS: Canberra, Australia, 2014.
- Commonwealth Scientific and Industrial Research Organisation. The 2007 Australian National Children’s Nutrition and Physical Activity Survey Volume Three: Dietary Supplements Consumed; Department of Health and Ageing: Canberra, Australia, 2012.
- Bailey, R.L.; Gahche, J.J.; Lentino, C.V.; Dwyer, J.T.; Engel, J.S.; Thomas, P.R.; Betz, J.M.; Sempos, C.T.; Picciano, M.F. Dietary supplement use in the United States, 2003–2006. J. Nutr. 2011, 141, 261–266. [Google Scholar] [CrossRef] [PubMed]
- Bailey, R.L.; Gahche, J.J.; Miller, P.E.; Thomas, P.R.; Dwyer, J.T. Why U.S. adults use dietary supplements. JAMA Intern. Med. 2013, 173, 355–361. [Google Scholar] [CrossRef] [PubMed]
- Dwyer, J.; Nahin, R.L.; Rogers, G.T.; Barnes, P.M.; Jacques, P.M.; Sempos, C.T.; Bailey, R. Prevalence and predictors of children’s dietary supplement use: The 2007 national health interview survey. Am. J. Clin. Nutr. 2013, 97, 1331–1337. [Google Scholar] [CrossRef] [PubMed]
- Kennedy, E.T.; Luo, H.Q.; Houser, R.F. Dietary supplement use pattern of U.S. adult population in the 2007–2008 national health and nutrition examination survey (NHANES). Ecol. Food Nutr. 2013, 52, 76–84. [Google Scholar] [CrossRef] [PubMed]
- Commonwealth Scientific and Industrial Research Organisation. The 2007 Australian National Children’s Nutrition and Physical Activity Survey Volume Six: Demography; Department of Health and Ageing: Canberra, Australia, 2012.
- Gallagher, C.; Black, L.J.; Oddy, W.H. Micronutrient intakes from food and supplements in Australian adolescents. Nutrients 2014, 6, 342–354. [Google Scholar] [CrossRef] [PubMed]
- Ouellette, C.D.; Meng, Y.; Ying, W.; Yu, C.; Fernandez, M.L.; Rodriguez, N.R.; Chun, O.K. Assessment of nutrient adequacy with supplement use in a sample of healthy college students. J. Am. Coll. Nutr. 2012, 31, 301–310. [Google Scholar] [CrossRef] [PubMed]
- Sebastian, R.S.; Cleveland, L.E.; Goldman, J.D.; Moshfegh, A.J. Older adults who use vitamin/mineral supplements differ from nonusers in nutrient intake adequacy and dietary attitudes. J. Am. Diet Assoc. 2007, 107, 1322–1332. [Google Scholar] [CrossRef] [PubMed]
- Fletcher, R.H.; Fairfield, K.N. Vitamins for chronic disease prevention in adults—Clinical applications. J. Am. Med. Assoc. 2002, 287, 3127–3129. [Google Scholar] [CrossRef]
- Dickinson, A.; Bonci, L.; Boyon, N.; Franco, J.C. Dietitians use and recommend dietary supplements: Report of a survey. Nutr. J. 2012, 11, 14. [Google Scholar] [CrossRef] [PubMed]
- Meirelles, C.D.; da Veiga, G.V.; Soares, E.D. Nutritional status of vegetarian and omnivorous adolescent girls. Nutr. Res. 2001, 21, 689–702. [Google Scholar] [CrossRef]
- Donovan, U.M.; Gibson, R.S. Iron and zinc status of young women aged 14 to 19 years consuming vegetarian and omnivorous diets. J. Am. Coll. Nutr. 1995, 14, 463–472. [Google Scholar] [CrossRef] [PubMed]
- Antopol, W.; Tarlov, I.M. Experimental study of the effects produced by large doses of vitamin B6. J. Neuropathol. Exp. Neurol. 1942, 1, 330–336. [Google Scholar] [CrossRef]
- Dickinson, C.J. Does folic acid harm people with vitamin B12 deficiency? QJM 1995, 88, 357–364. [Google Scholar] [PubMed]
- Rothman, K.J.; Moore, L.L.; Singer, M.R.; Nguyen, U.D.T.; Mannino, S.; Milunsky, A. Teratogenicity of high vitamin A intake. N. Engl. J. Med. 1995, 333, 1369–1373. [Google Scholar] [CrossRef] [PubMed]
- Renwick, A.G. Toxicology of micronutrients: Adverse effects and uncertainty. J. Nutr. 2006, 136, 493–501. [Google Scholar]
- Riddell, L.J.; Ang, B.; Keast, R.S.J.; Hunter, W. Impact of living arrangements and nationality on food habits and nutrient intakes in young adults. Appetite 2011, 56, 726–731. [Google Scholar] [CrossRef] [PubMed]
- Thorpe, M.G.; Kestin, M.; Riddell, L.J.; Keast, R.S.; McNaughton, S.A. Diet quality in young adults and its association with food-related behaviours. Public Health Nutr. 2014, 17, 1767–1775. [Google Scholar] [CrossRef] [PubMed]
- Georgiou, C.C.; Betts, N.M.; Hoerr, S.L.; Keim, K.; Peters, P.K.; Stewart, B.; Voichick, J. Among young adults, college students and graduates practiced more healthful habits and made more healthful food choices than did nonstudents. J. Am. Diet. Assoc. 1997, 97, 754–759. [Google Scholar] [CrossRef] [PubMed]
- Soriano, J.M.; Molto, J.C.; Manes, J. Dietary intake and food pattern among university students. Nutr. Res. 2000, 20, 1249–1258. [Google Scholar] [CrossRef]
- Ireland, P.; Jolley, D.; Giles, G.; O’Dea, K.; Powles, J.; Rutishauser, I.; Wahlqvist, M.L.; Williams, J. Development of the melbourne FFQ: A food frequency questionnaire for use in an australian prospective study involving an ethnically diverse cohort. Asia Pac. J. Clin. Nutr. 1994, 3, 19–31. [Google Scholar] [PubMed]
- McLennan, W.P.A. National Nutrition Survey: Foods Eaten, Australia, 1995; Australian Bureau of Statistics: Canberra, Australia, 1999.
- McLennan, W.P.A. National Nutrition Survey Users’ Guide, 1995; Australian Bureau of Statistics: Canberra, Australia, 1998.
- McNaughton, S.A.; Ball, K.; Crawford, D.; Mishra, G.D. An index of diet and eating patterns is a valid measure of diet quality in an Australian population. J. Nutr. 2008, 138, 86–93. [Google Scholar] [PubMed]
- National Health and Medical Research Council. Food for Health; National Health and Medical Research Council: Canberra, Australia, 2005.
- McNaughton, S.A.; Dunstan, D.W.; Ball, K.; Shaw, J.; Crawford, D. Dietary quality is associated with diabetes and cardio-metabolic risk factors. J. Nutr. 2009, 139, 734–742. [Google Scholar] [CrossRef] [PubMed]
- Ulvik, R.J.; Møller, R.; Hervig, T. Dietary supplement of iron for iron deficiency. Tidsskr. Den Nor. Lægeforening 2013, 133, 845–849. [Google Scholar] [CrossRef]
- Ball, M.J.; Bartlett, M.A. Dietary intake and iron status of Australian vegetarian women. Am. J. Clin. Nutr. 1999, 70, 353–358. [Google Scholar] [PubMed]
- Thompson, T.; Dennis, M.; Higgins, L.A.; Lee, A.R.; Sharrett, M.K. Gluten-free diet survey: Are americans with coeliac disease consuming recommended amounts of fibre, iron, calcium and grain foods? J. Hum. Nutr. Diet. 2005, 18, 163–169. [Google Scholar] [CrossRef] [PubMed]
- Donaldson, M.S. Metabolic vitamin B12 status on a mostly raw vegan diet with follow-up using tablets, nutritional yeast, or probiotic supplements. Ann. Nutr. Med. 2000, 44, 229–234. [Google Scholar] [CrossRef]
- Heyman, M.B. Lactose intolerance in infants, children, and adolescents. Pediatrics 2006, 118, 1279–1286. [Google Scholar] [CrossRef] [PubMed]
- Weaver, C.M.; Proulx, W.R.; Heaney, R. Choices for achieving adequate dietary calcium with a vegetarian diet. Am. J. Clin. Nutr. 1999, 70, 543–548. [Google Scholar]
© 2015 by the authors; licensee MDPI, Basel, Switzerland. This article is an open access article distributed under the terms and conditions of the Creative Commons Attribution license (http://creativecommons.org/licenses/by/4.0/).
Share and Cite
Wiltgren, A.R.; Booth, A.O.; Kaur, G.; Cicerale, S.; Lacy, K.E.; Thorpe, M.G.; Keast, R.S.J.; Riddell, L.J. Micronutrient Supplement Use and Diet Quality in University Students. Nutrients 2015, 7, 1094-1107. https://doi.org/10.3390/nu7021094
Wiltgren AR, Booth AO, Kaur G, Cicerale S, Lacy KE, Thorpe MG, Keast RSJ, Riddell LJ. Micronutrient Supplement Use and Diet Quality in University Students. Nutrients. 2015; 7(2):1094-1107. https://doi.org/10.3390/nu7021094
Chicago/Turabian StyleWiltgren, Adam R., Alison O. Booth, Gunveen Kaur, Sara Cicerale, Kathleen E. Lacy, Maree G. Thorpe, Russell S. J. Keast, and Lynn J. Riddell. 2015. "Micronutrient Supplement Use and Diet Quality in University Students" Nutrients 7, no. 2: 1094-1107. https://doi.org/10.3390/nu7021094