Dietary Carbohydrate and Nocturnal Sleep Duration in Relation to Children’s BMI: Findings from the IDEFICS Study in Eight European Countries

 , , ,
, , ,  ,
,
Abstract
:1. Introduction

2. Methods
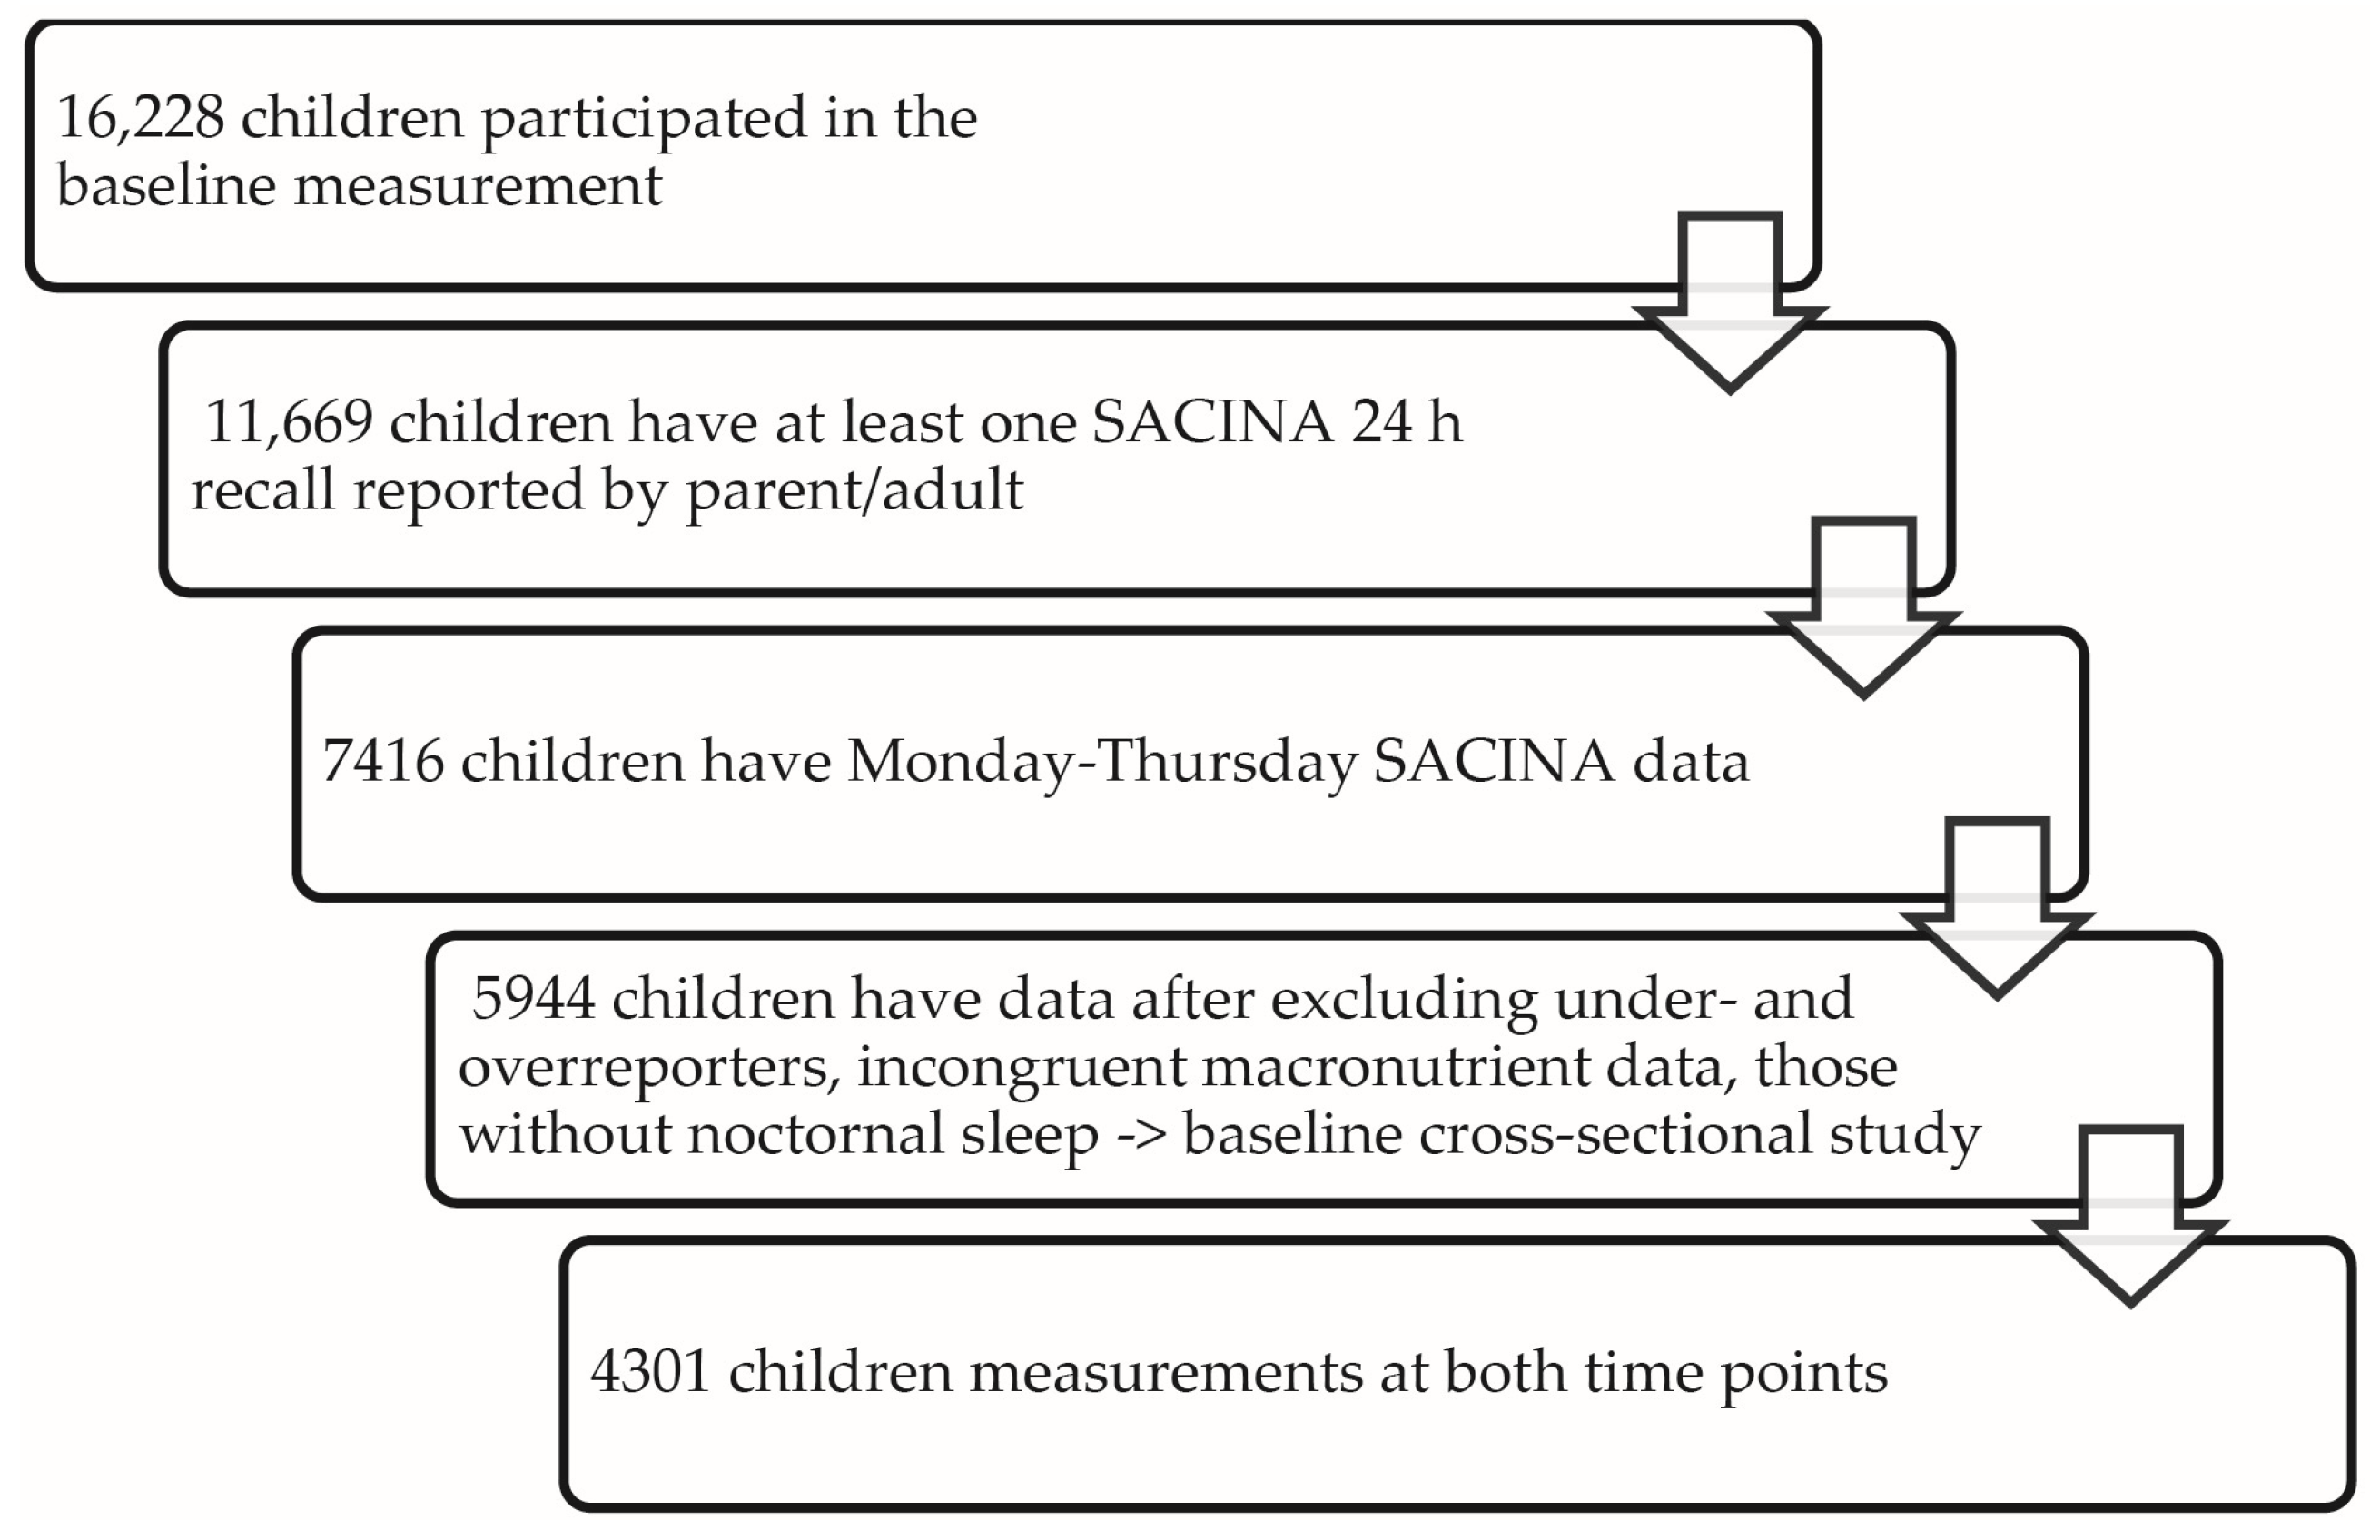
2.1. Participants
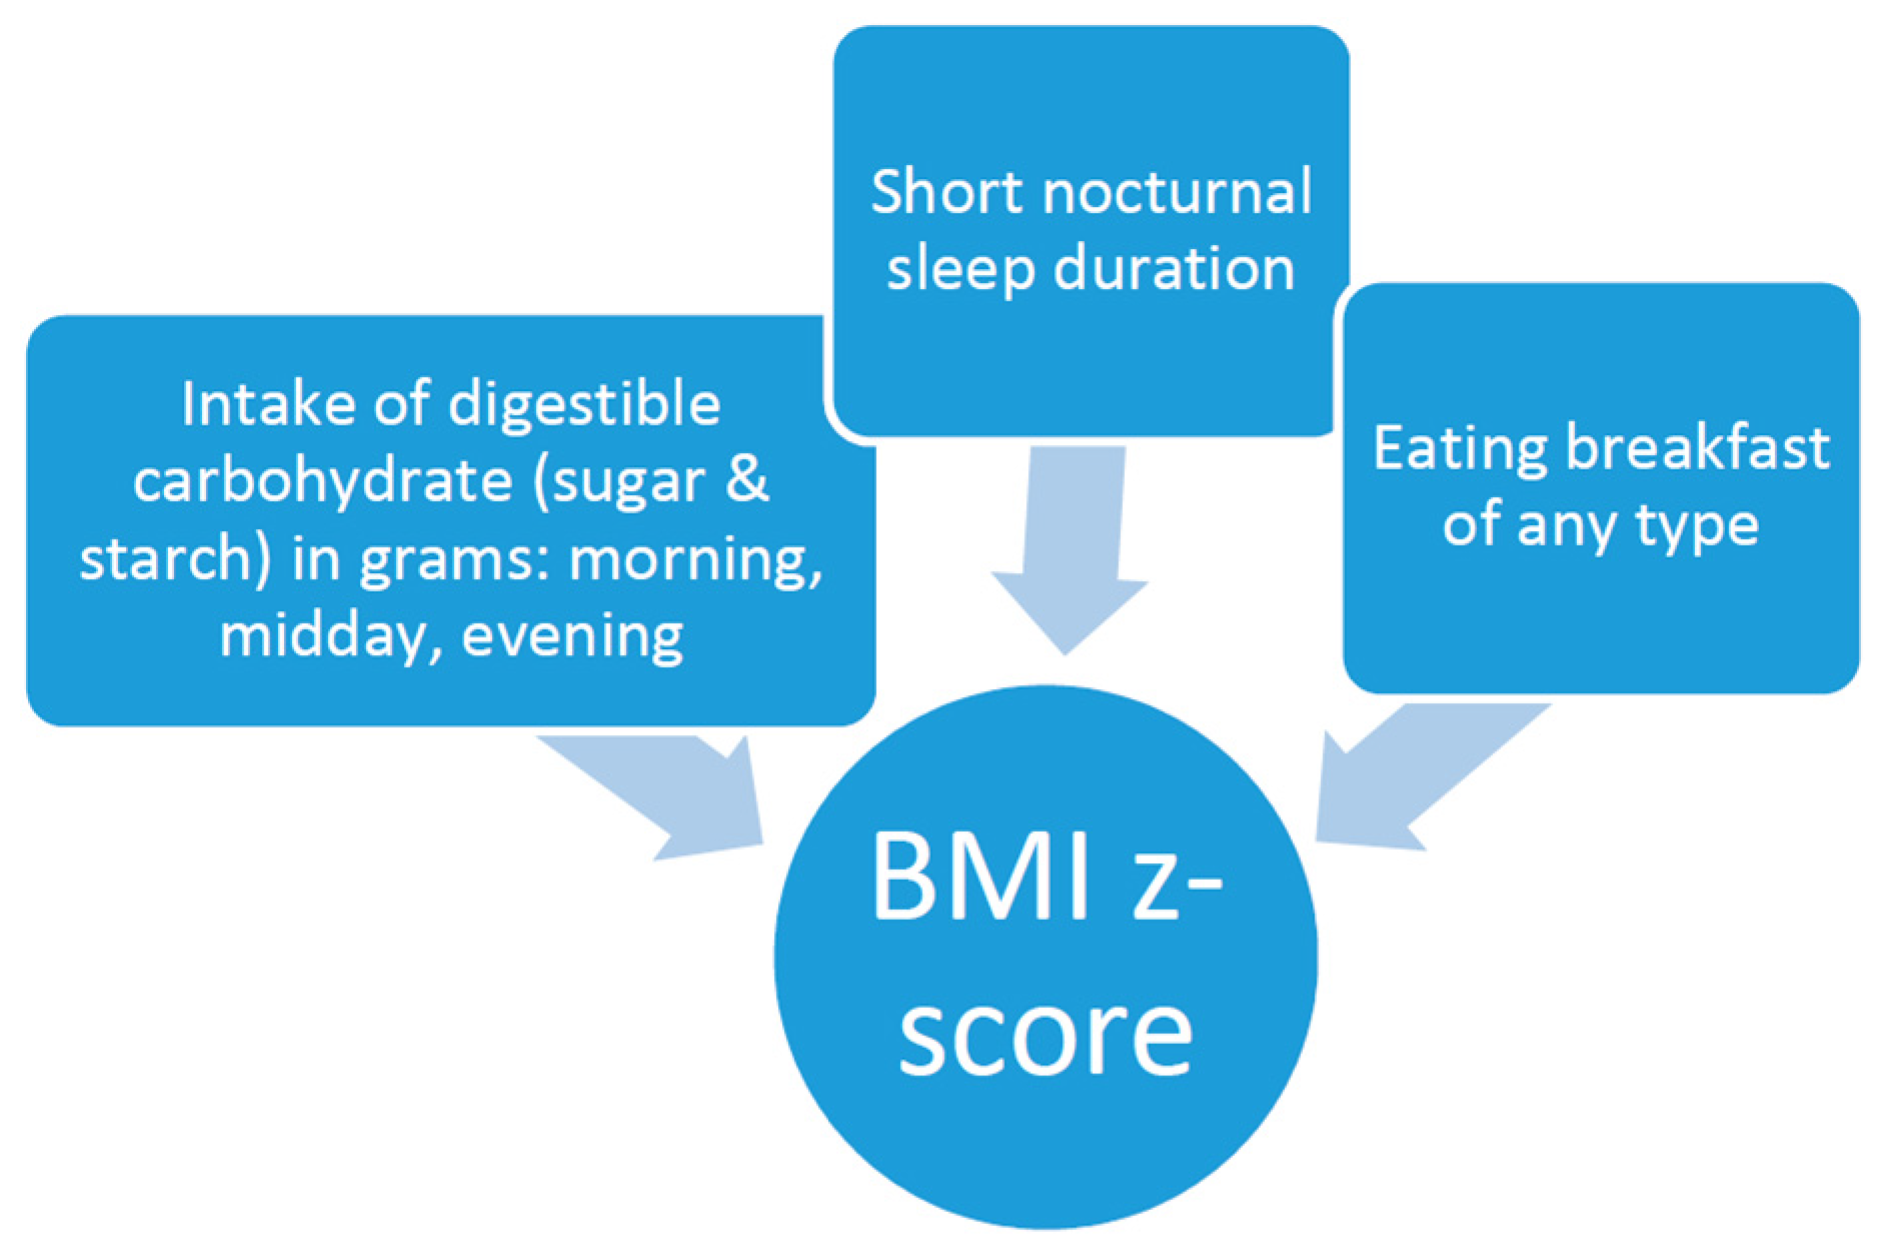
2.2. Assessment Of Main Exposures: High Carbohydrate Intake and Sleep Duration
2.3. Anthropometry and Body Mass Index (BMI)
2.4. Other Factors
2.5. Statistical Analysis
2.6. Ethics Statement
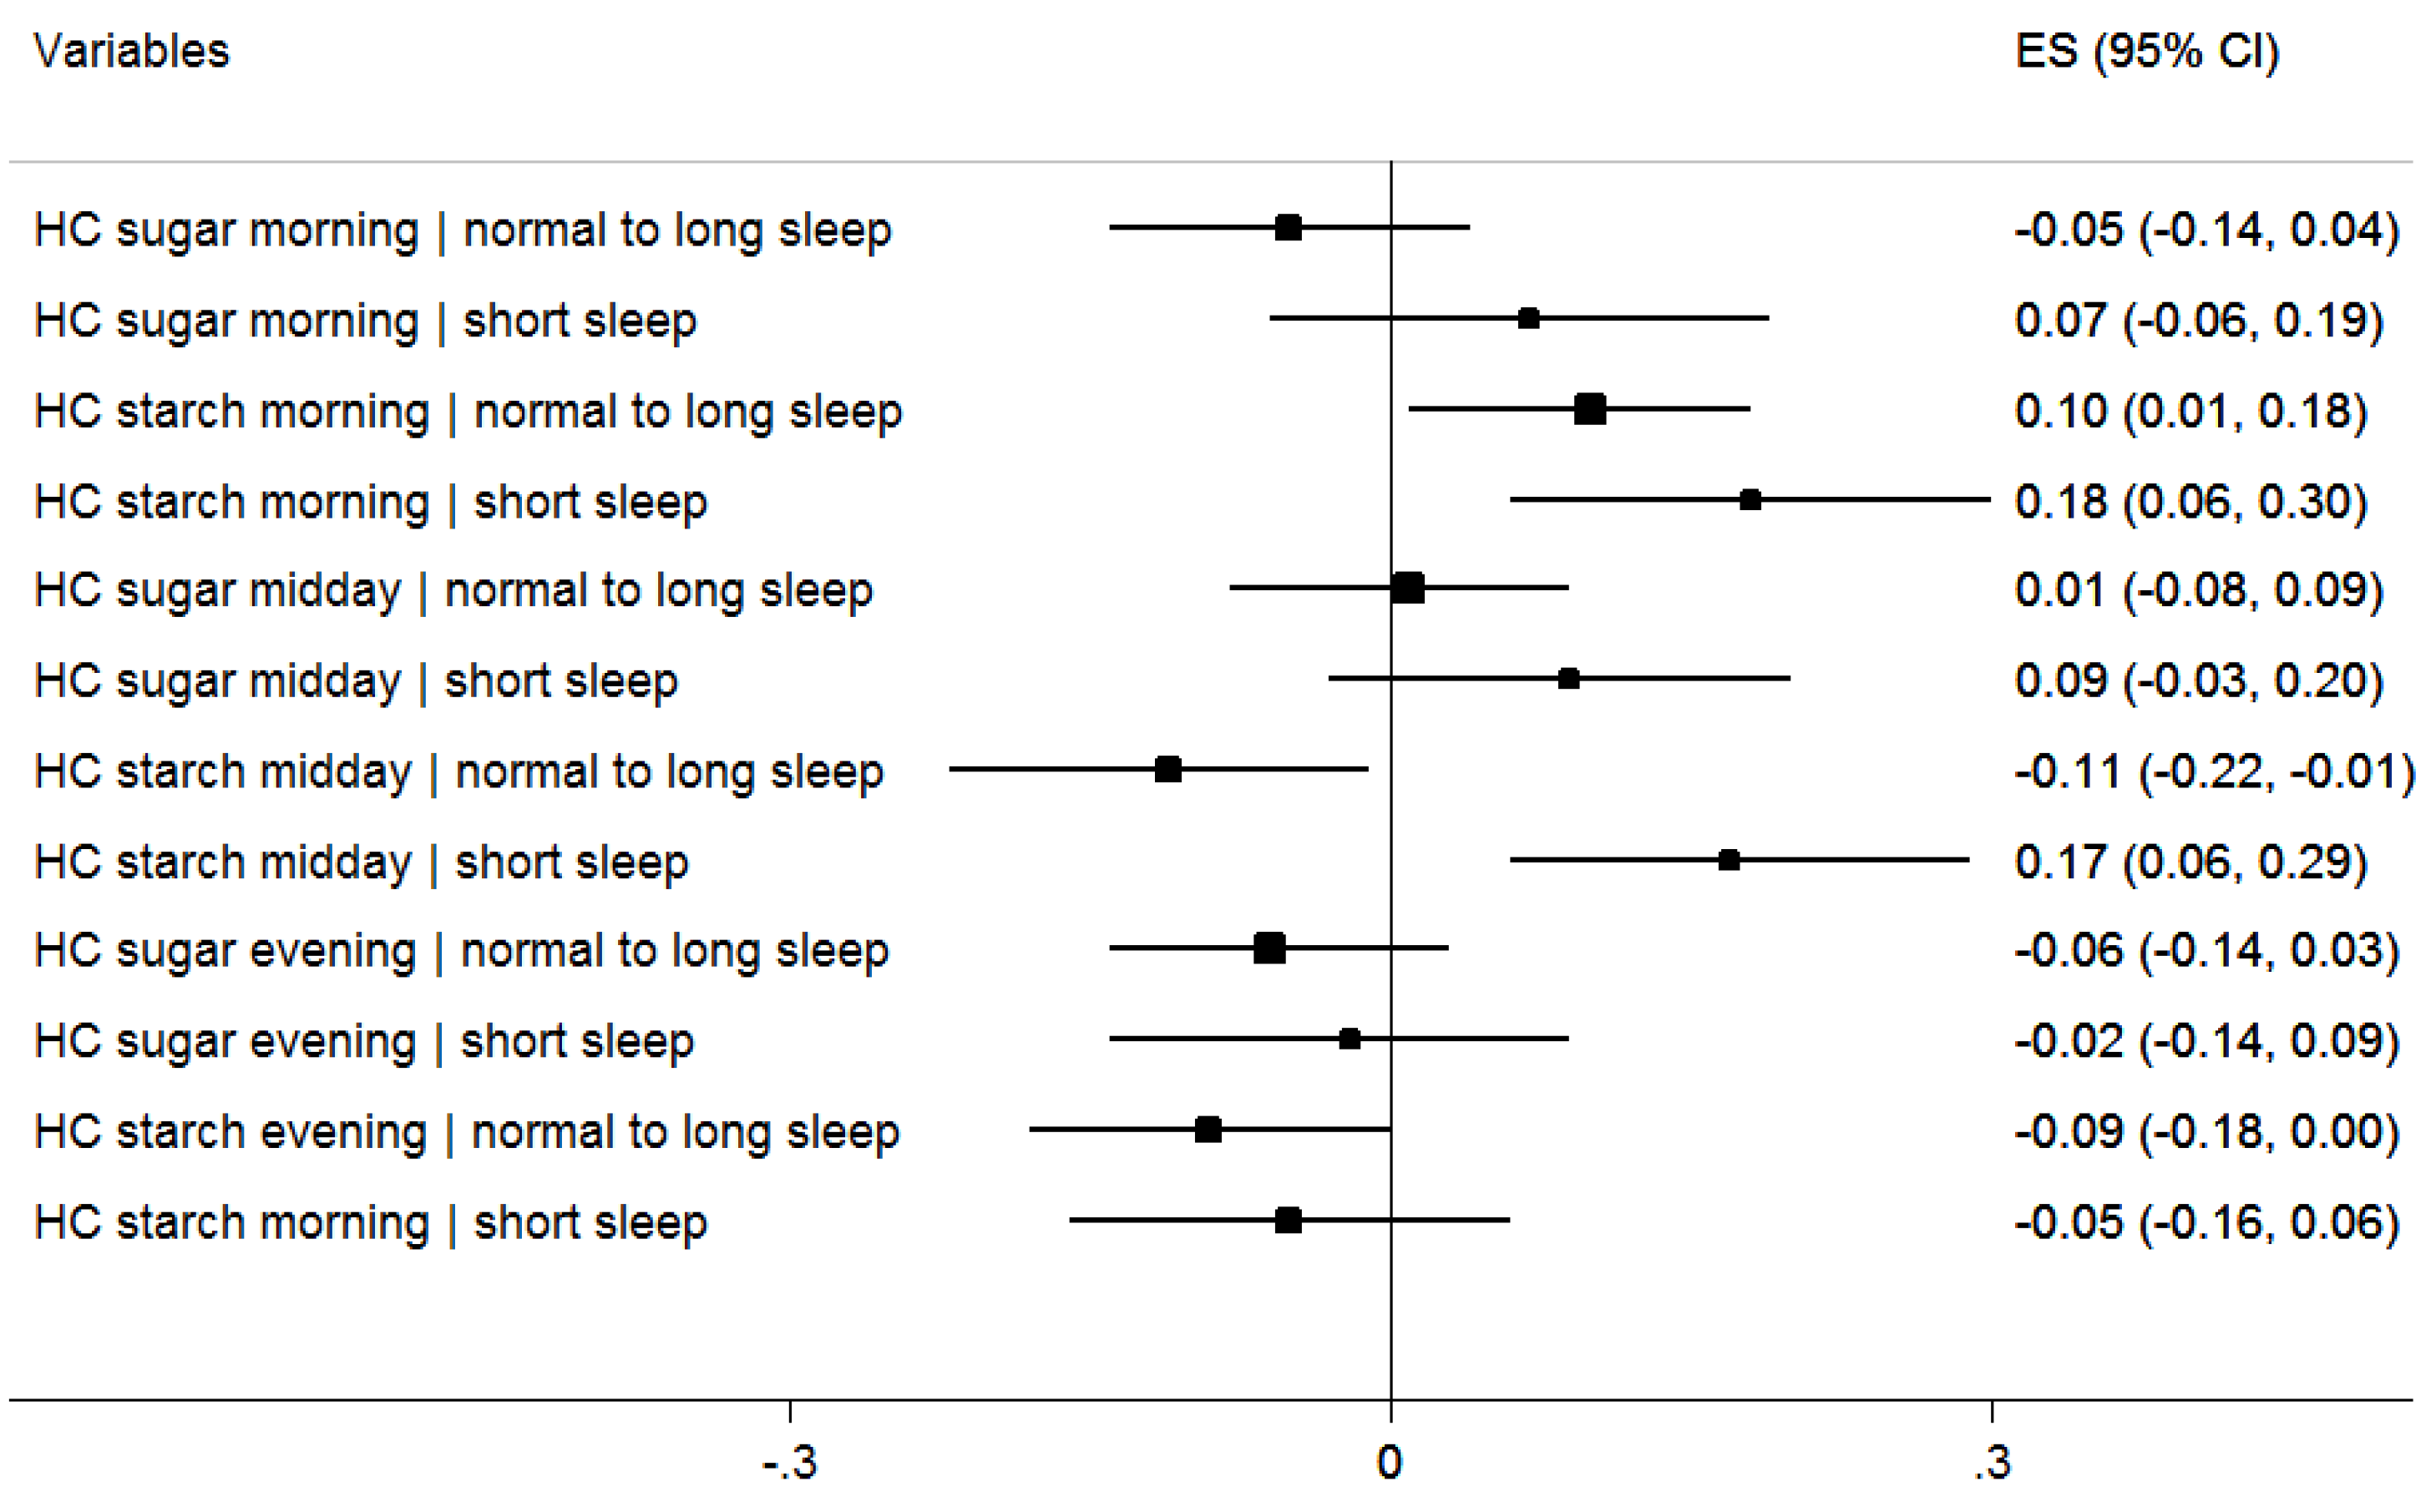
3. Results

| Variable | Belgium | Cyprus | Estonia | Germany | Hungary | Italy | Spain | Sweden | All |
|---|---|---|---|---|---|---|---|---|---|
| n = 277 | n = 699 | n = 621 | n = 1181 | n = 519 | n = 1367 | n = 411 | n = 869 | n = 5944 | |
| Intervention area, n (%) vs. control | 164 (59.2) | 268 (38.3) | 241 (38.8) | 652 (55.2) | 272 (52.4) | 794 (58.1) | 368 (89.5) | 394 (45.3) | 3153 (53.1) |
| Mean age (SD) | 5.5 (1.6) | 6.2 (1.4) | 6.5 (1.9) | 6.1 (1.8) | 6.5 (1.7) | 6.1 (1.8) | 5.5 (1.9) | 5.9 (2.0) | 6.1 (1.8) |
| Boys, n (%) | 150 (54.2) | 350 (50.1) | 292 (47.0) | 603 (51.1) | 265 (51.1) | 708 (51.8) | 220 (53.5) | 451 (51.9) | 3039 (51.1) |
| Overweight, including obese, n (%), Cole 2012 | 17 (6.1) | 152 (21.8) | 102 (16.4) | 170 (14.4) | 75 (14.5) | 543 (39.7) | 75 (18.3) | 77 (8.9) | 1211 (20.4) |
| Mean BMI-z score at baseline (SD), Cole 2012 | −0.09 (0.9) | 0.40 (1.2) | 0.24 (1.1) | 0.19 (1.1) | 0.11 (1.1) | 0.97 (1.2) | 0.37 (1.0) | 0.08 (0.9) | 0.37 (1.2) |
| Short sleep (<10 h/night), n (%) | 7 (2.5) | 272 (38.9) | 432 (69.6) | 76 (6.4) | 219 (42.2) | 815 (59.6) | 128 (31.1) | 112 (12.9) | 2061 (34.7) |
| High parental education, n (%) | 134 (48.9) | 319 (52.7) | 83 (13.7) | 186 (16.5) | 263 (51.1) | 258 (19.0) | 226 (55.5) | 593 (69.5) | 2062 (35.9) |
| Breakfast on weekdays, n (%) | 271 (98.2) | 667 (95.4) | 483 (81.3) | 913 (77.3) | 234 (46.6) | 1221 (89.6) | 317 (77.1) | 705 (94.5) | 4811 (83.4) |
| Energy kcal/day on weekdays, mean (SD) | 1383 (366) | 1421 (362) | 1718 (442) | 1524 (439) | 1517 (442) | 1697 (404) | 1540 (385) | 1545 (401) | 1569 (424) |
| Mean sugar (g), morning (SD) | 39 (22) | 23(13) | 23 (18) | 48 (32) | 33 (30) | 26 (17) | 34 (17) | 28 (17) | 32 (24) |
| Mean starch (g), morning (SD) | 25 (15) | 38 (23) | 17 (15) | 28 (17) | 27 (27) | 19 (15) | 18 (13) | 26 (16) | 25 (19) |
| Mean sugar (g), midday (SD) | 33 (23) | 20 (15) | 49 (30) | 43 (30) | 31 (29) | 34 (22) | 36 (20) | 30 (19) | 35 (26) |
| Mean starch (g), midday (SD) | 35 (18) | 39 (23) | 46 (27) | 32 (26) | 51 (33) | 101 (55) | 41 (20) | 47 (23) | 55 (43) |
| Mean sugar (g), evening (SD) | 23 (19) | 12 (12) | 39 (26) | 24 (22) | 37 (26) | 17 (16) | 20 (14) | 26 (19) | 24 (21) |
| Mean starch (g), evening (SD) | 27 (19) | 25 (20) | 28 (20) | 22 (16) | 23 (19) | 37 (36) | 12 (12) | 36 (19) | 28 (25) |
| HC sugar, morning, n (%) | 99 (36) | 55 (8) | 73 (11) | 596 (50) | 178 (34) | 239 (17) | 110 (27) | 135 (16) | 1485 (25) |
| HC starch, morning, n (%) | 60 (22) | 334 (48) | 77 (12) | 403 (34) | 172 (33) | 186 (14) | 42 (10) | 212 (24) | 1486 (25) |
| HC sugar midday, n (%) | 64 (23) | 43 (6) | 271 (44) | 446 (38) | 108 (21) | 314 (23) | 104 (25) | 136 (15) | 1486 (25) |
| HC starch midday, n (%) | 18 (7) | 67 (10) | 100 (16) | 69 (6) | 136 (26) | 917 (67) | 31 (8) | 148 (17) | 1486 (25) |
| HC sugar evening, n (%) | 79 (29) | 42 (6) | 322 (52) | 307 (26) | 261 (50) | 193 (14) | 363 (48) | 234 (27) | 1486 (25) |
| HC starch, evening, n (%) | 55 (20) | 163 (23) | 157 (25) | 152 (13) | 83 (16) | 495 (36) | 20 (5) | 361 (42) | 1486 (25) |
| Outcome | Not Short Sleeper n = 3883 | Short Sleeper n = 2061 | Regression Coefficient | 95% CI |
|---|---|---|---|---|
| BMI score, Cole 2012 | 0.25 | 0.61 | 0.12 | 0.05; −0.18 |
| Dietary factors modeled in multivariable model shown in Table 3 | ||||
| HC morning sugar, n (%) | 1080 (27.8) | 405 (19.7) | 0.03 | −0.13; 0.19 |
| HC morning starch, n (%) | 997 (25.7) | 489 (23) | 0.21 | 0.05; 0.37 |
| HC midday sugar, n (%) | 987 (25) | 499 (24) | −0.16 | −0.31; −0.00 |
| HC midday starch, n (%) | 754 (19) | 732 (36) | −0.08 | −0.24; 0.08 |
| HC evening sugar, n (%) | 916 (24) | 570 (28) | 0.21 | 0.05; 0.36 |
| HC evening starch, n (%) | 887 (23) | 599 (29) | 0.07 | −0.08; 0.22 |
| Energy, kcal/day, mean | 1522.8 | 1655.6 | 31.74 | 7.69; 55.79 |
| Eats breakfast, % | 84.17 | 81.82 | −0.03 | −0.047; −0.00 |
| Other factor modeled in multivariable model shown in Table 3 | ||||
| High parent education % | 39.5 | 29.1 | −0.029 | −0.06; 0.00 |
| Descriptive dietary factors, not in multivariable model shown in Table 3 | ||||
| Starch, g/day | 99.8 | 122.4 | 3.92 | 1.29; 6.55 |
| Sugar, g/day | 91.8 | 87.9 | 0.52 | −1.88; 2.92 |
| Carbohydrate, energy-%, day | 52.3% | 52.2% | 0.01 | −0.64; 0.65 |
| Fat, energy-%, day | 31.5% | 31.0% | 0.09 | −0.43; 0.61 |
| Protein, energy-%, day | 15.8% | 16.0% | −0.29 | −0.55; 0.03 |
| Exposures Measured at Baseline (n = 5750) † | Regression Coefficient | 95% CI |
|---|---|---|
| Short sleep < 10 h versus ≥ 10 h | 0.09 | 0.02; 0.16 |
| Breakfast (yes v. no) | −0.28 | −0.36; 0.19 |
| HC morning sugar | −0.02 | −0.09; 0.05 |
| HC morning starch | 0.12 | 0.05; 0.20 |
| HC midday sugar | 0.03 | −0.04; 0.10 |
| HC midday starch | 0.02 | −0.07; 0.10 |
| HC evening sugar | −0.04 | −0.12; 0.03 |
| HC evening starch | −0.08 | −0.15; −0.00 |
| Total energy intake in kcal | 0.03 | 0.02; 0.04 |
| Parental education (high v. “not high”) | −0.09 | −0.16; 0.24 |
4. Discussion
5. Conclusions
Acknowledgments
Author Contributions
Conflicts of Interest
References
- World Health Organization. Global Strategy on Diet, Physical Activity, and Health: Childhood Overweight and Obesity. 2012. Available online: http://www.who.int/dietphysicalactivity/strategy/eb11344/strategy_english_web.pdf (accessed on 12 January 2015).
- World Health Organization. Obesity and Overweight; Fact Sheet 311. 2014. Available online: http://www.who.int/mediacentre/factsheets/fs311/en/ (accessed on 12 January 2015).
- Magarey, A.; Watson, J.; Golley, R.K.; Burrows, T.; Sutherland, R.; McNaughton, S.A.; Denney-Wilson, E.; Campbell, K.; Collins, C. Assessing dietary intake in children and adolescents: Considerations and recommendations for obesity research. Int. J. Pediatr. Obes. 2011, 6, 2–11. [Google Scholar] [CrossRef] [PubMed]
- Nielsen, L.S.; Danielsen, K.V.; Sørensen, T.I. Short sleep duration as a possible cause of obesity: Critical analysis of the epidemiological evidence. Obes. Rev. 2011, 12, 78–92. [Google Scholar] [CrossRef] [PubMed]
- Chen, X.; Beydoun, M.A.; Wang, Y. Is sleep duration associated with childhood obesity? A systematic review and meta-analysis. Obesity 2008, 16, 265–274. [Google Scholar] [CrossRef] [PubMed]
- Hart, C.N.; Cairns, A.; Jelalian, E. Sleep and obesity in children and adolescents. Pediatr. Clin. N. Am. 2011, 58, 715–733. [Google Scholar] [CrossRef] [PubMed]
- Michels, N.; Verbeiren, A.; Ahrens, W.; de Henauw, S.; Sioen, I. Children’s sleep quality: Relation with sleep duration and adiposity. Public Health 2014, 128, 488–490. [Google Scholar] [CrossRef] [PubMed]
- Hense, S.; Pohlabeln, H.; de Henauw, H.; Eiben, G.; Molnar, D.; Moreno, L.A.; Barba, G.; Hadjigeorgiou, C.; Veidebaum, T.; Ahrens, W. Sleep duration and overweight in European children: Is the association modified by geographic region? Sleep 2011, 34, 885–890. [Google Scholar] [CrossRef] [PubMed]
- Accurso, A.; Bernstein, R.K.; Dahlqvist, A.; Draznin, B.; Feinman, R.D.; Fine, E.J.; Gleed, A.; Jacobs, D.B.; Larson, G.; Lustig, R.H.; et al. Dietary carbohydrate restriction in type 2 diabetes mellitus and metabolic syndrome: Time for a critical appraisal. Nutr. Metab. 2008, 5, 9. [Google Scholar] [CrossRef] [PubMed]
- Martens, E.A.; Gonnissen, H.K.; Gatta-Cherifi, B.; Janssens, P.L.; Westerterp-Plantenga, M.S. Maintenance of energy expenditure on high-protein vs. high-carbohydrate diets at a constant body weight may prevent a positive energy balance. Clin. Nutr. 2014, 34, 968–975. [Google Scholar] [CrossRef] [PubMed]
- Saavedra, J.M.; Deming, D.; Dattilo, A.; Reidy, K. Lessons from the Feeding Infants and Toddlers Study in North America: What Children Eat, and Implications for Obesity Prevention. Ann. Nutr. Metab. 2013, 62, S27–S36. [Google Scholar] [CrossRef] [PubMed]
- Firouzi, S.; Poh, B.K.; Ismail, M.N.; Sadeghilar, A. Sleep habits, food intake, and physical activity levels in normal and overweight and obese Malaysian children. Obes. Res. Clin. Pract. 2014, 1, e70–e78. [Google Scholar] [CrossRef] [PubMed]
- Fabritius, K.; Rasmussen, M. Breakfast habits and overweight in Danish schoolchildren. The role of socioeconomic positions. Ugeskr. Laeger 2008, 170, 2559–2563. [Google Scholar] [PubMed]
- Henríquez Sánchez, P.; Doreste Alonso, J.; Laínez Sevillano, P.; Estévez González, M.D.; Iglesias Valle, M.; López Martín, G.; Sosa Iglesias, I.; Serra Majem, L. Prevalence of obesity and overweight in adolescents from Canary Islands, Spain. Relationship with breakfast and physical activity. Med. Clin. 2008, 130, 606–610. [Google Scholar] [CrossRef]
- Dialektakou, K.D.; Vranas, P.B. Breakfast Skipping and Body Mass Index among Adolescents in Greece: Whether an Association Exists Depends on How Breakfast Skipping Is Defined. Am. Diet. Assoc. 2008, 108, 1517–1525. [Google Scholar] [CrossRef] [PubMed]
- Mota, J.; Fidalgo, F.; Silva, R.; Ribeiro, J.C.; Santos, R.; Carvalho, J.; Santos, M.P. Relationships between physical activity, obesity and meal frequency in adolescents. Ann. Hum. Biol. 2008, 35, 1–10. [Google Scholar] [CrossRef] [PubMed]
- Szajewska, H.; Ruszczynski, M. Systematic Review Demonstrating that Breakfast Consumption Influences Body Weight Outcomes in Children and Adolescents in Europe. Crit. Rev. Food Sci. Nutr. 2010, 50, 113–119. [Google Scholar] [CrossRef] [PubMed]
- Brown, A.W.; Bohan-Brown, M.M.; Allison, D.B. Belief beyond the evidence: Using the proposed effect of breakfast on obesity to show 2 practices that distort scientific evidence. Am. J. Clin. Nutr. 2013, 98, 1298–1308. [Google Scholar] [CrossRef] [PubMed]
- Ahrens, W.; Bammann, K.; de Henauw, S.; Halford, J.; Palou, A.; Pigeot, I.; Siani, A.; Sjöström, M. European Consortium of the IDEFICS Project. Understanding and preventing childhood obesity and related disorders—IDEFICS: A European multilevel epidemiological approach. Nutr. Metab. Cardiovasc. Dis. 2006, 16, 302–308. [Google Scholar] [CrossRef] [PubMed]
- Ahrens, W.; Bammann, K.; Siani, A.; Buchecker, K.; de Henauw, S.; Iacoviello, L.; Hebestreit, A.; Krogh, V.; Lissner, L.; Mårild, S.; et al. IDEFICS Consortium. The IDEFICS cohort: Design, participation, socio-demographic characteristics and participation in the baseline survey. Int. J. Obes. 2011, 35, S3–S15. [Google Scholar] [CrossRef] [PubMed]
- Bammann, K.; Peplies, J.; Sjöström, M.; Lissner, L.; de Henauw, S.; Galli, C.; Iacoviello, L.; Krogh, V.; Mårild, S.; Pigeot, I.; et al. Assessment of diet, physical activity and biological, social and environmental factors in a multi-centre European project on diet- and lifestyle-related disorders in children (IDEFICS). Public Health 2006, 14, 279–289. [Google Scholar] [CrossRef]
- Vereecken, C.A.; Covents, M.; Sichert-Hellert, W.; Alvira, J.M.; le Donne, C.; de Henauw, S.; de Vriendt, T.; Phillipp, M.K.; Béghin, L.; Manios, Y.; et al. Development and evaluation of a self-administered computerized 24-h dietary recall method for adolescents in Europe. Int. J. Obes. 2008, 32, 26–34. [Google Scholar] [CrossRef] [PubMed]
- Hebestreit, A.; Börnhorst, C.; Barba, G.; Siani, A.; Huybrechts, I.; Tognon, G.; Eiben, G.; Moreno, L.A.; Fernández Alvira, J.M.; Loit, H.M.; et al. Associations between energy intake, daily food intake and energy density of foods and BMI z-score in 2–9-year-old European children. Eur. J. Nutr. 2014, 53, 673–681. [Google Scholar] [PubMed]
- Food Standard Agency; Public Health of England. McCance and Widdowson’s the Composition of Foods, 5th ed.; Cambridge: Royal Society of Chemistry: Cambridge, UK, 1992. [Google Scholar]
- National Heart Lung Blood Institute. How Much Sleep Is Enough? Available online: http://www.nhlbi.nih.gov/health/health-topics/topics/sdd/howmuch (accessed on 8 March 2015).
- Svensson, Å.; Larsson, C.; Eiben, G.; Lanfer, A.; Pala, V.; Hebestreit, A.; Huybrechts, I.; Fernández-Alvira, J.M.; Russo, P.; Koni, A.C. European children’s sugar intake on weekdays versus weekends: The IDEFICS study. Eur. J. Clin. Nutr. 2014, 68, 822–828. [Google Scholar] [CrossRef] [PubMed]
- Schofield, W.N. Predicting basal metabolic rate, new standards and review of previous work. Hum. Nutr. Clin. Nutr. 1985, 39, S5–S41. [Google Scholar]
- Goldberg, G.R.; Black, A.E.; Jebb, S.A.; Cole, T.J.; Murgatroyd, P.R.; Coward, W.A.; Prentice, A.M. Critical evaluation of energy intake data using fundamental principles of energy physiology: 1. Derivation of cut-off limits to identify under-recording. Eur. J. Clin. Nutr. 1991, 45, 569–581. [Google Scholar] [PubMed]
- Cole, T.J.; Lobstein, T. Extended international (IOTF) body mass index cut-offs for thinness, overweight and obesity. Pediatr. Obes. 2012, 7, 284–294. [Google Scholar] [CrossRef] [PubMed]
- Stomfai, S.; Ahrens, W.; Bammann, K.; Kovács, E.; Mårild, S.; Michels, N.; Moreno, L.A.; Pohlabeln, H.; Siani, A.; Tornaritis, M. Intra- and inter-observer reliability in anthropometric measurements in children. Int. J. Obes. 2011, 35, S45–S51. [Google Scholar] [CrossRef] [PubMed]
- UNESCO. International Standard Classification of Education. 2010. Available online: http://www.uis.unesco.org (accessed on 14 December 2014).
- Gow, M.L.; Ho, M.; Burrows, T.L.; Baur, L.A.; Stewart, L.; Hutchesson, M.J.; Cowell, C.T.; Collins, C.E.; Garnett, S.P. Impact of dietary macronutrient distribution on BMI and cardiometabolic outcomes in overweight and obese children and adolescents: A systematic review. Nutr. Rev. 2014, 72, 453–470. [Google Scholar] [CrossRef] [PubMed]
- De Castro, J. The time of day of food intake influences overall intake in humans. J. Nutr. 2004, 134, 104–111. [Google Scholar] [PubMed]
- De Castro, J. The time of day and the proportions of macronutrients eaten are related to daily food intake. Br. J. Nutr. 2007, 98, 1077–1083. [Google Scholar] [CrossRef] [PubMed]
- Sofer, S.; Eliraz, A.; Kaplan, S.; Voet, H.; Fink, G.; Kima, T.; Madar, Z. Greater Weight Loss and Hormonal Changes After 6 Months Diet With Carbohydrates Eaten Mostly at Dinner. Obesity 2011, 19, 2006–2014. [Google Scholar] [CrossRef] [PubMed]
- Coleman, R.A.; Herrmann, T.S. Nutritional regulation of leptin in humans. Diabetologia 1999, 42, 639–646. [Google Scholar] [CrossRef] [PubMed]
- Yildiz, B.O.; Suchard, M.A.; Wong, M.L.; McCann, S.M.; Licinio, J. Alterations in the dynamics of circulating ghrelin, adiponectin, and leptin in human obesity. Proc. Natl. Acad. Sci. USA 2004, 101, 10434–10439. [Google Scholar] [CrossRef] [PubMed]
- United States Department of Agriculture. Online Diet Assessment Tool. Available online: http://www.supertracker.usda.gov/foodtracker (accessed on 7 April 2015).
- Patel, S.R.; Hu, F.B. Short sleep duration and weight gain: A systematic review. Obesity 2008, 3, 643–653. [Google Scholar] [CrossRef] [PubMed]
- Beccuti, G.; Pannain, S. Sleep and obesity. Curr. Opin. Clin. Nutr. Metab. Care 2011, 14, 402–412. [Google Scholar] [CrossRef] [PubMed]
- Hogenkamp, P.S.; Nilsson, E.; Nilsson, V.C.; Chapman, C.D.; Vogel, H.; Lundberg, L.S.; Zarei, S.; Cedernaes, J.; Rångtell, F.H.; Broman, J.E.; et al. Acute sleep deprivation increases portion size and affects food choice in young men. Psychoneuroendocrinology 2013, 38, 1668–1674. [Google Scholar] [CrossRef] [PubMed]
- Chaput, J.P. Sleep patterns, diet quality and energy balance. Physiol. Behav. 2014, 134, 86–91. [Google Scholar] [CrossRef] [PubMed]
- Fernández-Alvira, J.M.; Mouratidou, T.; Bammann, K.; Hebestreit, A.; Barba, G.; Sieri, S.; Reisch, L.; Eiben, G.; Hadjigeorgiou, C.; Kovacs, E. Parental education and frequency of food consumption in European children: The IDEFICS study. Public Health Nutr. 2012, 16, 487–498. [Google Scholar] [CrossRef] [PubMed]
- Abudayya, A.H.; Stigum, H.; Shi, Z.; Abed, Y.; Holmboe-Ottesen, G. Socio-demographic correlates of food habits among school adolescents (12–15 years) in North Gaza Strip. BMC Public Health 2009, 9, 185. [Google Scholar] [CrossRef] [PubMed]
- Sandvik, C.; Gjestad, R.; Samdal, O.; Brug, J.; Klepp, K.I. Does socioeconomic status moderate the associations between psychosocial predictors and fruit intake in schoolchildren? The Pro Children study. Health Educ. Res. 2010, 25, 121–134. [Google Scholar] [CrossRef] [PubMed]
- Suliga, E. Parental education and living environmental influence on physical development, nutritional habits as well as level of physical activity in Polish children and adolescents. Anthropol. Anz. 2010, 68, 53–66. [Google Scholar] [CrossRef] [PubMed]
- Blake, C.E.; Wethington, E.; Farrell, T.J.; Bisogni, C.A.; Devine, C.M. Behavioral contexts, food-choice coping strategies, and dietary quality of a multiethnic sample of employed parents. J. Am. Diet. Assoc. 2011, 111, 401–407. [Google Scholar] [CrossRef] [PubMed]
- Küpers, L.K.; de Pijper, J.J.; Sauer, P.J.J.; Stolk, R.P.; Corpeleijn, E. Skipping breakfast and overweight in two and five year old Dutch children–GECKO Drenthe cohort. Int. J. Obes. 2014, 38, 569–571. [Google Scholar] [CrossRef] [PubMed]
© 2015 by the authors; licensee MDPI, Basel, Switzerland. This article is an open access article distributed under the terms and conditions of the Creative Commons by Attribution (CC-BY) license (http://creativecommons.org/licenses/by/4.0/).
Share and Cite
Hunsberger, M.; Mehlig, K.; Börnhorst, C.; Hebestreit, A.; Moreno, L.; Veidebaum, T.; Kourides, Y.; Siani, A.; Molnar, D.; Sioen, I.; et al. Dietary Carbohydrate and Nocturnal Sleep Duration in Relation to Children’s BMI: Findings from the IDEFICS Study in Eight European Countries. Nutrients 2015, 7, 10223-10236. https://doi.org/10.3390/nu7125529
Hunsberger M, Mehlig K, Börnhorst C, Hebestreit A, Moreno L, Veidebaum T, Kourides Y, Siani A, Molnar D, Sioen I, et al. Dietary Carbohydrate and Nocturnal Sleep Duration in Relation to Children’s BMI: Findings from the IDEFICS Study in Eight European Countries. Nutrients. 2015; 7(12):10223-10236. https://doi.org/10.3390/nu7125529
Chicago/Turabian StyleHunsberger, Monica, Kirsten Mehlig, Claudia Börnhorst, Antje Hebestreit, Luis Moreno, Toomas Veidebaum, Yiannis Kourides, Alfonso Siani, Dénes Molnar, Isabelle Sioen, and et al. 2015. "Dietary Carbohydrate and Nocturnal Sleep Duration in Relation to Children’s BMI: Findings from the IDEFICS Study in Eight European Countries" Nutrients 7, no. 12: 10223-10236. https://doi.org/10.3390/nu7125529