1. Introduction
Atopic dermatitis (AD) is a chronic and relapsing inflammatory skin disease. It is one of the most common allergic diseases in children, affecting up to 25% worldwide [
1]. Comparable or even greater prevalence of AD (25%–34%) has been reported in a large scale study of Korean children [
2]. The majority of AD starts in early childhood, and 70% of children with AD show clinical symptoms before the age of five years [
3,
4]. As AD is a major health concern that severely compromises quality of life in children, understanding the factors associated with the development of AD and its prevention are critical.
Multiple genetic and environmental factors are thought to contribute to the risk and development of AD. AD is usually associated with a family history of atopic disorders, such as asthma, rhinitis, and AD itself, and twin studies have shown that the genetic contribution is substantial [
5]. However, a steady increase in the prevalence of AD over recent decades indicates that environmental factors also play important roles in AD pathogenesis. Although the molecular mechanisms underlying AD are not fully understood, impaired homeostasis of oxygen/nitrogen radicals as well as increased oxidative stress have been suggested to be involved in the pathophysiology of childhood AD [
6,
7]. In skin inflammation associated with AD, reactive oxygen species are released during the activation and infiltration of lymphocytes, monocytes, and eosinophils [
8,
9].
Diet has been suggested as a predictor of health such as allergic diseases and mental health in childhood [
10,
11,
12,
13,
14,
15,
16], although the actual association is not clear. Previously, we have demonstrated that a higher intake of dietary antioxidant vitamins, including β-carotene and vitamin E, is associated with a reduced risk of AD among preschool-age children in Korea and suggested a possible role of oxidative stress in this association [
10]. Dietary pattern providing an overall view of intake draws attention because it could minimize chance inter-correlations among many nutrients in the diet. “Processed” or “Western” diets , high in fat and sugar content, or “healthy” or “prudent” diets, containing micronutrient-rich foods, have been reported regarding child mental health, although the associations are not clear [
13,
14,
15,
16].
Genetic variations in glutathione S-transferase (
GST) that alter enzymatic activity can have a significant impact on susceptibility to diseases whose pathogenesis involves oxidative stress, as is the case in many inflammatory diseases such as atopic dematitis (AD) [
17,
18,
19,
20]. Several genetic polymorphisms have been identified in
GST isoforms. A limited number of studies [
21,
22], including one of our own [
23], have examined the association of
GST gene polymorphisms with AD, yet the findings are inconsistent.
Considering that both genetic and environmental factors are important contributors to AD development, we hypothesize that interactions between genetic determinants of antioxidant capacity and diet may play a role in AD. Therefore, in the present study, we examined the association between dietary patterns and AD in relation to glutathione S-transferase M1 (GSTM1) and T1 (GSTT1)-present/null polymorphisms.
2. Methods
2.1. Participants and Study Design
As shown in
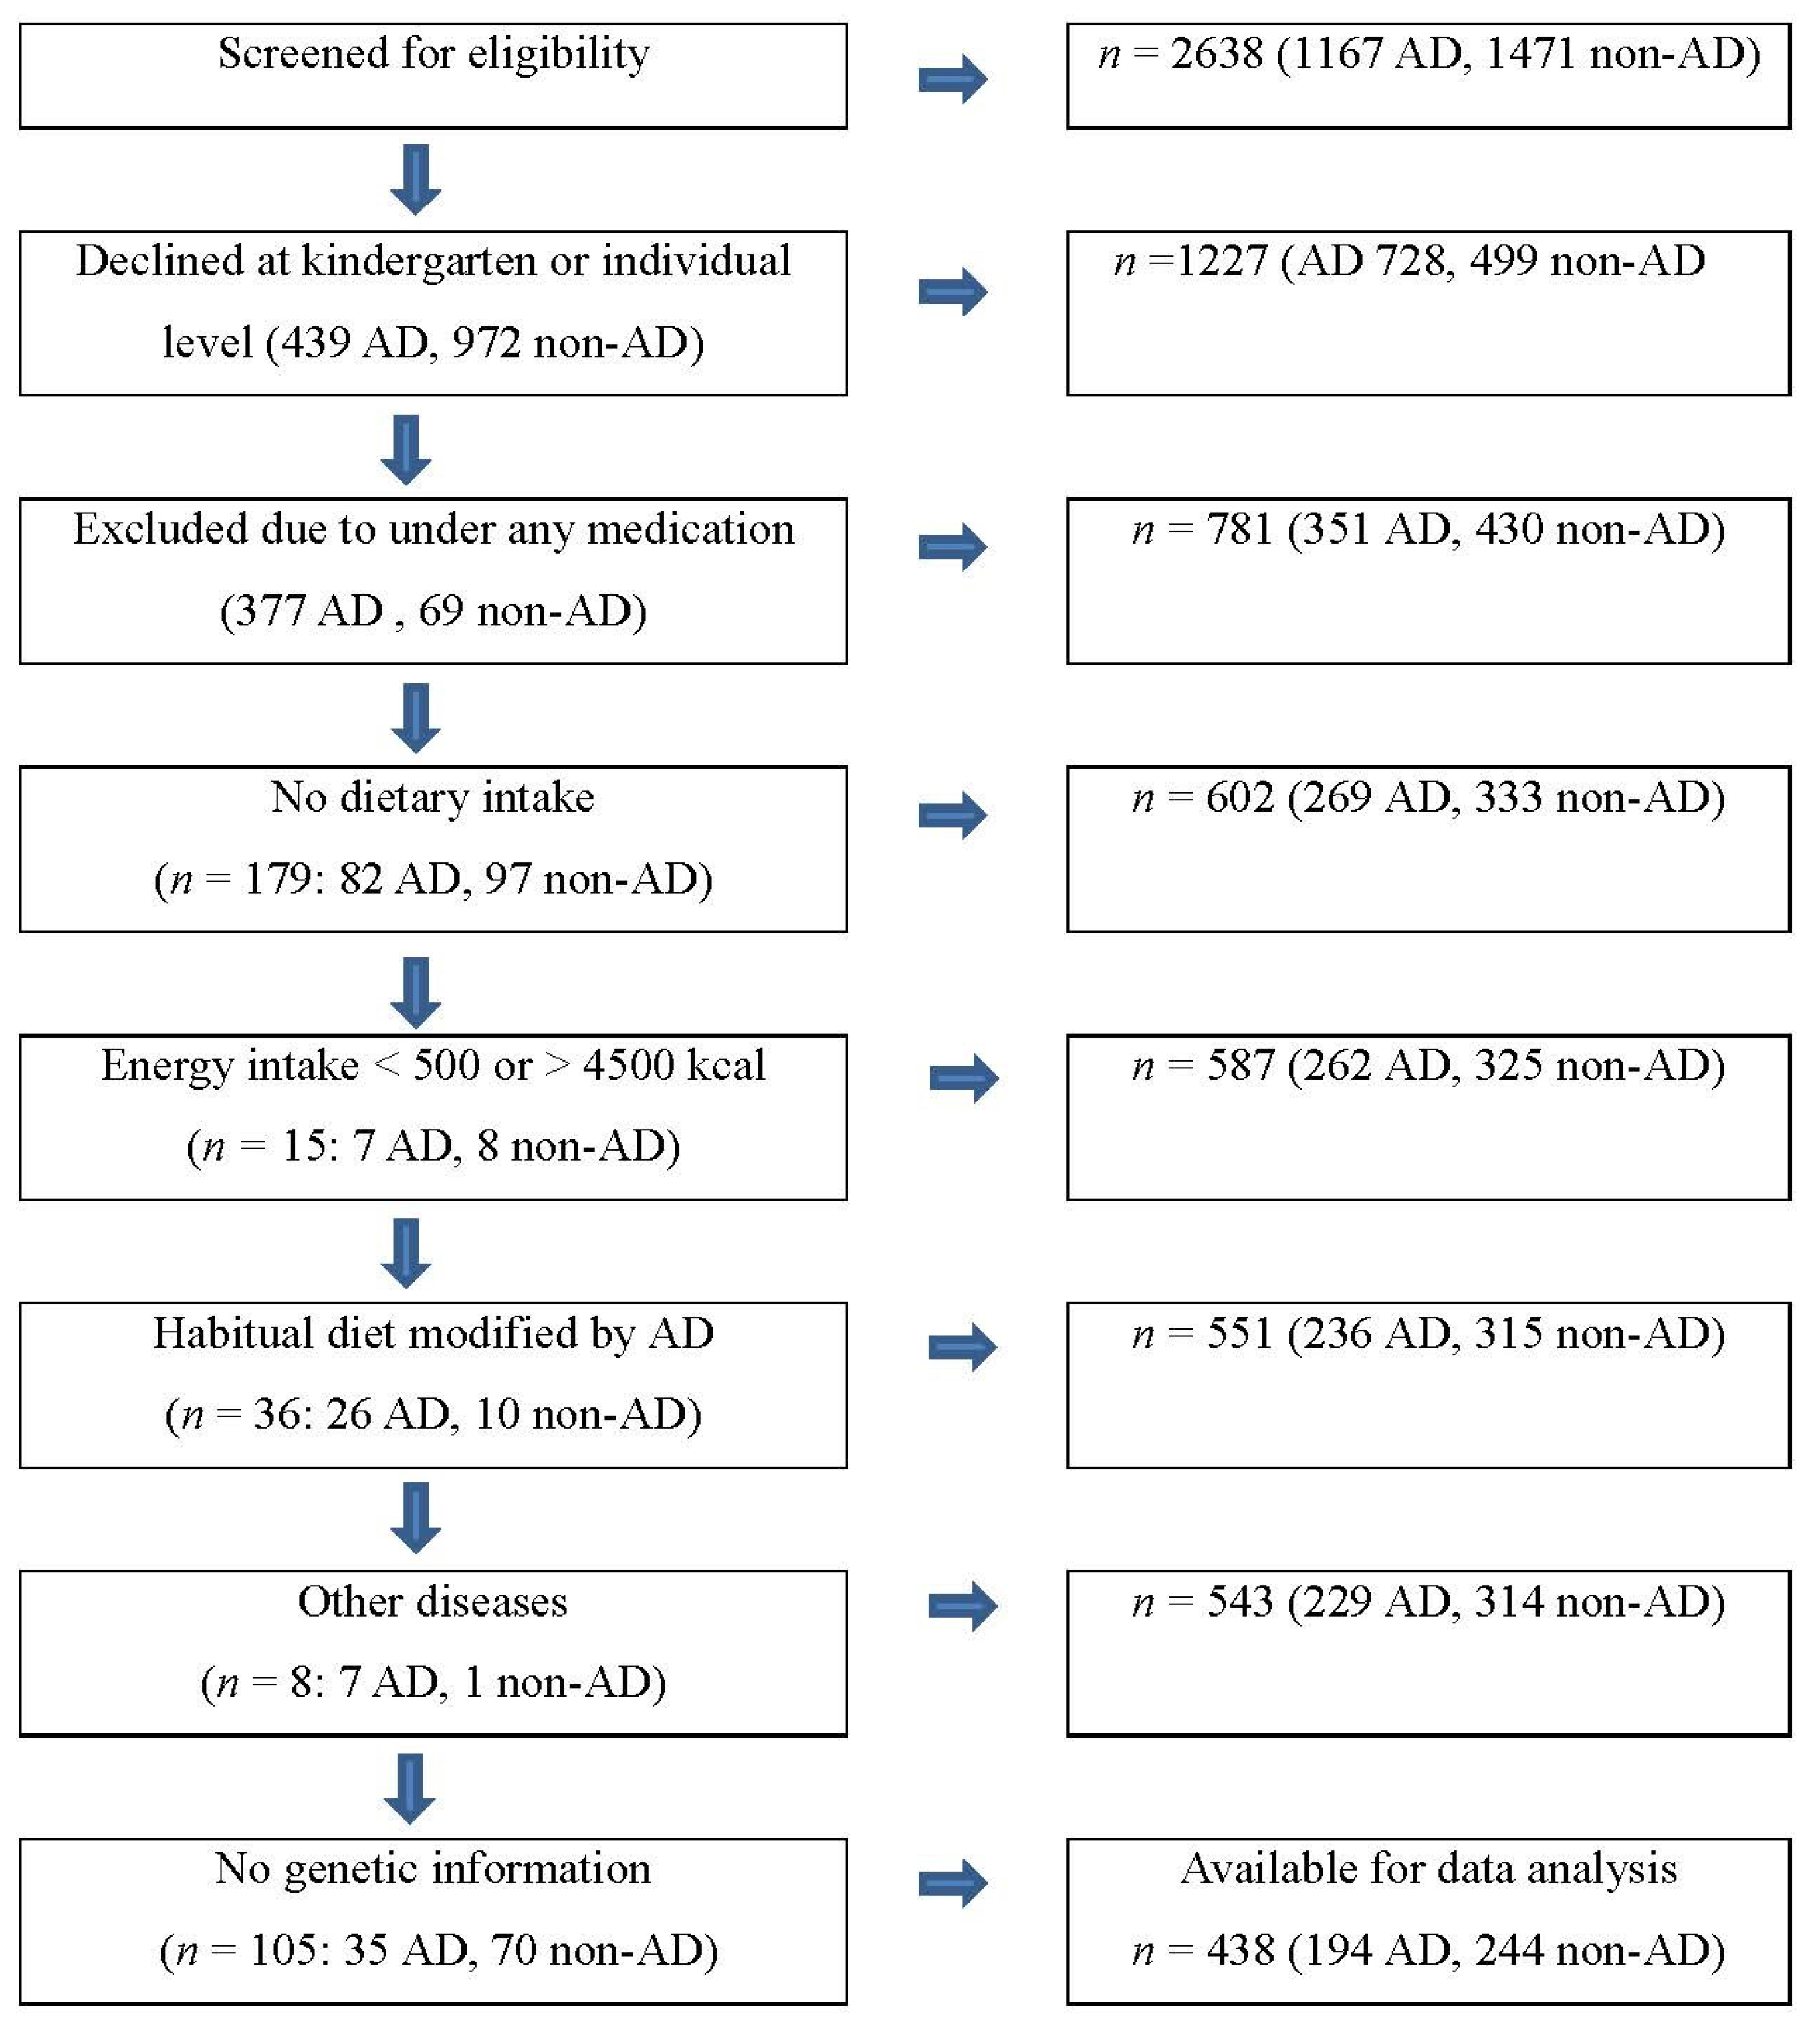
Figure 1, at the beginning, our participants were from a population based and matched case-control study including 781 subjects who were selected by screening eligibility from 2638 preschoolers residing in middle-income areas in large cities in Korea such as Seoul and Incheon between May and July 2006 [
10,
23]. We assessed the child’s AD by the Korean version of ISAAC (The International Study of Asthma and Allergies in Childhood) [
10,
23]. Case subjects were children who had experienced AD symptoms in the form of AD diagnosis or treatment (
n = 351), and controls were matched by the same preschools (
n = 430), considering both age and gender. Of those 781 participants, we excluded 343 children who had no dietary intake variables (
n = 179; 82 AD, 97 non-AD), energy intake less than 500 kcal or greater than 4,500 kcal (
n = 15; 7 AD, 8 non-AD), modified diet by AD (
n = 36; 26 AD, 10 non-AD) or other diseases (
n = 8; 7 AD, 1 non-AD), or no genetic information (
n = 105; 35 AD, 70 non-AD). A total of 438 (194 AD, 244 non-AD) children were included in our data analyses (
Figure 1). Due to the exclusion of a large number of children, we did comparison analysis including the child’s age (5.3
vs. 5.2 years), BMI (15.4
vs. 15.5) and gender (48.3%
vs. 50.3% for girls), as well as household monthly income (38.4%
vs. 33.8% for greater than 4 million Korean Won, close to 4000 US $). There was no significant group difference in these variables (
Supplementary Table S1).
Data on dietary intake, AD, and other related information were collected by questionnaires. Blood samples were taken for the analyses of genetic information and total IgE concentration between September 2006 and January 2007.
Figure 1.
Sample selection process. Atopic Dermatitis (AD).
Figure 1.
Sample selection process. Atopic Dermatitis (AD).
2.2. Dietary Assessment
We assessed dietary intake through a validated semi-quantitative food frequency questionnaire (FFQ) used in other studies [
10,
24]. Reproducibility (
r = 0.5–0.8) and validity (
r = 0.3–0.6) of this instrument were both acceptable [
10,
24]. The FFQ contains 86 food items with nine non-overlapping frequency response categories as well as three portion size options (low 0.5, medium 1, high 1.5). Using CAN PRO II (Computer-Aided Nutritional Analysis Program II), developed by the Korean Nutrition Society, the amount of each food item in the FFQ was converted into grams, after which daily intakes of nutrients were calculated.
To develop dietary patterns for this study group, we used 84 food items, excluding two rarely eaten foods (organ meat and fermented salty fish). From the 84 food items, our analysis consisted of 33 food/food groups based on nutrient profiles of each food item (
Table 1).
Table 1.
Thirty-three food groups used in statistical analyses with factor analysis.
Table 1.
Thirty-three food groups used in statistical analyses with factor analysis.
| Food/Food Group | Food |
|---|
| Beans | Soybean curd (tofu)/curd residue, soybean (boiled with soy sauce), soymilk |
| Beef | Sliced beef with sauces (Galbi, Bulgogi), beef (loin, tender loin), beef soup/beef broiled down in soy |
| Bread | White and dark breads |
| Cereals | Breakfast cereals |
| Cheese | Cheese |
| Chicken | Chicken (fried), chicken (boiled, braised) |
| Chocolate | Chocolate |
| Eggs | Eggs |
| Fast food | Hamburger, pizza, French fries |
| Fats | Butter/margarine, mayonnaise |
| Fresh fish | White fish (pan fried, fried), white fish (grilled, broiled down in soy) blue fish (pan fried, fried), blue fish (grilled, broiled down in soy), squid/octopus, shrimps, clams/oysters |
| Fruit juice | Orange juice, tomato juice, other fruit juices |
| Fruits | Strawberries, apple, pear, mandarin/orange, tomato, banana, melon/muskmelon, watermelon, peaches/plum, grapes |
| Ice cream | Ice cream |
| Kimchi | Korean cabbage kimchi/seasoned cubed radish roots/young radish kimchi, other kinds of kimchi |
| Milk | Whole milk, flavored milk, low fat milk |
| Mulchi | Anchovy (stir-fried) |
| Noodles & Dumplings | Korean style noodles, spaghetti/bean sauce noodles, dumplings |
| Nuts | Nuts |
| Pork | Pork (loin, tender loin, shoulder), pork (belly) |
| Potatoes | Potatoes, sweet potatoes (not fried) |
| Processed fish | Canned tuna, fish paste |
| Processed meat | Ham/sausage |
| Ramyeon | Ramyeon |
| Rice | White rice, other grains |
| Rice cake | Rice cakes |
| Seaweeds | Dried laver, sea mustard |
| Snacks | Chips, crackers |
| Sweet bread | Sweet bread |
| Sweet drinks | Cocoa, soft drinks, sport drinks, traditional sweet drinks |
| Sweets | Candies, jam |
| Vegetables | Lettuce/cabbage (raw), lettuce/cabbage (cooked), radish, bean sprout/mungbean sprout, cucumber, spinach, perilla leaves, unripe hot pepper, onion, carrots, squash, mushrooms, roots of balloon flower/fernbrake |
| Yogurt | Yogurt, yogurt drinks |
2.3. Genotyping
Genotypes for
GSTM1 and
GSTT1 present/null polymorphisms were assessed as described by Chung
et al. [
23]. Genomic DNA was extracted from buffy coats using an AxyPrep™ Blood Genomic DNA miniprep kit (Axygen Biosciences, Union City, CA, USA), after which multiplex PCR analyses were performed. Briefly,
GSTM1,
GSTT1, and β-
globin genes were simultaneously amplified by PCR along with mixed primers for each gene. PCR conditions were as follows: initial denaturation at 94 °C for 3 min, followed by 27 cycles of 94 °C for 30 s, 62 °C for 30 s, and 72 °C for 45 s, and a final extension step of 10 min at 72 °C. After amplification, PCR products were analyzed on a 2% agarose gel and stained with ethidium bromide. The presence or absence of
GSTT1 (480 bp) and
GSTM1 (215 bp) genes was determined in the presence of the control β-
globin gene (268 bp).
2.4. Other Factors
Using a questionnaire, we measured household monthly income, parental education level, and child’s age as continuous variables, and parental allergic history including AD, asthma, or rhinitis, and child’s gender, nutrient supplement intake, and current exposure to smoking at home as categorical variables. Height and weight of children were measured by following recommended standard procedures [
25]. Body mass index (BMI) was calculated by using height and weight measures. Serum total IgE concentrations were determined by EIA (AutoCAP system, Pharmacia, Uppsala, Sweden).
2.5. Statistical Analysis
Based on the 33 food/food groups (
Table 1) with daily intake frequency values per 1000 kcal, we performed factor analysis to develop dietary patterns with varimax rotation [
26]. Three dietary patterns were selected in accordance with the eigenvalue (>1.5), scree plots, and interpretability of factors. We calculated factor loadings for each food/food group across the three dietary factors, and a factor score for each subject obtained for the 33 food/food groups, in which intakes of food groups were weighted by their factor loadings and summed.
We named dietary patterns based on food/food groups with the most positive factor loadings. The “traditional healthy” pattern was identified by considering relatively higher intakes of vegetables, fruits, seaweeds, beans, anchovies, potatoes, fresh fish,
kimchi, and cheese, as well as lower intake of
ramyeon. The “animal foods” pattern was characterized by higher intakes of beef, pork, poultry, fish, and fast foods, in addition to noodles and rice cake. The “sweets” included higher intakes of fruit juice, sweet drinks, chocolate, snacks, and ice cream, but lower intake of rice (
Table 2).
Table 2.
Factor-loading matrix for defining dietary patterns by the factor analysis using 33 food or food group variables (n = 438).
Table 2.
Factor-loading matrix for defining dietary patterns by the factor analysis using 33 food or food group variables (n = 438).
| Food/Food Groups | Traditional Healthy | Animal Foods | Sweets |
|---|
| Vegetables | 0.62 | 0.13 | −0.13 |
| Fruit | 0.58 | −0.01 | 0.18 |
| Seaweeds | 0.48 | 0.06 | −0.02 |
| Beans | 0.44 | 0.01 | 0.10 |
| Mulchi | 0.46 | −0.03 | −0.06 |
| Potatoes | 0.46 | 0.21 | −0.04 |
| Kimchi | 0.38 | −0.08 | −0.22 |
| Fresh fish | 0.37 | 0.21 | −0.10 |
| Ramyeon | −0.35 | 0.29 | −0.17 |
| Noodles and dumplings | −0.21 | 0.52 | 0.03 |
| Bread | 0.04 | 0.49 | 0.12 |
| Rice cake | 0.15 | 0.48 | −0.04 |
| Chicken | −0.07 | 0.47 | −0.02 |
| Fast food | −0.19 | 0.43 | 0.19 |
| Sweet bread | −0.03 | 0.40 | 0.06 |
| Beef | 0.15 | 0.37 | 0.04 |
| Sweets | −0.01 | 0.36 | 0.35 |
| Fats | 0.11 | 0.33 | −0.01 |
| Pork | 0.05 | 0.30 | 0.05 |
| Processed meat | −0.21 | 0.28 | 0.09 |
| Processed fish | 0.09 | 0.25 | 0.01 |
| Milk | 0.01 | −0.34 | 0.19 |
| Fruit juice | 0.24 | 0.01 | 0.50 |
| Sweet drinks | −0.23 | 0.17 | 0.46 |
| Chocolate | −0.14 | 0.14 | 0.46 |
| Snacks | −0.28 | 0.14 | 0.41 |
| Ice cream | 0.02 | 0.06 | 0.38 |
| Cheese | 0.32 | −0.13 | 0.33 |
| Rice | −0.23 | −0.01 | −0.60 |
| Yogurt | 0.20 | −0.23 | 0.29 |
| Eggs | 0.16 | 0.15 | −0.27 |
| Nuts | 0.27 | −0.05 | 0.27 |
| Cereals | −0.04 | 0.02 | 0.16 |
Each dietary pattern was divided into high (Q4) and low (Q1–Q3) groups according to the quartiles of dietary pattern scores. In addition to initial crude models, multivariate logistic regression models were used to estimate the effects of dietary patterns and GST genotypes on AD. As potential residual confounders, parental allergic history, maternal education level, household income, and child’s age, gender, BMI, total energy and nutrient supplement intakes, and secondary smoking exposure had been considered. Among these variables, household income, maternal education level, and child’s secondary smoking exposure were excluded in the analytic model because these variables did not show any significant difference between AD and non-AD groups.
To investigate the association between dietary patterns and AD with respect to GST genotypes, stratified analyses were performed after dividing the subjects into two groups for the GSTM1 and GSTT1 (null and present), and three groups for the GSTM1/T1 (double null, either present, or double present). The stratified analysis by GST genotype was conducted adjusted for the confounders in the corresponding model. Multiplicative interactions were performed using the corresponding models that included the interaction term to examine the modifying effect of GST genotypes on the association between dietary patterns and AD. Results were reported as odds ratios (OR) and 95% confident intervals (CI). Significance was set at p < 0.05. Statistical analyses were conducted with SAS version 9.3 (SAS Institute Inc., Cary, NC, USA).
2.6. Ethics Statement
This study was conducted in accordance with the guidelines detailed in the Declaration of Helsinki, and all procedures involving human subjects were approved by the Institutional Review Board of the College of Human Ecology at Kyung Hee University [
10,
23]. Written informed consent was obtained from all parents of participating children.
3. Results
When we compared the high (Q4) and low (Q1–Q3) groups of dietary patterns, the “traditional healthy” diet was associated with higher intakes of protein, unsaturated fat, and micronutrients (
Table 3). In particular, higher intakes of β–carotene and vitamin C (2.1 and 1.5-fold difference between the high and low groups, respectively) were substantial. The “animal foods” dietary pattern showed higher intakes of macronutrients except for plant protein and saturated fatty acids (SFA), but had no associations with micronutrients excluding vitamin E. The “sweets” diet was relevant to higher intakes of energy, plant fat, SFA, retinol, and vitamin C, as well as a lower intake of plant protein.
When we compared nutrient intakes by AD, AD showed an association with lower intakes of vitamin E, folate, and possibly β-carotene (
Table 4). General characteristics were similar between AD and non-AD children except for child’s total IgE concentration and allergic history of parents (
Table 4). In the AD group, the majority of children (80.4%) showed experience of physician’s diagnosis of AD, followed by AD symptoms (45.8%–49.5%) and AD treatment (22.6%).
The proportions of children with the
null genotype in
GSTM1 and
GSTT1 were close to 60% and 50%, respectively (
Table 5). When the
GSTM1 and
GSTT1 genotypes were combined, about 30% of children carried the
null genotype for both genes. There were no associations of AD with
GST genotypes and dietary patterns in univariate analyses.
In stratified analyses by
GST genotypes (
Table 6), the “traditional healthy” diet and reduced AD showed association only in the
GSTM1-present group (OR 0.31, 95% CI 0.13–0.75). A similar pattern of the association existed in the combined
GSTM1/T1 genotype, which indicated an inverse association between the “traditional healthy” diet and AD in the double
GSTM1/T1-present genotype group (OR 0.24, 95% CI 0.06–0.93). There was a stronger association between the “traditional healthy” diet and AD (7%) in the
GSTM1/T1 double
present group (OR 0.24) than the case of
GSTM1-present (OR 0.31) group. Results from the multiplicative test analyses showed that the “traditional healthy” diet on reduced AD was significant or borderline significant in the
GSTM1-present group (OR 0.71, 95% CI 0.54–0.92
vs. GSTM1-null group) or the
GSTM1/T1 double
present group (OR 0.63, 95% CI 0.39–1.03
vs. GSTM1/T1 double
null group). These associations did not exist in the “animal foods” and “sweets” dietary patterns.
Table 3.
Associations of daily nutrient intakes with dietary patterns between the low (Q1–Q3, n = 329) and high (Q4, n = 109) groups *.
Table 3.
Associations of daily nutrient intakes with dietary patterns between the low (Q1–Q3, n = 329) and high (Q4, n = 109) groups *.
| Nutrient | Traditional Healthy | Animal Foods | Sweets |
|---|
| Low (Q1–Q3) | High (Q4) | p | Low (Q1–Q3) | High (Q4) | p | Low (Q1–Q3) | High (Q4) | p |
|---|
| Mean | SE | Mean | SE | Mean | SE | Mean | SE | Mean | SE | Mean | SE |
|---|
| Energy (kJ) | 1556.3 | 37.1 | 1511.9 | 64.5 | 0.551 | 1583.0 | 37.0 | 1431.4 | 64.2 | 0.041 | 1497.5 | 36.8 | 1689.3 | 64.0 | 0.010 |
| Animal protein (g) | 32.0 | 0.6 | 39.3 | 1.1 | <.0.001 | 32.8 | 0.6 | 36.8 | 1.1 | 0.003 | 33.9 | 0.7 | 33.4 | 1.1 | 0.706 |
| Plant protein (g) | 22.6 | 0.3 | 23.8 | 0.5 | 0.048 | 23.1 | 0.3 | 22.5 | 0.5 | 0.363 | 23.7 | 0.3 | 20.5 | 0.5 | <0.001 |
| Animal fat (g) | 28.0 | 0.6 | 32.6 | 1.1 | <0.001 | 28.4 | 0.6 | 31.5 | 1.1 | 0.011 | 28.7 | 0.6 | 30.5 | 1.1 | 0.140 |
| Plant fat (g) | 18.5 | 0.4 | 20.8 | 0.7 | 0.004 | 18.0 | 0.4 | 22.4 | 0.7 | <0.001 | 17.9 | 0.4 | 22.8 | 0.7 | <0.001 |
| Vitamin A (μg, RE) | 413.6 | 10.3 | 652.4 | 17.8 | <0.001 | 481.1 | 11.7 | 448.7 | 20.4 | 0.170 | 459.9 | 11.7 | 512.8 | 20.4 | 0.025 |
| Retinol (μg) | 229.5 | 5.7 | 258.5 | 9.9 | 0.012 | 240.8 | 5.7 | 224.4 | 10.0 | 0.157 | 216.3 | 5.4 | 298.2 | 9.5 | <0.001 |
| β-carotene (μg) | 1247.3 | 55.0 | 2561.9 | 95.6 | <0.001 | 1598.4 | 63.4 | 1502.3 | 110.4 | 0.452 | 1560.3 | 63.5 | 1617.3 | 110.7 | 0.656 |
| Vitamin C (mg) | 65.3 | 2.3 | 97.3 | 4.0 | <0.001 | 73.8 | 2.4 | 71.6 | 4.2 | 0.659 | 65.6 | 2.3 | 96.4 | 4.0 | <0.001 |
| Folate (μg) | 172.1 | 2.8 | 231.4 | 4.9 | <0.001 | 188.7 | 3.1 | 181.3 | 5.5 | 0.242 | 186.6 | 3.2 | 187.8 | 5.5 | 0.855 |
| Vitamin E (mg, α-TE) | 8.5 | 0.2 | 12.3 | 0.4 | <0.001 | 8.7 | 0.2 | 11.6 | 0.4 | <0.001 | 9.5 | 0.2 | 9.2 | 0.4 | 0.513 |
| Saturated fatty acids (g) | 12.1 | 0.3 | 13.1 | 0.6 | 0.131 | 12.5 | 0.3 | 11.9 | 0.6 | 0.326 | 11.9 | 0.3 | 13.8 | 0.6 | 0.004 |
| Monounsaturated fatty acids (g) | 8.0 | 0.2 | 9.7 | 0.4 | <0.001 | 8.1 | 0.2 | 9.4 | 0.4 | 0.003 | 8.3 | 0.2 | 8.8 | 0.4 | 0.224 |
| Polyunsaturated fatty acids (g) | 3.9 | 0.1 | 5.5 | 0.2 | <0.001 | 4.0 | 0.1 | 5.2 | 0.2 | <0.001 | 4.3 | 0.1 | 4.2 | 0.2 | 0.749 |
Table 4.
Associations of nutrient intakes and general characteristics with atopic dermatitis (AD) in young children.
Table 4.
Associations of nutrient intakes and general characteristics with atopic dermatitis (AD) in young children.
| | AD (n = 194) | Non-AD (n = 244) | p * |
|---|
| Mean | SD | Mean | SD |
|---|
| Age (year) | 5.4 | 1.2 | 5.3 | 1.3 | 0.270 |
| BMI (kg/m2) | 18.3 | 3.5 | 17.9 | 3.4 | 0.260 |
| Birth weight (kg) | 3.3 | 0.7 | 3.3 | 0.8 | 0.876 |
| Daily nutrient intake | | | | | |
| Energy (kJ) | 6305.2 | 2622.3 | 6592.8 | 2957.5 | 0.289 |
| Animal protein (g) | 31.8 | 18.6 | 35.4 | 23.3 | 0.073 |
| Plant protein (g) | 22.4 | 9.4 | 23.3 | 10.2 | 0.324 |
| Animal fat (g) | 27.5 | 16.8 | 30.5 | 21.0 | 0.095 |
| Plant fat (g) | 18.2 | 10.5 | 19.8 | 11.9 | 0.130 |
| Vitamin A (μg RE) | 442.5 | 274.3 | 497.3 | 321.0 | 0.055 |
| Retinol (μg) | 231 | 158.8 | 241.2 | 161.8 | 0.509 |
| β-carotene (μg) | 1442.2 | 1244.3 | 1679.6 | 1397.8 | 0.065 |
| Vitamin C (mg) | 69.3 | 57.1 | 76.4 | 61.8 | 0.217 |
| Folate (μg) | 173.8 | 88.0 | 197.3 | 106.5 | 0.012 |
| Vitamin E (mg α-TE) | 8.5 | 5.3 | 10.2 | 7.4 | 0.005 |
| Saturated fatty acids (g) | 11.9 | 7.8 | 12.7 | 9.1 | 0.357 |
| Monounsaturated fatty acids (g) | 7.8 | 4.6 | 8.8 | 6.8 | 0.072 |
| Polyunsaturated fatty acids (g) | 3.9 | 2.4 | 4.6 | 3.5 | 0.009 |
| Total IgE (U/mL) † | 325.8 | 617.2 | 187.7 | 307.9 | 0.006 |
| | n | (%) | n | (%) | |
| Gender (boys) | 103 | (53.4) | 123 | (50.4) | 0.539 |
| AD status ‡ | | | | | |
| Symptoms (n = 192) | 88 | 45.8 | | | |
| Itchy rash in the last year (n = 180) | 89 | 49.5 | | | |
| Diagnosis by physician (n = 194) | 156 | 80.4 | | | |
| Treatment (n = 190) | 43 | 22.6 | | | |
| Current exposure to smoking at home | 31 | (17.0) | 35 | (15.4) | 0.645 |
| Supplementary multivitamin use | 80 | (46.0) | 110 | (48.9) | 0.564 |
| Household income (104 Won/mo) § | | | | | |
| <200 | 28 | (15.0) | 30 | (12.7) | 0.733 |
| 200–399 | 90 | (48.1) | 113 | (47.7) | |
| ≥400 | 69 | (36.9) | 94 | (39.7) | |
| Maternal educational level (≥16 year) | 86 | (44.8) | 99 | (40.7) | 0.396 |
| Allergic history of mother | | | | | |
| Asthma | 9 | (4.6) | 13 | (5.3) | 0.743 |
| Rhinitis | 46 | (23.7) | 57 | (23.4) | 0.932 |
| AD | 26 | (13.4) | 14 | (5.7) | 0.006 |
| Allergic history of father | | | | | |
| Asthma | 9 | (4.6) | 6 | (2.5) | 0.213 |
| Rhinitis | 47 | (24.2) | 35 | (14.3) | 0.008 |
| AD | 22 | (11.3) | 17 | (7.0) | 0.110 |
Table 5.
Associations of the glutathione S-transferase M1 (GSTM1) and T1 (GSTT1) genotypes and dietary patterns with atopic dermatitis (AD).
Table 5.
Associations of the glutathione S-transferase M1 (GSTM1) and T1 (GSTT1) genotypes and dietary patterns with atopic dermatitis (AD).
| | AD | Non-AD | p * |
|---|
| n | % | n | % |
|---|
| Genotypes | | | | | |
| GSTM1 | | | | | 0.466 |
| Null | 118 | 60.8 | 140 | 57.4 | |
| Present | 76 | 39.2 | 104 | 42.6 | |
| GSTT1 | | | | | 0.686 |
| Null | 98 | 50.5 | 128 | 52.5 | |
| Present | 96 | 49.5 | 116 | 47.5 | |
| GSTM1/GSTT1 | | | | | 0.638 |
| Double null | 57 | 29.4 | 75 | 30.7 | |
| Either null | 102 | 52.6 | 118 | 48.4 | |
| Double present | 35 | 18.0 | 51 | 20.9 | |
| Dietary patterns | | | | | |
| Traditional healthy | | | | | 0.466 |
| Low (Q1-Q3) | 149 | 45.3 | 180 | 54.7 | |
| High (Q4) | 45 | 41.3 | 64 | 58.7 | |
| Animal foods | | | | | 0.873 |
| Low (Q1-Q3) | 145 | 44.1 | 184 | 55.9 | |
| High (Q4) | 49 | 45.0 | 60 | 55.0 | |
| Sweets | | | | | 0.776 |
| Low (Q1-Q3) | 147 | 44.7 | 182 | 55.3 | |
| High (Q4) | 47 | 43.1 | 62 | 56.9 | |
Table 6.
Association between dietary pattern and atopic dermatitis (AD) by of the glutathione S-transferase M1 (GSTM1) and /or T1 (GSTT1) genotypes (n = 438) *.
Table 6.
Association between dietary pattern and atopic dermatitis (AD) by of the glutathione S-transferase M1 (GSTM1) and /or T1 (GSTT1) genotypes (n = 438) *.
| | AD vs. Non AD |
|---|
| aOR | 95% CI | p for Chi-Square † | aOR | 95% CI | p for Interaction ‡ |
|---|
| Tradition healthy | | | | | | |
| GSTM1 | | | | | | |
| Null | 1.24 | (0.68, 2.26) | 0.495 | 1 | | |
| Present | 0.31 | (0.13, 0.75) | 0.009 | 0.71 | (0.54, 0.92) | 0.011 |
| GSTT1 | | | | | | |
| Null | 0.67 | (0.34, 1.30) | 0.239 | 1 | | |
| Present | 0.90 | (0.45, 1.81) | 0.788 | 1.08 | (0.85, 1.37) | 0.542 |
| GSTM1/GSTT1 | | | | | | |
| Double null | 0.93 | (0.41, 2.13) | 0.881 | 1 | | |
| Either null | 0.97 | (0.49, 1.90) | 0.931 | 1.27 | (0.90.1.37) | 0.176 |
| Double present | 0.24 | (0.06, 0.93) | 0.039 | 0.63 | (0.39, 1.03) | 0.065 |
| Animal foods | | | | | | |
| GSTM1 | | | | | | |
| Null | 1.07 | (0.56, 2.08) | 0.843 | 1 | | |
| Present | 1.25 | (0.62, 2.52) | 0.550 | 1.04 | (0.82, 1.32) | 0.760 |
| GSTT1 | | | | | | |
| Null | 1.07 | (0.55, 2.07) | 0.861 | 1 | | |
| Present | 1.18 | (0.60, 2.32) | 0.649 | 1.03 | (0.81, 1.30) | 0.836 |
| GSTM1/GSTT1 | | | | | | |
| Double null | 1.18 | (0.47, 2.98) | 0.741 | 1 | | |
| Either null | 0.95 | (0.49, 1.84) | 0.891 | 0.88 | (0.64, 1.21) | 0.423 |
| Double present | 1.68 | (0.60, 4.68) | 0.329 | 1.17 | (0.79. 1.72) | 0.441 |
| Sweets | | | | | | |
| GSTM1 | | | | | | |
| Null | 0.68 | (0.36, 1.26) | 0.220 | 1 | | |
| Present | 1.53 | (0.73, 3.20) | 0.266 | 1.23 | (0.96, 1.56) | 0.098 |
| GSTT1 | | | | | | |
| Null | 0.85 | (0.42, 1.73) | 0.665 | | | |
| Present | 1.02 | (0.54, 1.93) | 0.963 | 1.05 | (0.82,1.33) | 0.712 |
| GSTM1/GSTT1 | | | | | | |
| Double null | 0.59 | (0.24, 1.44) | 0.247 | 1 | | |
| Either null | 1.04 | (0.52, 2.10) | 0.920 | 1.02 | (0.74, 1.41) | 0.897 |
| Double present | 1.62 | (0.61, 4.33) | 0.343 | 1.27 | (0.87, 1.86) | 0.212 |
4. Discussion
Our findings suggest the association between the “traditional healthy” diet and reduced AD in children with the GSTM1-present genotype, and that children with GSTT1-present genotype may be more susceptible to this association. Such associations may not be relevant to an inactive GST allele such as the GST-null genotype.
Despite a lack of clear explanation, the absence of an association of the
GSTM1- or
GSTT1-null genotype with dietary components may suggest that certain polyphenols and carotenoids induce the expression of
GST genes and increase the activities of
GST enzymes [
27,
28,
29]. Thus, the lack of an active
GST allele would inhibit the response to dietary components that affect the expression of
GST genes. Similar to our findings, a recent human intervention study [
30] reported that a high-fruit juice and vegetable diet significantly increased erythrocyte
GST activities and antioxidant capacity-related biomarker levels in blood from
GSTM1- and
GSTT1-present participants, whereas blood from
GSTM1- and
GSTT1-null participants was unaffected. Even though the interactions of
GST genotypes and diet in relation to AD have not been studied yet, previous reports [
31,
32] that examined these interactions in other diseases support our findings. Specifically, a significant inverse association between intake of carotenoid-rich or cruciferous vegetables and cancer risk was detected in carriers of the
GSTM1- or
GSTT1-present genotype but not in those participants with the
GSTM1- or
GSTT1-null genotype. These results, as well as our findings, suggest that carriers of the
GSTM1- or
GSTT1-present genotype may be more responsive to dietary changes and could benefit more from healthy dietary patterns.
There have been conflicting reports on the association of
GST present/null genotypes with AD [
21,
22,
33]. Consistent with our results, the
GSTM1-present genotype has been reported to be relevant to AD only in the presence of specific environmental stimuli (prenatal smoke exposure) [
34]. Detection of these gene-diet interactions suggests that it is important to determine the effects of gene polymorphisms as well as appropriate dietary information in order to account for the heterogeneity of previous findings. Further, unlike genetic determinants, diet can be modified by lifestyle intervention. Therefore, understanding the interactions between genetic and dietary factors is valuable in establishing dietary guidelines to reduce disease risk.
Several studies [
10,
35,
36,
37,
38] have shown the association between nutrient/food intakes and AD, but little is known regarding specific dietary patterns relevant to AD in relation to
GST genes. Dietary pattern analysis considers the effects of the whole diet, including interactions and synergistic effects among nutrients and foods [
39]. As nutrients and foods are not consumed in isolation, dietary patterns more accurately reflect eating habits than nutrient intake levels. The “traditional healthy” pattern that showed a positive impact on reduced AD in this study is somewhat similar to the “Mediterranean diet”, which mainly involves higher intakes of micronutrients [
40]. Adherence to a “Mediterranean diet” during pregnancy has been demonstrated as a protective factor against atopy until an age of 6.5 years (OR 0.55, 95% CI 0.31–0.97) [
41]. On the other hand, no association between the “Mediterranean diet” and AD has been reported in 6 to 7-year-old school children in Spain [
42]. This discrepancy may be explained in part by a function of effect modifiers, like
GST genes that we found in this study.
The limitations of this study are as follows. We assessed AD based on subjective measures without considering objective indices, although the ISAAC questionnaire used in this study is an internationally standardized protocol and has been widely used to determine the prevalence of allergic diseases in Korea [
2,
10,
43]. Another limitation would be small sample size to identify a diet-gene interaction against AD. We determined sample size at the beginning of this study based on antioxidant nutrients and AD, but with little consideration of genetic characteristics. Possibly meaningful, but unmeasured or unexamined variables such as heavy metals [
44] and other genes may also limit our findings [
45,
46].
Regardless of these limitations, this study of gene-diet interaction in AD is meaningful because it is the first study to suggest the importance of genetic susceptibility that could play a crucial role in the “traditional healthy” diet on a child’s AD. A large scale prospective study is needed to confirm these findings.

