Synergistic Effects of Human Milk Nutrients in the Support of Infant Recognition Memory: An Observational Study


Abstract
:1. Introduction
2. Experimental Section
2.1. Participants
2.2. Study Design
2.2.1. Milk Collection
2.2.2. Fatty Acid Quantification
2.2.3. Choline and Betaine Quantification
2.2.4. Lutein Quantification
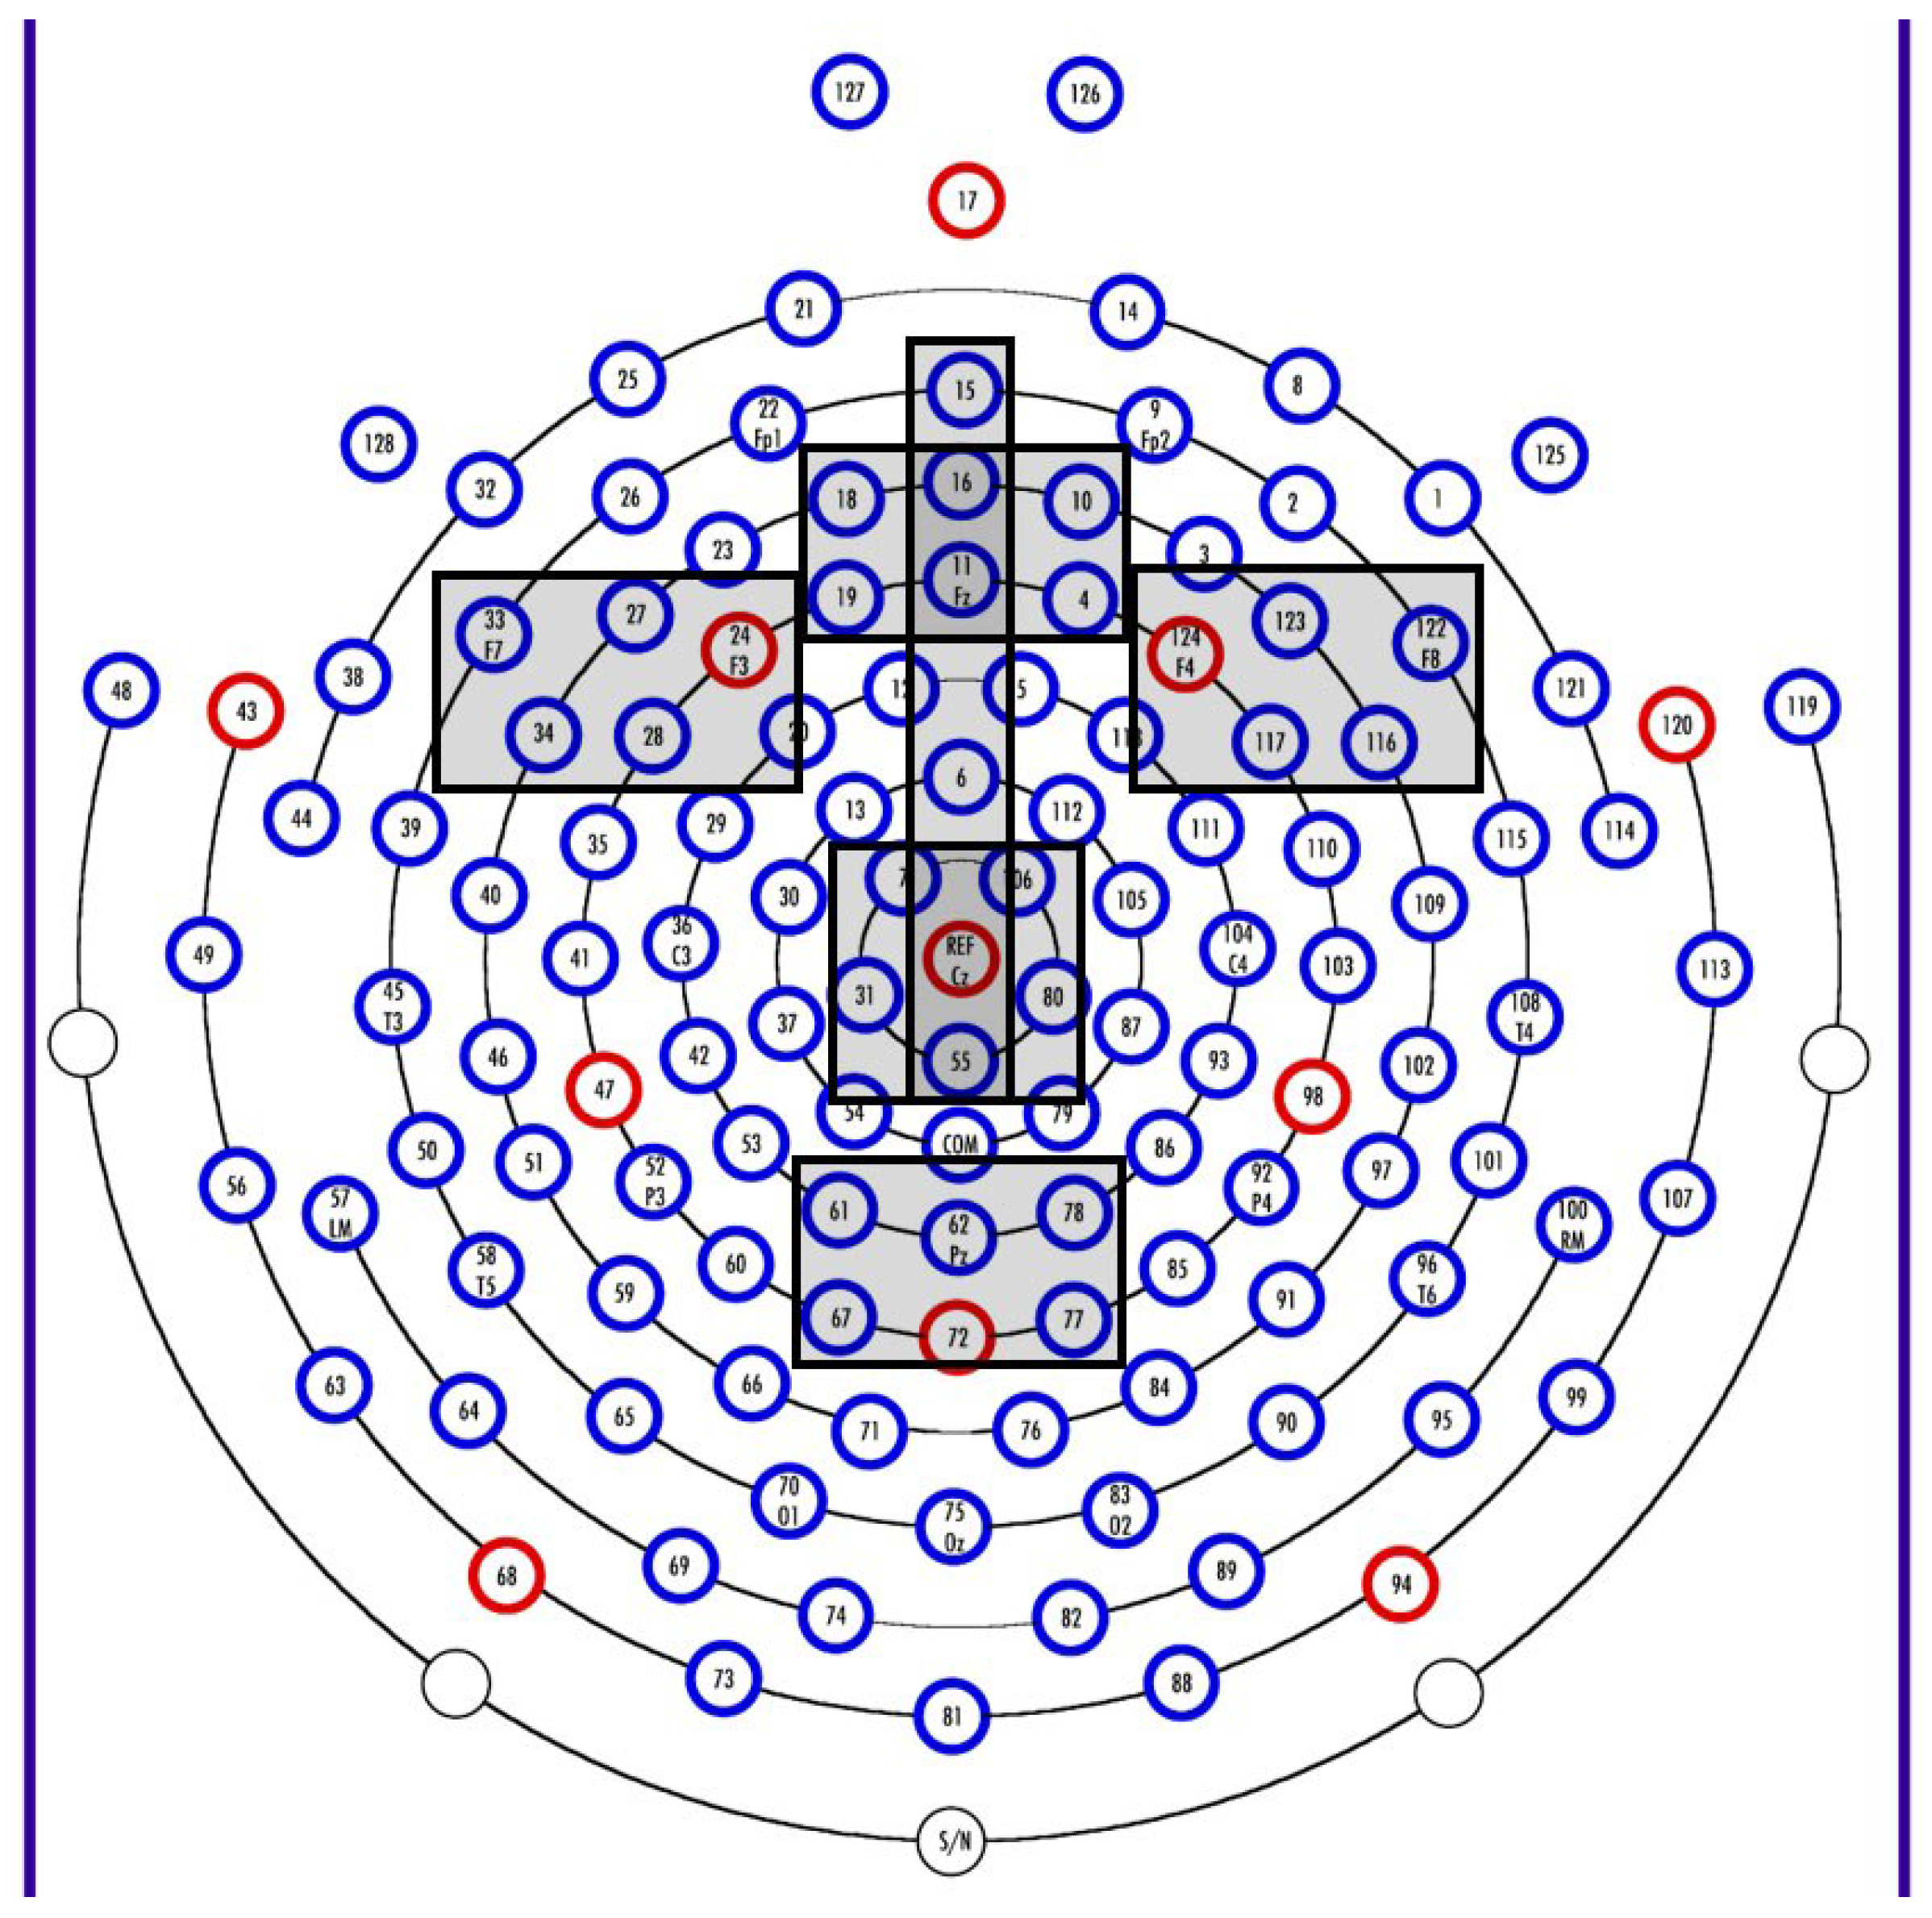
2.2.5. Electrophysiology Methods
2.2.6. Stimuli
2.3. Data Reduction and Analyses
2.3.1. Nutrients
2.3.2. Electrophysiological Data

2.3.3. Data Analyses
3. Results

| N | Minimum | Maximum | Mean | SD | |
|---|---|---|---|---|---|
| Infant age at sample (mo) | 67 | 3.0 | 5.8 | 3.7 | 0.63 |
| Infant age at test (mo) | 67 | 5.9 | 6.4 | 6.1 | 0.09 |
| Maternal education (yrs) | 67 | 12 | 20 | 16.4 | 1.63 |
| Head circumference (6 mo; cm) | 67 | 41.0 | 46.5 | 43.4 | 1.18 |
| DHA (g/100g) | 61 | 0.08 | 1.07 | 0.26 | 0.18 |
| Free choline (umol/L) | 60 | 23.0 | 326.9 | 158.4 | 68.85 |
| Lutein (mcg/L) | 62 | 0.0 | 52.6 | 18.4 | 14.85 |
| Lead Grouping | Variable | β | SE | t-Value | p-Value | Model R-Square |
|---|---|---|---|---|---|---|
| Frontal Z | Intercept | −23.11 | 144.14 | −0.16 | 0.87 | 0.04 |
| DHA | 2.19 | 4.51 | 0.49 | 0.63 | ||
| Choline | 0.58 | 0.74 | 0.78 | 0.44 | ||
| Lutein | −1.16 | 6.23 | −0.18 | 0.86 | ||
| DHA X Choline | −0.02 | 0.03 | −0.82 | 0.41 | ||
| DHA X Lutein | 0.02 | 0.07 | 0.24 | 0.81 | ||
| Lutein X Choline | −0.001 | 0.03 | −0.02 | 0.98 | ||
| Frontal Right | Intercept | −144.48 | 152.55 | −0.95 | 0.34 | 0.14 |
| DHA | 5.55 | 4.77 | 1.16 | 0.25 | ||
| Choline | 1.57 | 0.79 | 2.00 | 0.05 * | ||
| Lutein | −6.77 | 6.68 | −1.01 | 0.32 | ||
| DHA X Choline | −0.04 | 0.03 | −1.69 | 0.10 | ||
| DHA X Lutein | 0.04 | 0.07 | 0.55 | 0.59 | ||
| Lutein X Choline | 0.02 | 0.03 | 0.52 | 0.60 | ||
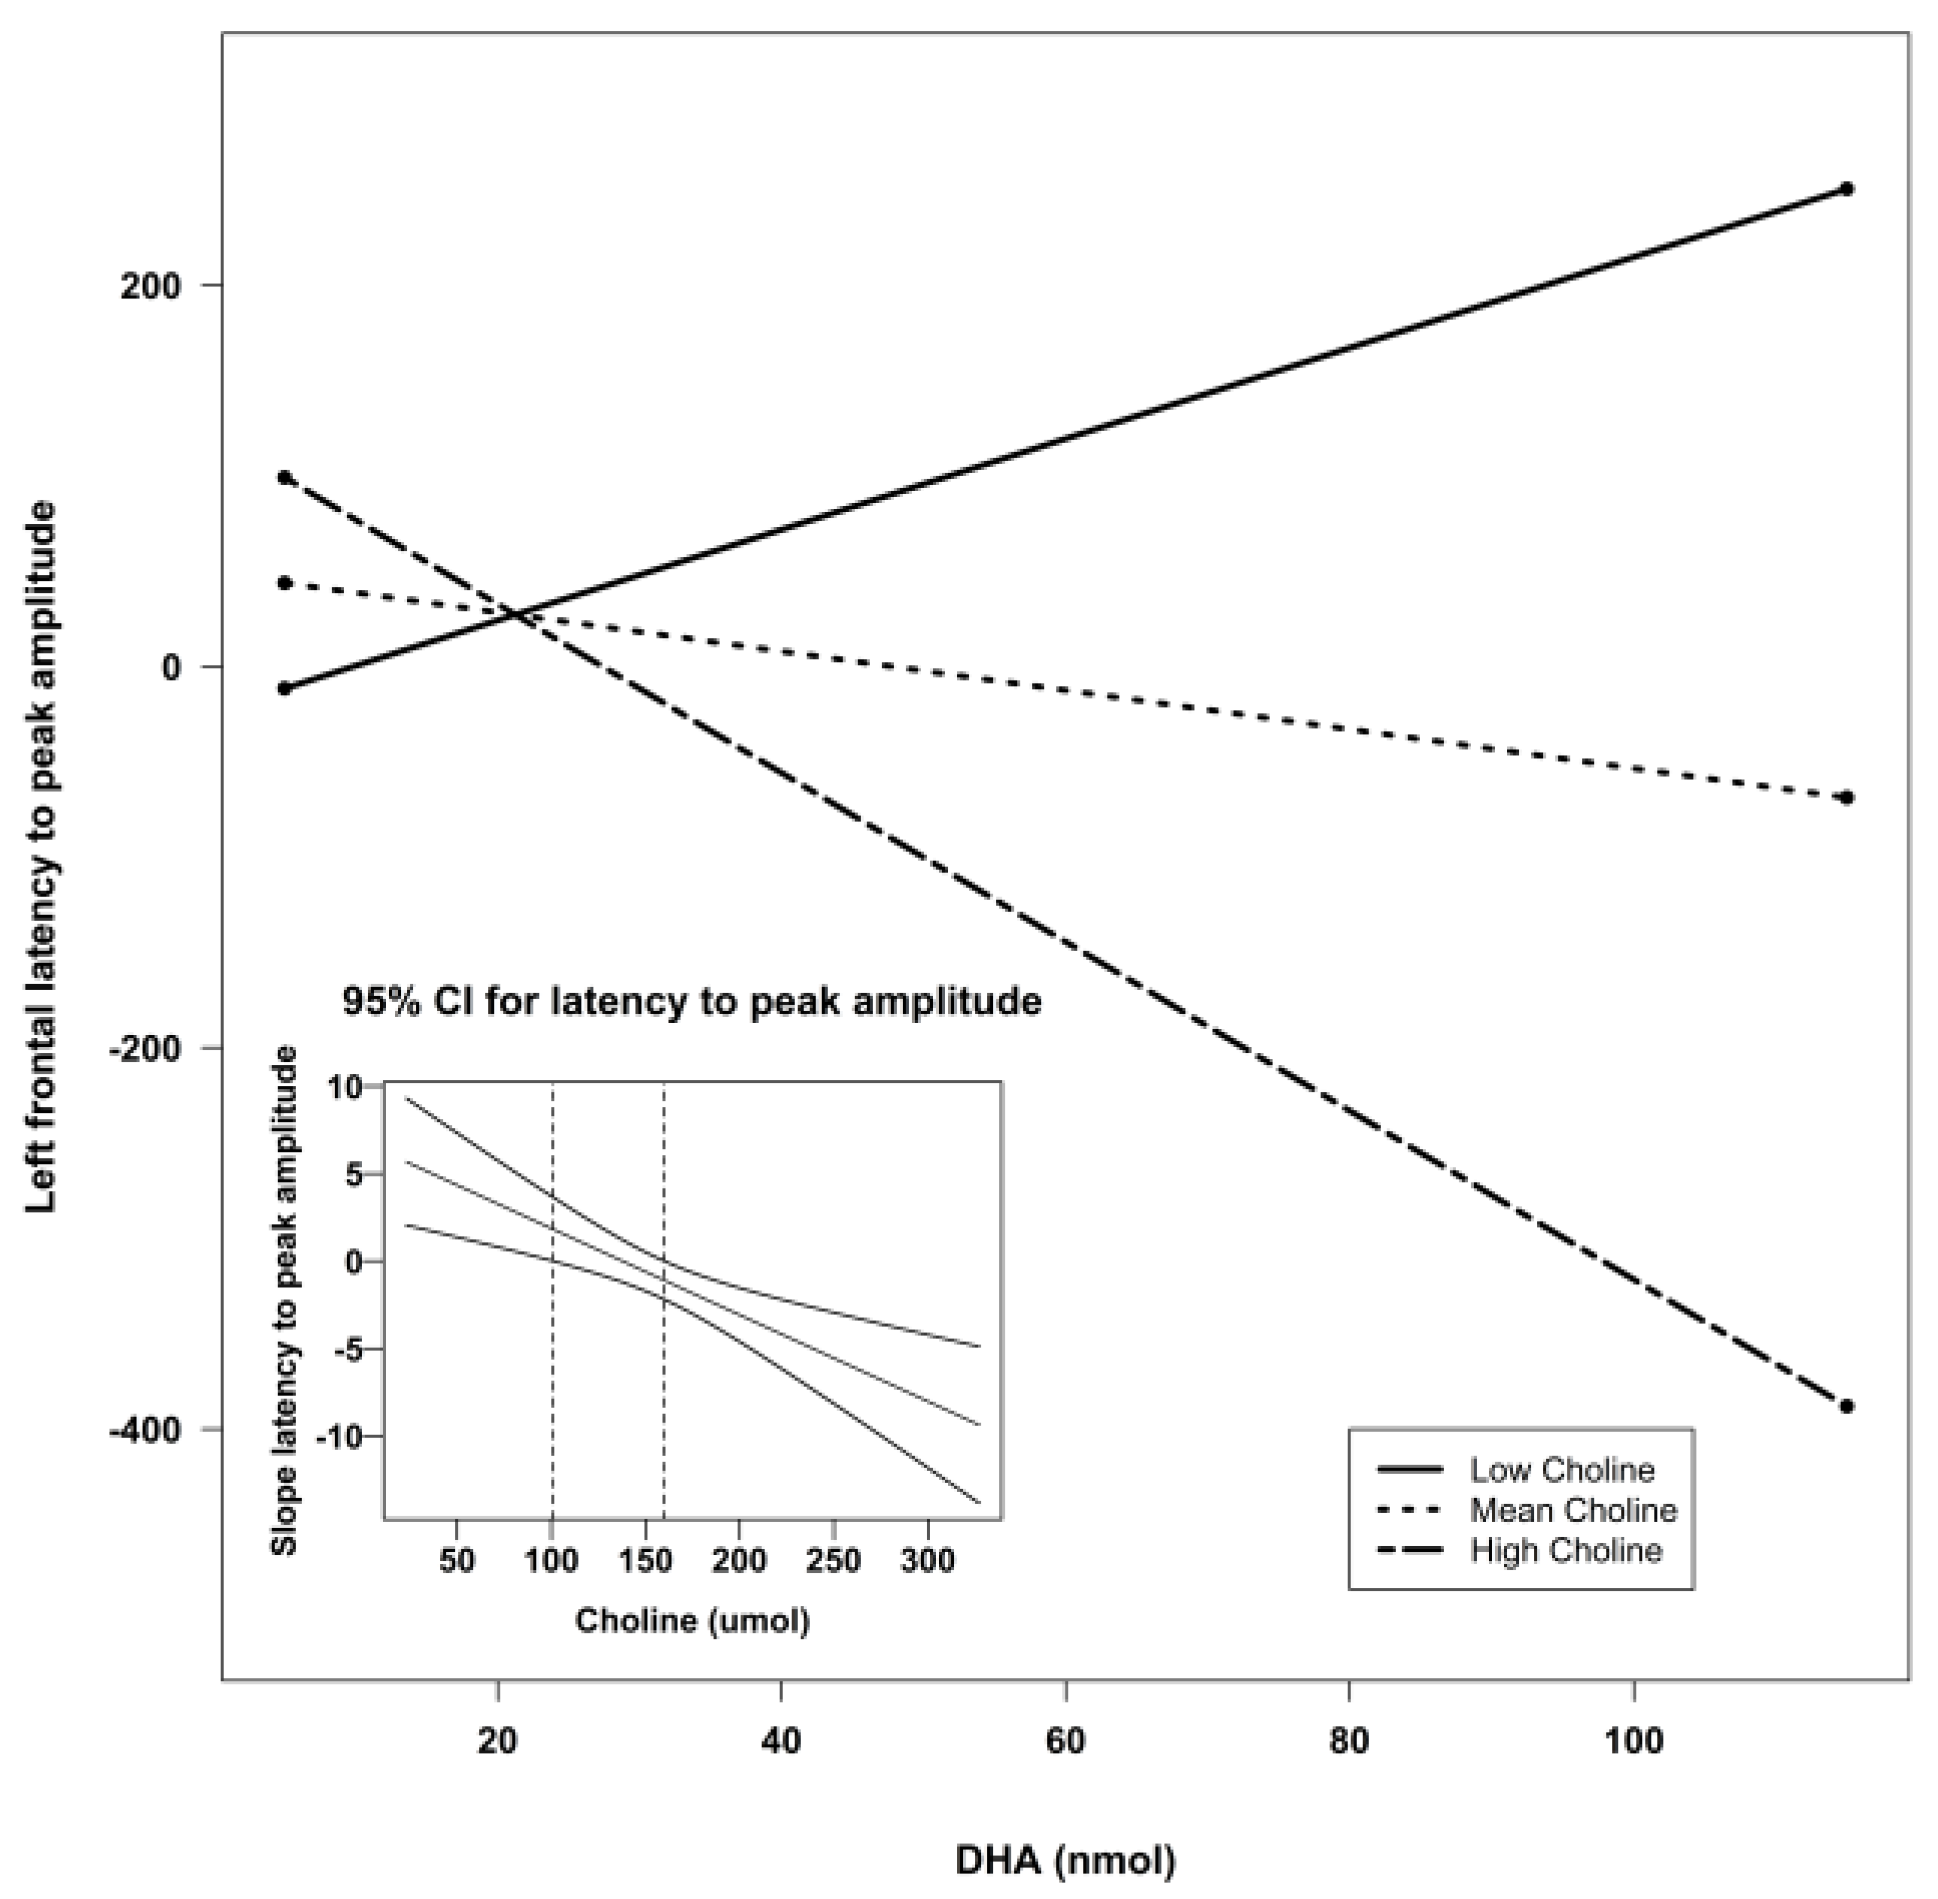
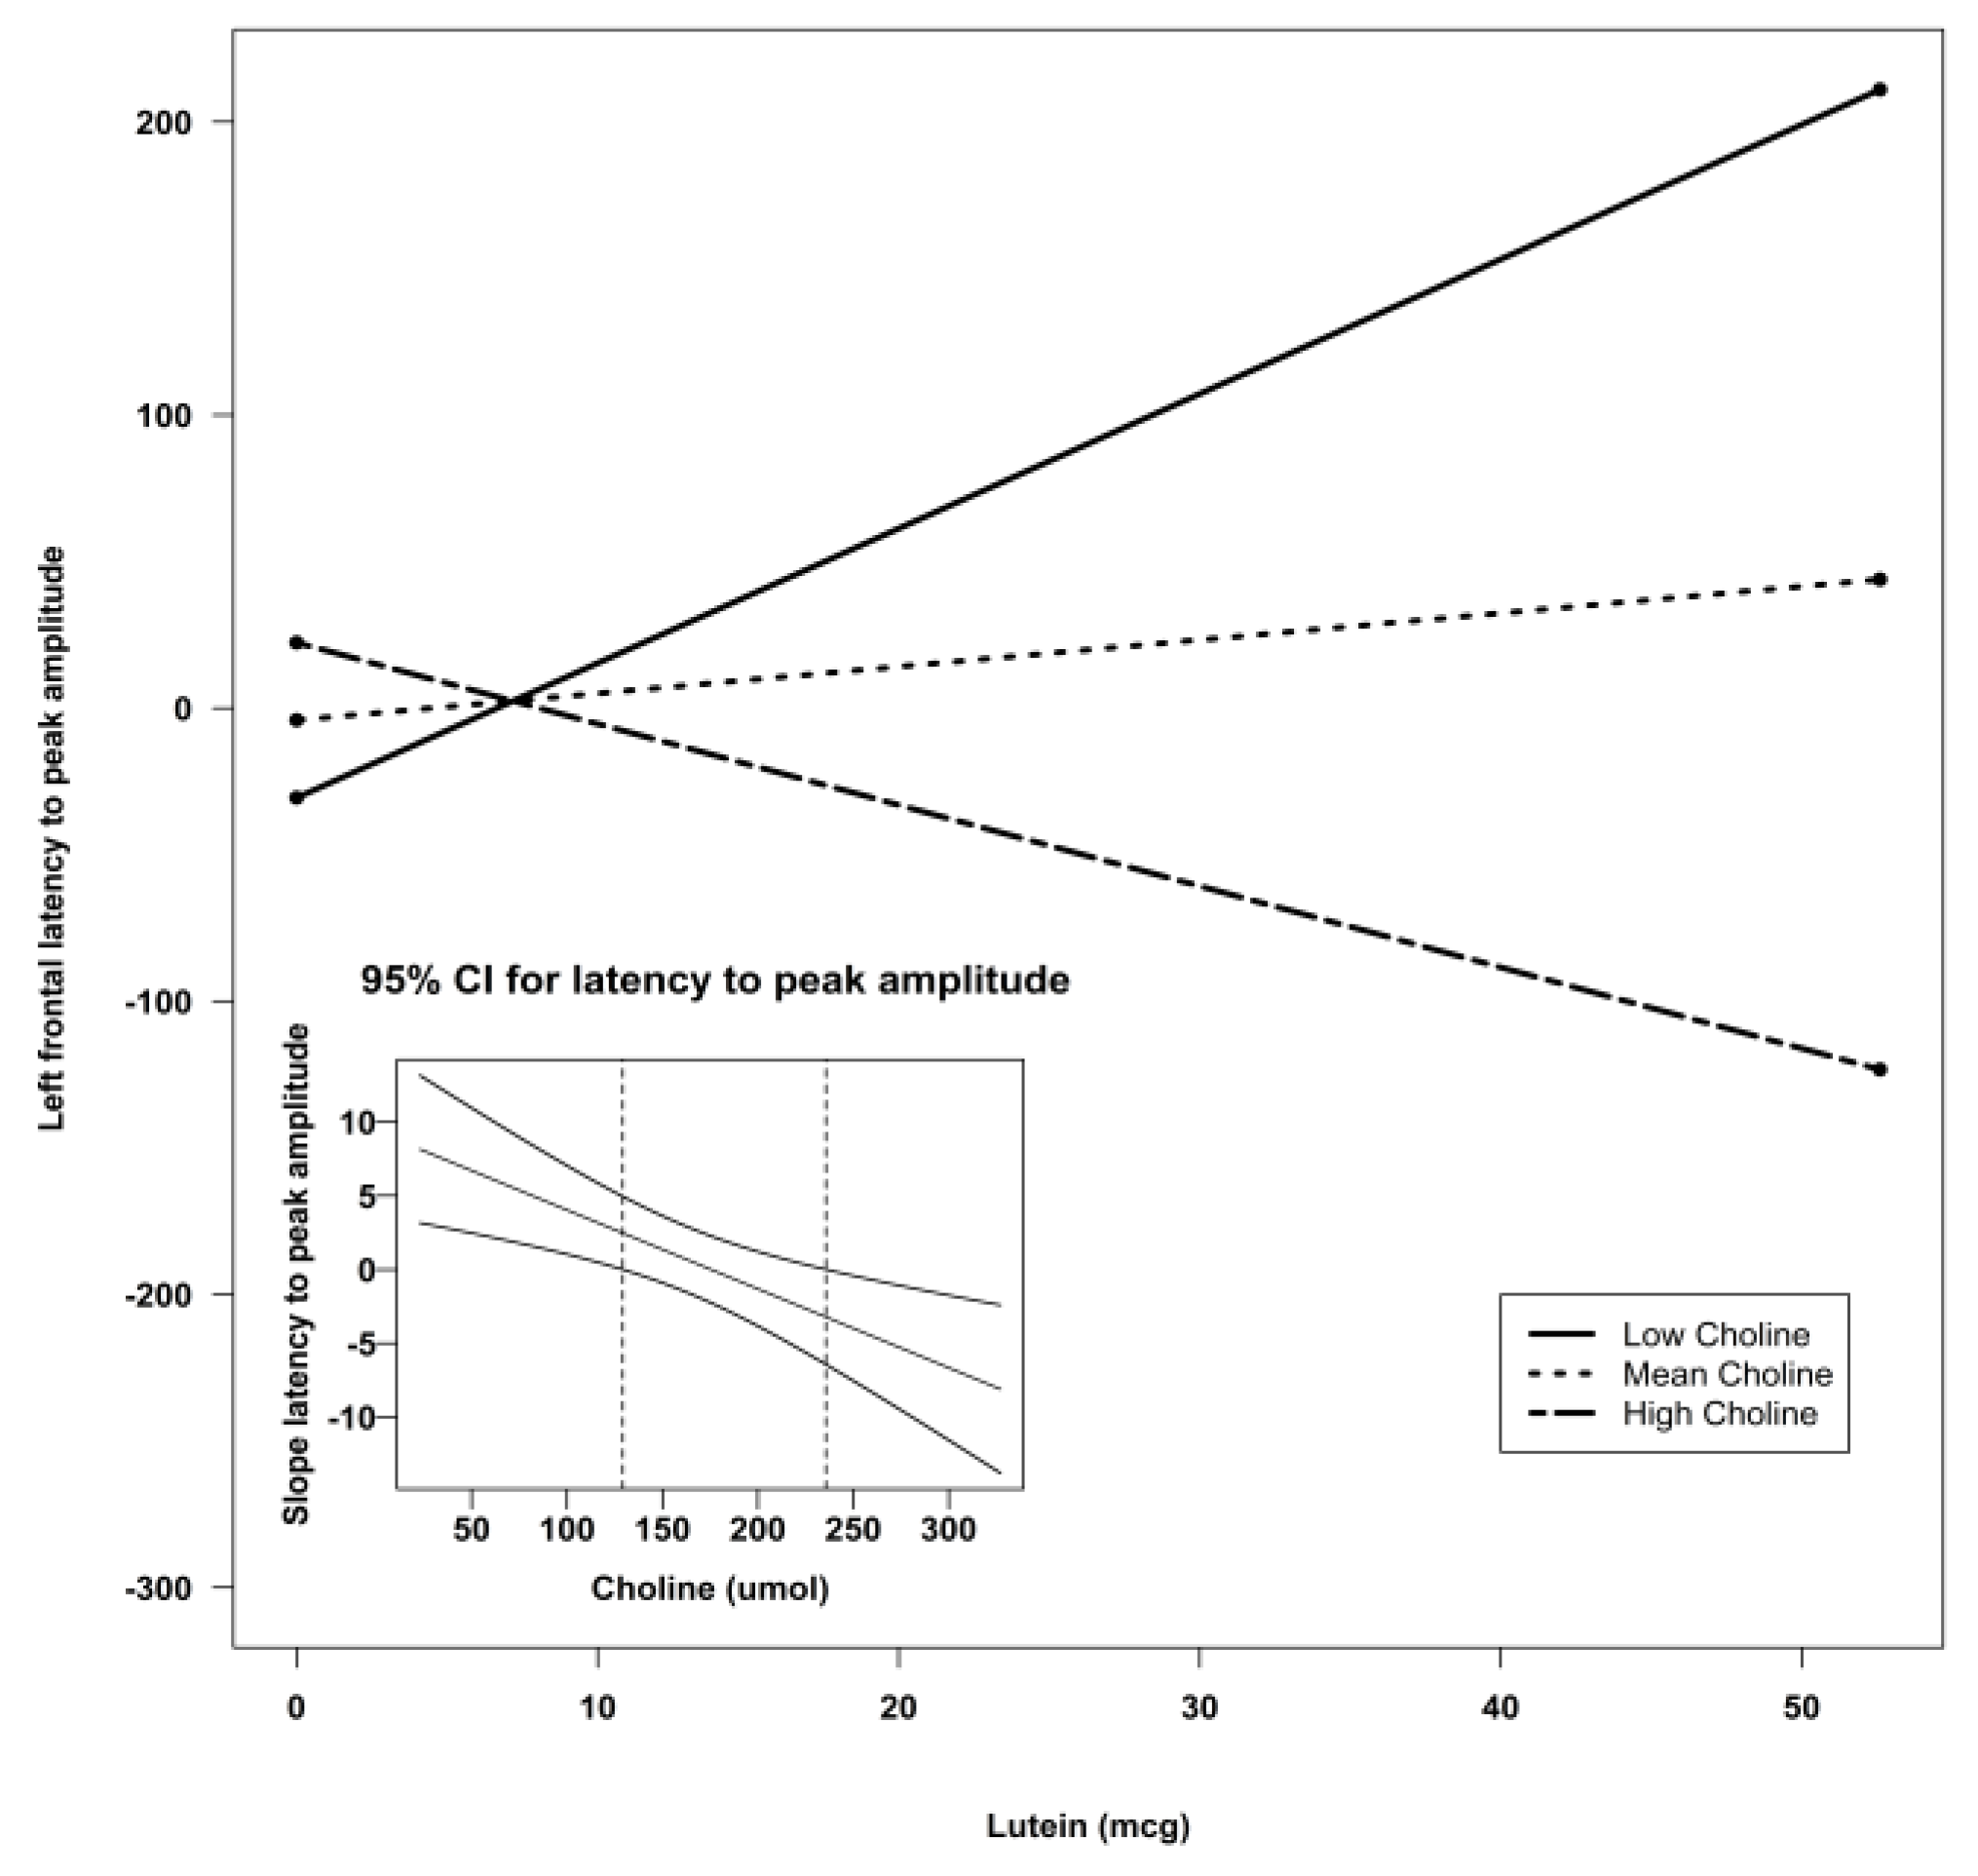
| Frontal Left | Intercept | −171.34 | 127.68 | −1.34 | 0.19 | 0.21 |
| DHA | 5.00 | 3.99 | 1.25 | 0.22 | ||
| Choline | 1.12 | 0.66 | 1.84 | 0.07 ^ | ||
| Lutein | 6.86 | 5.59 | 1.23 | 0.23 | ||
| DHA X Choline | −0.04 | 0.02 | −1.79 | 0.08 ^ | ||
| DHA X Lutein | −0.01 | 0.06 | −0.17 | 0.87 | ||
| Lutein X Choline | −0.03 | 0.03 | −0.98 | 0.33 | ||
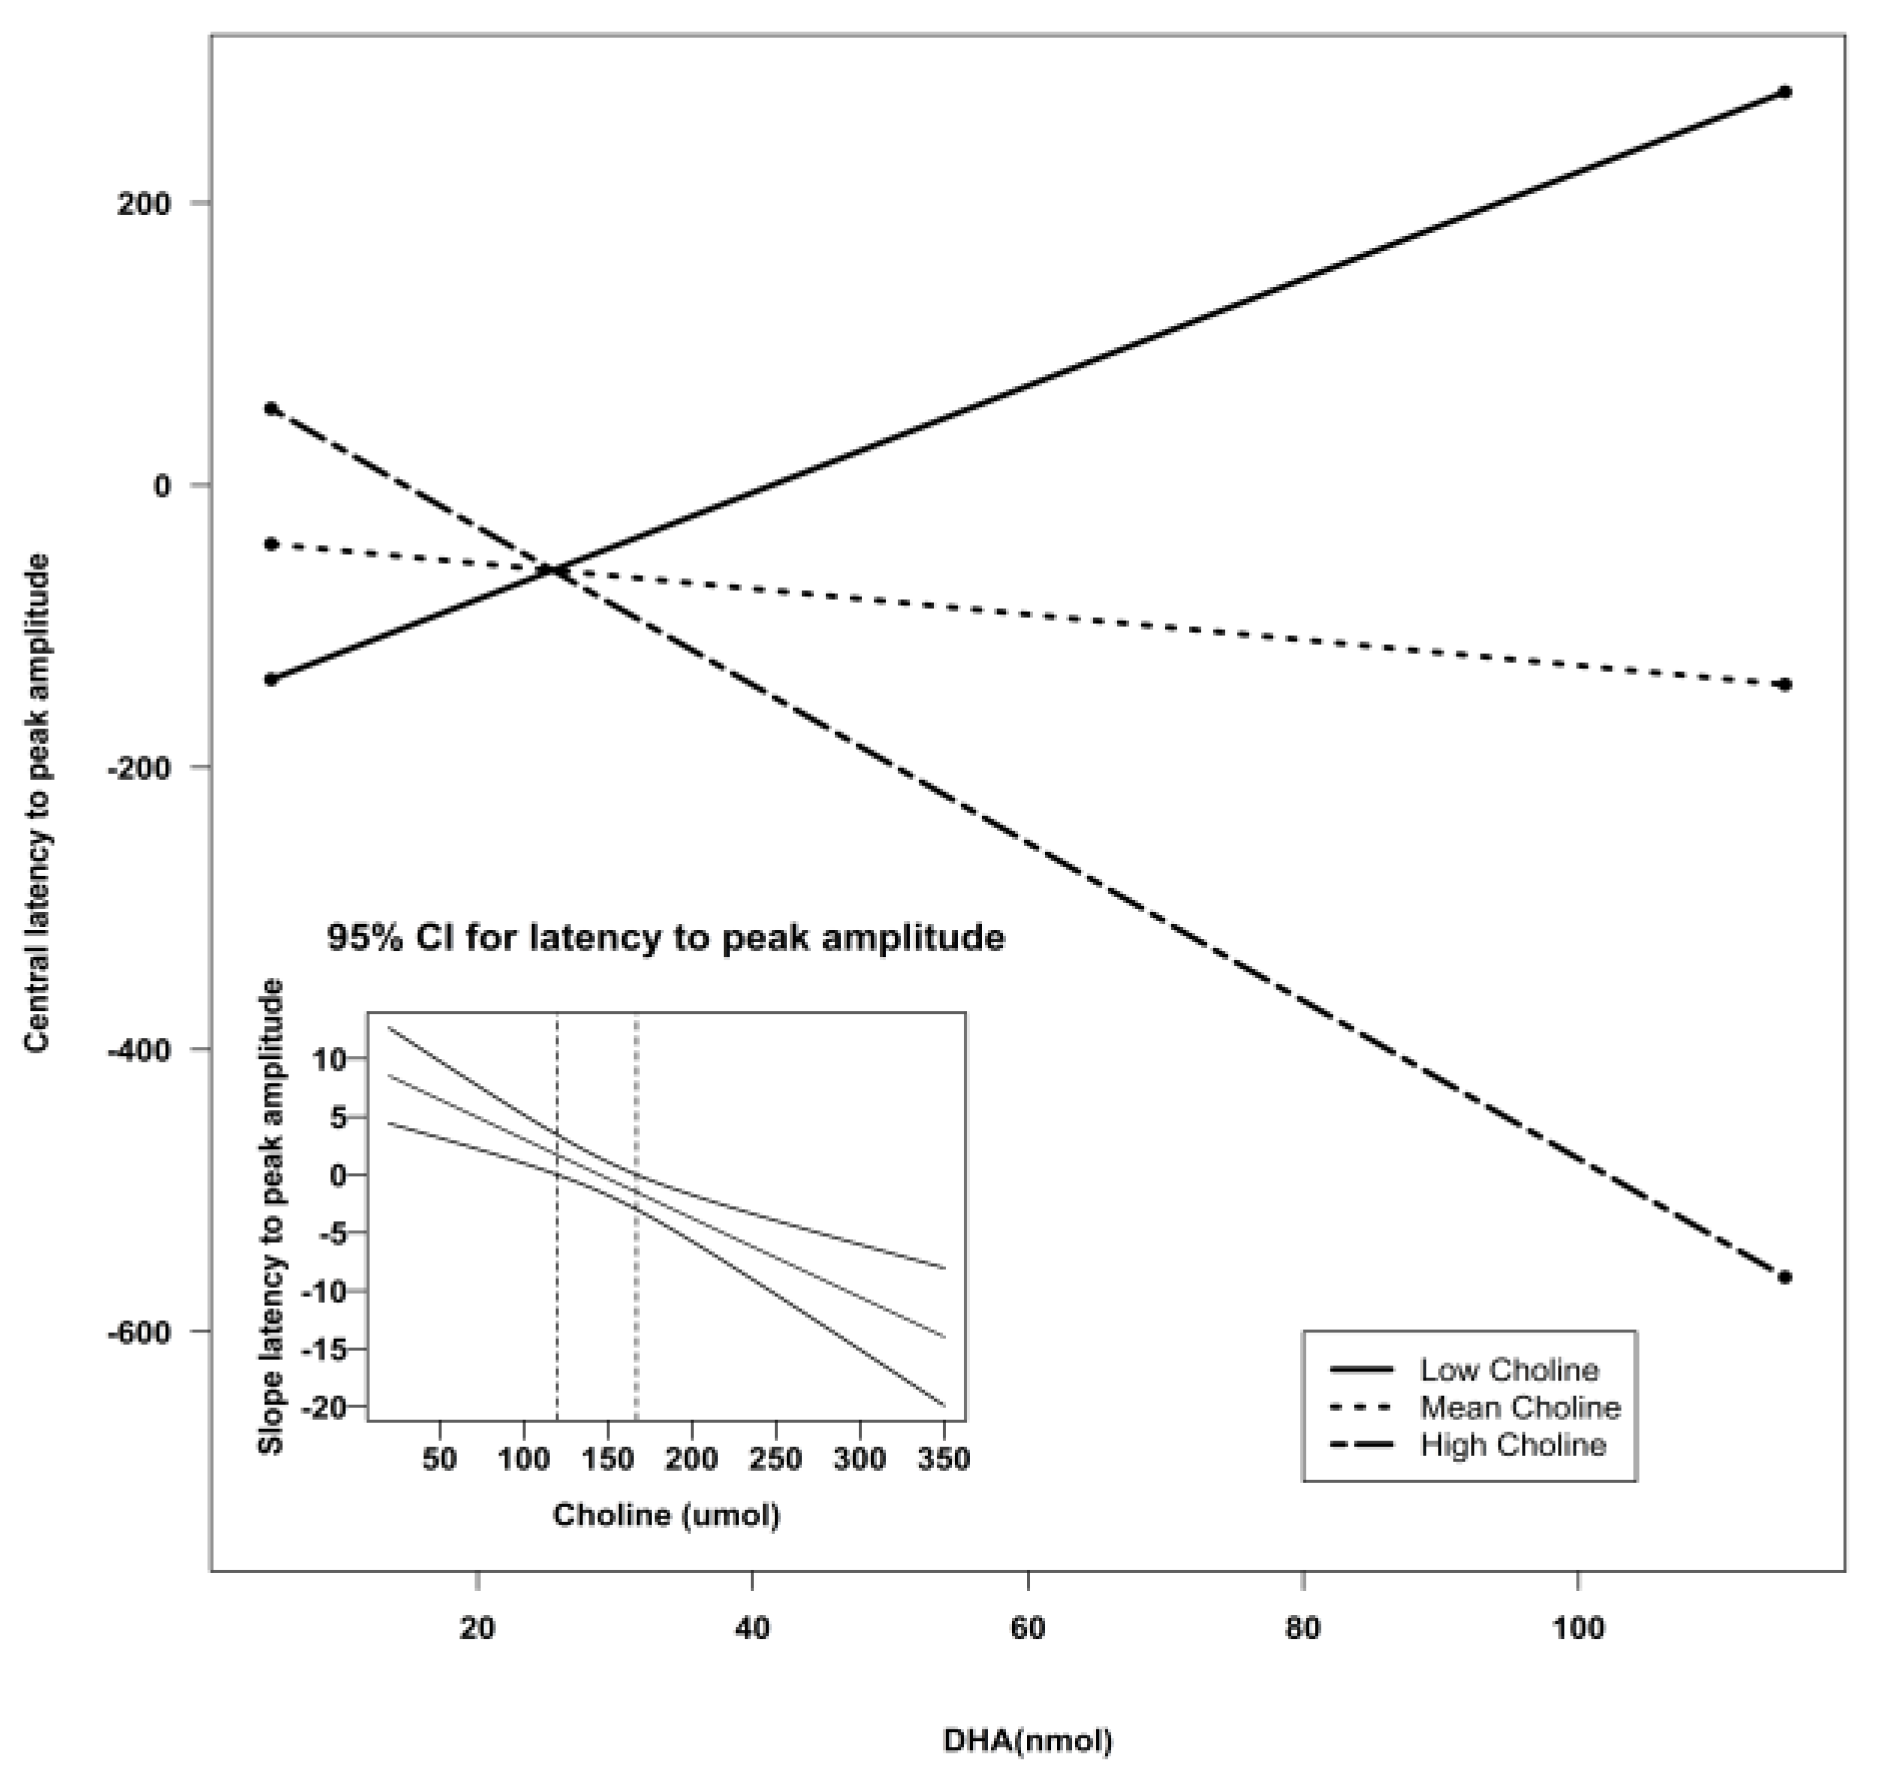
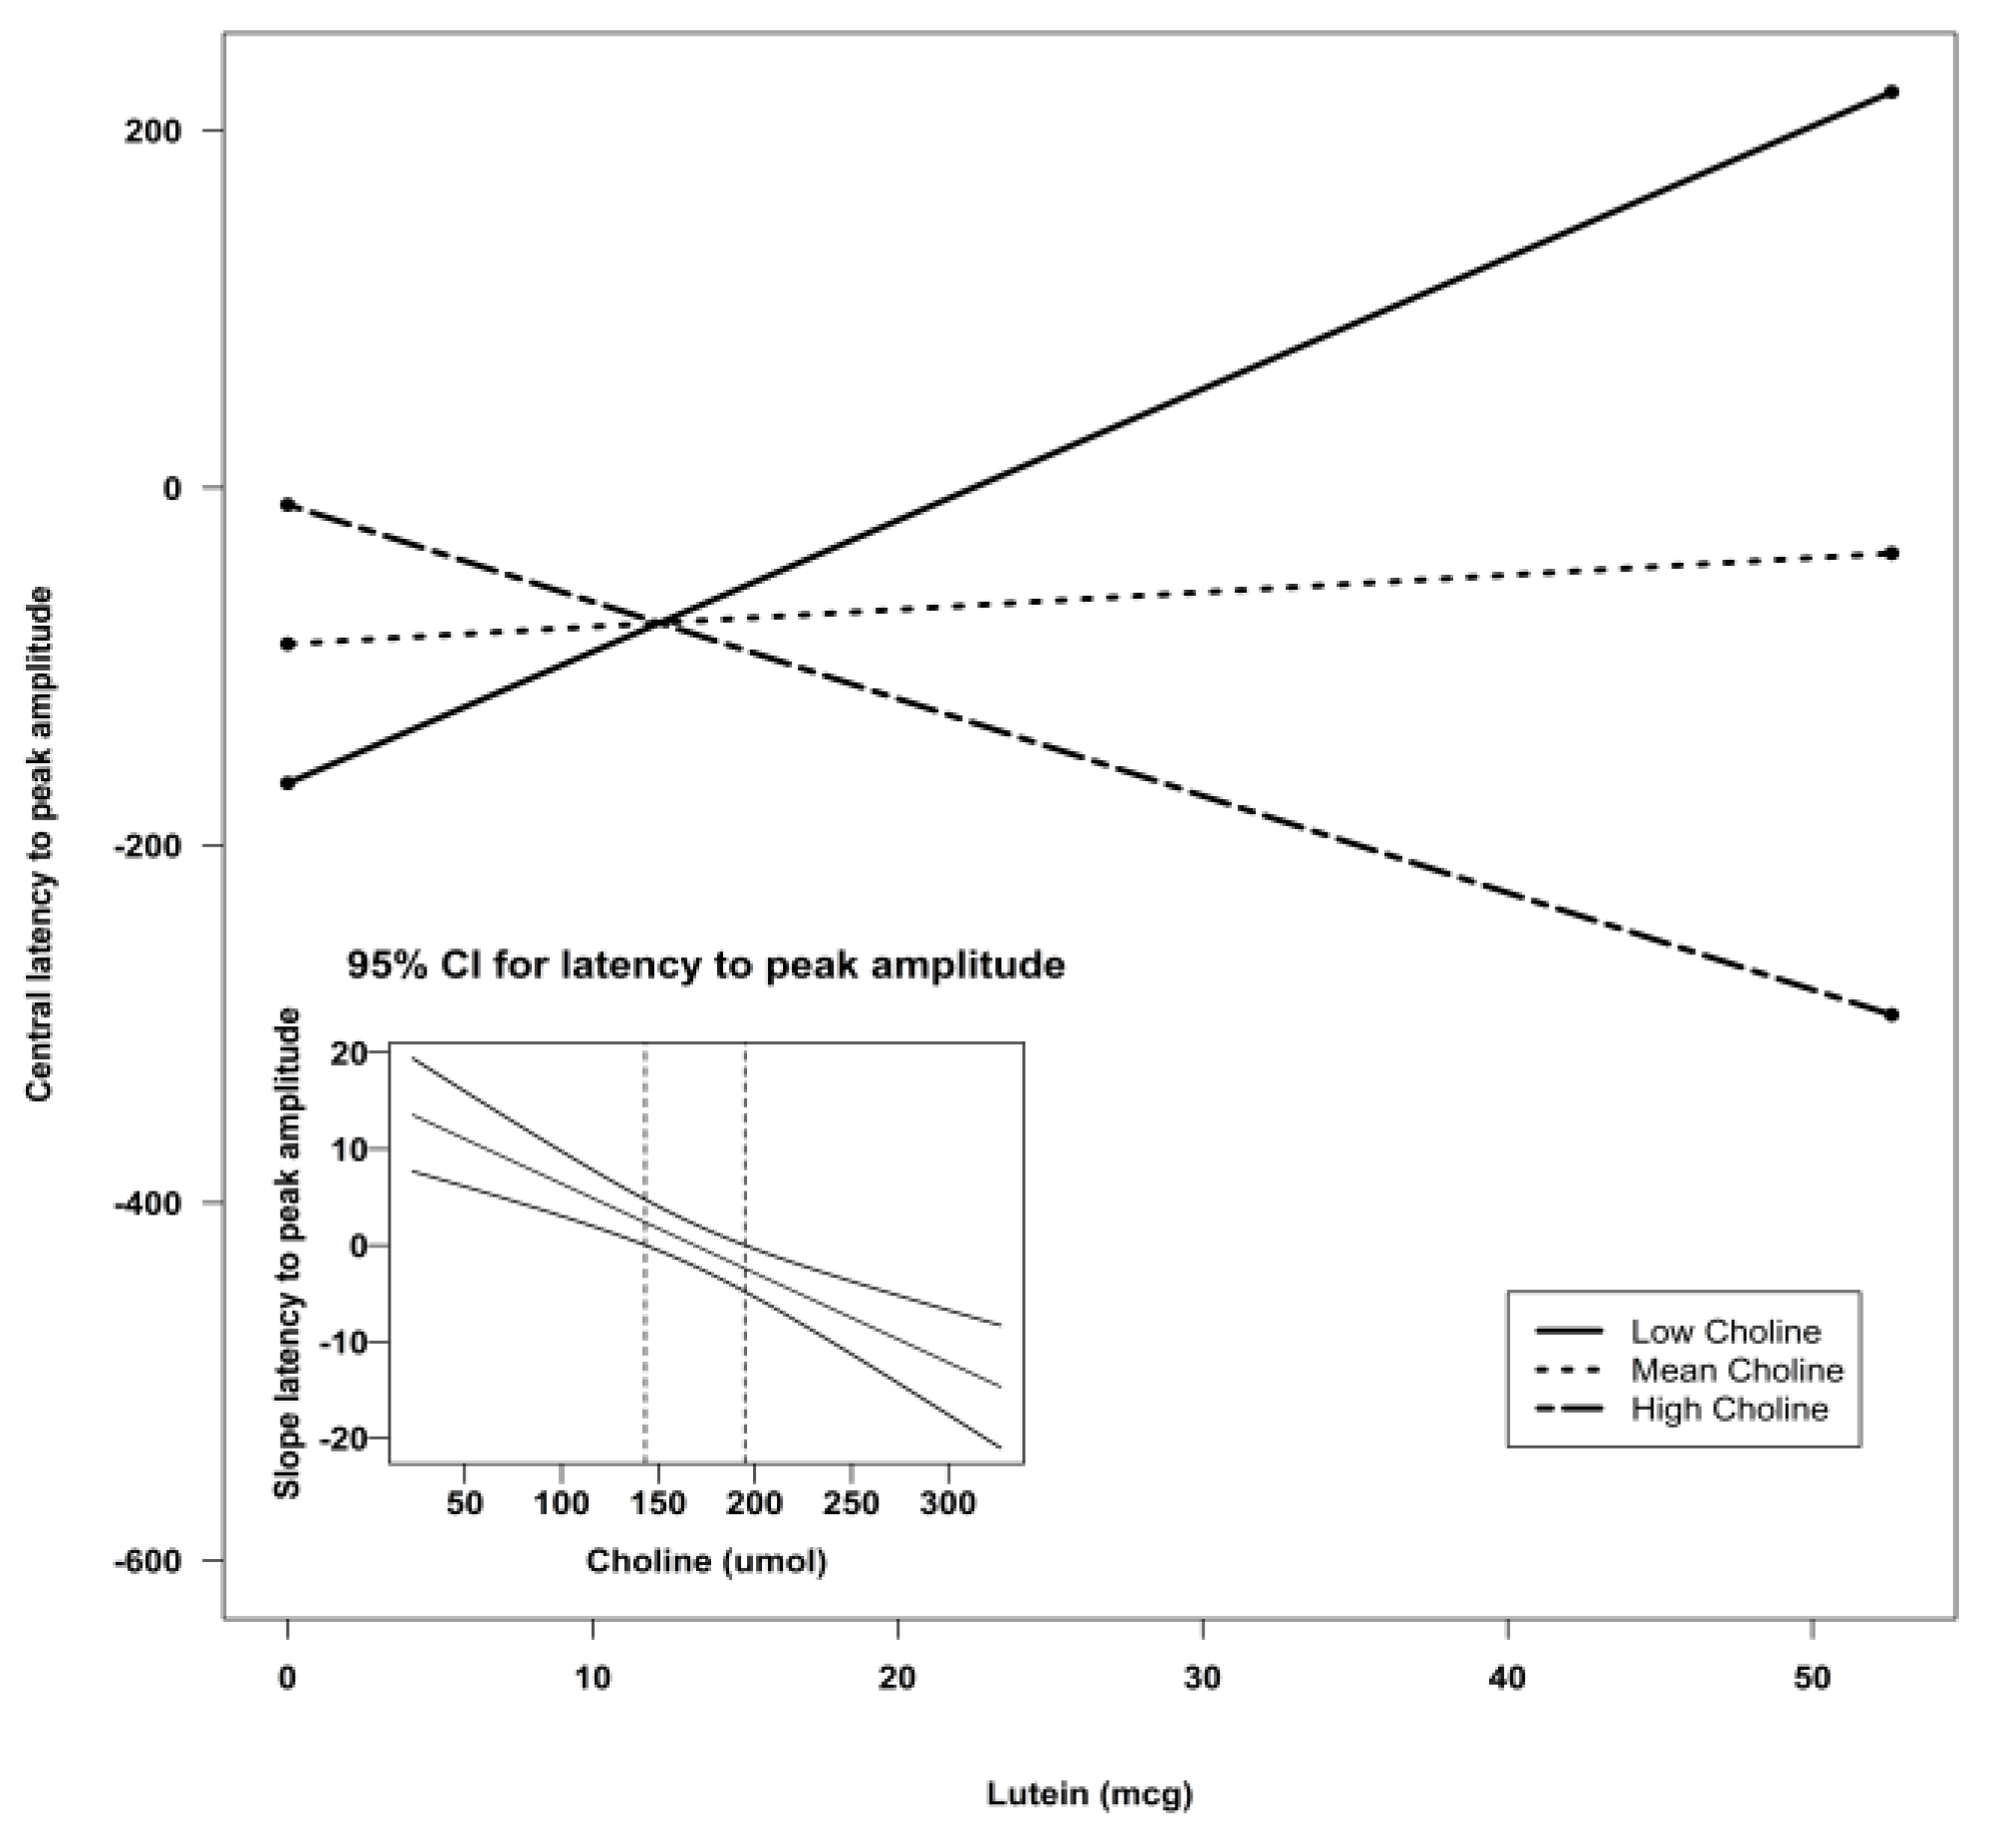
| Central Z | Intercept | −307.51 | 135.06 | −2.28 | 0.03 * | 0.30 |
| DHA | 3.27 | 4.22 | 0.77 | 0.44 | ||
| Choline | 1.90 | 0.70 | 2.73 | 0.009 ** | ||
| Lutein | 9.77 | 5.92 | 1.65 | 0.11 | ||
| DHA X Choline | −0.04 | 0.02 | −1.72 | 0.09 ^ | ||
| DHA X Lutein | 0.06 | 0.06 | 0.93 | 0.36 | ||
| Lutein X Choline | −0.06 | 0.03 | −2.12 | 0.04 * | ||
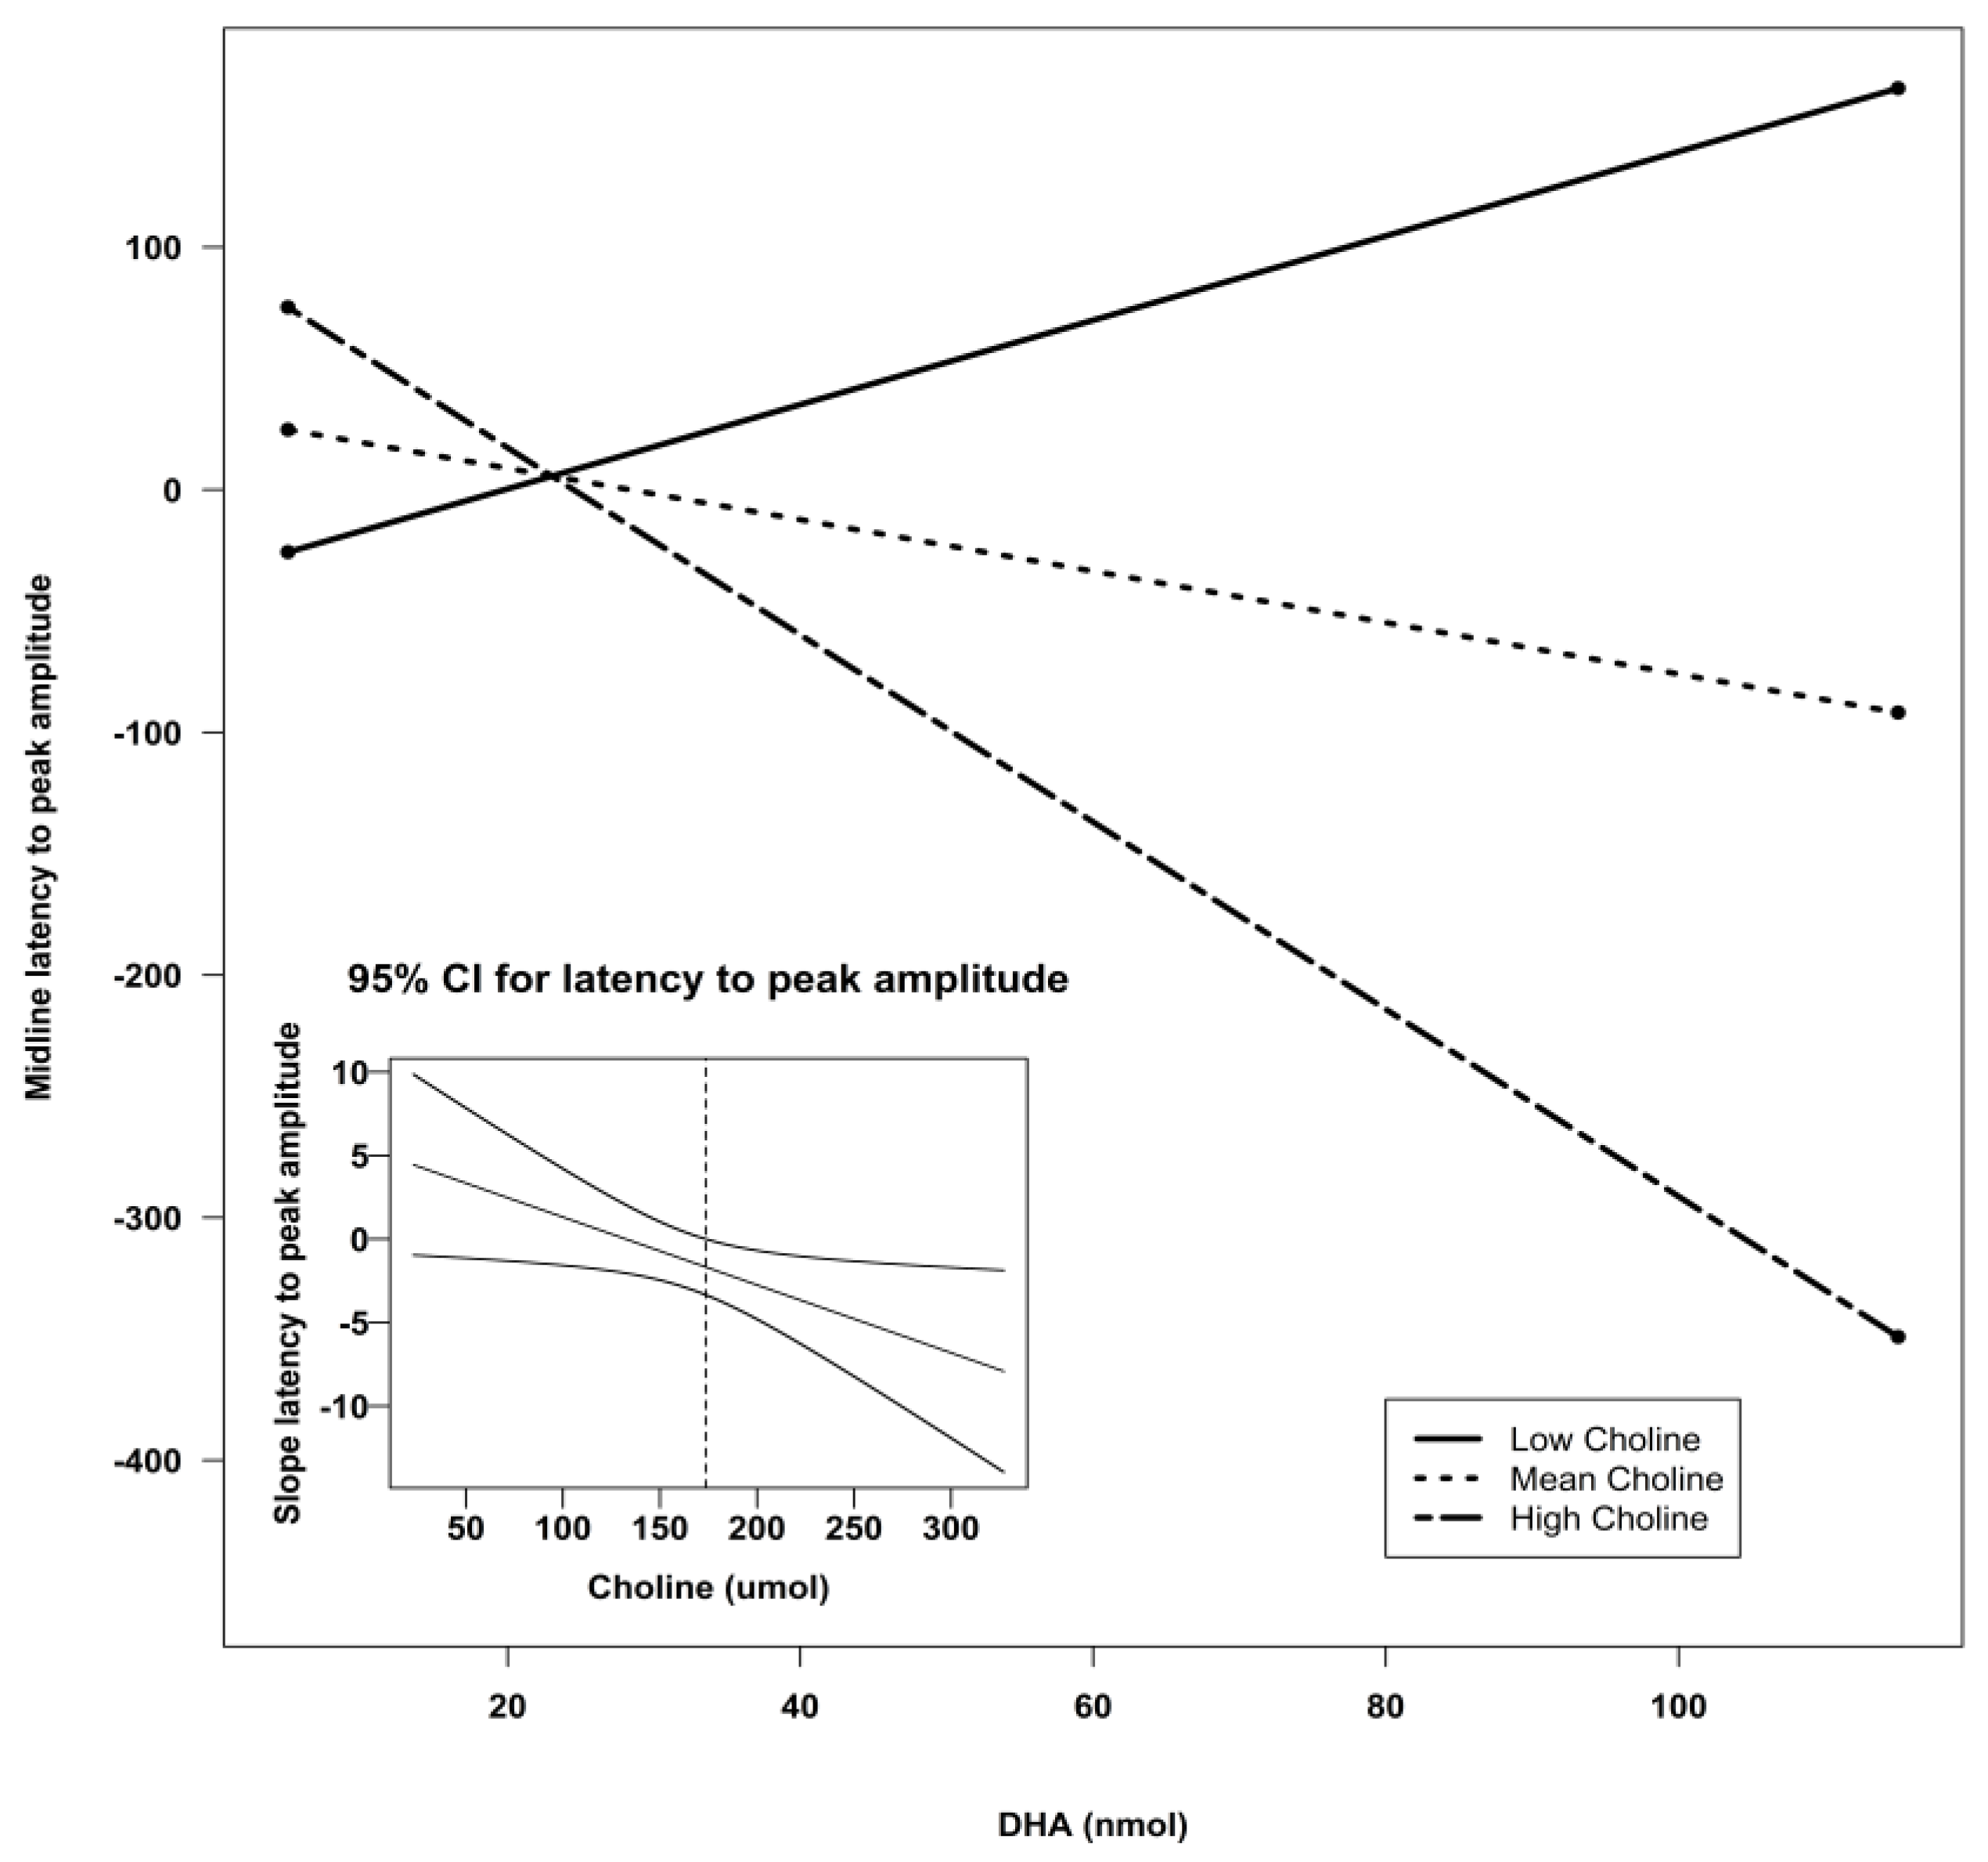
| Midline | Intercept | −125.34 | 133.78 | −0.94 | 0.35 | 0.13 |
| DHA | 3.02 | 4.18 | 0.72 | 0.47 | ||
| Choline | 1.01 | 0.69 | 1.46 | 0.15 | ||
| Lutein | 4.28 | 5.86 | 0.73 | 0.47 | ||
| DHA X Choline | −0.03 | 0.02 | −1.25 | 0.22 | ||
| DHA X Lutein | 0.01 | 0.06 | 0.22 | 0.82 | ||
| Lutein X Choline | −0.03 | 0.03 | −0.88 | 0.38 | ||
| Parietal Z | Intercept | −46.23 | 188.45 | −0.25 | 0.81 | 0.08 |
| DHA | −5.77 | 5.89 | −0.98 | 0.33 | ||
| Choline | −0.01 | 0.97 | −0.01 | 0.99 | ||
| Lutein | 10.98 | 8.26 | 1.33 | 0.19 | ||
| DHA X Choline | 0.23 | 0.03 | 0.69 | 0.49 | ||
| DHA X Lutein | 0.26 | 0.09 | 0.29 | 0.77 | ||
| Lutein X Choline | −0.07 | 0.04 | −1.59 | 0.12 |
| Lead Grouping | Variable | β | SE | F-Value | p-Value | Model F | Model p | Model R-sq |
|---|---|---|---|---|---|---|---|---|
| Frontal Left | Intercept | 85.43 | 35.7 | 5.73 | 0.02 * | 4.04 | 0.02 * | 0.13 |
| DHA X Choline | −0.02 | 0.007 | 7.88 | 0.007 ** | ||||
| DHA X Lutein | 0.05 | 0.03 | 3.13 | 0.08 ^ | ||||
| Central Z | Intercept | −266.55 | 96.24 | 7.67 | 0.008 ** | 5.26 | 0.003 ** | 0.24 |
| Choline | 1.13 | 0.53 | 4.61 | 0.04 * | ||||
| Lutein | 15.66 | 4.46 | 12.35 | 0.0009 *** | ||||
| Lutein X Choline | −0.09 | 0.02 | 14.30 | 0.0004 *** |
| Lead Grouping | Variable | β | SE | F-Value | p-Value | Model F | Model p | Model R-sq |
|---|---|---|---|---|---|---|---|---|
| Frontal Right | Intercept | −229.54 | 127.45 | −1.80 | 0.08 ^ | 2.02 | 0.12 | 0.11 |
| DHA | 5.38 | 3.46 | 1.55 | 0.12 | ||||
| Choline | 1.75 | 0.77 | 2.28 | 0.03 * | ||||
| DHA X Choline | −0.04 | 0.02 | −1.92 | 0.06 ^ | ||||
| Frontal Left | Intercept | −117.69 | 106.95 | −1.10 | 0.27 | 3.66 | 0.02 * | 0.18 |
| DHA | 6.81 | 2.90 | 2.35 | 0.02 * | ||||
| Choline | 1.05 | 0.64 | 1.63 | 0.11 | ||||
| DHA X Choline | −0.05 | 0.02 | −2.75 | 0.008 ** | ||||
| Central Z | Intercept | −312.00 | 117.62 | −2.65 | 0.01 * | 4.54 | 0.007 ** | 0.21 |
| DHA | 9.89 | 3.19 | 3.10 | 0.03 * | ||||
| Choline | 1.73 | 0.71 | 2.44 | 0.02 * | ||||
| DHA X Choline | −0.07 | 0.02 | −3.44 | 0.001 ** | ||||
| Midline | Intercept | −118.24 | 110.56 | −1.07 | 0.29 | 2.27 | 0.09 ^ | 0.12 |
| DHA | 5.38 | 3.00 | 1.79 | 0.08 ^ | ||||
| Choline | 0.94 | 0.67 | 1.40 | 0.17 | ||||
| DHA X Choline | −0.04 | 0.02 | −2.18 | 0.03 * |


| Lead Grouping | Variable | β | SE | t-Value | p-Value | Model F | Model p | Model R-sq |
|---|---|---|---|---|---|---|---|---|
| Frontal Right | Intercept | −55.56 | 107.18 | −0.52 | 0.60 | 1.61 | 0.20 | 0.08 |
| Lutein | −0.13 | 4.96 | −0.03 | 0.97 | ||||
| Choline | 0.72 | 0.59 | 1.23 | 0.22 | ||||
| Lutein X Choline | −0.02 | 0.02 | −0.59 | 0.56 | ||||
| Frontal Left | Intercept | −64.97 | 91.33 | −0.71 | 0.48 | 2.60 | 0.06 ^ | 0.13 |
| Lutein | 9.38 | 4.23 | 2.22 | 0.03 * | ||||
| Choline | 0.38 | 0.50 | 0.77 | 0.45 | ||||
| Lutein X Choline | −0.05 | 0.02 | −2.30 | 0.03 * | ||||
| Central Z | Intercept | −266.55 | 96.55 | −2.77 | 0.008 ** | 5.26 | 0.003 ** | 0.24 |
| Lutein | 15.66 | 4.46 | 3.51 | 0.0009 *** | ||||
| Choline | 1.13 | 0.53 | 2.15 | 0.04 * | ||||
| Lutein X Choline | −0.09 | 0.02 | −3.78 | 0.0004 *** | ||||
| Midline | Intercept | −69.21 | 93.32 | −0.74 | 0.46 | 1.71 | 0.18 | 0.09 |
| Lutein | 7.05 | 4.32 | 1.63 | 0.11 | ||||
| Choline | 0.42 | 0.51 | 0.82 | 0.42 | ||||
| Lutein X Choline | −0.05 | 0.02 | −1.93 | 0.06 ^ |

4. Discussion
5. Conclusions
Acknowledgments
Author Contributions
Conflicts of Interest
References
- Cheng, R.K.; Scott, A.C.; Penney, T.B.; Williams, C.L.; Meck, W.H. Prenatal-choline supplementation differentially modulates timing of auditory and visual stimuli in aged rats. Brain Res. 2008, 1237, 167–175. [Google Scholar] [CrossRef] [PubMed]
- Cheatham, C.L.; Goldman, B.D.; Fischer, L.M.; da Costa, K.A.; Reznick, J.S.; Zeisel, S.H. Phosphatidylcholine supplementation in pregnant women consuming moderate-choline diets does not enhance infant cognitive function: A randomized, double-blind, placebo-controlled trial. Am. J. Clin. Nutr. 2012, 96, 1465–1472. [Google Scholar] [CrossRef] [PubMed]
- Strain, J.J.; McSorley, E.M.; van Wijngaarden, E.; Kobrosly, R.W.; Bonham, M.P.; Mulhern, M.S.; McAfee, A.J.; Davidson, P.W.; Shamlaye, C.F.; Henderson, J.; et al. Choline status and neurodevelopmental outcomes at 5 years of age in the seychelles child development nutrition study. Br. J. Nutr. 2013, 110, 330–336. [Google Scholar] [CrossRef] [PubMed]
- Wu, B.T.; Dyer, R.A.; King, D.J.; Richardson, K.J.; Innis, S.M. Early second trimester maternal plasma choline and betaine are related to measures of early cognitive development in term infants. PLoS ONE 2012, 7, e43448. [Google Scholar] [CrossRef] [PubMed]
- Villamor, E.; Rifas-Shiman, S.L.; Gillman, M.W.; Oken, E. Maternal intake of methyl-donor nutrients and child cognition at 3 years of age. Paediatr. Perinat. Epidemiol. 2012, 26, 328–335. [Google Scholar] [CrossRef] [PubMed]
- Boeke, C.E.; Gillman, M.W.; Hughes, M.D.; Rifas-Shiman, S.L.; Villamor, E.; Oken, E. Choline intake during pregnancy and child cognition at age 7 years. Am. J. Epidemiol. 2013, 177, 1338–1347. [Google Scholar] [CrossRef] [PubMed]
- Poly, C.; Massaro, J.M.; Seshadri, S.; Wolf, P.A.; Cho, E.; Krall, E.; Jacques, P.F.; Au, R. The relation of dietary choline to cognitive performance and white-matter hyperintensity in the framingham offspring cohort. Am. J. Clin. Nutr. 2011, 94, 1584–1591. [Google Scholar] [CrossRef] [PubMed]
- Simmer, K.; Patole, S.K.; Rao, S.C. Long-chain polyunsaturated fatty acid supplementation in infants born at term. Cochrane Database Syst. Rev. 2011, 12, 1–75. [Google Scholar]
- Henriksen, C.; Haugholt, K.; Lindgren, M.; Aurvag, A.K.; Ronnestad, A.; Gronn, M.; Solberg, R.; Moen, A.; Nakstad, B.; Berge, R.K.; et al. Improved cognitive development among preterm infants attributable to early supplementation of human milk with docosahexaenoic acid and arachidonic acid. Pediatrics 2008, 121, 1137–1145. [Google Scholar] [CrossRef] [PubMed]
- Schulzke, S.M.; Patole, S.K.; Simmer, K. Longchain polyunsaturated fatty acid supplementation in preterm infants. Cochrane Database Syst. Rev. 2011, 2, 1–79. [Google Scholar]
- Almaas, A.N.; Tamnes, C.K.; Nakstad, B.; Henriksen, C.; Walhovd, K.B.; Fjell, A.M.; Due-Tonnessen, P.; Drevon, C.A.; Iversen, P.O. Long-chain polyunsaturated fatty acids and cognition in vlbw infants at 8 years: An rct. Pediatrics 2015, 135, 972–980. [Google Scholar] [CrossRef] [PubMed]
- Willatts, P.; Forsyth, J.S. The role of long-chain polyunsaturated fatty acids in infant cognitive development. Prostaglandins Leukot. Essent. Fatty Acids 2000, 63, 95–100. [Google Scholar] [CrossRef] [PubMed]
- Qawasmi, A.; Landeros-Weisenberger, A.; Bloch, M.H. Meta-analysis of lcpufa supplementation of infant formula and visual acuity. Pediatrics 2013, 131, E262–E272. [Google Scholar] [CrossRef] [PubMed]
- Cheatham, C.L.; Carlson, S.E. The long-term effects of infant formulae enriched with docosahexaenoic acid on the declarative memory abilities of toddlers. In Proceedings of the 9th Biennial Meeting of the International Society for the Study of Fatty Acids and Lipids, Maastricht, the Netherlands, 29 May–2 June 2010.
- Boucher, O.; Muckle, G.; Jacobson, J.L.; Carter, R.C.; Kaplan-Estrin, M.; Ayotte, P.; Dewailly, E.; Jacobson, S.W. Domain-specific effects of prenatal exposure to pcbs, mercury, and lead on infant cognition: Results from the environmental contaminants and child development study in nunavik. Environ. Health Perspect. 2014, 122, 310–316. [Google Scholar] [CrossRef]
- Boucher, O.; Burden, M.J.; Muckle, G.; Saint-Amour, D.; Ayotte, P.; Dewailly, E.; Nelson, C.A.; Jacobson, S.W.; Jacobson, J.L. Neurophysiologic and neurobehavioral evidence of beneficial effects of prenatal omega-3 fatty acid intake on memory function at school age. Am. J. Clin. Nutr. 2011, 93, 1025–1037. [Google Scholar] [CrossRef] [PubMed]
- Barker, F.M., 2nd; Snodderly, D.M.; Johnson, E.J.; Schalch, W.; Koepcke, W.; Gerss, J.; Neuringer, M. Nutritional manipulation of primate retinas, V: Effects of lutein, zeaxanthin, and n-3 fatty acids on retinal sensitivity to blue-light-induced damage. Investig. Ophthalmol. Vis. Sci. 2011, 52, 3934–3942. [Google Scholar] [CrossRef] [PubMed]
- Renzi, L.M.; Bovier, E.R.; Hammond, B.R., Jr. A role for the macular carotenoids in visual motor response. Nutr. Neurosci. 2013, 16, 262–268. [Google Scholar] [CrossRef] [PubMed]
- Johnson, E.J. A possible role for lutein and zeaxanthin in cognitive function in the elderly. Am. J. Clin. Nutr. 2012, 96, 1161S–1165S. [Google Scholar] [CrossRef] [PubMed]
- Bernstein, P.S.; Sharifzadeh, M.; Liu, A.; Ermakov, I.; Nelson, K.; Sheng, X.; Panish, C.; Carlstrom, B.; Hoffman, R.O.; Gellermann, W. Blue-light reflectance imaging of macular pigment in infants and children. Investig. Ophthalmol. Vis. Sci. 2013, 54, 4034–4040. [Google Scholar] [CrossRef] [PubMed]
- Hammond, B.R., Jr. Possible role for dietary lutein and zeaxanthin in visual development. Nutr. Rev. 2008, 66, 695–702. [Google Scholar] [CrossRef] [PubMed]
- Mulder, K.A.; Innis, S.M.; Rasmussen, B.F.; Wu, B.T.; Richardson, K.J.; Hasman, D. Plasma lutein concentrations are related to dietary intake, but unrelated to dietary saturated fat or cognition in young children. J. Nutr. Sci. 2014, 3, e11. [Google Scholar] [CrossRef] [PubMed]
- Naberhuis, J.K.; Lai, C.S. Enhanced delivery of lipophilic nutrients to the infant brain via high density lipoprotein. Med. Hypotheses 2015. [Google Scholar] [CrossRef] [PubMed]
- DeBoer, T.; Scott, L.; Nelson, C.A. Methods for acquiring and analyzing event-related potentials. In Infant Eeg and Event-Related Potentials; Haan, M.D., Ed.; Psychology Press: New York, NY, USA, 2007; pp. 5–144. [Google Scholar]
- Stets, M.; Stahl, D.; Reid, V.M. A meta-analysis investigating factors underlying attrition rates in infant erp studies. Dev. Neuropsychol. 2012, 37, 226–252. [Google Scholar] [CrossRef] [PubMed]
- Bligh, E.G.; Dyer, W.J. A rapid method of total lipid extraction and purification. Can. J. Biochem. Physiol. 1959, 37, 911–917. [Google Scholar] [CrossRef] [PubMed]
- Tacconi, M.; Wurtman, R.J. Rat brain phosphatidyl-n,n-dimethylethanolamine is rich in polyunsaturated fatty acids. J. Neurochem. 1985, 45, 805–809. [Google Scholar] [CrossRef] [PubMed]
- Innis, S.M.; Hasman, D. Evidence of choline depletion and reduced betaine and dimethylglycine with increased homocysteine in plasma of children with cystic fibrosis. J. Nutr. 2006, 136, 2226–2231. [Google Scholar] [PubMed]
- Yuhas, R.; McCormick, M.; Yachetti, S.; Burgher, A.M.; Kong, K.; Walsh, J. A method for the measurement of lutein in infant formula. Food Nutr. Sci. 2011, 2, 145–149. [Google Scholar] [CrossRef]
- Wiebe, S.A.; Cheatham, C.L.; Lukowski, A.F.; Haight, J.C.; Muehleck, A.J.; Bauer, P.J. Infants’ ERP responses to novel and familiar stimuli change over time: Implications for novelty detection and memory. Infancy 2006, 9, 21–44. [Google Scholar] [CrossRef]
- De Haan, M. Visual attention and recognition in infancy. In Infant Eeg and Event-Related Potentials; De Haan, M., Ed.; Psychology Press: East Sussex, UK, 2007; pp. 101–144. [Google Scholar]
- Bakker, M.; Wicherts, J.M. Outlier removal and the relation with reporting errors and quality of psychological research. PLoS ONE 2014, 9. [Google Scholar] [CrossRef] [PubMed]
- Reynolds, G.D.; Guy, M.W.; Zhang, D. Neural correlates of individual differences in infant visual attention and recognition memory. Infancy 2011, 16, 368–391. [Google Scholar] [CrossRef] [PubMed]
- Preacher, K.J.; Curran, P.J.; Bauer, D.J. Computation tools for probing interactions in multiple linear regression, multilevel modeling, and latent curve analysis. J. Educ. Behav. Stat. 2006, 31, 437–448. [Google Scholar] [CrossRef]
- Reynolds, G.D.; Richards, J.E. Familiarization, attention, and recognition memory in infancy: An event-related potential and cortical source localization study. Dev. Psychol. 2005, 41, 598–615. [Google Scholar] [CrossRef] [PubMed]
- Richards, J.E. Attention affects the recognition of briefly presented visual stimuli in infants: An erp study. Dev. Sci. 2003, 6, 312–328. [Google Scholar] [CrossRef] [PubMed]
- Reynolds, G.D.; Courage, M.L.; Richards, J.E. Infant attention and visual preferences: Converging evidence from behavior, event-related potentials, and cortical source localization. Dev. Psychol. 2010, 46, 886–904. [Google Scholar] [CrossRef] [PubMed]
- De Haan, M.; Nelson, C.A. Recognition of the mother’s face by six-month-old infants: A neurobehavioral study. Child Dev. 1997, 68, 187–210. [Google Scholar] [CrossRef] [PubMed]
- De Haan, M.; Nelson, C.A. Brain activity differentiates face and object processing in 6-month-old infants. Dev. Psychol. 1999, 35, 1113–1121. [Google Scholar] [CrossRef] [PubMed]
- Huettel, S.A.; McCarthy, G. What is odd in the oddball task? Prefrontal cortex is activated by dynamic changes in response strategy. Neuropsychologia 2004, 42, 379–386. [Google Scholar] [CrossRef] [PubMed]
- Cheatham, C.L.; Nerhammer, A.S.; Asserhoj, M.; Michaelsen, K.F.; Lauritzen, L. Fish oil supplementation during lactation: Effects on cognition and behavior at 7 years of age. Lipids 2011, 46, 637–645. [Google Scholar] [CrossRef] [PubMed]
- Birch, E.E.; Garfield, S.; Hoffman, D.R.; Uauy, R.; Birch, D.G. A randomized controlled trial of early dietary supply of long-chain polyunsaturated fatty acids and mental development in term infants. Dev. Med. Child Neurol. 2000, 42, 174–181. [Google Scholar] [CrossRef] [PubMed]
- Helland, I.B.; Saugstad, O.D.; Smith, L.; Saarem, K.; Solvoll, K.; Ganes, T.; Drevon, C.A. Similar effects on infants of n-3 and n-6 fatty acids supplementation to pregnant and lactating women. Pediatrics 2001, 108, E82. [Google Scholar] [CrossRef] [PubMed]
- Helland, I.B.; Smith, L.; Saarem, K.; Saugstad, O.D.; Drevon, C.A.; Helland, I.B.; Smith, L.; Saarem, K.; Saugstad, O.D.; Drevon, C.A. Maternal supplementation with very-long-chain n-3 fatty acids during pregnancy and lactation augments children's iq at 4 years of age. Pediatrics 2003, 111, e39–44. [Google Scholar] [CrossRef] [PubMed]
- Meck, W.H.; Williams, C.L.; Cermak, J.M.; Blusztajn, J.K. Developmental periods of choline sensitivity provide an ontogenetic mechanism for regulating memory capacity and age-related dementia. Front. Integr. Neurosci. 2007, 1, 7. [Google Scholar] [CrossRef] [PubMed]
- Huang, M.C.; Brenna, J.T.; Chao, A.C.; Tschanz, C.; Diersen-Schade, D.A.; Hung, H.C. Differential tissue dose responses of (n-3) and (n-6) PUFA in neonatal piglets fed docosahexaenoate and arachidonoate. J. Nutr. 2007, 137, 2049–2055. [Google Scholar] [PubMed]
- West, A.A.; Yan, J.; Jiang, X.; Perry, C.A.; Innis, S.M.; Caudill, M.A. Choline intake influences phosphatidylcholine dha enrichment in nonpregnant women but not in pregnant women in the third trimester. Am. J. Clin. Nutr. 2013, 97, 718–727. [Google Scholar] [CrossRef] [PubMed]
- Wurtman, R.J. A nutrient combination that can affect synapse formation. Nutrients 2014, 6, 1701–1710. [Google Scholar] [CrossRef] [PubMed]
- Wurtman, R.J.; Ulus, I.H.; Cansev, M.; Watkins, C.J.; Wang, L.; Marzloff, G. Synaptic proteins and phospholipids are increased in gerbil brain by administering uridine plus docosahexaenoic acid orally. Brain Res. 2006, 1088, 83–92. [Google Scholar] [CrossRef] [PubMed]
- Sakamoto, T.; Cansev, M.; Wurtman, R.J. Oral supplementation with docosahexaenoic acid and uridine-5′-monophosphate increases dendritic spine density in adult gerbil hippocampus. Brain Res. 2007, 1182, 50–59. [Google Scholar] [CrossRef] [PubMed]
- Holguin, S.; Martinez, J.; Chow, C.; Wurtman, R. Dietary uridine enhances the improvement in learning and memory produced by administering dha to gerbils. FASEB J. 2008, 22, 3938–3946. [Google Scholar] [CrossRef] [PubMed]
- Monk, C.S.; Webb, S.J.; Nelson, C.A. Prenatal neurobiological development: Molecular mechanisms and anatomical change. Dev. Neuropsychol. 2001, 19, 211–236. [Google Scholar] [CrossRef] [PubMed]
- Helland, I.B.; Saugstad, O.D.; Saarem, K.; van Houwelingen, A.C.; Nylander, G.; Drevon, C.A.; Helland, I.B.; Saugstad, O.D.; Saarem, K.; van Houwelingen, A.C.; et al. Supplementation of n-3 fatty acids during pregnancy and lactation reduces maternal plasma lipid levels and provides DHA to the infants. J. Matern. Fetal Neonatal Med. 2006, 19, 397–406. [Google Scholar] [CrossRef] [PubMed]
- Helland, I.B.; Saarem, K.; Saugstad, O.D.; Drevon, C.A. Fatty acid composition in maternal milk and plasma during supplementation with cod liver oil. Eur. J. Clin. Nutr. 1998, 52, 839–845. [Google Scholar] [CrossRef] [PubMed]
- Meck, W.H.; Williams, C.L. Perinatal choline supplementation increases the threshold for chunking in spatial memory. Neuroreport 1997, 8, 3053–3059. [Google Scholar] [CrossRef] [PubMed]
- Meck, W.H.; Williams, C.L. Choline supplementation during prenatal development reduces proactive interference in spatial memory. Brain Res. Dev. Brain Res. 1999, 118, 51–59. [Google Scholar] [CrossRef]
- Meck, W.H.; Williams, C.L. Metabolic imprinting of choline by its availability during gestation: Implications for memory and attentional processing across the lifespan. Neurosci. Biobehav. Rev. 2003, 27, 385–399. [Google Scholar] [CrossRef]
- Da Costa, K.A.; Rai, K.S.; Craciunescu, C.N.; Parikh, K.; Mehedint, M.G.; Sanders, L.M.; McLean-Pottinger, A.; Zeisel, S.H. Dietary docosahexaenoic acid supplementation modulates hippocampal development in the pemt-/- mouse. J. Biol. Chem. 2010, 285, 1008–1015. [Google Scholar] [CrossRef] [PubMed]
- Johnson, E.J. A biological role of lutein. Food Rev. Int. 2004, 20, 1–16. [Google Scholar] [CrossRef]
- Lieblein-Boff, J.C.; Johnson, E.J.; Kennedy, A.D.; Lai, C.S.; Kuchan, M.J. Exploratory metabolomic analyses reveal compounds correlated with lutein concentration in frontal cortex, hippocampus, and occipital cortex of human infant brain. PLoS ONE 2015, 10, e0136904. [Google Scholar] [CrossRef] [PubMed]
- Carmichael, S.L.; Yang, W.; Shaw, G.M. Periconceptional nutrient intakes and risks of neural tube defects in California. Birth Defects Res. A Clin. Mol. Teratol. 2010, 88, 670–678. [Google Scholar] [CrossRef] [PubMed]
- Ilcol, Y.O.; Ozbek, R.; Hamurtekin, E.; Ulus, I.H. Choline status in newborns, infants, children, breast-feeding women, breast-fed infants and human breast milk. J. Nutr. Biochem. 2005, 16, 489–499. [Google Scholar] [CrossRef] [PubMed]
- Luukkainen, P.; Salo, M.K.; Nikkari, T. Changes in the fatty acid composition of preterm and term human milk from 1 week to 6 months of lactation. J. Pediatr. Gastroenterol. Nutr. 1994, 18, 355–360. [Google Scholar] [CrossRef] [PubMed]
© 2015 by the authors; licensee MDPI, Basel, Switzerland. This article is an open access article distributed under the terms and conditions of the Creative Commons by Attribution (CC-BY) license (http://creativecommons.org/licenses/by/4.0/).
Share and Cite
Cheatham, C.L.; Sheppard, K.W. Synergistic Effects of Human Milk Nutrients in the Support of Infant Recognition Memory: An Observational Study. Nutrients 2015, 7, 9079-9095. https://doi.org/10.3390/nu7115452
Cheatham CL, Sheppard KW. Synergistic Effects of Human Milk Nutrients in the Support of Infant Recognition Memory: An Observational Study. Nutrients. 2015; 7(11):9079-9095. https://doi.org/10.3390/nu7115452
Chicago/Turabian StyleCheatham, Carol L., and Kelly Will Sheppard. 2015. "Synergistic Effects of Human Milk Nutrients in the Support of Infant Recognition Memory: An Observational Study" Nutrients 7, no. 11: 9079-9095. https://doi.org/10.3390/nu7115452