Iron Absorption from Two Milk Formulas Fortified with Iron Sulfate Stabilized with Maltodextrin and Citric Acid

Abstract
:1. Introduction
2. Experimental Section

| Formula A Per 100 mL | Formula B Per 100 mL | Cow’s Milk Per 100 mL | |
|---|---|---|---|
| Protein (g) | 2 | 2 | 3.2 |
| Casein (g) | 0.97 | 0.98 | 2.4 |
| Total Carbohydrates (g) | 8.0 | 8.2 | 4.6 |
| Lactose (g) | 5.63 | 5.64 | 4.6 |
| Maltodextrin (g) | 2.3 | 2.5 | 0 |
| Calcium (mg) | 76 | 81 | 112 |
| Iron (mg) | 1.2 | 1.2 | 0.96 |
| Ascorbic Acid (mg) | 14 | 14 | 1 |
| Prebiotic (scGOS/lcFOS) (g) | 0.8 | 0 | 0 |
3. Results
| Subj | Hb | MCV | Zpp | Fe | TIBC | %Sat | SF |
|---|---|---|---|---|---|---|---|
| g/L | fL | μg/dLRBC | µg/dL | µg/dL | % | μg/L | |
| 1 | 148 | 85 | 73 | 38 | 292 | 13.1 | 30 |
| 2 | 145 | 84 | 69 | 70 | 308 | 22.6 | 37 |
| 3 | 149 | 87 | 74 | 46 | 360 | 12.8 | 24 |
| 4 | 172 | 91 | 46 | 65 | 327 | 19.8 | 25 |
| 5 | 151 | 87 | 74 | 41 | 318 | 12.8 | 20 |
| 6 | 158 | 87 | 66 | 61 | 434 | 14.0 | 32 |
| 7 | 158 | 100 | 63 | 19 | 356 | 5.2 | 17 |
| 8 | 141 | 81 | 106 | 28 | 450 | 6.3 | 6 |
| 9 | 138 | 81 | 114 | 52 | 353 | 14.7 | 12 |
| 10 | 137 | 87 | 86 | 40 | 311 | 12.8 | 27 |
| 11 | 157 | 88 | 60 | 55 | 334 | 16.5 | 44 |
| 12 | 114 | 82 | 134 | 11 | 424 | 2.5 | 5 |
| 13 | 144 | 84 | 83 | 58 | 444 | 13.1 | 6 |
| 14 | 131 | 82 | 54 | 43 | 395 | 10.9 | 7 |
| 15 | 147 | 85 | 83 | 51 | 295 | 17.3 | 32 |
| Mean | 146 | 86 | 79 | 45 | 360 | 13.0 | 17 a |
| SD | 13 | 5 | 24 | 17 | 56 | 5.3 | 8–37 |
| Iron Bioavailability (%) | ||||
|---|---|---|---|---|
| Formula A | Formula B | Cow milk | Reference dose | |
| S | 55Fe | 59Fe | 55Fe | 59Fe |
| 1 | 20.7 | 29.7 | 7.3 | 30.3 |
| 2 | 7.9 | 8.8 | 3.7 | 30.4 |
| 3 | 10.0 | 10.2 | 9.5 | 33.7 |
| 4 | 13.6 | 5.5 | 5.3 | 20.2 |
| 5 | 23.7 | 25.1 | 6.1 | 22.8 |
| 6 | 52.4 | 55.7 | 21.8 | 55.1 |
| 7 | 46.7 | 37.8 | 5.1 | 38.7 |
| 8 | 19.9 | 13.0 | 0.3 | 69.8 |
| 9 | 5.6 | 9.8 | 7.2 | 29.7 |
| 10 | 14.2 | 17.2 | 9.5 | 18.8 |
| 11 | 24.1 | 23.3 | 7.9 | 15.3 |
| 12 | 32.7 | 33.0 | 13.5 | 88.2 |
| 13 | 37.1 | 32.5 | 17.1 | 69.1 |
| 14 | 71.1 | 58.5 | 20.2 | 97.8 |
| 15 | 6.1 | 11.7 | 10.4 | 51.1 |
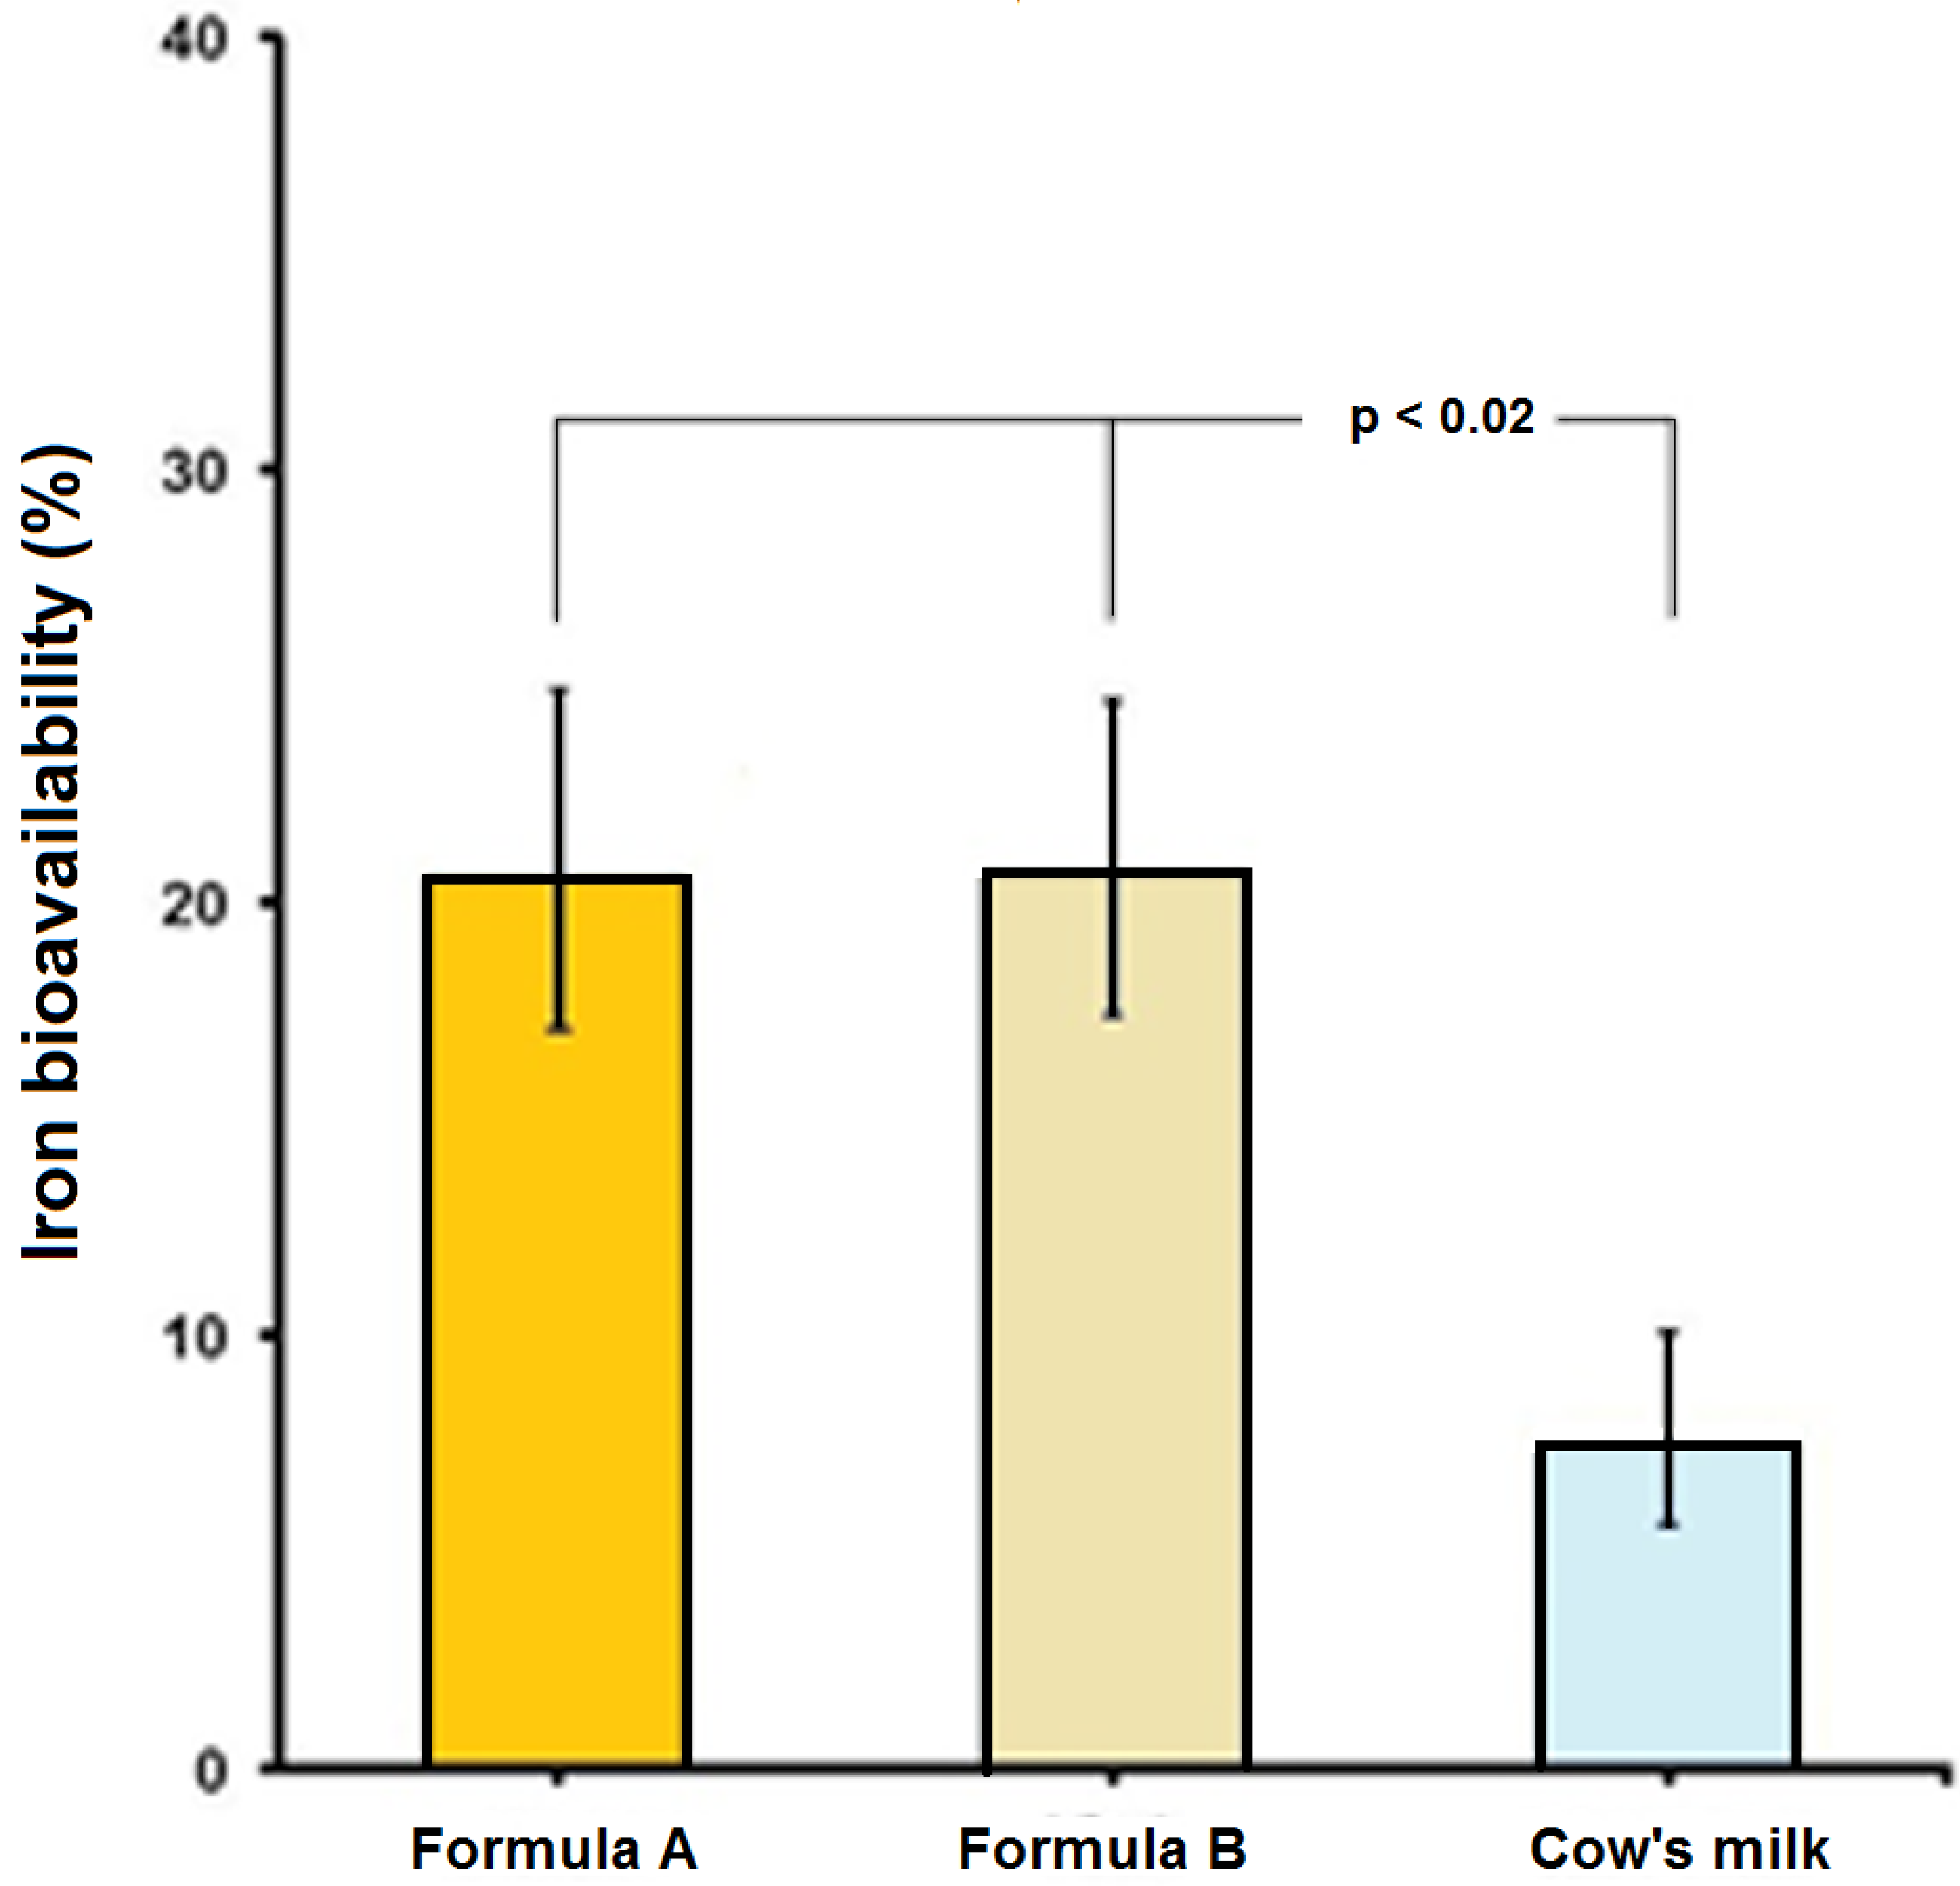
| GM | 19.7 | 19.8 | 7.2 | 38.3 |
| ±1 SD | 9.0–43.1 | 9.7–40.5 | 2.6–19.9 | 21.4–68.4 |
4. Discussion
5. Conclusions
Acknowledgments
Author Contributions
Conflicts of Interest
References
- McLean, E.; Egli, I.; Benoist, B.; Wojdyla, D.; Cogswell, M. Worldwide prevalence of anemia in pre-school aged children, pregnant women and non-pregnant women of reproductive age. In Nutritional Anemia; Kraemer, K., Zimmermann, M.B., Eds.; Sight and Life: Basel, Switzerland, 2007; pp. 1–12. Available online: http://www.sightandlife.org/fileadmin/data/Books/Nutritional_anemia_book.pdf (accessed on 27 July 2015).
- WHO/FAO. Guidelines on food fortification with micronutrients. Allen, L., de Benoist, B., Eds.; World Health Organization: Geneva, Switzerland, 2006; Available online: http://whqlibdoc.who.int/publications/2006/9241594012_eng.pdf?ua=1&ua=1 (accessed on 27 July 2015).
- Olivares, M.; Hertrampf, E.; Pizarro, F. Effect of iron stores on heme iron absorption. Nutr. Res. 1993, 13, 633–638. Available online: http://www.sciencedirect.com/science/article/pii/S027153170580555X (accessed on 11 August 2015). [Google Scholar] [CrossRef]
- Stekel, A.; Olivares, M.; Pizarro, F.; Amar, M.; Chadud, P.; Cayazzo, M.; Llaguno, S.; Vega, V.; Hertrampf, E. The role of ascorbic acid in the bioavailability of iron from infant foods. Int. J. Vitam. Nutr. Res. 1985, 55 (Suppl. S27), 167–175. Available online: http://www.ncbi.nlm.nih.gov/pubmed/3926691 (accessed on 6 June 2015). [Google Scholar] [PubMed]
- Disler, P.B.; Lynch, S.R.; Charlton, R.W.; Torrance, J.D.; Bothwell, T.H.; Walker, R.B.; Mayet, F. The effect of tea on iron absorption. Gut 1975, 16, 193–200. Available online: http://www.ncbi.nlm.nih.gov/pubmed/1168162 (accessed on 6 June 2015). [Google Scholar] [CrossRef] [PubMed]
- Hurrell, R.F.; Juillera, M.A.; Reddy, M.B.; Lynch, S.R.; Dassenko, S.A.; Cook, J.D. Soy protein, phytate, and iron absorption in humans. Am. J. Clin. Nutr. 1992, 56, 573–578. Available online: http://www.ncbi.nlm.nih.gov/pubmed/1503071 (accessed on 6 June 2015). [Google Scholar] [PubMed]
- Hallberg, L.; Brune, M.; Erlandsson, M.; Sandberg, A.S.; Rossander-Hulten, L. Calcium: Effect of different amounts on nonheme- and heme-iron absorption in humans. Am. J. Clin. Nutr. 1991, 53, 112–119. [Google Scholar] [PubMed]
- Fransson, G.B.; Lonnerdal, B. Distribution of trace elements and minerals in human and cow’s milk. Pediatr. Res. 1983, 17, 912–915. Available online: http://www.ncbi.nlm.nih.gov/pubmed/1984335 (accessed on 6 June 2015). [Google Scholar] [CrossRef] [PubMed]
- Saarinen, U.M.; Siimes, M.A.; Dallman, P.R. Iron absorption in infants: High bioavailability of breast milk iron as indicated by the extrinsic tag method of iron absorption and by the concentration of serum ferritin. J. Pediatr. 1977, 91, 36–39. Available online: http://www.ncbi.nlm.nih.gov/pubmed/577504 (accessed on 6 June 2015). [Google Scholar] [CrossRef]
- Hurrell, R.F.; Lynch, S.R.; Trinidad, T.P.; Dassenko, S.A.; Cook, J.D. Iron absorption in humans: Bovine serum albumin compared with beef muscle and egg white. Am. J. Clin. Nutr. 1988, 47, 102–107. Available online: http://www.ncbi.nlm.nih.gov/pubmed/3337027 (accessed on 6 June 2015). [Google Scholar] [PubMed]
- Stekel, A.; Olivares, M.; Pizarro, F.; Chadud, P.; Lopez, I.; Amar, M. Absorption of fortification iron from milk formulas in infants. Am. J. Clin. Nutr. 1986, 43, 917–922. Available online: http://www.ncbi.nlm.nih.gov/pubmed/3717066 (accessed on 6 June 2015). [Google Scholar] [PubMed]
- Hurrell, R.F.; Davidsson, L.; Reddy, M. A comparison of iron absorption in adults and infants consuming identical infant formulas. Br. J. Nutr. 1998, 79, 31–36. Available online: http://www.ncbi.nlm.nih.gov/pubmed/9505800 (accessed on 6 June 2015). [Google Scholar] [CrossRef] [PubMed]
- INACG. Measurement of Iron Status; A report of the International Anemia Consultative Group (INACG); The Nutrition Foundation: Washington, DC, USA, 1985. [Google Scholar]
- Eakins, J.D.; Brown, D.A. An improved method for the simultaneous determination of iron-55 and iron-59 in blood by liquid scintillation counting. Int. J. Appl. Radiat. Isotopes 1966, 17, 191–197. Available online: http://www.ncbi.nlm.nih.gov/pubmed/5967690 (accessed on 6 June 2015). [Google Scholar] [CrossRef]
- Nadler, S.B.; Hidalgo, J.H.; Bloch, T. Prediction of blood volume in normal human adults. Surgery 1962, 51, 224–232. Available online: http://www.ncbi.nlm.nih.gov/pubmed/21936146 (accessed on 6 June 2015). [Google Scholar] [PubMed]
- Bothwell, T.; Charlton, R.; Cook, J.; Finch, C. Iron Metabolism in Man; Blackwell Scientific Publications: Oxford, UK, 1979. [Google Scholar]
- Valenzuela, C.; Olivares, M.; Brito, A.; Hamilton-West, C.; Pizarro, F. Is a 40% absorption of iron from a ferrous ascorbate reference dose appropriate to assess iron absorption independent of iron status? Biol. Trace Element Res. 2013, 155, 322–326. Available online: http://www.ncbi.nlm.nih.gov/pubmed/23979964 (accessed on 6 June 2015). [Google Scholar] [CrossRef] [PubMed]
- Krebs, N.F. Bioavailability of dietary supplements and impact of physiologic state: Infants, children and adolescents. J. Nutr. 2001, 131 (Suppl. S4), 1351S–1354S. Available online: http://www.ncbi.nlm.nih.gov/pubmed/11285353 (accessed on 6 June 2015). [Google Scholar] [PubMed]
- Ferguson, E.L.; Darmon, N.; Fahmida, U.; Fitriyanti, S.; Harper, T.B.; Premachandra, I.M. Design of optimal food-based complementary feeding recommendations and identification of key “problem nutrients” using goal programming. J. Nutr. 2006, 136, 2399–2404. Available online: http://www.ncbi.nlm.nih.gov/pubmed/16920861 (accessed on 6 June 2015). [Google Scholar] [PubMed]
- Beard, J.L. Iron biology in immune function, muscle metabolism and neuronal functioning. J. Nutr. 2001, 131, S568–S579. Available online: http://www.ncbi.nlm.nih.gov/pubmed/11160590 (accessed on 6 June 2015). [Google Scholar]
- Lozoff, B. Iron deficiency and child development. Food Nutr. Bull. 2007, 28, S560–S571. Available online: http://www.ncbi.nlm.nih.gov/pubmed/18297894 (accessed on 6 June 2015). [Google Scholar] [PubMed]
- De Maeyer, E.M.; Dallman, P.; Gurney, J.M.; Hallberg, L.; Sood, S.K.; Srikantia, S.G. Preventing and Controlling iron Deficiency Anaemia through Primary Health Care; World Health Organization: Geneva, Switzerland, 1989; Available online: http://www.who.int/nutrition/publications/micronutrients/anaemia_iron_deficiency/9241542497/en/ (accessed on 11 August 2015).
- Stoltzfus, R.J. Iron interventions for women and children in low-income countries. J. Nutr. 2011, 141, 756S–762S. Available online: http://www.ncbi.nlm.nih.gov/pubmed/21367936 (accessed on 6 June 2015). [Google Scholar] [CrossRef] [PubMed]
- Gillespie, S.R.; Kevany, J.; Mason, J.B.; Administrative Committee on Coordination/Subcommittee on Nutrition State-of-the-Art Series. Controlling Iron Deficiency; Nutrition Policy Discussion Paper No. 9; UN Standing Committee on Nutrition: Geneva, Switzerland, 1991; Available online: http://www.unscn.org/layout/modules/resources/files/Policy_paper_No_9.pdf (accessed on 11 August 2015).
- Hertrampf, E.; Olivares, M.; Pizarro, F.; Walter, T. High absorption of fortification iron from current infant formula. J. Pediatr. Gastroenterol. Nutr. 1998, 27, 425–430. Available online: http://www.ncbi.nlm.nih.gov/pubmed/9779972 (accessed on 6 June 2015). [Google Scholar] [CrossRef] [PubMed]
- Uicich, R.; Pizarro, F.; Almeida, C.; Diaz, M.; Boccio, J.; Zubillaga, M.; Carmuega, E.; O’Donnell, A. Bioavailability of microencapsulated ferrous sulfate in fluid cow’s milk. Studies in human beings. Nutr. Res. 1999, 19, 893–897. Available online: http://www.sciencedirect.com/science/article/pii/S0271531799000494 (accessed on 11 August 2015). [Google Scholar] [CrossRef]
- Van Den Heuvel, E.; Schaafsma, G.; Muys, T.; Van Dokkum, W. Nondigestible oligosaccharides do not interfere with calcium and nonheme-iron absorption in young, healthy men. Am. J. Clin. Nutr. 1998, 67, 445–451. Available online: http://www.ncbi.nlm.nih.gov/pubmed/9497188 (accessed on 2 October 2015). [Google Scholar] [PubMed]
- Petry, N.; Egli, I.; Chassard, C.; Lacroix, C.; Hurrell, R. Inulin modifies the bifidobacteria population, fecal lactate concentration, and fecal pH but does not influence iron absorption in women with low iron status. Am. J. Clin. Nutr. 2012, 96, 325–331. [Google Scholar] [CrossRef] [PubMed]
- WHO/FAO. Vitamin and Mineral Requirements in Human Nutrition; World Health Organization: Geneva, Swutzerland, 2004; Available online: http://apps.who.int/iris/bitstream/10665/42716/1/9241546123.pdf?ua=1 (accessed on 11 August 2015).
© 2015 by the authors; licensee MDPI, Basel, Switzerland. This article is an open access article distributed under the terms and conditions of the Creative Commons by Attribution (CC-BY) license (http://creativecommons.org/licenses/by/4.0/).
Share and Cite
Pizarro, F.; Olivares, M.; Maciero, E.; Krasnoff, G.; Cócaro, N.; Gaitan, D. Iron Absorption from Two Milk Formulas Fortified with Iron Sulfate Stabilized with Maltodextrin and Citric Acid. Nutrients 2015, 7, 8952-8959. https://doi.org/10.3390/nu7115448
Pizarro F, Olivares M, Maciero E, Krasnoff G, Cócaro N, Gaitan D. Iron Absorption from Two Milk Formulas Fortified with Iron Sulfate Stabilized with Maltodextrin and Citric Acid. Nutrients. 2015; 7(11):8952-8959. https://doi.org/10.3390/nu7115448
Chicago/Turabian StylePizarro, Fernando, Manuel Olivares, Eugenia Maciero, Gustavo Krasnoff, Nicolas Cócaro, and Diego Gaitan. 2015. "Iron Absorption from Two Milk Formulas Fortified with Iron Sulfate Stabilized with Maltodextrin and Citric Acid" Nutrients 7, no. 11: 8952-8959. https://doi.org/10.3390/nu7115448