Article

Increased Intraepithelial Vα24 Invariant NKT Cells in the Celiac Duodenum

by
Enrique Montalvillo
1,
David Bernardo
2,3,
Beatriz Martínez-Abad
1,
Yessica Allegretti
4,
Luis Fernández-Salazar
5,
Carmen Calvo
6,
Fernando G. Chirdo
4,
José A. Garrote
1,7,† and
Eduardo Arranz
1,*,†
1
Mucosal Immunology Lab, IBGM, University of Valladolid-CSIC, Sanz y Forés 3, 47003 Valladolid, Spain
2
Antigen Presentation Research Group, Imperial College London, Northwick Park & St Mark’s Campus, Level 7W, St Mark's Building Watford Road Harrow HA1 3UJ, UK
3
Gastroenterology Unit, Hospital Universitario de La Princesa and Instituto de Investigación Sanitaria Princesa (IIS-IP), Centro de Investigación Biomédica en Red de Enfermedades Hepáticas y Digestivas (CIBEREHD), Madrid 28006, Spain
4
Laboratorio de Investigación en el Sistema Inmune –LISIN, Departamento de Ciencias Biológicas, Facultad de Ciencias Exactas, Universidad Nacional de La Plata, 115, La Plata 1900, Buenos Aires, Argentina
5
Gastroenterology Unit, Hospital Clínico Universitario; Ramón y Cajal 3, Valladolid 47005, Spain
6
Paediatric Unit, Hospital Clínico Universitario; Ramón y Cajal 3, Valladolid 47005, Spain
7
Medical Laboratory Service, Hospital Universitario Rio Hortega; Dulzaina 2, Valladolid 47012, Spain
*
Author to whom correspondence should be addressed.
These authors contributed equally to this work.
Nutrients 2015, 7(11), 8960-8976; https://doi.org/10.3390/nu7115444
Submission received: 23 July 2015 / Revised: 16 October 2015 / Accepted: 21 October 2015 / Published: 30 October 2015
(This article belongs to the Special Issue Gluten Related Disorders: People Shall not Live on Bread Alone)

Abstract

:
Celiac Disease (CD) is an interferon (IFN)γ-mediated duodenal hypersensitivity to wheat gluten occurring in genetically predisposed individuals. Gluten-free diet (GFD) leads to a complete remission of the disease. Vα24-restricted invariant NKT (iNKT) cells are important to maintain immune homeostasis in the gut mucosa because of their unique capacity to rapidly produce large quantities of both T-helper (Th)1 and Th2 cytokines upon stimulation. We studied the presence of these cells in the CD duodenum. Duodenal biopsies were obtained from 45 untreated-CD patients (uCD), 15 Gluten Free Diet-CD patients (GFD-CD), 44 non-inflamed non-CD controls (C-controls) and 15 inflamed non-CD controls (I-controls). Two populations from Spain and Argentina were recruited. Messenger RNA (mRNA) expression of Vα24-Jα18 (invariant TCRα chain of human iNKT cells), IFNγ and intracellular transcription factor Forkhead Box P3 (Foxp3), and flow cytometry intraepithelial lymphocyte (IEL) profile were determined. Both uCD and GFD-CD patients had higher Vα24-Jα18 mRNA levels than non-CD controls (I and C-controls). The expression of Vα24-Jα18 correlated with Marsh score for the severity of mucosal lesion and also with increased mRNA IFNγ levels. uCD and GFD-CD patients had decreased mRNA expression of FoxP3 but increased expression of Vα24-Jα18, which revealed a CD-like molecular profile. Increased numbers of iNKT cells were confirmed by flow cytometry within the intraepithelial lymphocyte compartment of uCD and GFD-CD patients and correlated with Vα24-Jα18 mRNA expression. In conclusion, we have found an increased number of iNKT cells in the duodenum from both uCD and GFD-CD patients, irrespective of the mucosal status. A CD-like molecular profile, defined by an increased mRNA expression of Vα24-Jα18 together with a decreased expression of FoxP3, may represent a pro-inflammatory signature of the CD duodenum.

1. Introduction

Celiac disease (CD) is an inflammatory disorder of the small intestine induced by wheat gluten and other prolamins from rye, barley and some varieties of oats [1] in genetically susceptible individuals. It is characterized by an interferon (IFN)-γ mediated type I cytokine profile [2]. CD manifestation is characterized by an increased number of intraepithelial and lamina propria lymphocytes, villous atrophy, tissue remodeling and the presence of anti-transglutaminase antibodies [3]. At present, the only treatment for CD is a life-long strict gluten-free diet (GFD), which normally leads to a complete remission of the disease [4].
Gut intraepithelial lymphocytes (IEL) comprise a heterogeneous population of cells outside the normal circulation. In addition to conventional T lymphocytes (CD3+ TCRαβ+, either CD4+ or CD8+) with an outstanding CD3+ CD8+ prevalence, Natural Killer (NK) cells and unconventional IEL populations such as CD8αα, TCRγδ+ cells, CD3+CD4CD8 cells and NKT lymphocytes are widely represented [5,6].
Increased total numbers of IEL CD3+ (both classical and TCRγδ+) and decreased IEL non-T cells (CD3, CD103+) have been consistently reported in CD [7,8,9]. A direct cytolytic effect of conventional CD3+αβ+CD8+ cytotoxic IEL on adjacent enterocytes is undisputed [10,11] and related to villous atrophy [7]. However, the role of IEL TCRγδ+ in CD pathogenesis remains elusive, although they may have a key role in oral tolerance as supported by the identification of a subset of regulatory TCRγδ+ IEL population capable of limiting the cytotoxicity of IEL in CD treated on a GFD [12].
Classical regulatory Tcells (Tregs; CD3+, CD4+, CD25+ and intracellular transcription factor Forkhead Box P3+ (FoxP3+)) and non-classical interleukin (IL)-10 producing regulatory cells (Tr1: CD3+, CD4+, CD25 and intracellular FoxP3) are the main regulatory T-cells found in the intestine [13]. Tregs elicit their function by suppressing IL-2 production and T-cell proliferation [14], while Tr1 cells are the main source of IL-10 in the intestinal lamina propria since they are chronically stimulated and limit the production of pro-inflammatory cytokine by controlling inflammatory responses to dietary antigens. Compared to Tregs, the finding of larger numbers of Tr1 in the intestinal lamina propria suggests that these cells have an important regulatory capacity [15,16].
Invariant NKT cells (iNKT; CD3+, TCR Vα24+Vβ11+) are also important to maintain immune homeostasis [13]. Human iNKT cells express classical NK cell markers as well as an invariant TCRα chain (iNKTα) (Vα24-Jα18 in humans) paired to “semi-invariant” TCRβ chains (iNKTβ), which recognizes antigens presented by the major histocompatibility complex (MHC) class I-like molecule CD1d [17,18]. For all iNKT-cell TCRs, binding to CD1d is primarily mediated by the Vα-Jα rearranged invariant CDR3α loop [19]. Therefore, the anti-Vα24-Jα18 is the standard method used to detect human iNKT cells [20,21]. These cells can be sub-divided into CD4+ and CD4 (most of these CD4CD8) cells. CD4CD8 iNKT cells produce predominantly T-helper (Th)1 cytokines (IFNγ and TNFα) whereas CD4+ iNKT cells can produce both Th1 and Th2 (IL-4 and IL-13) cytokines [13]. Because of their unique capacity to rapidly produce large quantities of both Th1 (IFNγ) and Th2 (IL-4) cytokines upon stimulation [22], iNKT cells may have a key role in protection against tumors or in preventing autoimmune disease [23]. Despite low numbers, iNKT cells have a central role in intestinal homeostasis [17,24,25] and are essential for the development of oral tolerance [26,27]. Nevertheless, their number within the intraepithelial and lamina propria compartments and their specific role in CD pathogenesis remains elusive.
In this manuscript, we aimed to study whether changes in the number of iNKT cells may be altered in the duodenum of CD patients. To these aim we assessed the mRNA expression of Vα24-Jα18 and the proportion of iNKT cells within the intraepithelial compartment to reveal an increased number of these cells in the CD mucosa.

2. Materials and Methods

2.1. Patients and Biopsy Samples

Duodenal samples were collected from two independent populations in Spain (Hospital Clínico Universitario de Valladolid) and Argentina (Biobank from the LISIN, La Plata). The Spanish population included 25 untreated celiac patients (uCD, mean age 28.9 years; range 5–76 years; 42% males) (Table S1), 15 CD patients treated with GFD (GFD-CD; mean age 34.2 years; range 4-71 years; 34% males) (Table S2), 15 non-CD patients with other inflamed conditions (I-controls, mean age 42.1 years; range 15–78 years; 56% males) (Table S3) and 25 non-inflamed non-CD controls (C-controls; mean age 38.3 years; range 6–81 years; 30% males) (Table S4). The Argentinian population included 20 uCD patients (mean age 24.8 years; range 4-56 years; 28% males) (Table S5) and 19 C-controls (mean age 31.4 years; range 6–62 years; 52% males) (Table S6). Regarding age and gender, no statistically differences were found between Spanish and Argentinian patients. Clinical data from patient groups included in the study are shown in Table 1. The experiments were conducted with the understanding and the written consent of the adult participants, or the next of kin, caretakers, or guardians on behalf of the minors/children enrolled in this study. The study and the written consent procedure were approved by the Ethics committees from Hospital Clínico Universitario of Valladolid and Biobank from the LISIN, La Plata.
Table 1. Clinical data from patient groups included in the study.
Study PatientsnMean age (Range)GenderHLA DQ2/DQ8IgA anti- tTG/EMAMarsh Criteria at DiagnosisGFD
Celiac PatientsuCD4527.1 (4–76)36% males++II-IIINo
GFD-CD1534.2 (4–71)34% males+-II-IIIYes
Non Celiac PatientsI-controls1542.1 (15–78)56% males+/-- (*A)0-I (M.M)No
C-controls4435.3 (6–81)41% males- (*B)- (*A)0No
uCD (untreated celiac patients), GFD-CD (celiac patients treated with gluten free diet), I-controls (non celiac patients with other inflamed conditions) and C-controls (non-celiac disease patients without other inflamed conditions). IgA anti-tTG (Anti-tissue transglutaminase antibodies), EMA (Endomysium antibodies), GFD (Gluten free diet). M.M (mild mucosal alterations non compatibles with celiac disease). *A Serological test were performed only in genetically susceptible patients. *B Two patients had positive genetic susceptibility markers.
At diagnosis, all CD patients had CD-compatible symptoms, positive anti-endomysium and/or anti-transglutaminase IgA antibodies, CD-associated risk alleles (HLA-DQ2 and DQ8), and duodenal biopsy with histopathological changes. No differences in clinical markers were found between Spanish and Argentinian CD individuals. Patients on a GFD showed an improvement of the histological lesion (Marsh 0-I), and negative serum anti-transglutaminase antibodies for at least one year. Control groups were collected from patients referred to the gastroenterology clinics for diagnostic investigations due to clinical suspicion of intestinal disease (chronic diarrhea, gastritis by Helicobacter pylori, hiatus hernia, etc.). Similar symptoms were observed in both populations. Some of these cases showed duodenal inflammation (I-controls) while lack of mucosal affection was found in C-controls. None of them had a final diagnosis of CD.

2.2. Quantitative PCR

Duodenal biopsies from the Spanish (40 CD patients (25 uCD and 15 GFD-CD), 25 C-controls and 15 I-controls) and the Argentinian population (20 uCD and 19 C-controls) were submerged in 0.5 mL of RNALater® solution (Ambion Inc, Austin, Texas, USA) and stored at −20 °C immediately after sample taking. Total RNA was isolated using the TRI-Reagent® Solution according to manufacturer instructions (Ambion Inc, Austin, Texas, USA). In parallel, 15 duodenal samples from each group of patients from the Spanish population were also analyzed by flow cytometry as described below to determine the phenotype of lymphocytes and iNKT cells.
Reverse transcription was carried out by using the SuperScript® First-Strand Synthesis System for reverse transcriptase (RT)-PCR Kit (Applied Biosystems, Carlsbad, CA, USA) with random hexamers as primers. Reactions were performed using the FastStart SYBR Green MasterMix (Roche Applied Science, Mannheim, Germany) with thermolabile Uracil DNA Glycosylase to prevent carry-over contamination. Messenger RNA levels (βactin, IFNγ, Vα24-Jα18 and FoxP3) were measured by quantitative PCR (qPCR) on a LightCycler® instrument (Roche Applied Science, Mannheim, Germany) after extrapolation to an external curve. Primer sets and PCR conditions are described in Table 2. Levels of mRNA are expressed as the ratio molecule/βactin in arbitrary units (AU).
Table 2. Primer sequences for quantitative-PCR.
MoleculePrimers SequenceNCBI LocusAnnealing T
βactinfw: 5′ - ATG GGT CAG AAG GAT TCC TAT GTG - 3′
rv: 5′ - CTT CAT GAG GTA GTC AGT CAG GTC - 3′
NM_001101.360
IFNγfw: 5′ - TGG AAA GAG GAG AGT GAC AG - 3′
rv: 5′ - ATT CAT GTC TTC CTT GAT GG - 3′
NM_000619.260
Vα24-Jα18fw: 5′ - CTG GAG GGA AAG AAC TGC - 3′
rv: 5′ - TGT CAG GGA AAC AGG ACC - 3′
NC_000014.965
FoxP3fw: 5′ - CAG CAC ATT CCC AGA GTT CCT C - 3′
rv: 5′ - GCG TGT GAA CCA GTG GTA GAT C - 3′
NM_014009.360
Primer sequences used for quantitative-PCR. NCBI locus and annealing temperature point (annealing T). IFNγ (interferon-γ), Vα24-Jα18 (invariant TCRα chain of human iNKT cells), FoxP3 (intracellular transcription factor Forkhead Box P3).

2.3. Isolation of Intraepithelial Lymphocytes and Lamina Propria Mononuclear Cells

Biopsy samples from 15 uCD, 15 GFD, 15 non-inflamed non-CD controls (C-controls) and 15 inflamed non-CD controls (I-controls) were collected from the Spanish population. Samples were kept in ice-chilled physiologic phosphate buffered saline (PBS) and processed within an hour as previously described [28,29]. Briefly, IEL and epithelial cells were released from the mucosal specimens by incubation for 1 hour under gentle agitation with 1 mM ethylenediaminetetraacetic acid (EDTA) and 1 mM dithiothreitol (DTT) in RPMI 1640 medium (GibcoBRL Life Technologies, Vienna, Austria) supplemented with 10% fetal calf serum, 2mM l-glutamine, 100U/mL penicillin, 100 μg/mL streptomycin and 0.25 μg/mL amphotericin (GibcoBRL Life Technologies, Vienna, Austria). Following DTT and EDTA incubation IEL were released into the medium and collected by centrifugation, washed twice in PBS (Lonza, Braine-l’Alleud, Belgium) and stained with fluorochrome-conjugated monoclonal antibodies (mAbs).
The remaining tissue was incubated in moderated rotation at 37 °C for 90–120 min. with 1 mg/mL of collagenase D in RPMI 1640 medium (GibcoBRL Life Technologies, Vienna, Austria) supplemented with 10% fetal calf serum and antibiotics until the biopsies have been completely degraded. Single cell suspensions were filtered (70 μm Nylon Filter, BD Biosciences, San Diego, CA, USA) to remove non-cellular fibers, and the lamina propria mononuclear cells (LPMC) suspension was washed twice in PBS.

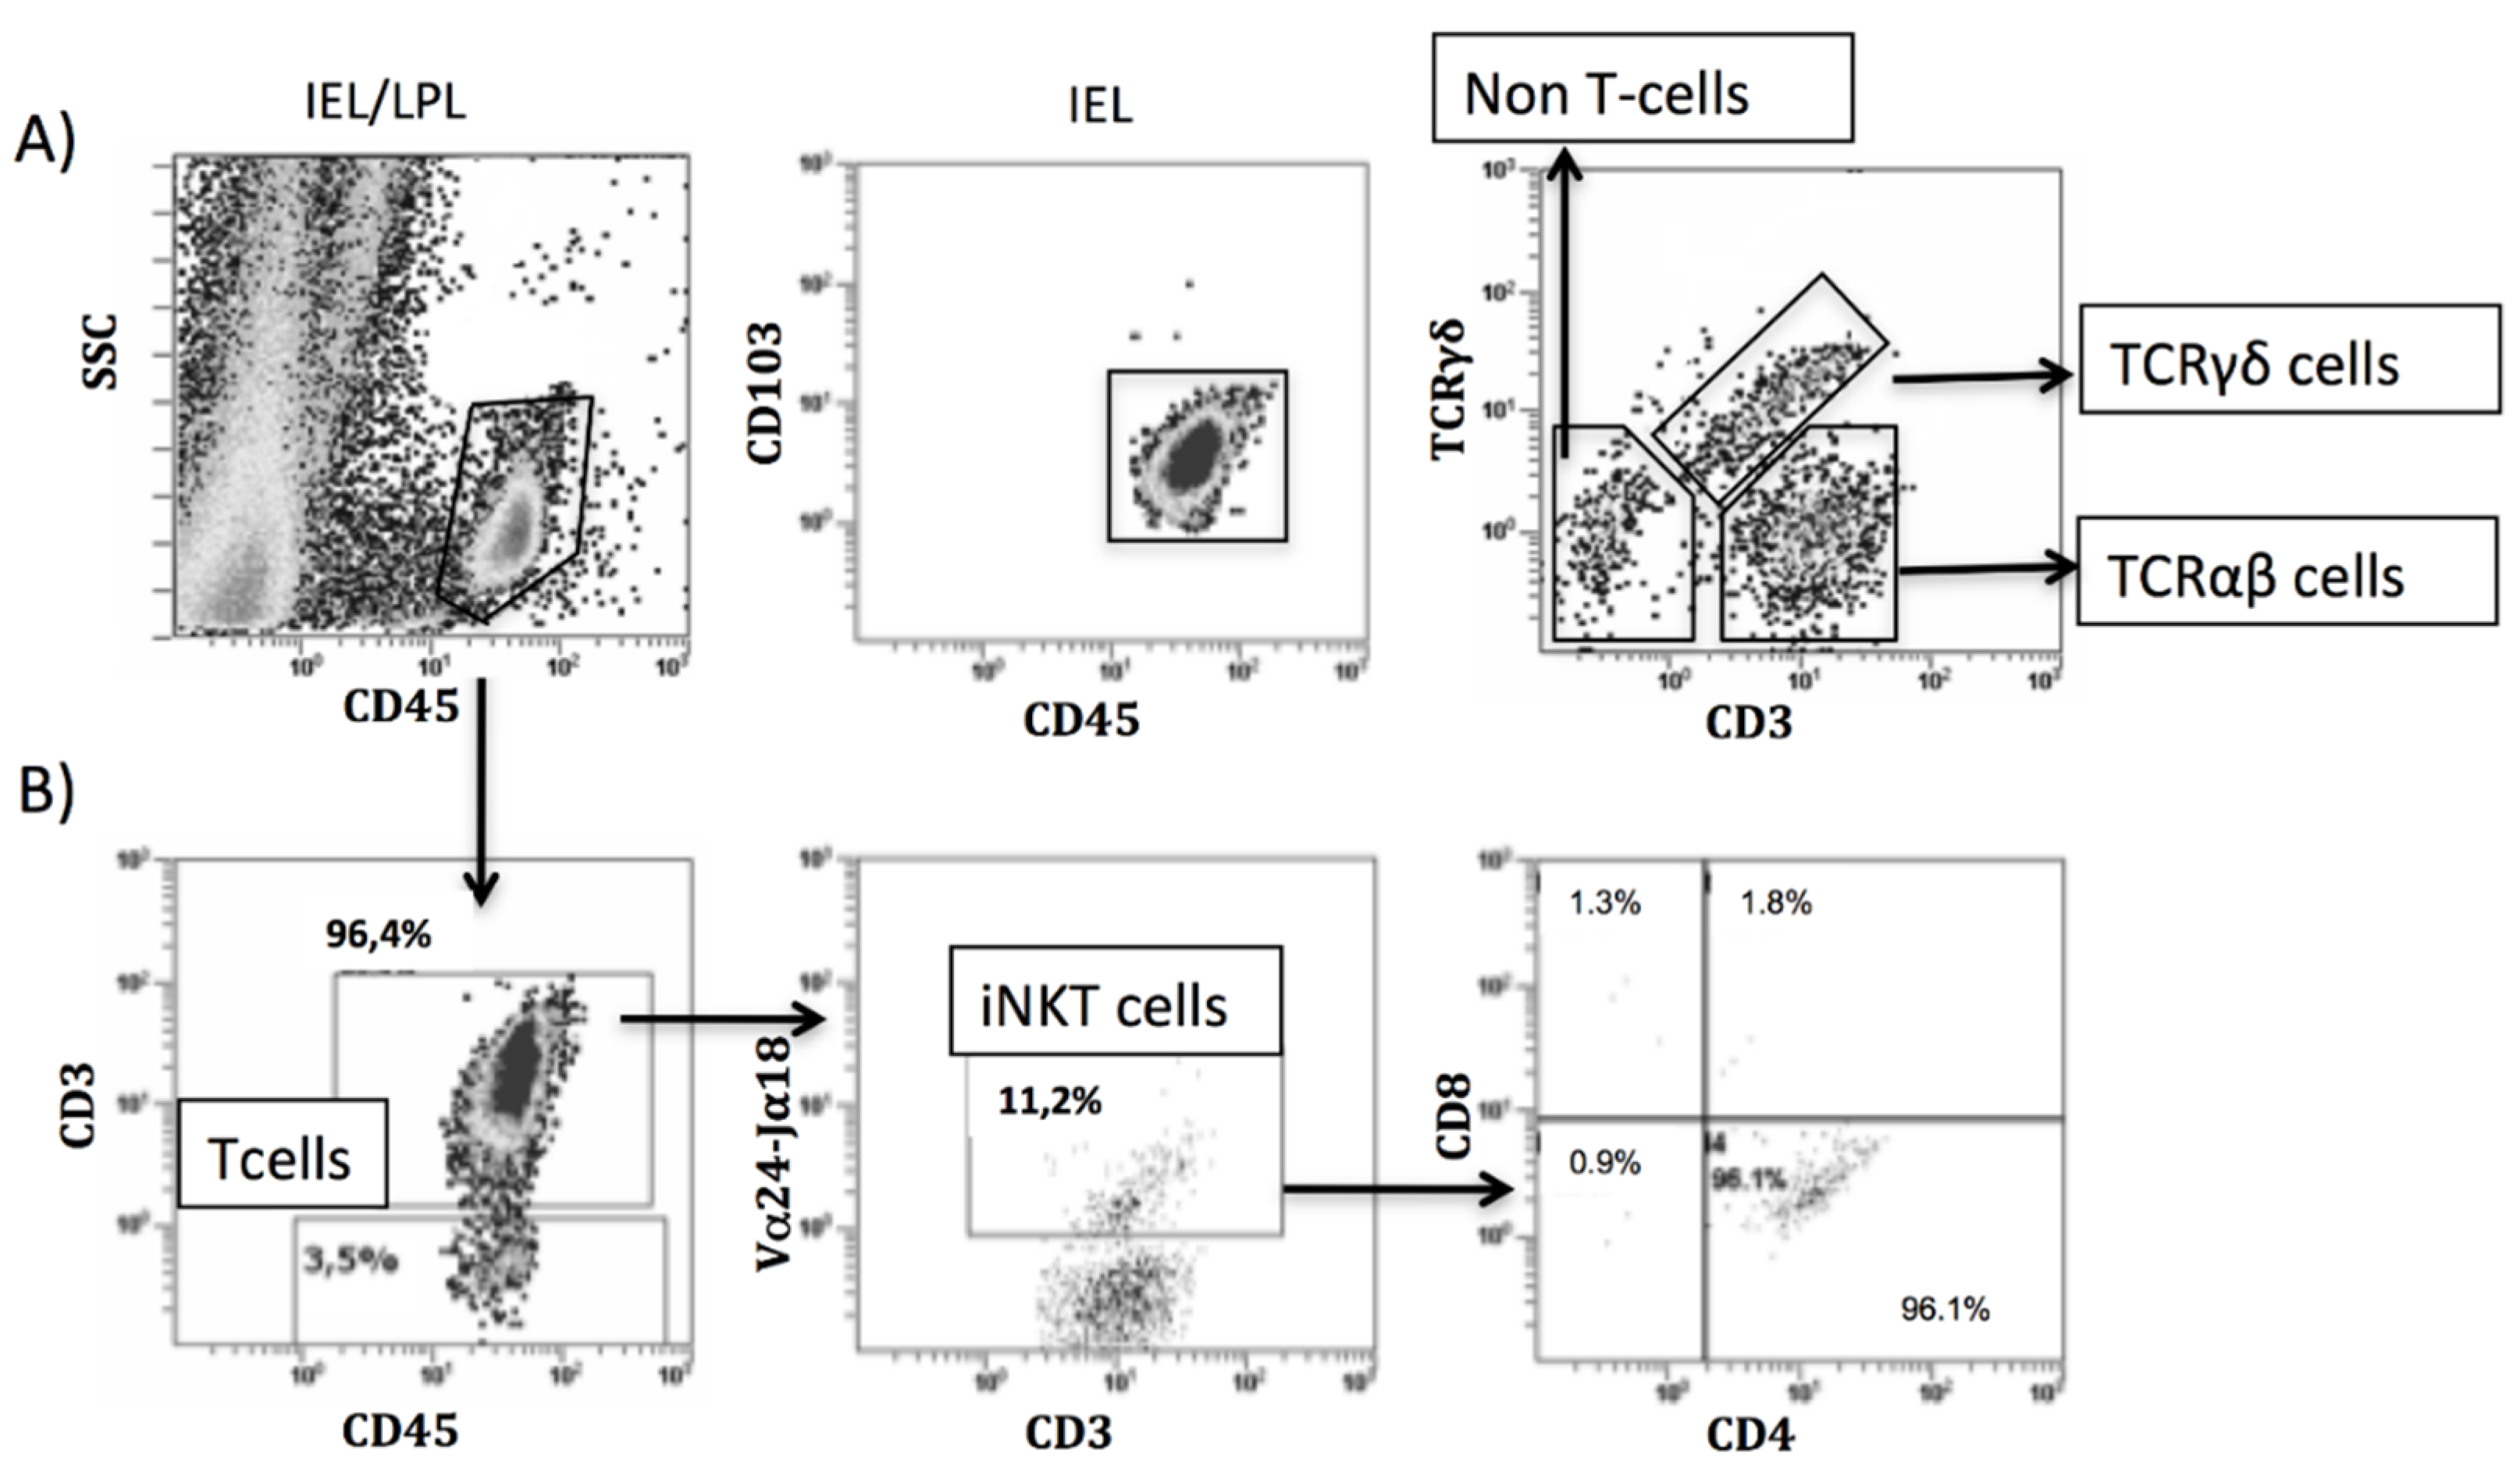
2.4. Antibody Labeling and Flow Cytometry Analysis

A total of 100,000 isolated cells (IEL or LPMC) were labeled with fluorochrome-conjugated monoclonal antibodies (mAbs) and their appropriate isotype-matched control antibodies from the same manufacturers. The fluorochrome-conjugated mAbs were: FITC Mouse anti-human CD103 (clone Ber-ACT8), PE Mouse anti-human Vα24-Jα18 (clone 6B11, specifically recognizing all T cells expressing the conserved CDR3 region of the Vα24Jα18 invariant TCRα rearrangement), PE Mouse anti-human TCRγδ (clone B1), APC Mouse anti-human CD3 (clone HIT3a), APC Mouse anti-human CD25 (clone M-A251), PE-Cy7 Mouse anti-human CD8 (clone RPA-T8) and PE-Cy7 Mouse anti-human CD45 (clone HI30) from BD Pharmingen (San Diego, CA, USA); PE Mouse anti-human FoxP3 (clone PCH101) from eBioscience (San Diego, CA, USA); FITC Mouse anti-human CD4 (clone 13B8.2) and PE Mouse anti-human CD8 (clone B9.11) from Beckman Coulter (Brea , CA, USA). Cells were labeled in phosphate-buffered saline containing 1 mM EDTA and 0.02% sodium azide (fluorescent-activated cell sorting (FACS) buffer). Labeling was performed on ice and in the dark for 20 min. Cells were washed twice in FACS buffer, fixed with 1% paraformaldehyde in 0.85% saline, and stored at 4 °C before acquisition on the flow cytometer within 24 h. For FoxP3 intracellular staining, cells were fixed with Leucoperm A following surface staining and permeabilized with Leucoperm B (Bio-Rad, UK) before adding antibody for intracellular labeling. After incubation cells were washed in FACS buffer, fixed, and acquired as previously reported.
Cells were acquired in a Beckman Coulter FC500 flow cytometer and data processed with Cell BC software (Beckman Coulter, Brea, CA, USA). All IEL and lamina propria lymphocyte (LPL) cells were identified as CD45+ (leukocyte pan-marker) and IELs were also identified as CD103+. Non-T cells (CD3), TCRγδ cells (CD3+TCRγδ+), TCRαβ cells (CD3+TCRγδ) (Figure 1A), iNKT cells (CD3+Vα24-Jα18+) (Figure 1B) and Treg cells (CD3+CD4+CD25+FoxP3+ or CD3+CD4+FoxP3+) were identified by flow cytometry within the intraepithelial and the lamina propria compartments. Numbers of cells were expressed as percentages.
Figure 1. Identification of intraepithelial and lamina propria lymphocytes by flow cytometry. Example of characterization of intraepithelial lymphocytes (IELs)/lamina propria lymphocytes (LPL) in an untreated celiac disease donor. Lamina propria (CD45+) and IEL (CD45+CD103+) were identified and percentages of TCRαβ cells, TCRγδ cells and non-T cells determined (A). Example of characterization of invariant NKT (iNKT) cells in an untreated celiac disease donor: CD45+CD3+Vα24-Jα18+ cells within the total of CD45+CD3+ cells, iNKT (CD45+CD3+Vα24-Jα18+) phenotype according to the expression of CD4 and/or CD8 within the total of iNKTs (B).
Nutrients 07 05444 g001

2.5. Statistical Analysis

Correlation analyses and two-tailed non-parametric statistical analyses were performed using the Kruskal-Wallis one way analysis of variance test, the Mann-Whitney U test and the non-parametric Spearman’s correlation. p < 0.05 was considered significant. Flow cytometry results were expressed as percentages and analysed by the two-tailed non-parametric Mann-Whitney U test. p < 0.05 was considered significant. Reference values of the IEL subpopulations for each patient’s group were expressed as median percentages with the interquartile range (IQR).

3. Results

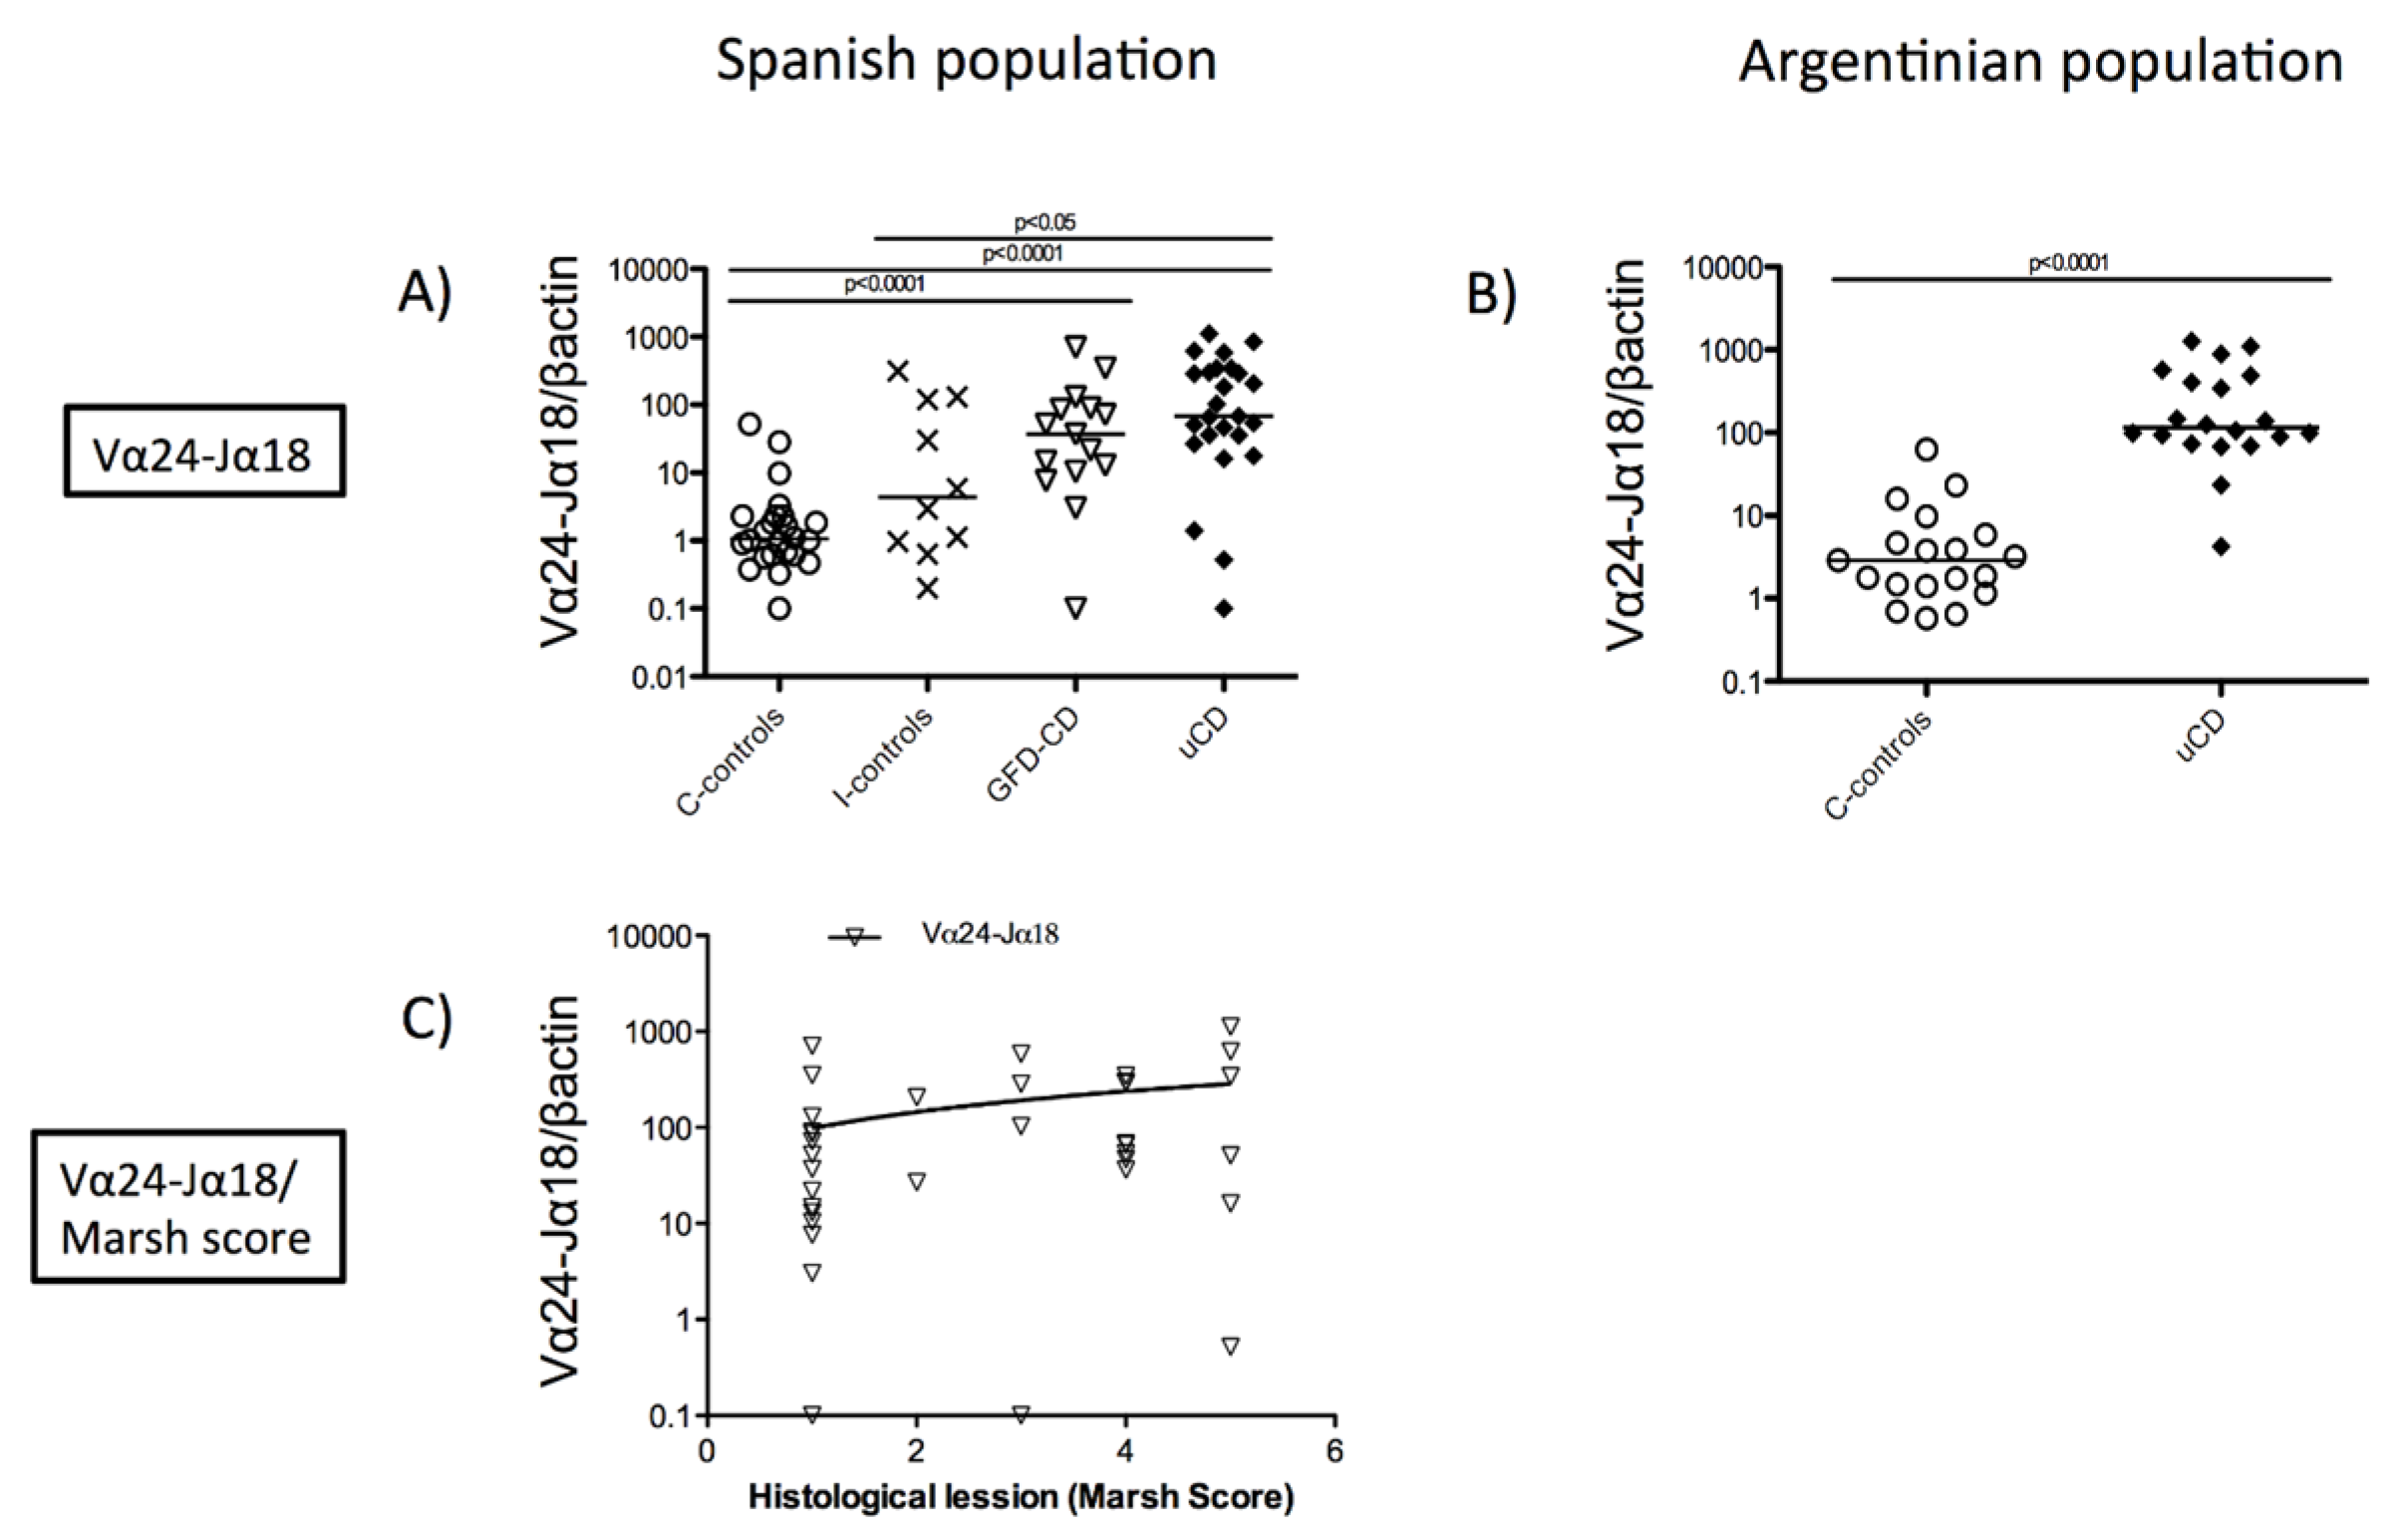
3.1. Increased Duodenal Vα24-Jα18 mRNA Expression in Celiac Disease Patients

Due to the low numbers of iNKT cells both in blood [21] and tissue samples [22] we first studied the proportion of iNKT cells in duodenal biopsies by assessing the mRNA expression or their restrictive invariant Vα24-Jα18 chain in complete biopsy explants [20,21].
Untreated-CD patients (uCD) had increased Vα24-Jα18 mRNA levels compared to both inflamed non-CD (I-controls) (p < 0.05) and non-inflamed non-CD controls (C-controls) (p < 0.001) (Figure 2A). Gluten Free Diet-CD patients (GFD-CD) had increased Vα24-Jα18 mRNA levels compared to C-controls (p < 0.001). No differences were found between uCD and GFD-CD patients, which suggests an increased load of iNKT cells in duodenal biopsies from both groups of patients irrespectively of the disease status (Figure 2A). We also analyzed duodenal expression of Vα24-Jα18 mRNA in an independent population from Argentina. Figure 2B confirms that CD patients show increased duodenal Vα24-Jα18 mRNA levels compared to non-inflamed non-CD controls (p < 0.001), irrespectively of the origin of the samples. No statistically significant differences in Vα24-Jα18 mRNA levels were found between the Spanish and the Argentinian populations, neither within the control nor the untreated CD patient groups.
Samples from GFD-CD patients showed a Marsh score for the severity of the mucosal lesion between 0 and I, and no differences were found in these sub-groups regarding Vα24-Jα18 mRNA expression. Untreated CD patients had a Marsh score rating from I to IIIc, and in these patients, Vα24-Jα18 mRNA levels correlated with the Marsh score (Spearman’s r = 0.063, p < 0.05) (Figure 2C).

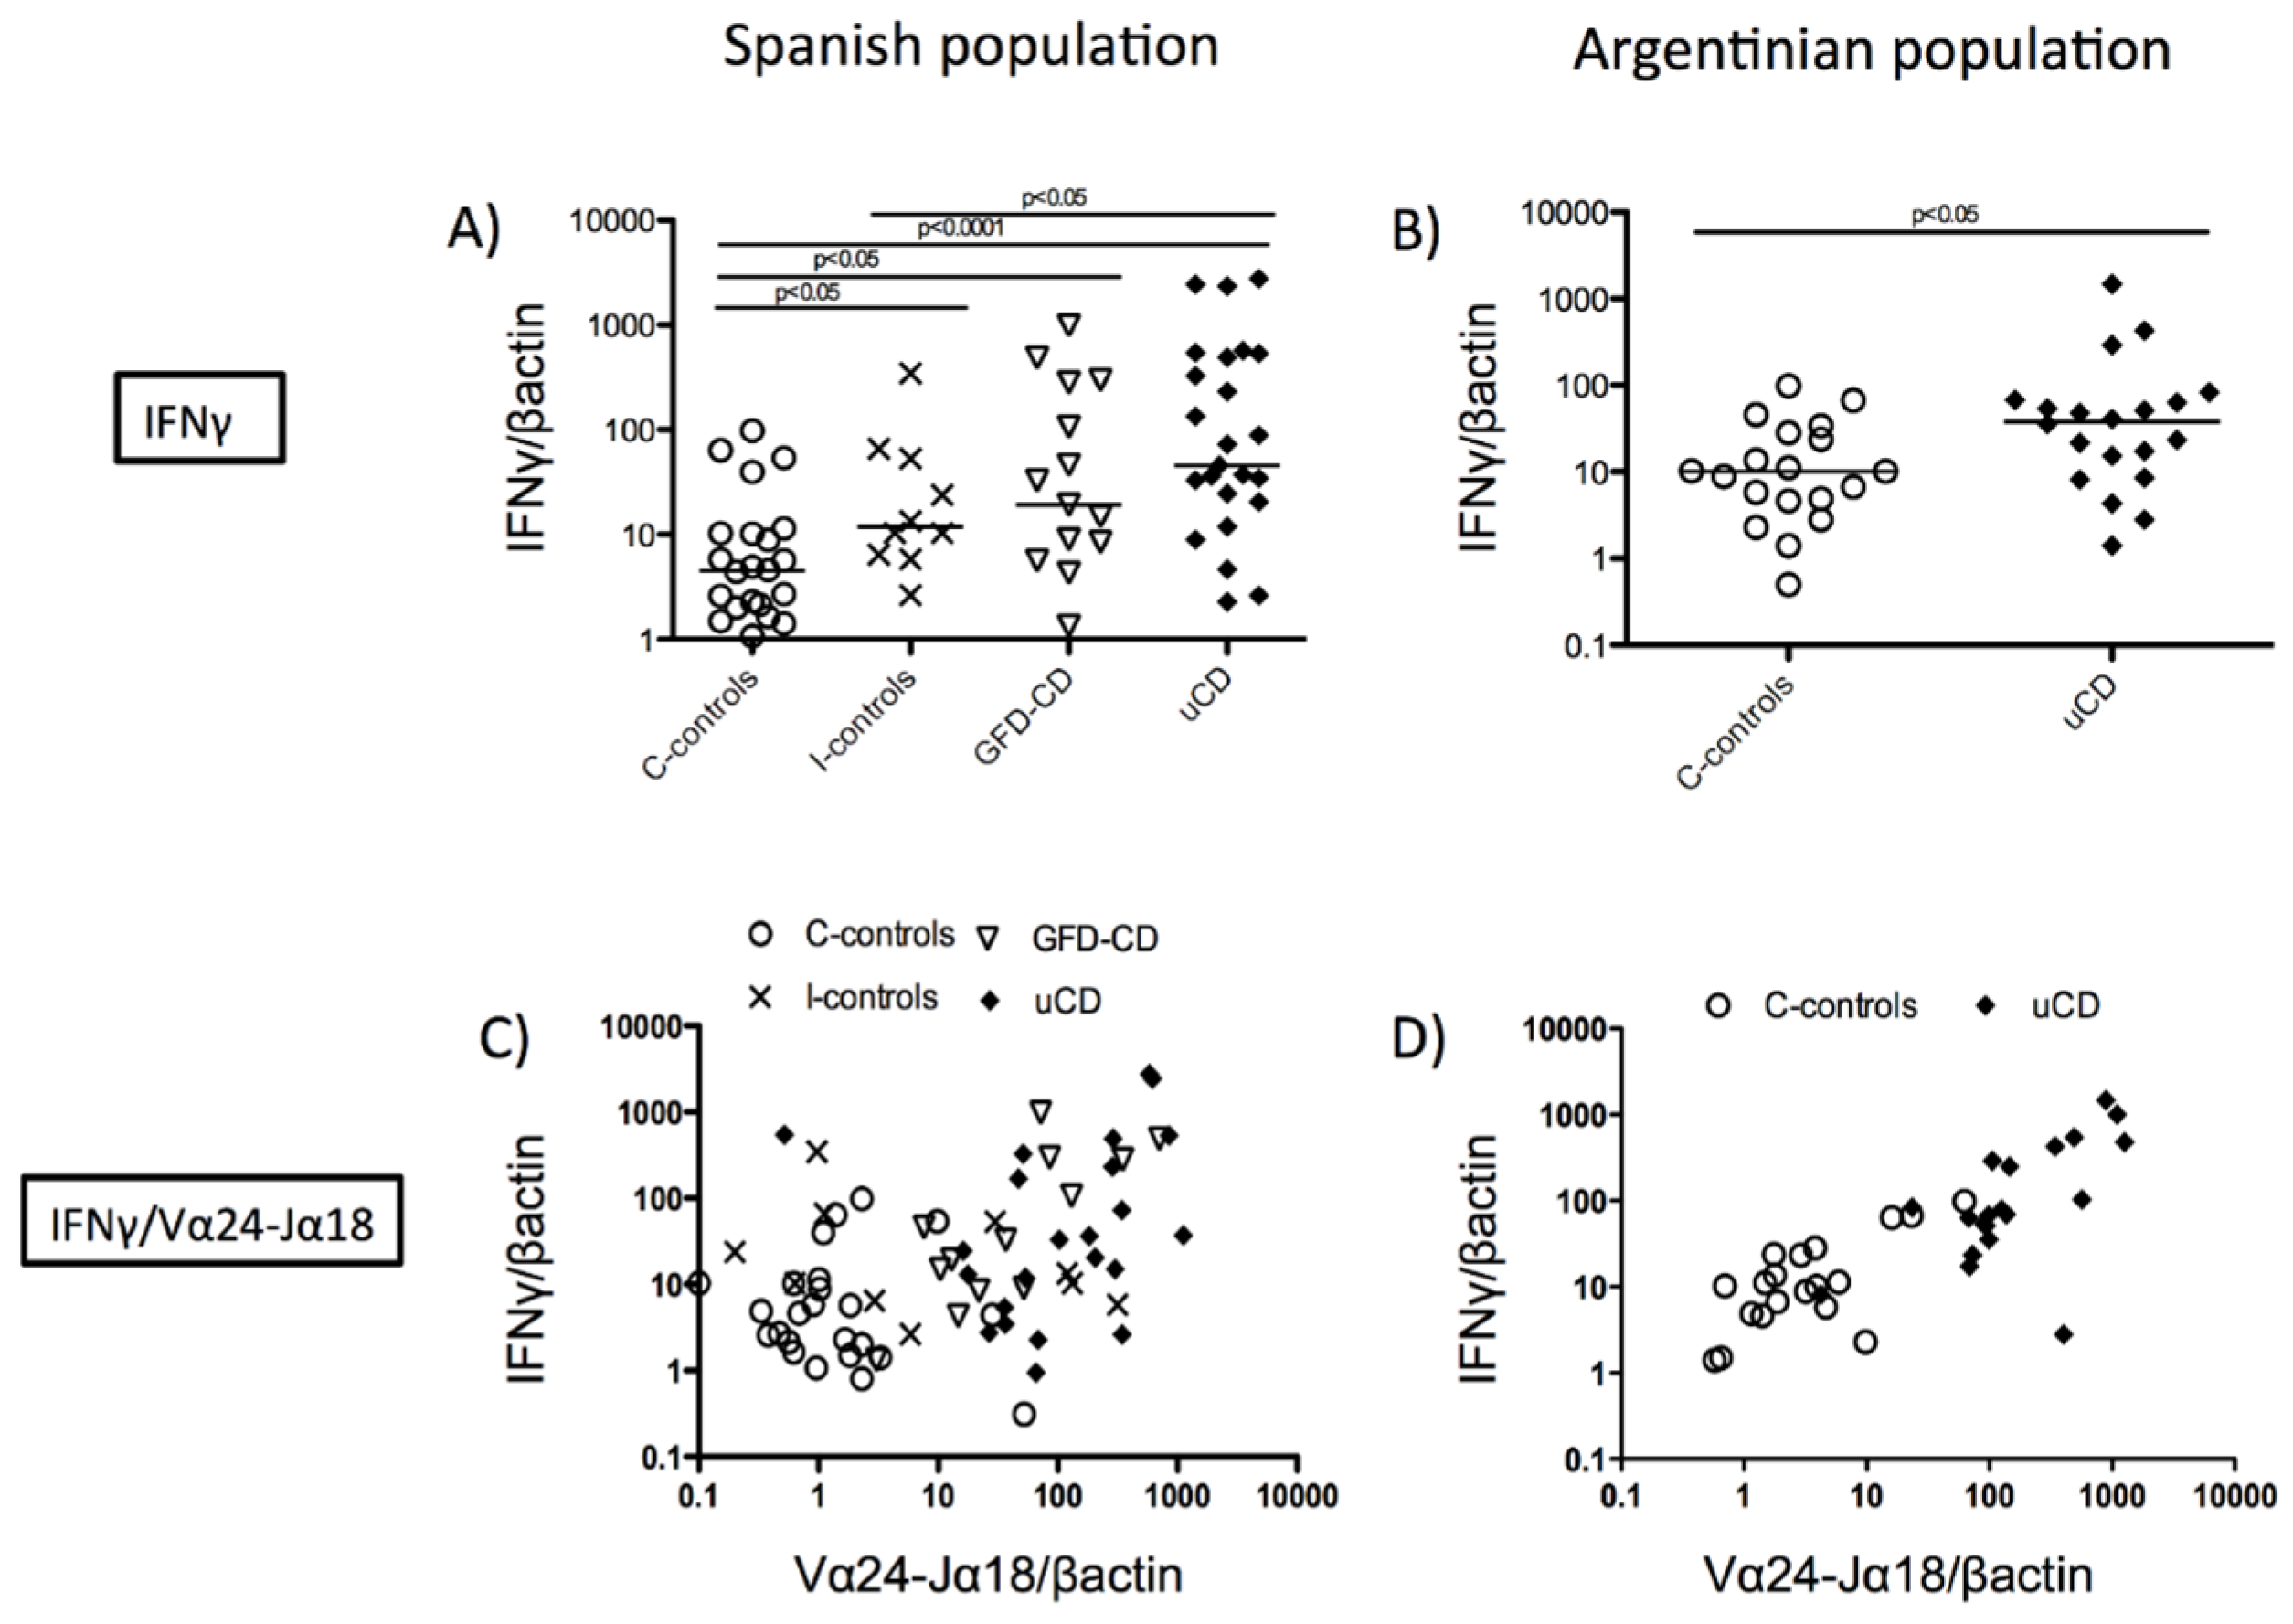
3.2. Correlation between Duodenal Vα24-Jα18 and IFNγ mRNA Expression in Celiac Disease

Duodenal samples from CD patients (either treated and untreated) had increased IFNγ mRNA expression compared with non-inflamed non-CD controls both in the Spanish (GFD-CD, p < 0.05; uCD, p < 0.001) (Figure 3A) and the Argentinian populations (uCD, p < 0.05) (Figure 3B) as previously described [30,31]. Since both mRNA levels of IFNγ [2,30] and Vα24-Jα18 (Figure 2C) correlated with the Marsh score for the severity of the mucosal lesion, we studied if the expression of IFNγ and Vα24-Jα18 was related. A correlation was found between the mRNA levels of IFNγ and Vα24-Jα18 in treated and untreated CD samples in both the Spanish (C-controls: Spearman’s r = 0.3115, p value = n.s; I-controls: Spearman’s r = 0.4265, p value = n.s; GFD-CD: Spearman’s r = 0.5393, p < 0.05; uCD: Spearman’s r = 0.4323, p < 0.05) and the Argentinian populations (C-controls: Spearman’s r = 0.5895, p < 0.05; uCD: Spearman’s r = 0.6917, p < 0.001) (Figure 3C,D).

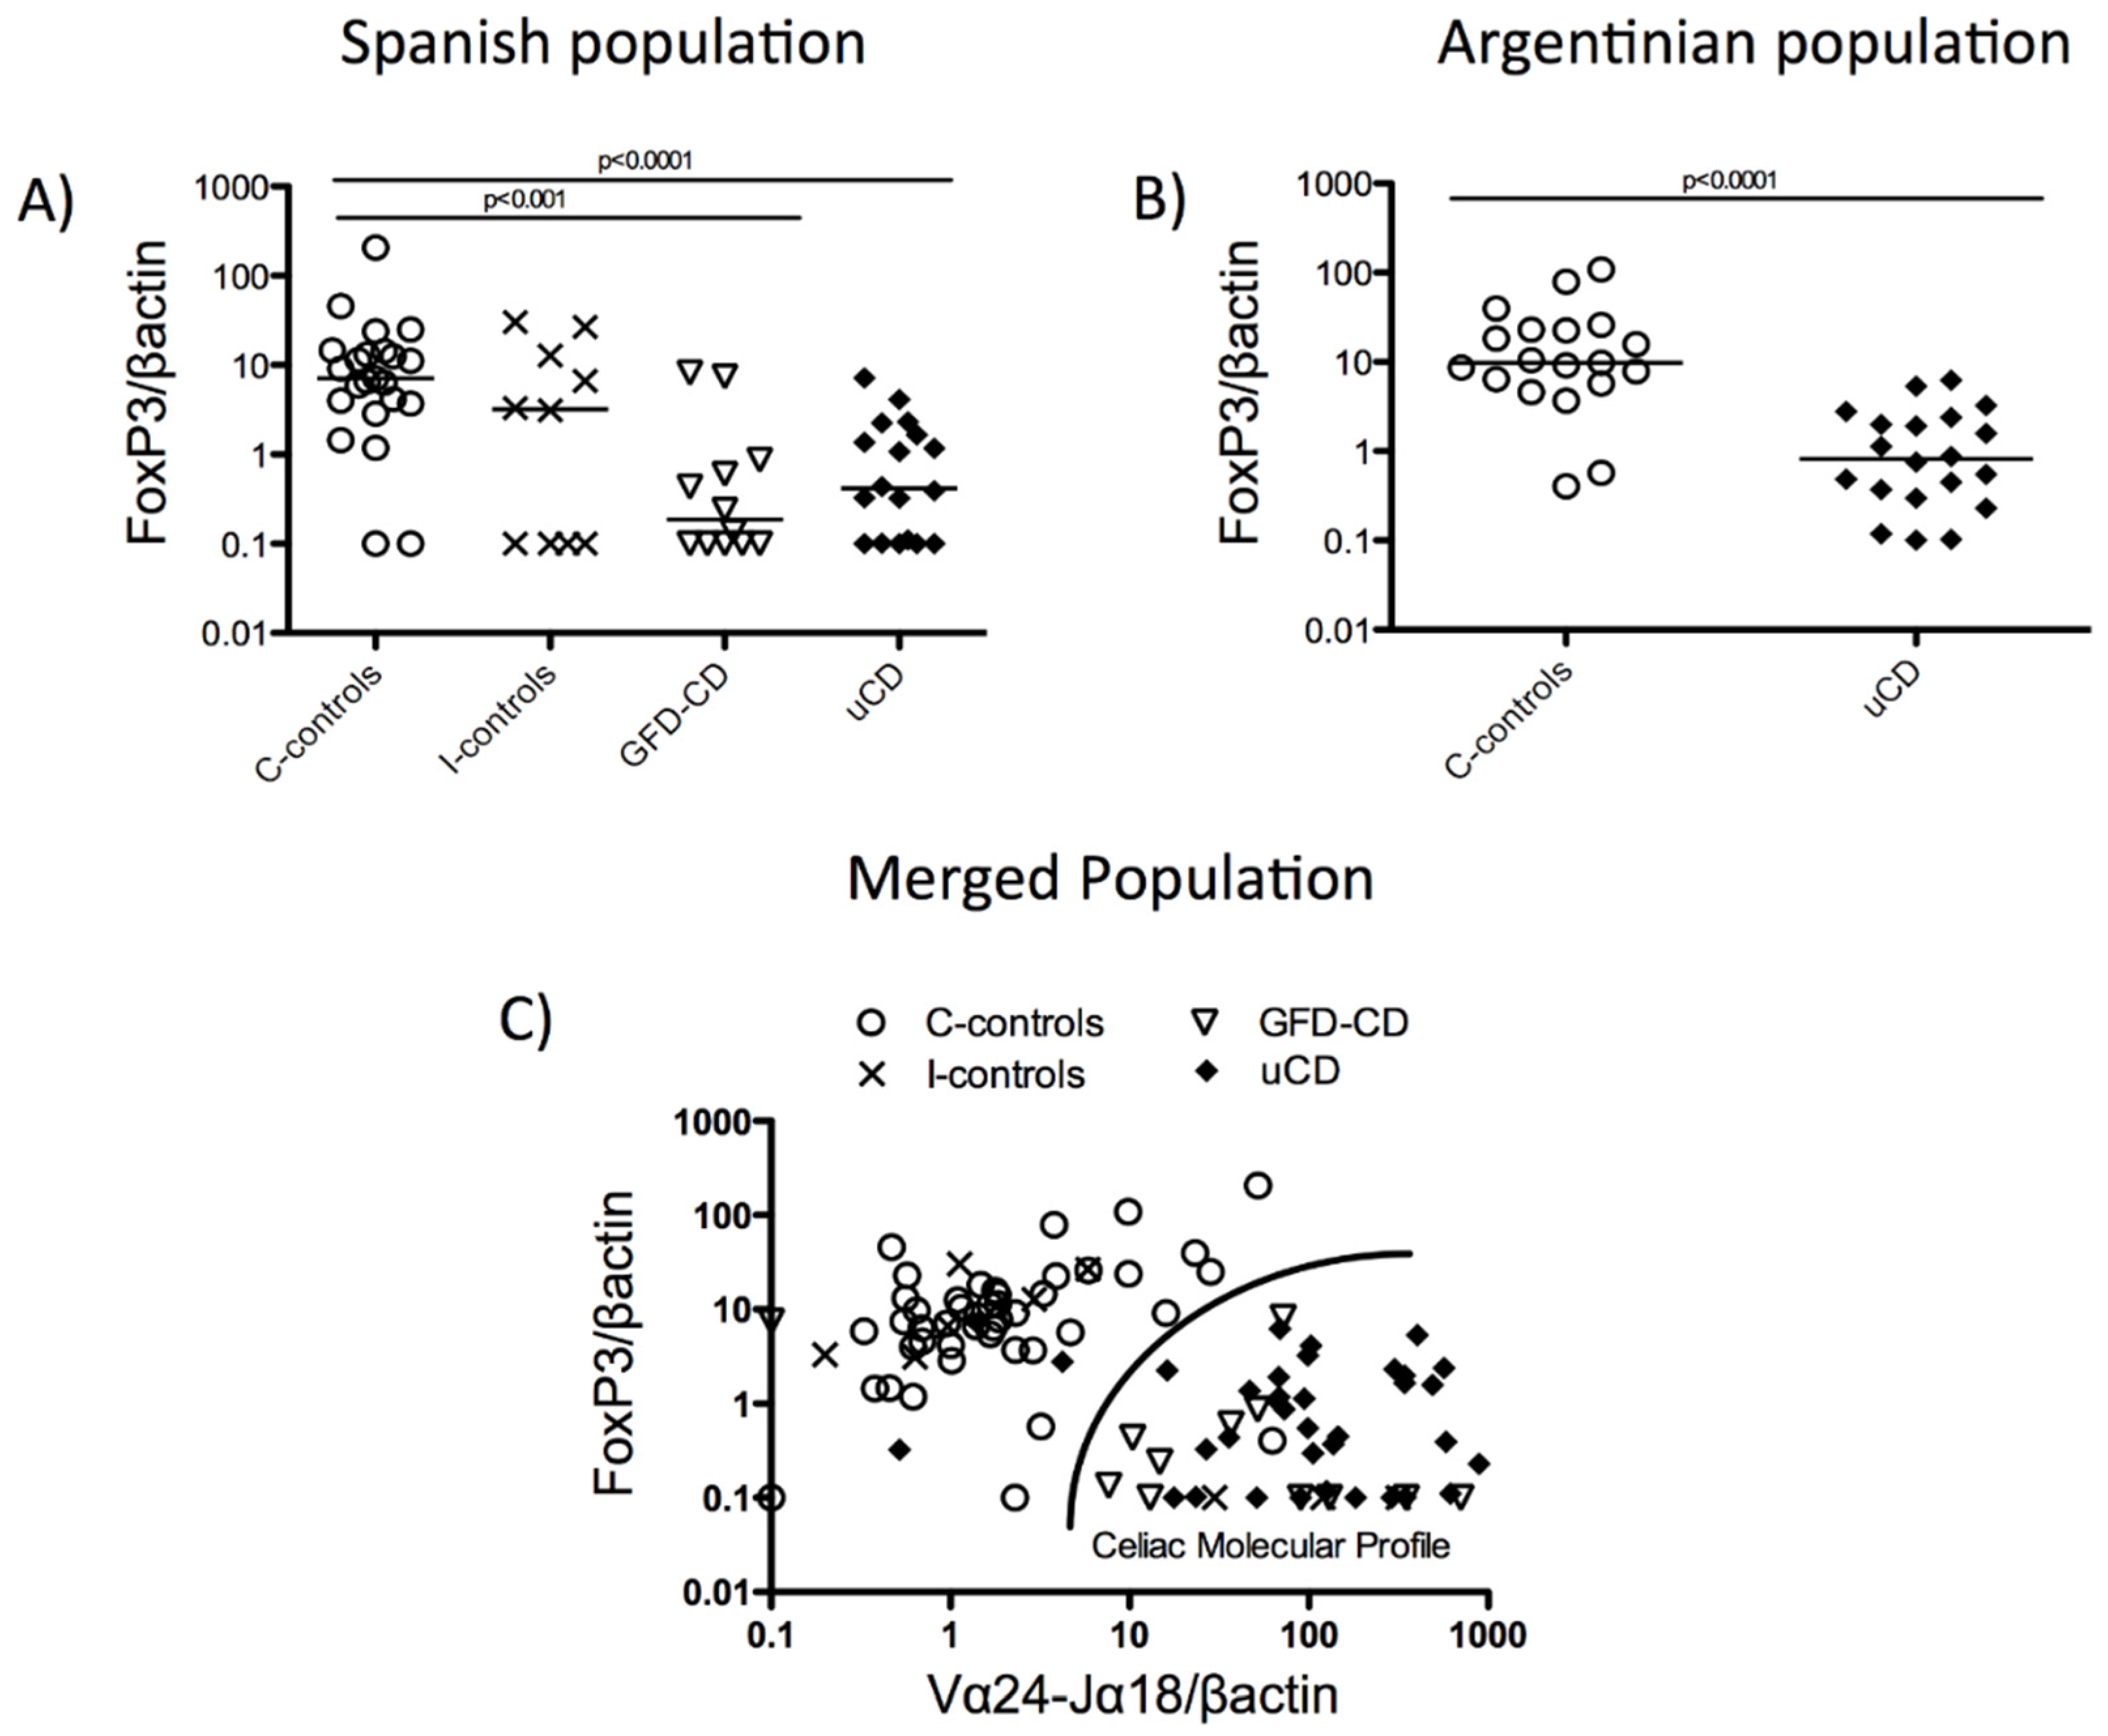
3.3. Duodenal Vα24-Jα18 and FoxP3 mRNA Levels Reveal a Celiac Disease Molecular Profile

We next studied FoxP3 mRNA expression in the duodenum as an indirect way of quantifying Treg cells in tissue. CD samples (both uCD and GFD-CD) had decreased FoxP3 expression compared with non-inflamed non-CD-controls (C-controls) (uCD, p < 0.001; GFD-CD, p < 0.001) (Figure 4A). Similar results were found on a second independent analysis of the Argentinian population (uCD, p < 0.001) (Figure 4B). Because CD samples were characterized by increased duodenal mRNA expression of Vα24-Jα18 (Figure 2A,B) and decreased expression of FoxP3 (Figure 4A,B), we studied whether the joint analysis of these two molecules could help us to identify a CD-like molecular profile.
No differences were found between samples from controls or uCD patients in any of the molecules studied in both populations (Spanish and Argentinian). Similar results were also obtained when Vα24-Jα18 and FoxP3 duodenal mRNA expression were independently analysed. Therefore, both populations were merged to increase the sample size of uCD and C-control groups. The joint analysis of both duodenal FoxP3 and Vα24-Jα18 mRNA levels allowed us to discriminate between CD (treated and untreated), and non-CD samples (inflamed or non-inflamed) with a sensibility and sensitivity of 92%, revealing a CD-like molecular profile (C-controls: Spearman’s r = 0.3495, p < 0.05; I-controls: Spearman’s r = −0.4577, p value = n.s; GFD-CD: Spearman’s r = −0.4858, p < 0.05; uCD: Spearman’s r = −0.056, p value = n.s) (Figure 4C).
Figure 2. Increased duodenal Vα24-Jα18 mRNA expression in untreated and treated celiac disease patients. Expression levels of Vα24-Jα18 mRNA in duodenal biopsies indicated by the ratio Vα24-Jα18/βactin in arbitrary units (AU), in untreated Celiac Disease (uCD), Gluten Free Diet-CD patients (GFD-CD), inflamed non-CD controls (I-controls) and non-inflamed non-CD controls (C-controls) in the Spanish population (A) and in uCD and C-controls in the Argentinian population (B). Statistically significant differences are shown (two tailed Mann-Whitney U test; Krustall-Wallis test). Horizontal bars are median values. Correlation between the degree of histological lesion (Marsh score) and the expression level of Vα24-Jα18 mRNA in CD patients. (1: Marsh 0-I, 2: Marsh II, 3: Marsh IIIa, 4: Marsh IIIb, 5: Marsh IIIc) There was an increased of Vα24-Jα18 expression and the duodenal increased level of atrophy (Spearman r = 0.063, p < 0.05). GFD-CD patients show a Marsh 0-I, uCD show duodenal atrophy Marsh II to IIIc (C).
Nutrients 07 05444 g002
Figure 3. Correlation between duodenal mRNA expression of Vα24-Jα18 and IFNγ. Expression levels of IFNγ mRNA in duodenal biopsies indicated as the ratio IFNγ/βactin, in arbitrary units (AU), in untreated Celiac Disease (uCD), Gluten Free Diet-CD patients (GFD-CD), inflamed non-CD controls (I-controls) and non-inflamed non-CD controls (C-controls) in the Spanish population (A) and in uCD and C-controls in the Argentinian population (B). Statistically significant differences are shown (two tailed Mann-Whitney U test; Krustall-Wallis test). Horizontal bars are median values. Correlation between the expression of IFNγ and Vα24-Jα18 mRNA, in arbitrary units (AU) in the Spanish population (C) (C-controls: Spearman r = 0.3115, p value = n.s; I-controls: Spearman r = 0.4265, p value = n.s; GFD-CD: Spearman r = 0.5393, p value < 0.05; uCD: Spearman r = 0.4323, p value < 0.05) and in the Argentinian population (D) (C-controls: Spearman r = 0.5895, p value < 0.05; uCD: Spearman r = 0.6917, p value < 0.001).
Nutrients 07 05444 g003
Figure 4. Duodenal mRNA levels of Vα24-Jα18 and FoxP3 reveal a celiac disease molecular profile. Expression levels of FoxP3 mRNA in duodenal biopsies indicated as the ratio FoxP3/βactin, in arbitrary units (AU) in untreated Celiac Disease (uCD), Gluten Free Diet-CD patients (GFD-CD), inflamed non-CD controls (I-controls) and non-inflamed non-CD controls (C-controls) in the Spanish population (A) and in uCD and C-controls in the Argentinian population (B). Statistical differences are shown (two tailed Mann-Whitney U test; Krustall-Wallis test). Horizontal bars are median values. Duodenal molecular profile: Correlation between expression levels of FoxP3 and Vα24-Jα18 mRNA, in arbitrary units (AU) (C-controls: Spearman r = 0.3495, p value < 0.05; I-controls: Spearman r = −0.4577, p value = n.s; GFD-CD: Spearman r = −0.4858, p value < 0.05; uCD: Spearman r = −0.056, p value = n.s) (C).
Nutrients 07 05444 g004
All together, our findings suggest an increase of iNKT cells in the CD duodenum as determined by molecular approaches. Therefore, we next studied the number of iNKT cells within the intraepithelial and lamina propria compartments by flow cytometry. To that end, the IEL profile was first analyzed and compared with previous reports before determining the number of iNKT cells in the CD duodenum.

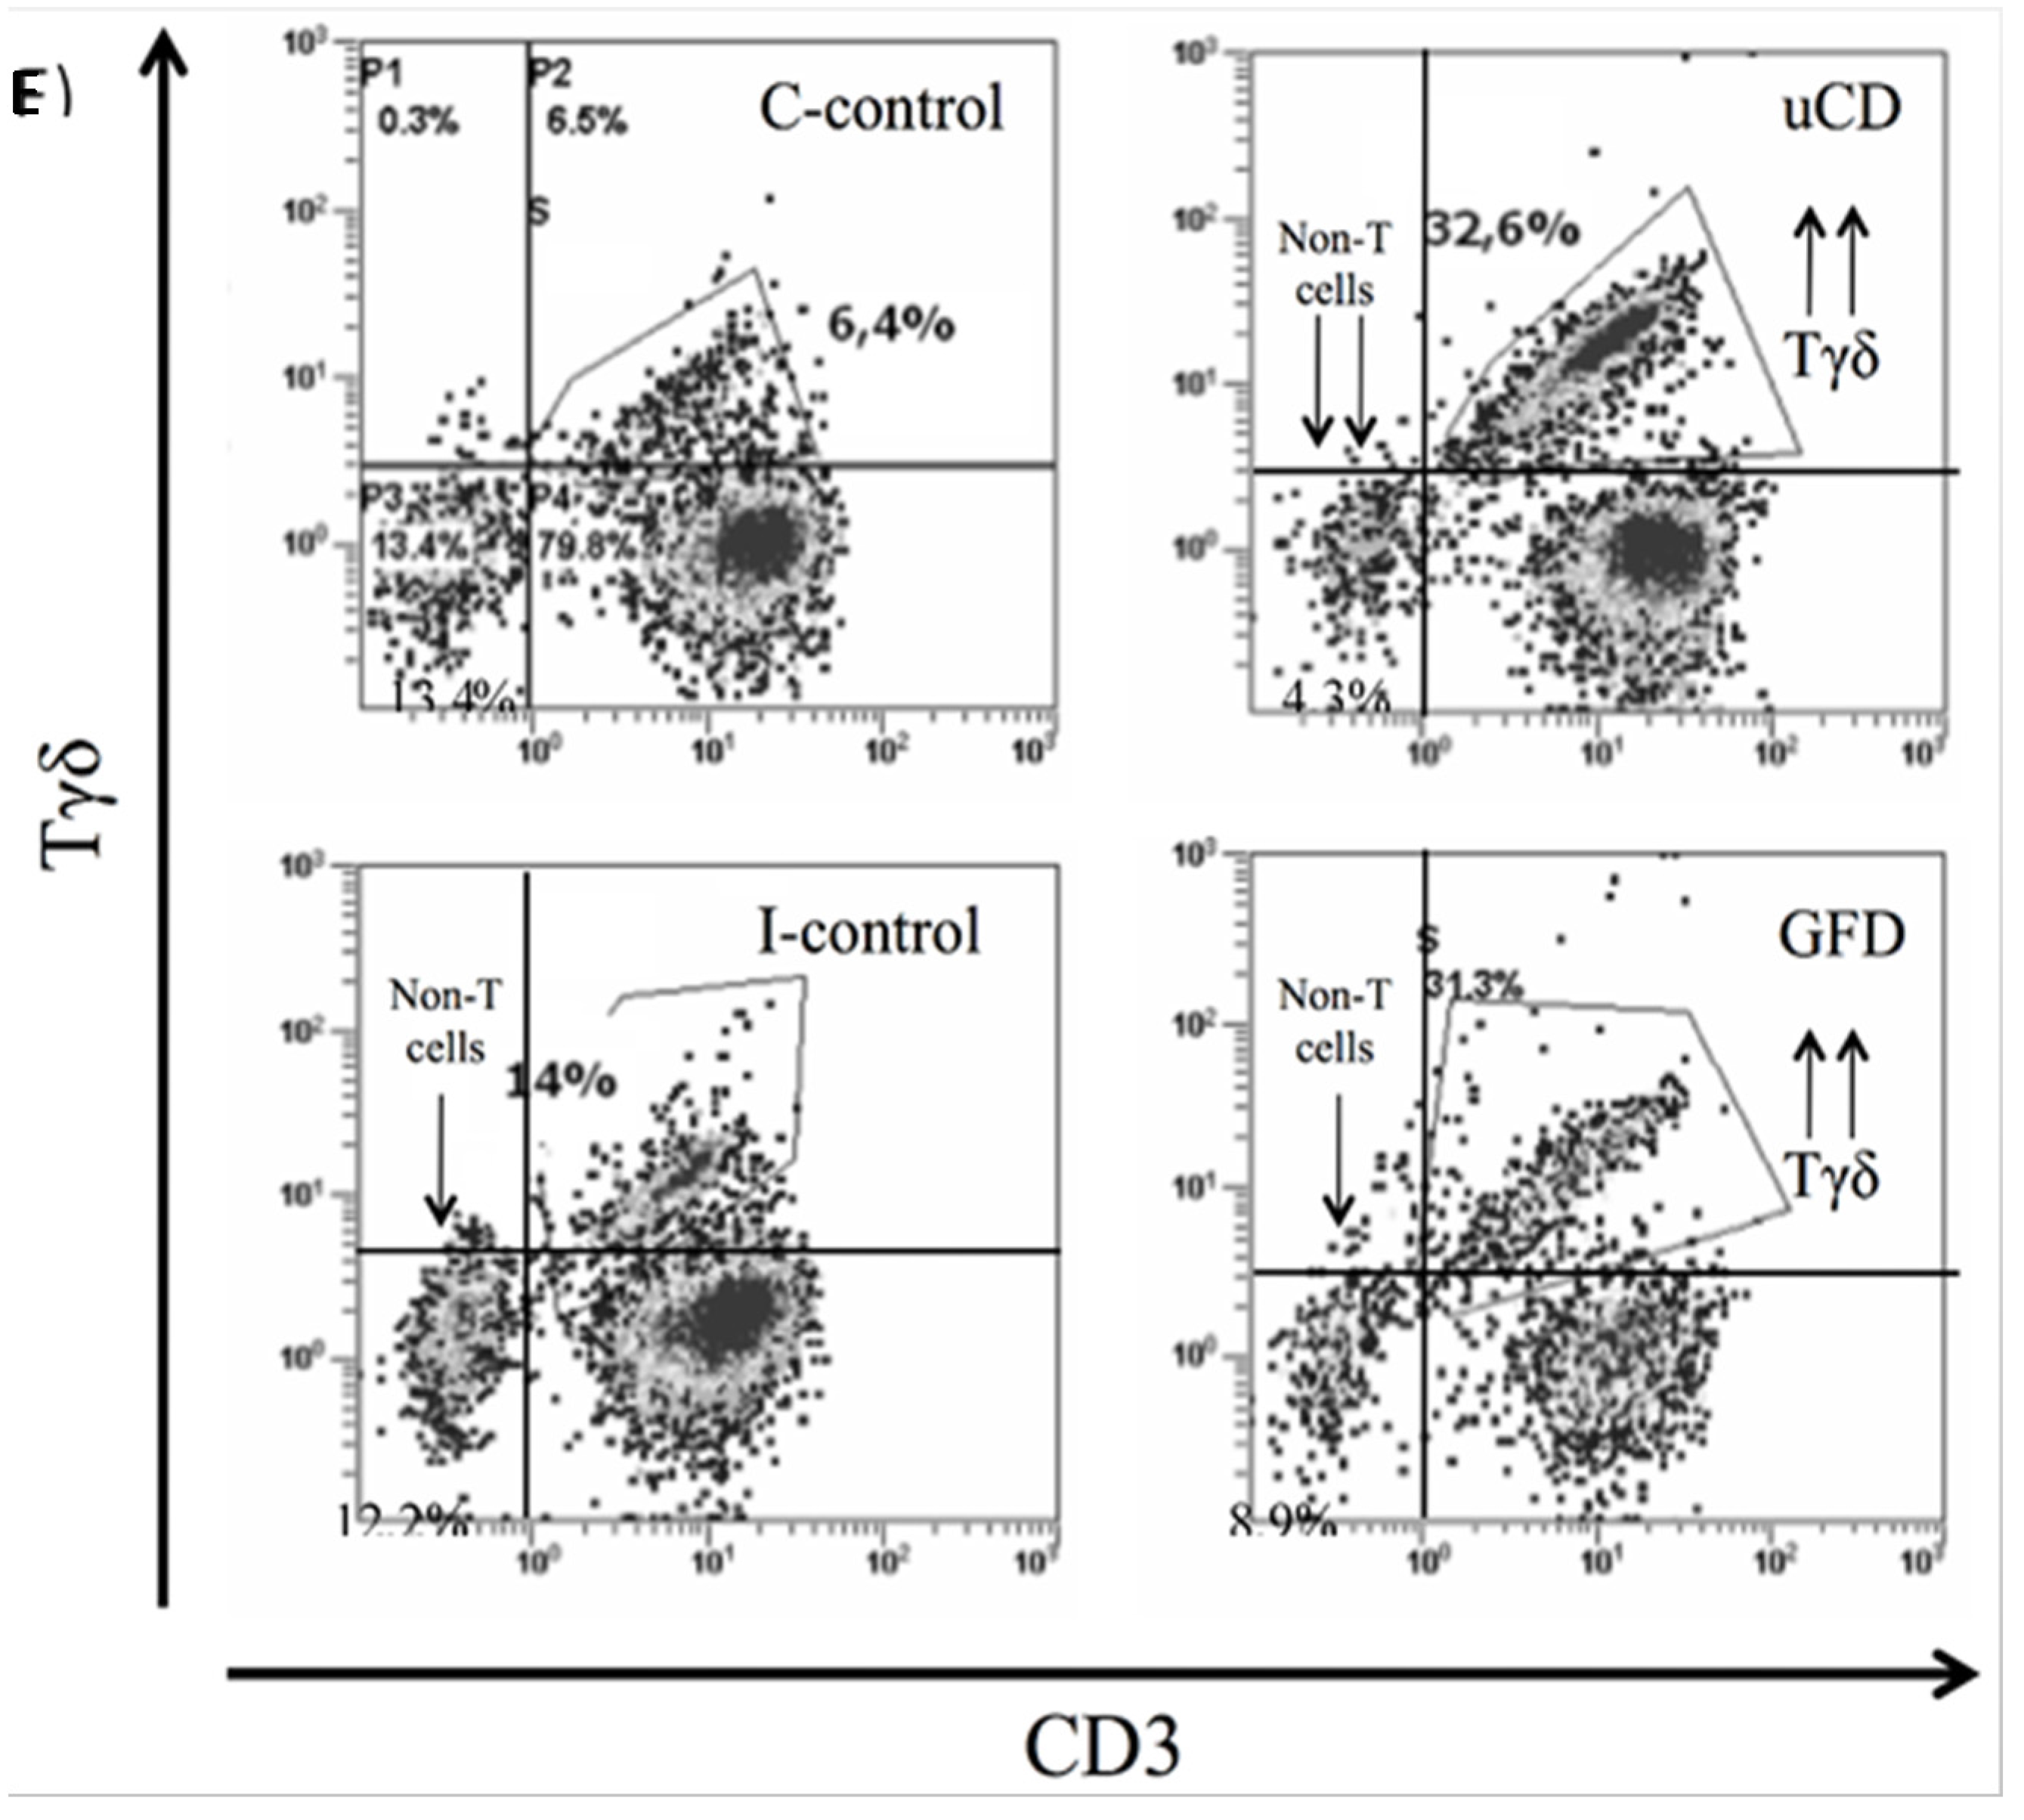
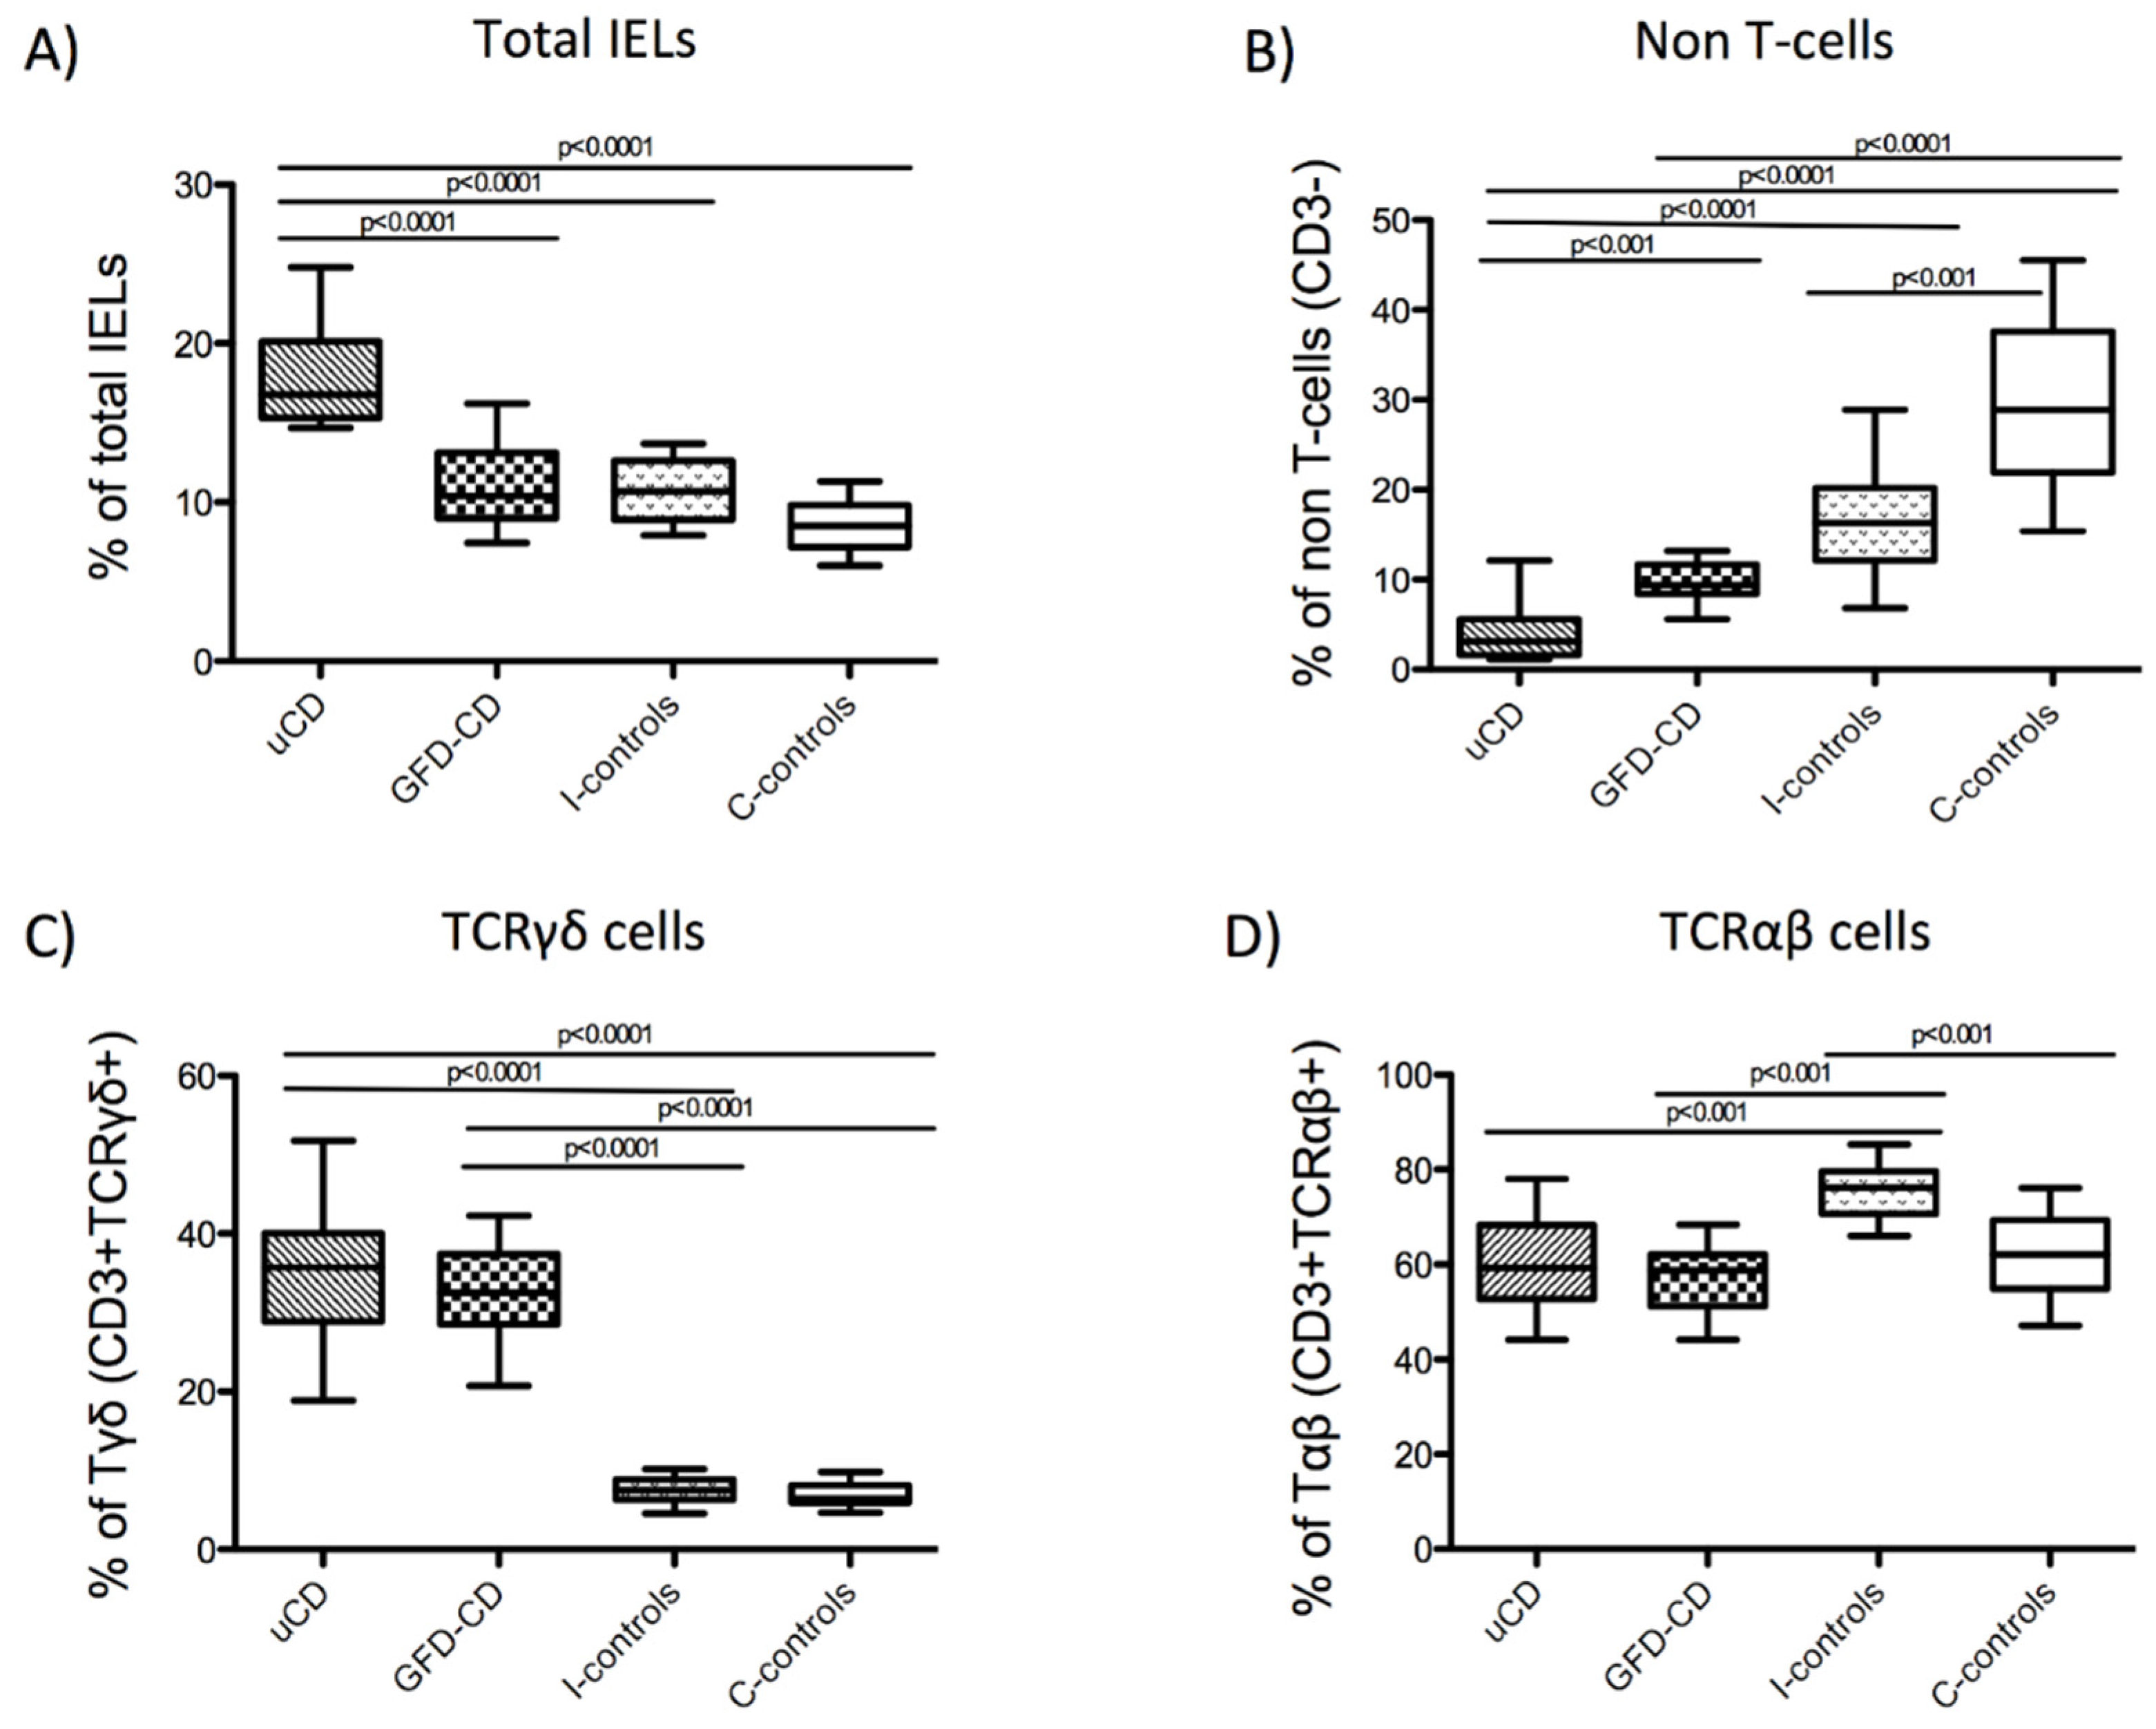
3.4. Intraepithelial Lymphocytes in the Duodenum from Celiac Disease Patients

Total IELs (CD103+CD45+), non-T cells (CD103+CD45+CD3), TCRγδ+ cells (CD103+CD45+CD3+TCRγδ+) and TCRαβ+ cells (CD103+CD45+CD3+TCRγδ) were studied within the intraepithelial compartment (as characterized in Figure 1A) given their relevance as biomarkers in CD diagnosis [9,32].
Untreated CD patients had increased numbers of total IELs (median/IQR; 16.80%/4.80) (Figure 5A,E) together with decreased numbers of non-T cells (3.10%/4.00) (Figure 5B,E). The latter was also true in GFD-CD patients although the total number of IELs did not increase (GFD-CD, 10.40%/4.11) (Figure 5A,E). Within the CD3+ subpopulation, both uCD and GFD-CD patients showed higher numbers of TCRγδ+ cells (uCD, 35.78%/11.13; GFD-CD, 32.50%/8.90) (Figure 5C,E), previously described as a distinctive feature of CD patients [9,32]. In support of this, inflamed non-CD controls did not have increased numbers of TCRγδ+ cells (I-controls, 7.51%/2.60) (Figure 5C,E) despite the decreased percentage of non-T cells compared with non-inflamed non-CD controls (I-controls, 16.30%/8.12; C-controls, 28.90%/15.75) (Figure 5B,E). However, these patients had increased numbers of TCRαβ+ cells (I-controls, 76.20%/8.20) compared with the remainder patient groups (uCD, 59.30%/15.6; GFD-CD, 58.80%/10.90; C-controls, 62.10%/14.5) (Figure 5D,E).
Within the intraepithelial compartment, a decreased number of non-T cells together with increased TCRγδ+ cells represent a distinctive pattern of CD patients irrespectively of the disease status [32,33]. Reference values of the IEL subpopulations for each patient’s group were expressed as median percentages with the interquartile range (IQR) in Table 3.
Table 3. Specificity of intraepithelial lymphocytes profiling in the diagnosis of celiac disease.
uCD
Median (IQR)
GFD-CD
Median (IQR)
I-controls
Median (IQR)
C-controls
Median (IQR)
Total IELs16.80% (4.80)10.40% (4.11)10.70% (3.70)8.50% (2.60)
Non-T cells3.10% (4.00)9.34% (3.34)16.30% (8.12)28.90% (15.75)
TCRγδ+cells35.78% (11.13)32.50% (8.90)7.51% (2.60)6.44% (2.38)
TCRαβ+cells59.30% (15,6)58.80% (10,9)76.20% (8,9)62.10% (14,5)
Percentages of duodenal Intraepithelial lymphocyte (IEL) populations in untreated Celiac Disease (uCD), Gluten Free Diet-CD patients (GFD-CD), inflamed non-CD controls (I-controls) and non-inflamed non-CD controls (C-controls) expressed as median percentages with the interquartile range (IQR).
Figure 5. Phenotype of intraepithelial lymphocytes in the duodenum from celiac patients. Phenotype of IELs in untreated Celiac Disease (uCD), Gluten Free Diet-CD patients (GFD-CD), inflamed non-CD controls (I-controls) and non-inflamed non-CD controls (C-controls), analyzed by flow cytometry: Percentage of total IELs (CD103+CD45+) referred to the total of epithelial cells (A). Percentage of non-T cells (CD103+CD45+CD3) (B), Tγδ cells (CD103+CD45+CD3+TCRγδ+) (C) and Tαβ cells (CD103+CD45+CD3+TCRγδ) (D) referred to the total of IELs. Horizontal bar are median values. Statistically significant differences are shown (two tailed Mann Whitney U test; p < 0.05). Representative flow cytometry analysis data of IEL subpopulations (Tγδ, Tαβ and non-T cells) in uCD, GFD-CD, I-controls and C-controls (E).
Nutrients 07 05444 g005aNutrients 07 05444 g005b
After characterizing the duodenal IEL profile in CD patients and controls, we finally assessed whether the percentage of iNKT cells was increased in the CD duodenum, as suggested by molecular studies.

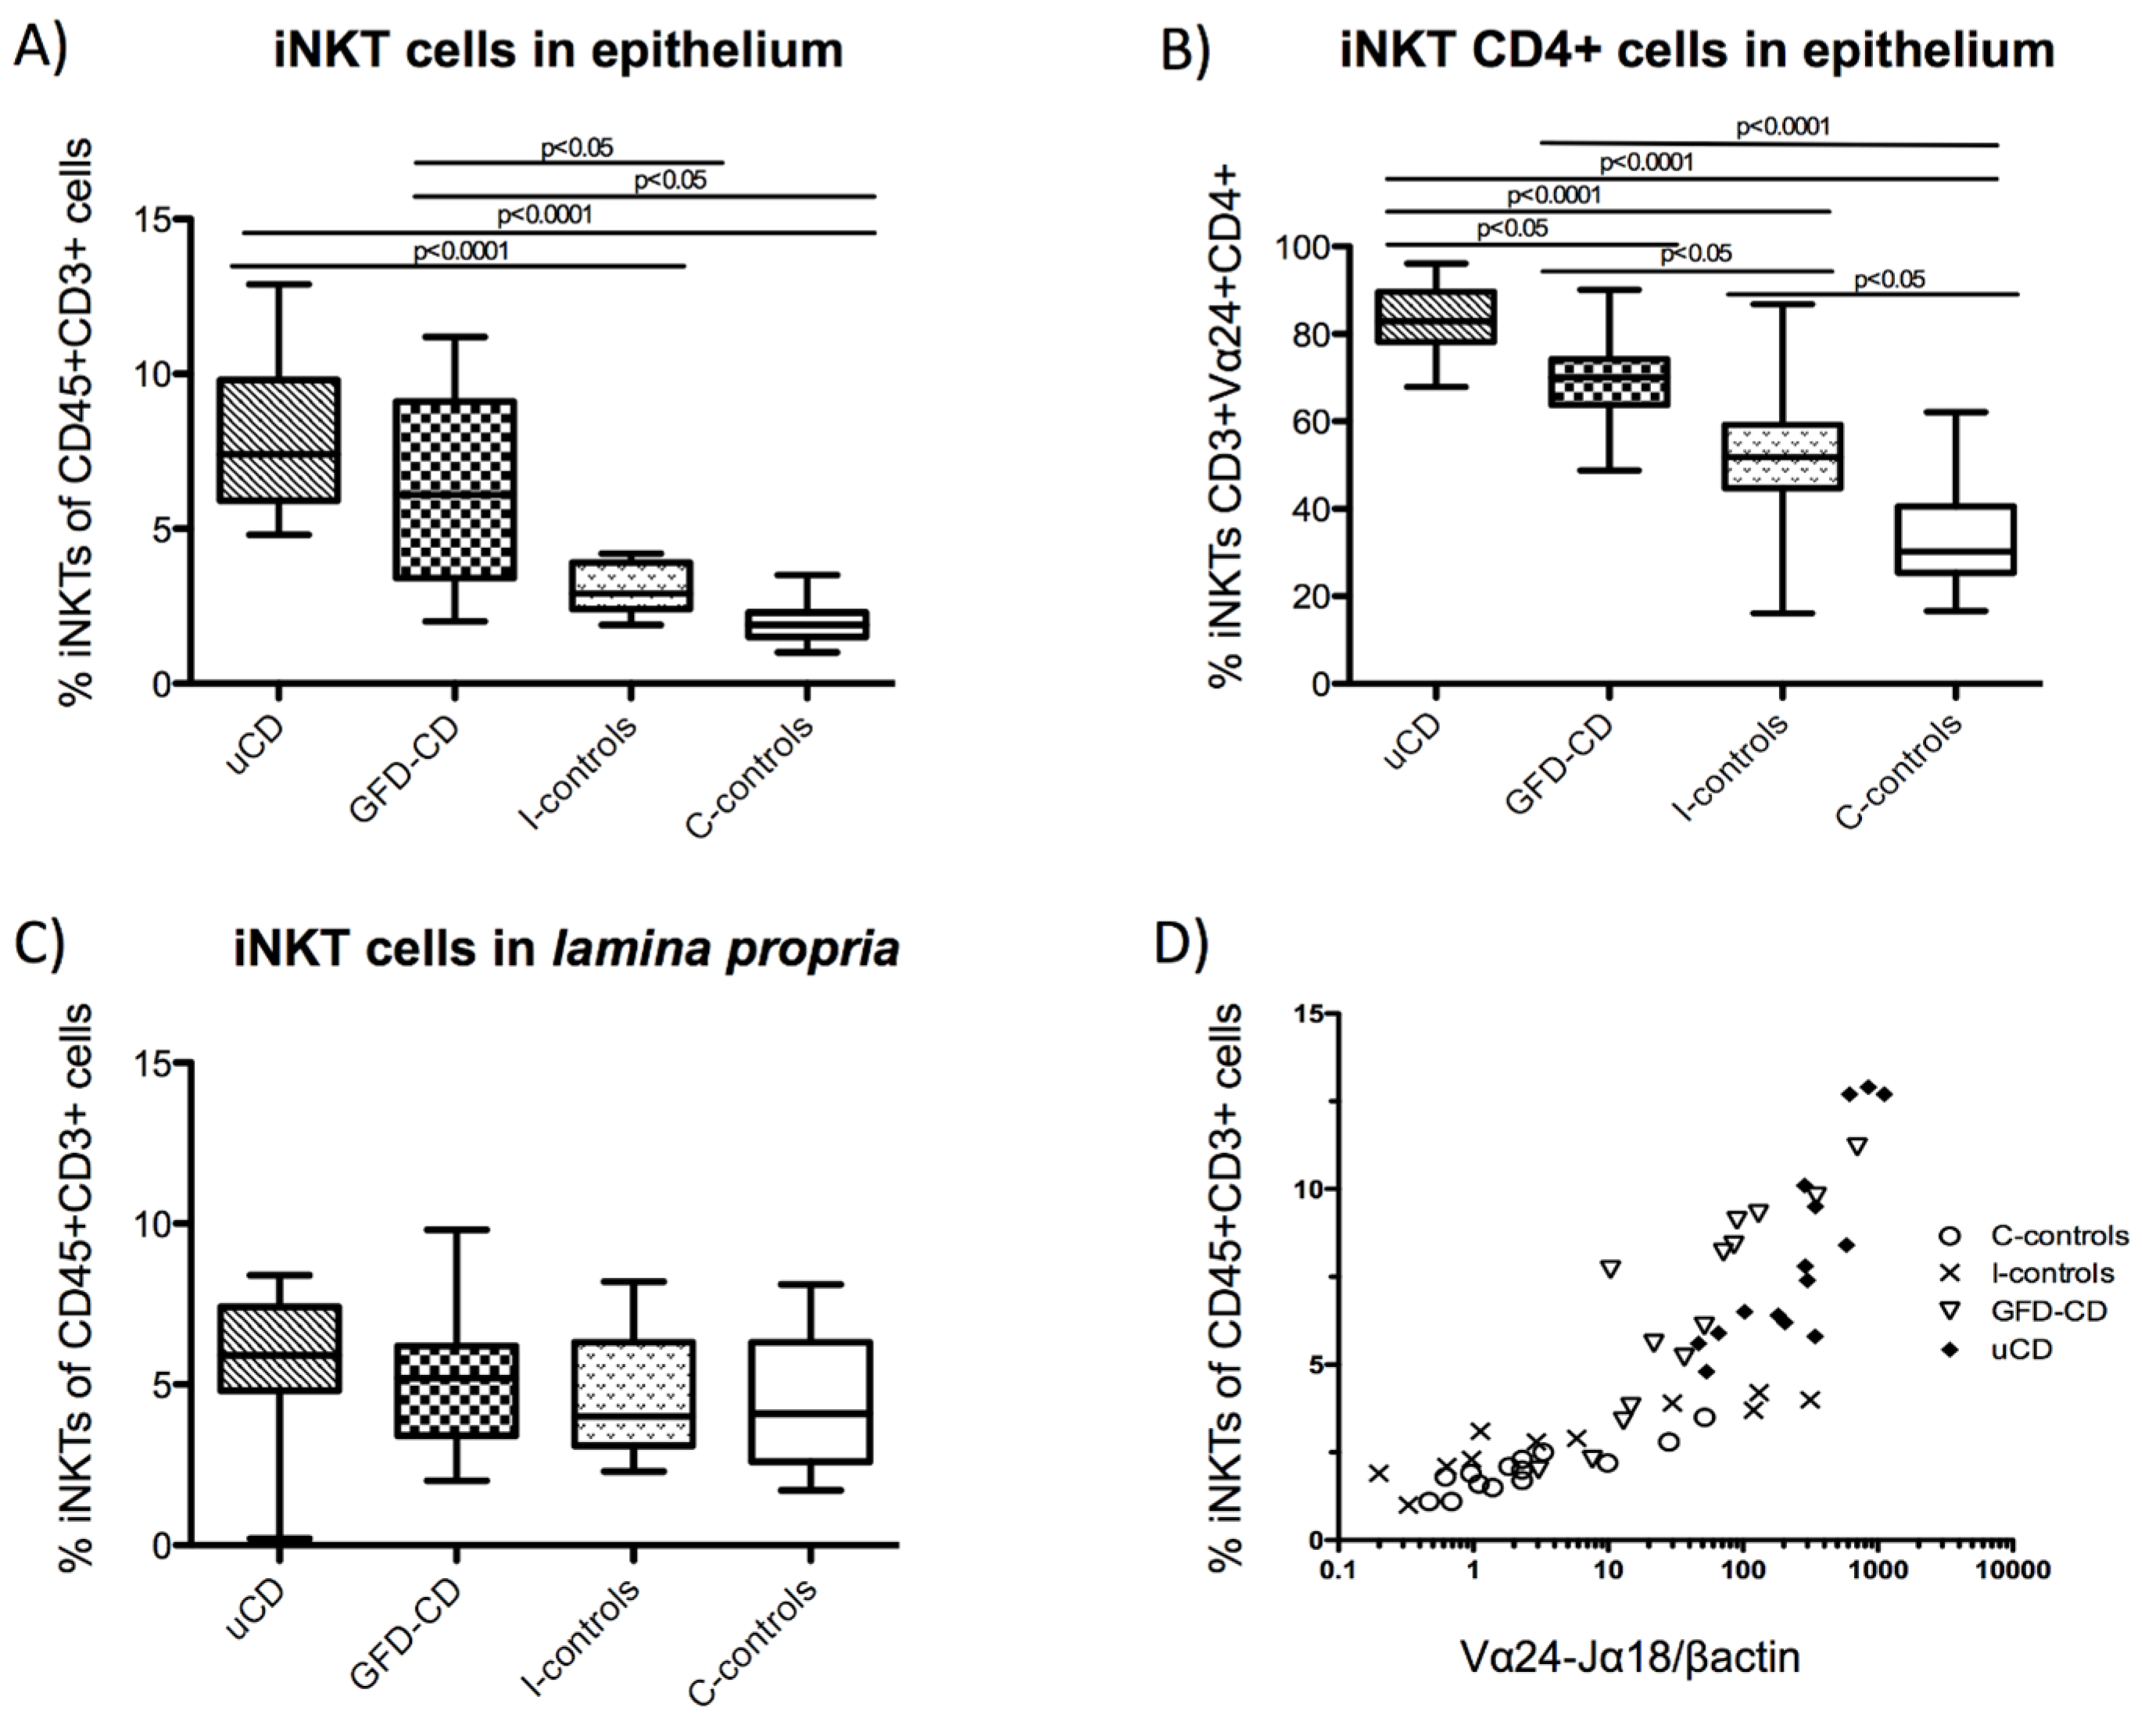
3.5. Increased Intraepithelial iNKT Cells in Celiac Disease Patients and Correlation with Vα24-Jα18 mRNA Expression

As suggested by molecular studies (Figure 2A,B), iNKT cells (as characterized in Figure 1B) were increased within the IEL compartment from CD patients (in both, uCD: 7.4%/3.9 and GFD-CD: 6.1%/5.7) compared with non-CD groups (C-controls: 1.9%/0.8 and I-controls: 2.9%/1.5) (Figure 6A).
There were also differences in the phenotype of intraepithelial iNKT cells since CD patients had a higher proportion of CD4+ iNKT cells (uCD: 82.9%/11.4, GFD-CD: 70.0%/10.5, I-controls: 51.8%/14.5, C-controls: 30.2%/15.1) (Figure 6B). However, the number of iNKT cells from the lamina propria did not differ in number in any of the groups (Figure 6C).
As previously shown, the mRNA expression of Vα24-Jα18 was analyzed by qPCR in all of these duodenal biopsies (Figure 2A). For that reason, we studied whether the increased Vα24-Jα18 mRNA expression could be used as a marker of the increased number of intraepithelial iNKT cells found by flow cytometry (Figure 6A). As shown in Figure 6D, the percentage of iNKT cells correlated with Vα24-Jα18 mRNA levels (C-controls: Spearman’s r = 0.8603, p < 0.001; I-controls: Spearman’s r = −0.9455, p < 0.001; GFD-CD: Spearman’s r = −0.9297, p < 0.001; uCD: Spearman’s r = 0.8287, p = 0.001), which confirms our findings, but also that the study of Vα24-Jα18 mRNA levels may be a valid approach to characterize the density of iNKT cells in complex tissues.
Figure 6. Increased intraepithelial iNKT cells in celiac disease patients and correlation with Vα24-Jα18 mRNA expression. Percentage of iNKT cells (CD45+CD3+Vα24-Jα18+) among the total number of Intraepithelial Lymphocytes (IELs) in untreated Celiac Disease (uCD), Gluten Free Diet-CD patients (GFD-CD), inflamed non-CD controls (I-controls) and non-inflamed non-CD controls (C-controls) (A). Percentage of Intraepithelial CD4+ iNKT cells among the total number of iNKT cells in aCD, GFD-CD, I-controls and C-controls (B). Percentage of iNKT cells among the total number of Lamina Propria Lymphocytes (LPLs) in aCD, GFD-CD, I-controls and C controls (C). Horizontal bars are median values. Statistically significant differences are shown (two tailed Mann Whitney U test; p < 0.05). Correlation between Vα24-Jα18 mRNA expression, in arbitrary units (AU) and the percentage of iNKT cells among the total number of IELs in aCD, GFD-CD, I-controls and C controls (C-controls: Spearman r = 0.8603, p value<0.001; I-controls: Spearman r = −0.9455, p value < 0.0001; GFD-CD: Spearman r = −0.9297, p value < 0.0001; uCD: Spearman r = 0.8287, p value = 0.001) (D).
Nutrients 07 05444 g006

4. Discussion

Despite their low numbers, iNKT cells may have an essential role for the immune homeostasis in the gastrointestinal tract [17,34]. Here, we studied intestinal iNKT cells in the context of celiac disease by molecular and cellular approaches, and found higher numbers of both total and CD4+ iNKT cells in the intraepithelial compartment of CD patients. We also found a correlation between the mRNA expression of Vα24-Jα18 and (i) the severity of the mucosal lesion, and (ii) the mRNA expression of IFNγ. Finally, the mRNA expression of both Vα24-Jα18 and FoxP3 might define an mRNA CD-like molecular profile. Altogether our findings suggest that the number of duodenal intraepithelial iNKT cells is increased in CD patients.
Invariant NKT cells have a key role in the mechanism of oral tolerance [26,34], and their hepatic depletion leads to the inability of developing oral tolerance in a mouse model [35]. These cells may have an effect in the development of tolerogenic dendritic cells, which are responsible for the proliferation of regulatory T cells [13]. Because of the innate and adaptive features of these cells, and the ability to produce high levels of IL-4 and IFNγ [17], a role for iNKT cells has been suggested in inflammatory bowel disease [36] and in CD [37]. Some studies have characterized circulating numbers of iNKT cells in CD patients, often with contradictory results [21,37,38], but few have reported the number of these cells in the duodenum [37,39,40].
Profiling IEL subpopulations has been used as a tool in the diagnostic work out of CD [9,32,41,42]. Using flow cytometry, a method previously validated by Camarero et al. [5,9], we have found similar percentages of IEL subpopulations than previous reports using similar [9,32] and different methods [43], therefore reassuring that we have successfully identified iNKT within IELs. However, these results are opposed to those from Calleja et al. [39] who did not find increased total IELs, as it has been previously described [9]. Moreover, neither Calleja et al. [39] nor Dunne et al. [40] found an increased numbers of iNKT cells in the intraepithelial compartment of CD patients using a similar method. Unfortunately, the nature of these differences between the results reported by these authors and our study remains elusive. However, our finding of a strong correlation between iNKT cells within the intraepithelial compartment and tissue mRNA expression of Vα24-Jα18 confirms a higher density of iNKT cells in the CD duodenum.
A very interesting question is whether the increased numbers of iNKT cells found in the intraepithelial compartment of these patients correlates with similar changes in the number of circulating iNKT cells. However, the study of circulating iNKT cells was not the aim of this research and hence blood samples had not been obtained from patients as we had performed in a previous study [21]. Future analysis will address this issue including the characterization (e.g., homing profile) of circulating iNKT cells in CD patients.
Grose et al. consistently reported reduced numbers of intestinal iNKT cells in CD as determined by qPCR [37,44] and by immunofluorescence [37], although in the later study the authors did not discriminate between intraepithelial and lamina propria cells [37]. However, we found increased numbers of iNKT cells in the intraepithelial compartment, but not in the lamina propria. Our findings were also correlated with mRNA expression levels of Vα24-Jα18 despite our qPCR results are not in agreement with the former studies [37,44]. Such discrepancy might be explained because duodenal Vα24-Jα18 mRNA expression varies between different populations. Our results have been confirmed in two different sets of samples from individuals from different continents. Besides, the increased Vα24-Jα18 mRNA expression found in the duodenum of CD patients also correlated with the percentage of intraepithelial iNKT cells by flow cytometry, with the Marsh score for the severity of the lesion, and with the mRNA expression of IFNγ, giving further consistency to our results. We are aware that the expression of the TCR Vα24 chain is not exclusive of iNKT cells and therefore we may be identifying other cell types (by flow cytometry and qPCR).However, the analysis of the Vα24-Jα18 molecule is more restrictive than Vβ11 [21,38]. In fact, the identification of iNKT cells by mRNA expression has been recently proposed as a more reliable alternative than the previously used co-expression of CD3+ and CD161+, because T cells (non-NKT) may induce CD161+ expression after activation [45]. Moreover, we have found a direct correlation between Vα24-Jα18 mRNA expression and the total numbers of Vα24-Jα18+ cells (representative of pure iNKT cells) in the intraepithelial compartment as determined by flow cytometry. Therefore, we are confident that Vα24-Jα18 mRNA expression is representative of the total numbers of iNKT cells in the duodenal mucosa.
Intraepithelial lymphocytes are an heterogeneous population of T cells and non-T cells, mainly composed of cytotoxic CD8+ T cells, whose main role is the maintenance of the epithelial integrity by eliminating stressed cells and promoting epithelial repair [6]. Some authors have tried to identify the nature of non-T cells within the IEL compartment, which have been characterized as mainly NK cells, but also T cell precursors [46,47]. Dysregulated activation and increased IEL T cell numbers is a hallmark of CD and this is critically involved in epithelial cell destruction and subsequent development of villous atrophy [7,10]. The mechanisms underlying the massive expansion of IFNγ–producing intraepithelial cytotoxic T lymphocytes (CTLs) and the destruction of the epithelial cells lining the small intestine of CD patients is the focus of current research. Meresse et al. [10] reported an oligoclonal expansion of CTLs in CD that exhibits profound genetic reprogramming of NK cell functions. These CTLs expressed aberrant cytolytic NK lineage receptors, such as NKG2C, NKp44, and NKp46, which associated with adaptor molecules bearing immunoreceptor tyrosine-based activation motifs, induce ZAP-70 phosphorylation, cytokine secretion, and proliferation independently of TCR signalling as well as downregulation of the TCR. All of these features are characteristic of the iNKT population [48,49] though we cannot conclude that they really perform these functions in the CD duodenum and are responsible of tissue damage in CD.
IFNγ is mainly produced by the gluten-specific Th1 cells and is essential in CD pathogenesis. Recent studies also suggest that IELs are an important source of IFNγ, and the production of IFNγ persists even after GFD [8]. Our results show a correlation between the increased mRNA expression of IFNγ in CD patients (both treated and untreated) and the mRNA expression of Vα24-Jα18. These results together with the correlation between the mRNA expression of Vα24-Jα18, the Marsh score for the severity of the mucosal lesion and the total number of intraepithelial iNKT cells might suggest that the increased of IFNγ in the CD duodenum might be favoring an increased recruitment of iNKT cells. However, this requires further studies, which may be difficult to perform given the low number of iNKT cells. At present, it is considered that the natural ligands of iNKT cells are glycolipids from the cytoplasm of enterocytes, released to the extracellular matrix after apoptosis or necrosis [18,50,51], favoured by an environment rich in IFNγ and IL-15 characteristic in CD [52,53], and IL-15 plays a central role in the biological function of iNKT cells [54]. This proinflammatory environment may be relevant for the increase and activation of intraepithelial iNKT cells which, in turn, may be also a source of IFNγ.
We also studied FoxP3 mRNA expression as an indirect measurement of Treg and found a lower expression in the CD duodenum. However, we were unable to identify T cells expressing intracellular FoxP3 neither in the duodenal lamina propria nor in the intraepithelial compartment by flow cytometry (data not shown). A possible explanation might be that FoxP3 expression in humans is transient, dependent on the environment and not restricted to T-cells with a Treg phenotype [55,56]. In addition, and opposed to murine models [57], there is evidence suggesting that FoxP3 can be also expressed in cells without regulatory function, such as epithelial and tumor cells [58,59,60]. Therefore it is likely that we were not identifying T cells expressing FoxP3 by qPCR but other non-T cell types which have remained elusive by flow cytometry. Nonetheless, a CD-like molecular profile based on the mRNA expression of Vα24-Jα18 and FoxP3, which is also observed in GFD-CD patients, might be used as a useful diagnostic biomarker.
In conclusion, we have found an increased number of iNKT cells in the duodenum from both uCD and GFD-CD patients, irrespective of the mucosal status. Increased mRNA levels of Vα24-Jα18 correlated with the severity of the mucosal lesion and with the mRNA levels of IFNγ. A CD-like molecular profile, defined by an increased mRNA expression of Vα24-Jα18 together with a decreased expression of FoxP3, may represent a pro-inflammatory signature of the CD duodenum.

Supplementary Materials

Supplementary materials can be accessed at: https://www.mdpi.com/2072-6643/7/11/5444/s1.

Acknowledgments

We are grateful to Garbiñe Roy and Ana Andrés (Servicio de Inmunología, Hospital Ramón y Cajal, Madrid, Spain) for their technical help, and Eduardo Cueto Rua and Luciana Guzman (Hospital Sor Maria Ludovica, La Plata, Argentina), and Nestor Chopita (Hospital San Martin, La Plata, Argentina) for the evaluation and follow-up of the Argentinian patients. This work was supported by grants (to E A) from Instituto de Salud Carlos III-FEDER (PI070244, PI10/01647); (to J A G) Junta de Castilla y León (SAN673/VA22-08) and (to E M) Beca FPI-Junta de Castilla y León/Fondo Social Europeo.

Author Contributions

E.M., D.B., J.A.G., and E.A. conceived the study. E.M., D.B. and B.M.A. conducted the experiments. E.M., D.B., F.G.C., J.A.G. and E.A. provided intellectual input and data analyses and wrote the manuscript. L.F.S., C.C. and Y.A. provided the human samples.

Conflicts of Interest

The authors declared no conflict of interest.

References

  1. Comino, I.; Real, A.; de Lorenzo, L.; Cornell, H.; Lopez-Casado, M.A.; Barro, F.; Lorite, P.; Torres, M.I.; Cebolla, A.; Sousa, C. Diversity in oat potential immunogenicity: Basis for the selection of oat varieties with no toxicity in coeliac disease. Gut 2011, 60, 915–922. [Google Scholar] [CrossRef] [PubMed] [Green Version]
  2. Leon, A.J.; Gomez, E.; Garrote, J.A.; Arranz, E. The pattern of cytokine expression determines the degree of mucosal damage. Gut 2007, 56, 441–443. [Google Scholar] [CrossRef] [PubMed]
  3. Abadie, V.; Sollid, L.M.; Barreiro, L.B.; Jabri, B. Integration of genetic and immunological insights into a model of celiac disease pathogenesis. Annu. Rev. Immunol. 2011, 29, 493–525. [Google Scholar] [CrossRef] [PubMed]
  4. Sollid, L.M.; Lundin, K.E. Diagnosis and treatment of celiac disease. Mucosal Immunol. 2009, 2, 3–7. [Google Scholar] [CrossRef] [PubMed]
  5. Camarero, C.; Leon, F.; Sanchez, L.; Asensio, A.; Roy, G. Age-related variation of intraepithelial lymphocytes subsets in normal human duodenal mucosa. Dig. Dis. Sci. 2007, 52, 685–691. [Google Scholar] [CrossRef] [PubMed]
  6. Cheroutre, H.; Lambolez, F.; Mucida, D. The light and dark sides of intestinal intraepithelial lymphocytes. Nat. Rev. Immunol. 2011, 11, 445–456. [Google Scholar] [CrossRef] [PubMed]
  7. Abadie, V.; Discepolo, V.; Jabri, B. Intraepithelial lymphocytes in celiac disease immunopathology. Semin. Immunopathol. 2012, 34, 551–566. [Google Scholar] [CrossRef] [PubMed]
  8. Meresse, B.; Malamut, G.; Cerf-Bensussan, N. Celiac disease: An immunological jigsaw. Immunity 2012, 36, 907–919. [Google Scholar] [CrossRef] [PubMed]
  9. Camarero, C.; Eiras, P.; Asensio, A.; Leon, F.; Olivares, F.; Escobar, H.; Roy, G. Intraepithelial lymphocytes and coeliac disease: Permanent changes in CD3-/CD7+ and T cell receptor gammadelta subsets studied by flow cytometry. Acta Paediatr. 2000, 89, 285–290. [Google Scholar] [PubMed]
  10. Meresse, B.; Curran, S.A.; Ciszewski, C.; Orbelyan, G.; Setty, M.; Bhagat, G.; Lee, L.; Tretiakova, M.; Semrad, C.; Kistner, E.; et al. Reprogramming of CTLS into natural killer-like cells in celiac disease. J. Exp. Med. 2006, 203, 1343–1355. [Google Scholar] [CrossRef] [PubMed]
  11. Hue, S.; Mention, J.J.; Monteiro, R.C.; Zhang, S.; Cellier, C.; Schmitz, J.; Verkarre, V.; Fodil, N.; Bahram, S.; Cerf-Bensussan, N.; et al. A direct role for NKG2D/MICA interaction in villous atrophy during celiac disease. Immunity 2004, 21, 367–377. [Google Scholar] [CrossRef] [PubMed]
  12. Bhagat, G.; Naiyer, A.J.; Shah, J.G.; Harper, J.; Jabri, B.; Wang, T.C.; Green, P.H.; Manavalan, J.S. Small intestinal CD8+TCRGAMMADELTA+NKG2a+ intraepithelial lymphocytes have attributes of regulatory cells in patients with celiac disease. J. Clin. Investig. 2008, 118, 281–293. [Google Scholar] [CrossRef] [PubMed]
  13. La Cava, A.; van Kaer, L.; Fu Dong, S. CD4+CD25+ TREGS and NKT cells: Regulators regulating regulators. Trends Immunol. 2006, 27, 322–327. [Google Scholar] [CrossRef] [PubMed]
  14. Vignali, D.A.; Collison, L.W.; Workman, C.J. How regulatory T cells work. Nat. Rev. Immunol. 2008, 8, 523–532. [Google Scholar] [CrossRef] [PubMed]
  15. Gianfrani, C.; Levings, M.K.; Sartirana, C.; Mazzarella, G.; Barba, G.; Zanzi, D.; Camarca, A.; Iaquinto, G.; Giardullo, N.; Auricchio, S.; et al. Gliadin-specific type 1 regulatory T cells from the intestinal mucosa of treated celiac patients inhibit pathogenic T cells. J. Immunol. 2006, 177, 4178–4186. [Google Scholar] [CrossRef] [PubMed]
  16. O’Garra, A.; Vieira, P. T(h)1 cells control themselves by producing interleukin-10. Nat. Rev. Immunol. 2007, 7, 425–428. [Google Scholar] [CrossRef] [PubMed]
  17. Middendorp, S.; Nieuwenhuis, E.E. NKT cells in mucosal immunity. Mucosal. Immunol. 2009, 2, 393–402. [Google Scholar] [CrossRef] [PubMed]
  18. Brennan, P.J.; Tatituri, R.V.; Brigl, M.; Kim, E.Y.; Tuli, A.; Sanderson, J.P.; Gadola, S.D.; Hsu, F.F.; Besra, G.S.; Brenner, M.B. Invariant natural killer T cells recognize lipid self antigen induced by microbial danger signals. Nat. Immunol. 2011, 12, 1202–1211. [Google Scholar] [CrossRef] [PubMed]
  19. Sanderson, J.P.; Waldburger-Hauri, K.; Garzon, D.; Matulis, G.; Mansour, S.; Pumphrey, N.J.; Lissin, N.; Villiger, P.M.; Jakobsen, B.; Faraldo-Gomez, J.D.; et al. Natural variations at position 93 of the invariant Vα24-Jα18 α chain of human INKT-cell tcrs strongly impact on CD1D binding. Eur. J. Immunol. 2012, 42, 248–255. [Google Scholar] [CrossRef] [PubMed]
  20. Veldt, B.J.; van der Vliet, H.J.; von Blomberg, B.M.; van Vlierberghe, H.; Gerken, G.; Nishi, N.; Hayashi, K.; Scheper, R.J.; de Knegt, R.J.; van den Eertwegh, A.J.; et al. Randomized placebo controlled phase I/II trial of α-galactosylceramide for the treatment of chronic hepatitis C. J. Hepatol. 2007, 47, 356–365. [Google Scholar] [CrossRef] [PubMed]
  21. Bernardo, D.; van Hoogstraten, I.M.; Verbeek, W.H.; Pena, A.S.; Mearin, M.L.; Arranz, E.; Garrote, J.A.; Scheper, R.J.; Schreurs, M.W.; Bontkes, H.J.; et al. Decreased circulating INKT cell numbers in refractory coeliac disease. Clin. Immunol. 2008, 126, 172–179. [Google Scholar] [CrossRef] [PubMed]
  22. Zeissig, S.; Kaser, A.; Dougan, S.K.; Nieuwenhuis, E.E.; Blumberg, R.S. Role of NKT cells in the digestive system. III. Role of NKT cells in intestinal immunity. Am. J. Physiol. Gastrointest. Liver Physiol. 2007, 293, G1101–G1105. [Google Scholar] [CrossRef] [PubMed]
  23. Molling, J.W.; Langius, J.A.; Langendijk, J.A.; Leemans, C.R.; Bontkes, H.J.; van der Vliet, H.J.; von Blomberg, B.M.; Scheper, R.J.; van den Eertwegh, A.J. Low levels of circulating invariant natural killer T cells predict poor clinical outcome in patients with head and neck squamous cell carcinoma. J. Clin. Oncol. 2007, 25, 862–868. [Google Scholar] [CrossRef] [PubMed]
  24. Van der Vliet, H.J.; Molling, J.W.; von Blomberg, B.M.; Nishi, N.; Kolgen, W.; van den Eertwegh, A.J.; Pinedo, H.M.; Giaccone, G.; Scheper, R.J. The immunoregulatory role of CD1D-restricted natural killer T cells in disease. Clin. Immunol. 2004, 112, 8–23. [Google Scholar] [CrossRef] [PubMed]
  25. Dowds, C.M.; Blumberg, R.S.; Zeissig, S. Control of intestinal homeostasis through crosstalk between natural killer T cells and the intestinal microbiota. Clin. Immunol. 2015, 159, 128–133. [Google Scholar] [CrossRef] [PubMed]
  26. Kim, H.J.; Hwang, S.J.; Kim, B.K.; Jung, K.C.; Chung, D.H. NKT cells play critical roles in the induction of oral tolerance by inducing regulatory T cells producing IL-10 and transforming growth factor beta, and by clonally deleting antigen-specific t cells. Immunology 2006, 118, 101–111. [Google Scholar] [CrossRef] [PubMed]
  27. Chang, J.H.; Lee, J.M.; Youn, H.J.; Lee, K.A.; Chung, Y.; Lee, A.Y.; Kweon, M.N.; Kim, H.Y.; Taniguchi, M.; Kang, C.Y. Functional maturation of lamina propria dendritic cells by activation of NKT cells mediates the abrogation of oral tolerance. Eur. J. Immunol. 2008, 38, 2727–2739. [Google Scholar] [CrossRef] [PubMed]
  28. Madrigal, L.; Lynch, S.; Feighery, C.; Weir, D.; Kelleher, D.; O’Farrelly, C. Flow cytometric analysis of surface major histocompatibility complex class II expression on human epithelial cells prepared from small intestinal biopsies. J. Immunol. Methods 1993, 158, 207–214. [Google Scholar] [CrossRef]
  29. Aarsaether, N.; Nilsen, B.M. Nucleotide excision repair in human cells. Biochemistry and implications in diseases. Tidsskr. Nor. Laegeforen. 1995, 115, 2786–2789. [Google Scholar] [PubMed]
  30. Leon, F.; Sanchez, L.; Camarero, C.; Roy, G. Cytokine production by intestinal intraepithelial lymphocyte subsets in celiac disease. Dig. Dis. Sci. 2005, 50, 593–600. [Google Scholar] [CrossRef] [PubMed]
  31. Garrote, J.A.; Gomez-Gonzalez, E.; Bernardo, D.; Arranz, E.; Chirdo, F. Celiac disease pathogenesis: The proinflammatory cytokine network. J. Pediatr. Gastroenterol. Nutr. 2008, 47 (Suppl. 1), S27–S32. [Google Scholar] [CrossRef] [PubMed]
  32. Leon, F.; Camarero, C.; Eiras, P.; Roy, G. Specificity of IEL profiling in the diagnosis of celiac disease. Am. J. Gastroenterol. 2004, 99, 958. [Google Scholar] [CrossRef] [PubMed]
  33. Arranz, E.; Bode, J.; Kingstone, K.; Ferguson, A. Intestinal antibody pattern of coeliac disease: Association with gamma/delta T cell receptor expression by intraepithelial lymphocytes, and other indices of potential coeliac disease. Gut 1994, 35, 476–482. [Google Scholar] [CrossRef] [PubMed]
  34. Van Dieren, J.M.; van der Woude, C.J.; Kuipers, E.J.; Escher, J.C.; Samsom, J.N.; Blumberg, R.S.; Nieuwenhuis, E.E. Roles of CD1D-restricted NKT cells in the intestine. Inflamm. Bowel Dis. 2007, 13, 1146–1152. [Google Scholar] [CrossRef] [PubMed]
  35. Cardell, S.L. The natural killer T lymphocyte: A player in the complex regulation of autoimmune diabetes in non-obese diabetic mice. Clin. Exp. Immunol. 2006, 143, 194–202. [Google Scholar] [CrossRef] [PubMed]
  36. Grose, R.H.; Thompson, F.M.; Baxter, A.G.; Pellicci, D.G.; Cummins, A.G. Deficiency of invariant NKT cells in crohn's disease and ulcerative colitis. Dig. Dis. Sci. 2007, 52, 1415–1422. [Google Scholar] [CrossRef] [PubMed]
  37. Grose, R.H.; Cummins, A.G.; Thompson, F.M. Deficiency of invariant natural killer T cells in coeliac disease. Gut 2007, 56, 790–795. [Google Scholar] [CrossRef] [PubMed]
  38. Van der Vliet, H.J.; von Blomberg, B.M.; Nishi, N.; Reijm, M.; Voskuyl, A.E.; van Bodegraven, A.A.; Polman, C.H.; Rustemeyer, T.; Lips, P.; van den Eertwegh, A.J.; et al. Circulating Vα24+ Vβ11+ NKT cell numbers are decreased in a wide variety of diseases that are characterized by autoreactive tissue damage. Clin. Immunol. 2001, 100, 144–148. [Google Scholar] [CrossRef] [PubMed]
  39. Calleja, S.; Vivas, S.; Santiuste, M.; Arias, L.; Hernando, M.; Nistal, E.; Casqueiro, J.; Ruiz de Morales, J.G. Dynamics of non-conventional intraepithelial lymphocytes-NK, NKT, and gammadelta T-in celiac disease: Relationship with age, diet, and histopathology. Dig. Dis. Sci. 2011, 56, 2042–2049. [Google Scholar] [CrossRef] [PubMed]
  40. Dunne, M.R.; Elliott, L.; Hussey, S.; Mahmud, N.; Kelly, J.; Doherty, D.G.; Feighery, C.F. Persistent changes in circulating and intestinal gammadelta T cell subsets, invariant natural killer T cells and mucosal-associated invariant T cells in children and adults with coeliac disease. PLoS ONE 2013, 8, e76008. [Google Scholar] [CrossRef] [PubMed]
  41. Leon, F.; Eiras, P.; Roy, G.; Camarero, C. Intestinal intraepithelial lymphocytes and anti-transglutaminase in a screening algorithm for coeliac disease. Gut 2002, 50, 740–741. [Google Scholar] [CrossRef] [PubMed]
  42. Fernandez-Banares, F.; Carrasco, A.; Garcia-Puig, R.; Rosinach, M.; Gonzalez, C.; Alsina, M.; Loras, C.; Salas, A.; Viver, J.M.; Esteve, M. Intestinal intraepithelial lymphocyte cytometric pattern is more accurate than subepithelial deposits of anti-tissue transglutaminase iga for the diagnosis of celiac disease in lymphocytic enteritis. PLoS ONE 2014, 9, e101249. [Google Scholar] [CrossRef] [PubMed]
  43. Walker, M.M.; Murray, J.A. An update in the diagnosis of coeliac disease. Histopathology 2011, 59, 166–179. [Google Scholar] [CrossRef] [PubMed]
  44. Grose, R.H.; Thompson, F.M.; Cummins, A.G. Deficiency of 6b11+ invariant NKT-cells in celiac disease. Dig. Dis. Sci. 2008, 53, 1846–1851. [Google Scholar] [CrossRef] [PubMed]
  45. Wingender, G.; Kronenberg, M. Role of NKT cells in the digestive system. Iv. The role of canonical natural killer T cells in mucosal immunity and inflammation. Am. J. Physiol. Gastrointest. Liver Physiol. 2008, 294, G1–G8. [Google Scholar] [CrossRef] [PubMed]
  46. Eiras, P.; Roldan, E.; Camarero, C.; Olivares, F.; Bootello, A.; Roy, G. Flow cytometry description of a novel CD3-/CD7+ intraepithelial lymphocyte subset in human duodenal biopsies: Potential diagnostic value in coeliac disease. Cytometry 1998, 34, 95–102. [Google Scholar] [CrossRef]
  47. Eiras, P.; Leon, F.; Camarero, C.; Lombardia, M.; Roldan, E.; Bootello, A.; Roy, G. Intestinal intraepithelial lymphocytes contain a CD3- CD7+ subset expressing natural killer markers and a singular pattern of adhesion molecules. Scand. J. Immunol. 2000, 52, 1–6. [Google Scholar] [CrossRef] [PubMed]
  48. Yu, K.O.; Porcelli, S.A. The diverse functions of CD1D-restricted NKT cells and their potential for immunotherapy. Immunol. Lett. 2005, 100, 42–55. [Google Scholar] [CrossRef] [PubMed]
  49. Shimizu, K.; Shinga, J.; Yamasaki, S.; Kawamura, M.; Dorrie, J.; Schaft, N.; Sato, Y.; Iyoda, T.; Fujii, S. Transfer of mRNA encoding invariant NKT cell receptors imparts glycolipid specific responses to T cells and gammadeltat cells. PLoS ONE 2015, 10, e0131477. [Google Scholar] [CrossRef] [PubMed]
  50. O’Keeffe, J.; Podbielska, M.; Hogan, E.L. Invariant natural killer T cells and their ligands: Focus on multiple sclerosis. Immunology 2015, 145, 468–475. [Google Scholar] [CrossRef] [PubMed]
  51. Schrumpf, E.; Tan, C.; Karlsen, T.H.; Sponheim, J.; Bjorkstrom, N.K.; Sundnes, O.; Alfsnes, K.; Kaser, A.; Jefferson, D.M.; Ueno, Y.; et al. The biliary epithelium presents antigens to and activates natural killer T cells. Hepatology 2015, 62, 1249–1259. [Google Scholar] [CrossRef] [PubMed]
  52. Sarra, M.; Cupi, M.L.; Monteleone, I.; Franze, E.; Ronchetti, G.; Di Sabatino, A.; Gentileschi, P.; Franceschilli, L.; Sileri, P.; Sica, G.; et al. IL-15 positively regulates IL-21 production in celiac disease mucosa. Mucosal Immunol. 2013, 6, 244–255. [Google Scholar] [CrossRef] [PubMed]
  53. Van Bergen, J.; Mulder, C.J.; Mearin, M.L.; Koning, F. Local communication among mucosal immune cells in patients with celiac disease. Gastroenterology 2015, 148, 1187–1194. [Google Scholar] [CrossRef] [PubMed]
  54. Gill, N.; Rosenthal, K.L.; Ashkar, A.A. Nk and nkt cell-independent contribution of interleukin-15 to innate protection against mucosal viral infection. J. Virol. 2005, 79, 4470–4478. [Google Scholar] [CrossRef] [PubMed]
  55. Pillai, V.; Ortega, S.B.; Wang, C.K.; Karandikar, N.J. Transient regulatory T-cells: A state attained by all activated human T-cells. Clin. Immunol. 2007, 123, 18–29. [Google Scholar] [CrossRef] [PubMed]
  56. Bernardo, D.; Al-Hassi, H.O.; Mann, E.R.; Tee, C.T.; Murugananthan, A.U.; Peake, S.T.; Hart, A.L.; Knight, S.C. T-cell proliferation and forkhead box p3 expression in human T cells are dependent on T-cell density: Physics of a confined space? Hum. Immunol. 2012, 73, 223–231. [Google Scholar] [CrossRef] [PubMed]
  57. Gibbons, D.L.; Spencer, J. Mouse and human intestinal immunity: Same ballpark, different players; different rules, same score. Mucosal Immunol. 2011, 4, 148–157. [Google Scholar] [CrossRef] [PubMed]
  58. Ebert, L.M.; Tan, B.S.; Browning, J.; Svobodova, S.; Russell, S.E.; Kirkpatrick, N.; Gedye, C.; Moss, D.; Ng, S.P.; MacGregor, D.; et al. The regulatory T cell-associated transcription factor FoxP3 is expressed by tumor cells. Cancer Res. 2008, 68, 3001–3009. [Google Scholar] [CrossRef] [PubMed]
  59. Morgan, M.E.; van Bilsen, J.H.; Bakker, A.M.; Heemskerk, B.; Schilham, M.W.; Hartgers, F.C.; Elferink, B.G.; van der Zanden, L.; de Vries, R.R.; Huizinga, T.W.; et al. Expression of FoxP3 mRNA is not confined to CD4+CD25+ T regulatory cells in humans. Hum. Immunol. 2005, 66, 13–20. [Google Scholar] [CrossRef] [PubMed]
  60. Chen, G.Y.; Chen, C.; Wang, L.; Chang, X.; Zheng, P.; Liu, Y. Cutting edge: Broad expression of the FoxP3 locus in epithelial cells: A caution against early interpretation of fatal inflammatory diseases following in vivo depletion of FoxP3-expressing cells. J. Immunol. 2008, 180, 5163–5166. [Google Scholar] [CrossRef] [PubMed]

