Body Mass Index and Risk of Gallbladder Cancer: Systematic Review and Meta-Analysis of Observational Studies

Abstract
:1. Introduction
2. Materials and Methods
2.1. Search Strategies
2.2. Study Selection Criteria
2.3. Data Extraction and Quality Assessment
2.4. Statistical Analysis
3. Results
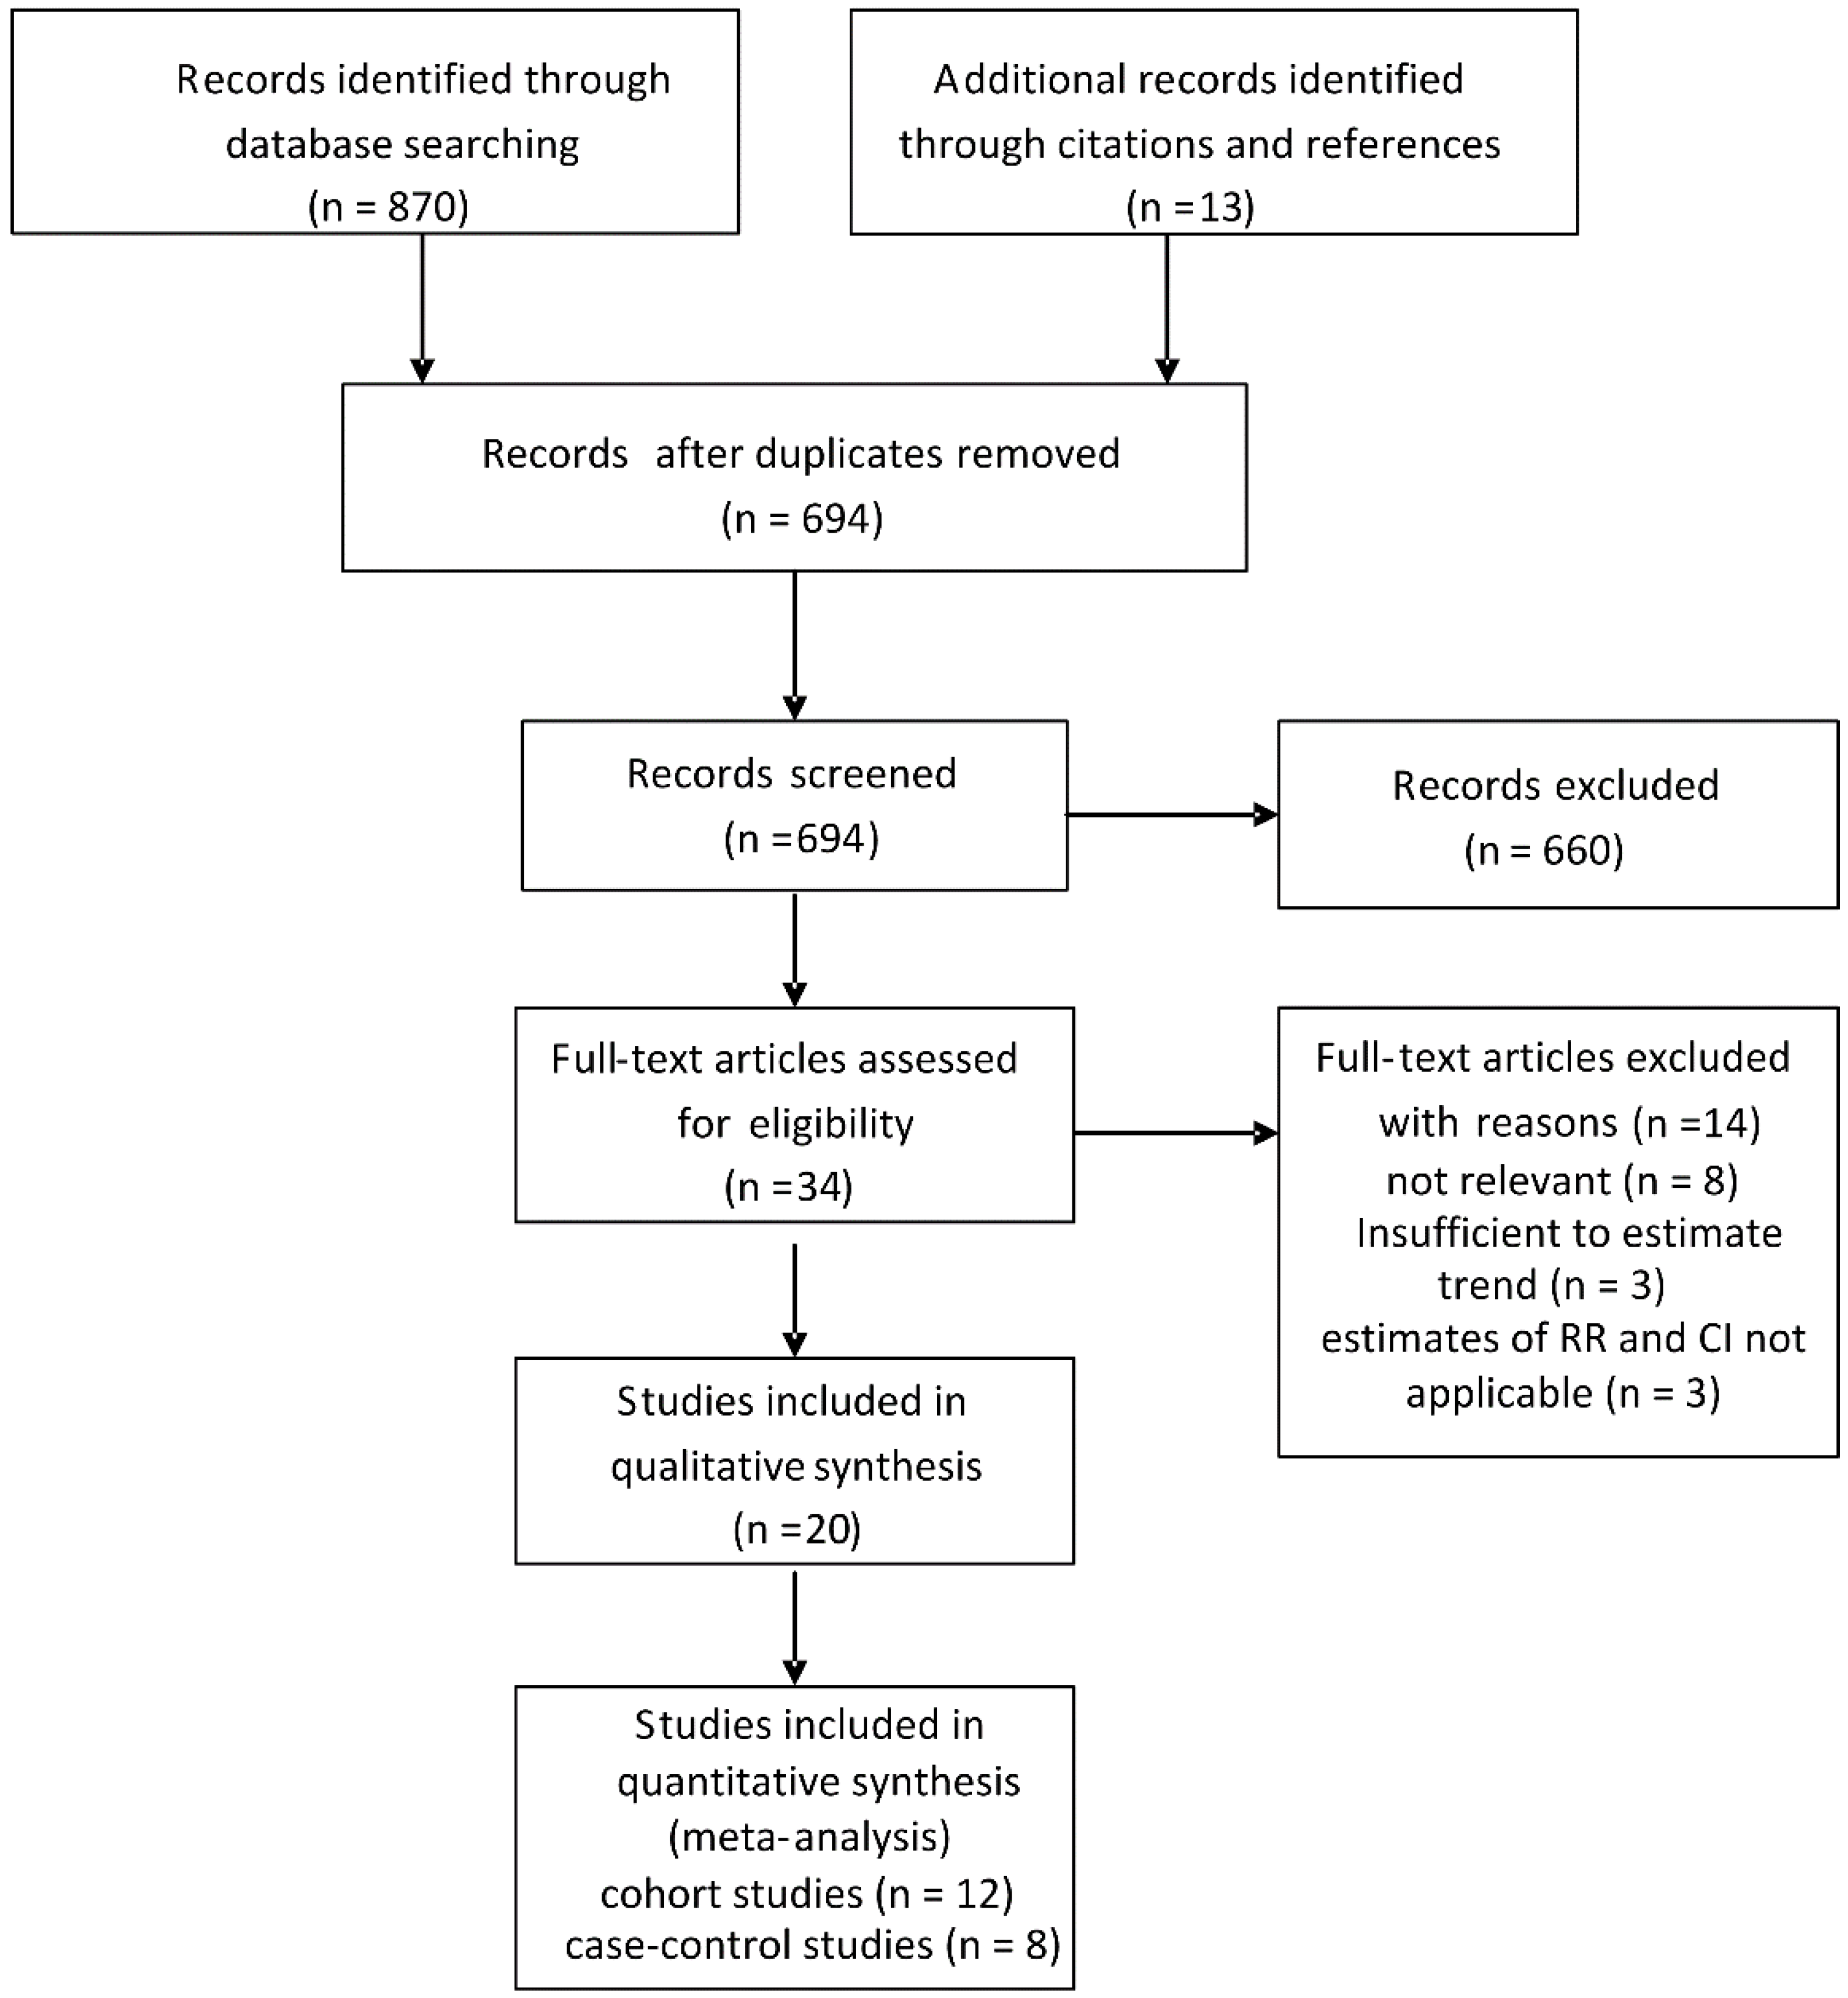
3.1. Search Results and Study Characteristics
3.2. Quantitative Data Synthesis

| Author, Year, Country (Study Period), Source, [Reference No.] | Case Size | Controls Size | Age: Mean or Range | BMI Ascertainment | BMI Categories (kg/m2) | Effect Estimate a (95% CI) | Adjustments | NOS | |
|---|---|---|---|---|---|---|---|---|---|
| Men | Women | ||||||||
| Strom, 1995, Mexico and Bolivia (1984–1988) Hospital, [10] | 65 | 110 | 45–75 | Self-reported | <24.0 24.0–25.9 26.0–28.9 >28.0 | Men and women 1.0 (reference) 1.5 (0.5–4.6) 2.2 (0.7–8.4) 1.6 (0.4–6.1) | NA | Age, sex, country | 6 |
| Zatonski, 1997, Australia, Canada, The Netherlands and Poland (1983–1988) Population, [32] | 189 | 1479 | 62.7 m 64.2 f | Self-reported | Quartile 1 Quartile 2 Quartile 3 Quartile 4 | 1.0 (reference) 1.0 (0.3–3.0) 0.7 (0.3–2.0) 1.0 (0.3–2.8) | 1.00 (reference) 1.70 (0.90–3.10) 1.50 (0.80–3.00) 2.10 (1.20–3.80) | Age, sex, center, education, alcohol, smoking, type of interview | 7 |
| Serra, 2002, Chile (1992–1995) Hospital, [31] | 114 | 114 | 65.8 m 70.6 f | Self-reported | <25.0 25.0–29.9 ≥30.0 | Men and women 1.0 (reference) 0.8 (0.4–1.4) 0.9 (0.4–1.8) | NA | Age, sex | 7 |
| Máchová, 2007, Czech (1987–2002) Population, [29] | 93 | 37772 | 30–64 | Measured | 18.5–24.9 25–30 ≥30.0 | 1.00 (reference) 1.01 (0.24–4.32) 0.76 (0.08–7.41) | 1.00 (reference) 1.07 (0.58–1.95) 0.73 (0.36–1.50) | Age, smoking, height, hypertension | 8 |
| Hsing, 2008, China (1997–2001) Population, [28] | 365 | 959 | 34–74 | Self-reported | <18.5 18.5–22.9 23.0–24.9 ≥25 | Men and women 0.62 (0.35–1.09) 1.0 (reference) 1.2 (0.85–1.68) 1.56 (1.17–2.10) | NA | Age, sex, education | 6 |
| Grainge, 2009, United Kingdom (1987–2002) Population, [27] | 86 | 3007 | 72 | Measured | <25 25–29.9 ≥30.0 | Men and women 1.00 (reference) 1.03 (0.62–1.72) 1.51 (0.83–2.75) | NA | Smoking, alcohol, NSAID use | 8 |
| Nakadaira, 2009, Hungary (2003–2006) hospital, [30] | 41 | 30 | 40–69 | NA | ≤24.9 25.0–29.9 ≥30.0 | Men and women 1.00 (reference) 1.5 (0.4-5.0) 0.8 (0.3–1.8) | NA | Age | 7 |
| Alvi, 2011, Pakistan (1988–2007) hospital, [12] | 60 | 120 | 18–75 | Measured | <23 >23 | Men and women 1.00 (reference) 1.98 (0.62–6.28) | NA | Sex, hypertension, diabetes, smoking | 7 |
| Author, Year, Country, (Study Period) [Ref. No.] | Total Cohort | Age: Mean or Range | Cases | Follow-up, Years | BMI Ascertainment | BMI Categories (kg/m2) | Effect Estimate a (95% CI) | Adjustments | NOS | |
|---|---|---|---|---|---|---|---|---|---|---|
| Men | Women | |||||||||
| Moller, 1994, Denmark (1977–1987), [9] | 43965 | 50 m 60 f | 28 | 5 | Discharge diagnosis | Non-obese Obese | 1.00 (reference) 0.50 (0.1–1.8) | 1.00 (reference) 1.40 (0.9–2.1) | Age | 6 |
| Wolk, 2001, Sweden (1965–1993), [8] | 28129 | 46.1 | 31 | 10.3 | Discharge diagnosis | Non-obese Obese | 1.00 (reference) 0.90 (0.1–3.4) | 1.00 (reference) 1.70 (1.1–2.5) | Age, calendar year | 7 |
| Calle, 2003, United States (1982–1998), [18] | 900053 | 57 | 484 | 16 | Self-reported | 18.5–24.9 25.0–29.9 30.0–34.9 | 1.00 (reference) 1.34 (0.97–1.84) 1.76 (1.06–2.94) | 1.00 (reference) 1.12 (0.86–1.47) 2.13 (1.56–2.90) | Age, race, marital status, smoking, aspirin, alcohol, estrogen therapy (w) | 8 |
| Samanic, 2004, United States (1969–1996), [25] | 4500700 m | 52.18 whites 47.63 blacks | 338 m | 12 | Discharge diagnosis | Non-obese Obese | 1.00 (reference) 1.63(1.10–2.41) b | NA | Age, calendar year | 6 |
| Engeland, 2005, Norway (1963–2001), [19] | 2001719 | 20–74 | 1,715 | 13 | Measured | 18.5–24.9 25.0–29.9 ≥30.0 | 1.00 (reference) 1.00 (0.84–1.17) 1.38 (1.01–1.89) | 1.00 (reference) 1.27 (1.10–1.47) 1.88 (1.60–2.21) | Age, birth cohort | 7 |
| Kuriyama, 2005, Japan (1984–1992), [22] | 27539 | ≥40 | 33 | 9 | Self-reported | 18.5–24.9 25.0–27.4 27.5–29.9 ≥30.0 | 1.00 (reference) 0.46 (0.05–3.93) | 1.00 (reference) 0.83 (0.23–2.98) 3.43 (1.19–9.94) 4.45(1.39–14.23) | Age, smoking, health insurance, alcohol | 7 |
| Oh, 2005, Korea (1992–2001), [23] | 781283 m | ≥20 | 182 | 10 | Measured | 21.0–22.9 23.0–24.9 25.0–26.9 27.0–29.9 | 1.00 (reference) 1.55 (1.10–2.20) 1.15 (0.74–1.80) 1.25 (0.70–2.24) | NA | Age, smoking, alcohol, exercise, region | 7 |
| Samanic, 2006, Sweden (1971–1999), [24] | 362552 m | 34.3 | 109 | 19 | Measured | 18.5–24.9 25.0–29.9 ≥30.0 | 1.0 (reference) 0.93 (0.62–1.39) 1.40 (0.73–2.70) | NA | Age, smoking | 8 |
| Ishiguro, 2008, Japan (1994–2004), [20] | 101868 | 40–69 | 90 | 10.9 | Self-reported | ≤22.9 23.0–24.9 25.0–26.9 ≥27.0 | 1.00 (reference) 0.74 (0.28–1.92) 1.26 (0.48–3.33) 1.39 (0.45–4.34) | 1.00 (reference) 0.47 (0.22–0.98) 0.62 (0.29–1.34) 0.94 (0.48–1.88) | Age, gender, study area, diabetes, smoking, alcohol | 6 |
| Jee, 2008, Korean (1992–2006), [21] | 1213829 | 45.0 m 49.4 f | 1882 | 10.8 | Measured | 23.0–24.9 25.0–29.9 ≥30 | 1.00 (reference) 0.97 (0.86–1.10) 1.65 (1.11–2.44) | 1.00 (reference) 1.27 (1.02–2.12) 1.44 (0.98–2.12) | Age, smoking | 8 |
| Song, 2008, Korean (1994–2003), [26] | 170481 f | 55.9 | 181 | 8.75 | Measured | 21.0–22.9 23.0–24.9 25.0–26.9 27.0–29.9 ≥30 | NA | 1.00 (reference) 1.06 (0.62–1.80) 1.30 (0.76–2.22) 1.86 (1.09–3.18) 2.10 (0.97–4.51) | Age, height, smoking, alcohol, exercise, pay level | 7 |
| Hemminki, 2011, Sweden (1964–2006), (11) | 30020 | NA | 28 | 11.2 | Discharge diagnosis | Non-obese obese | Men and women 1.00 (reference) 1.73 (1.16–2.57)c | NA | Age, sex, region, economic status | 7 |
| Overweight | Obesity | |||||||||
|---|---|---|---|---|---|---|---|---|---|---|
| Studies, n | RR (95% CI) | ph | Q | I2,% | Studies, n | RR (95% CI) | ph | Q | I2,% | |
| Study design | ||||||||||
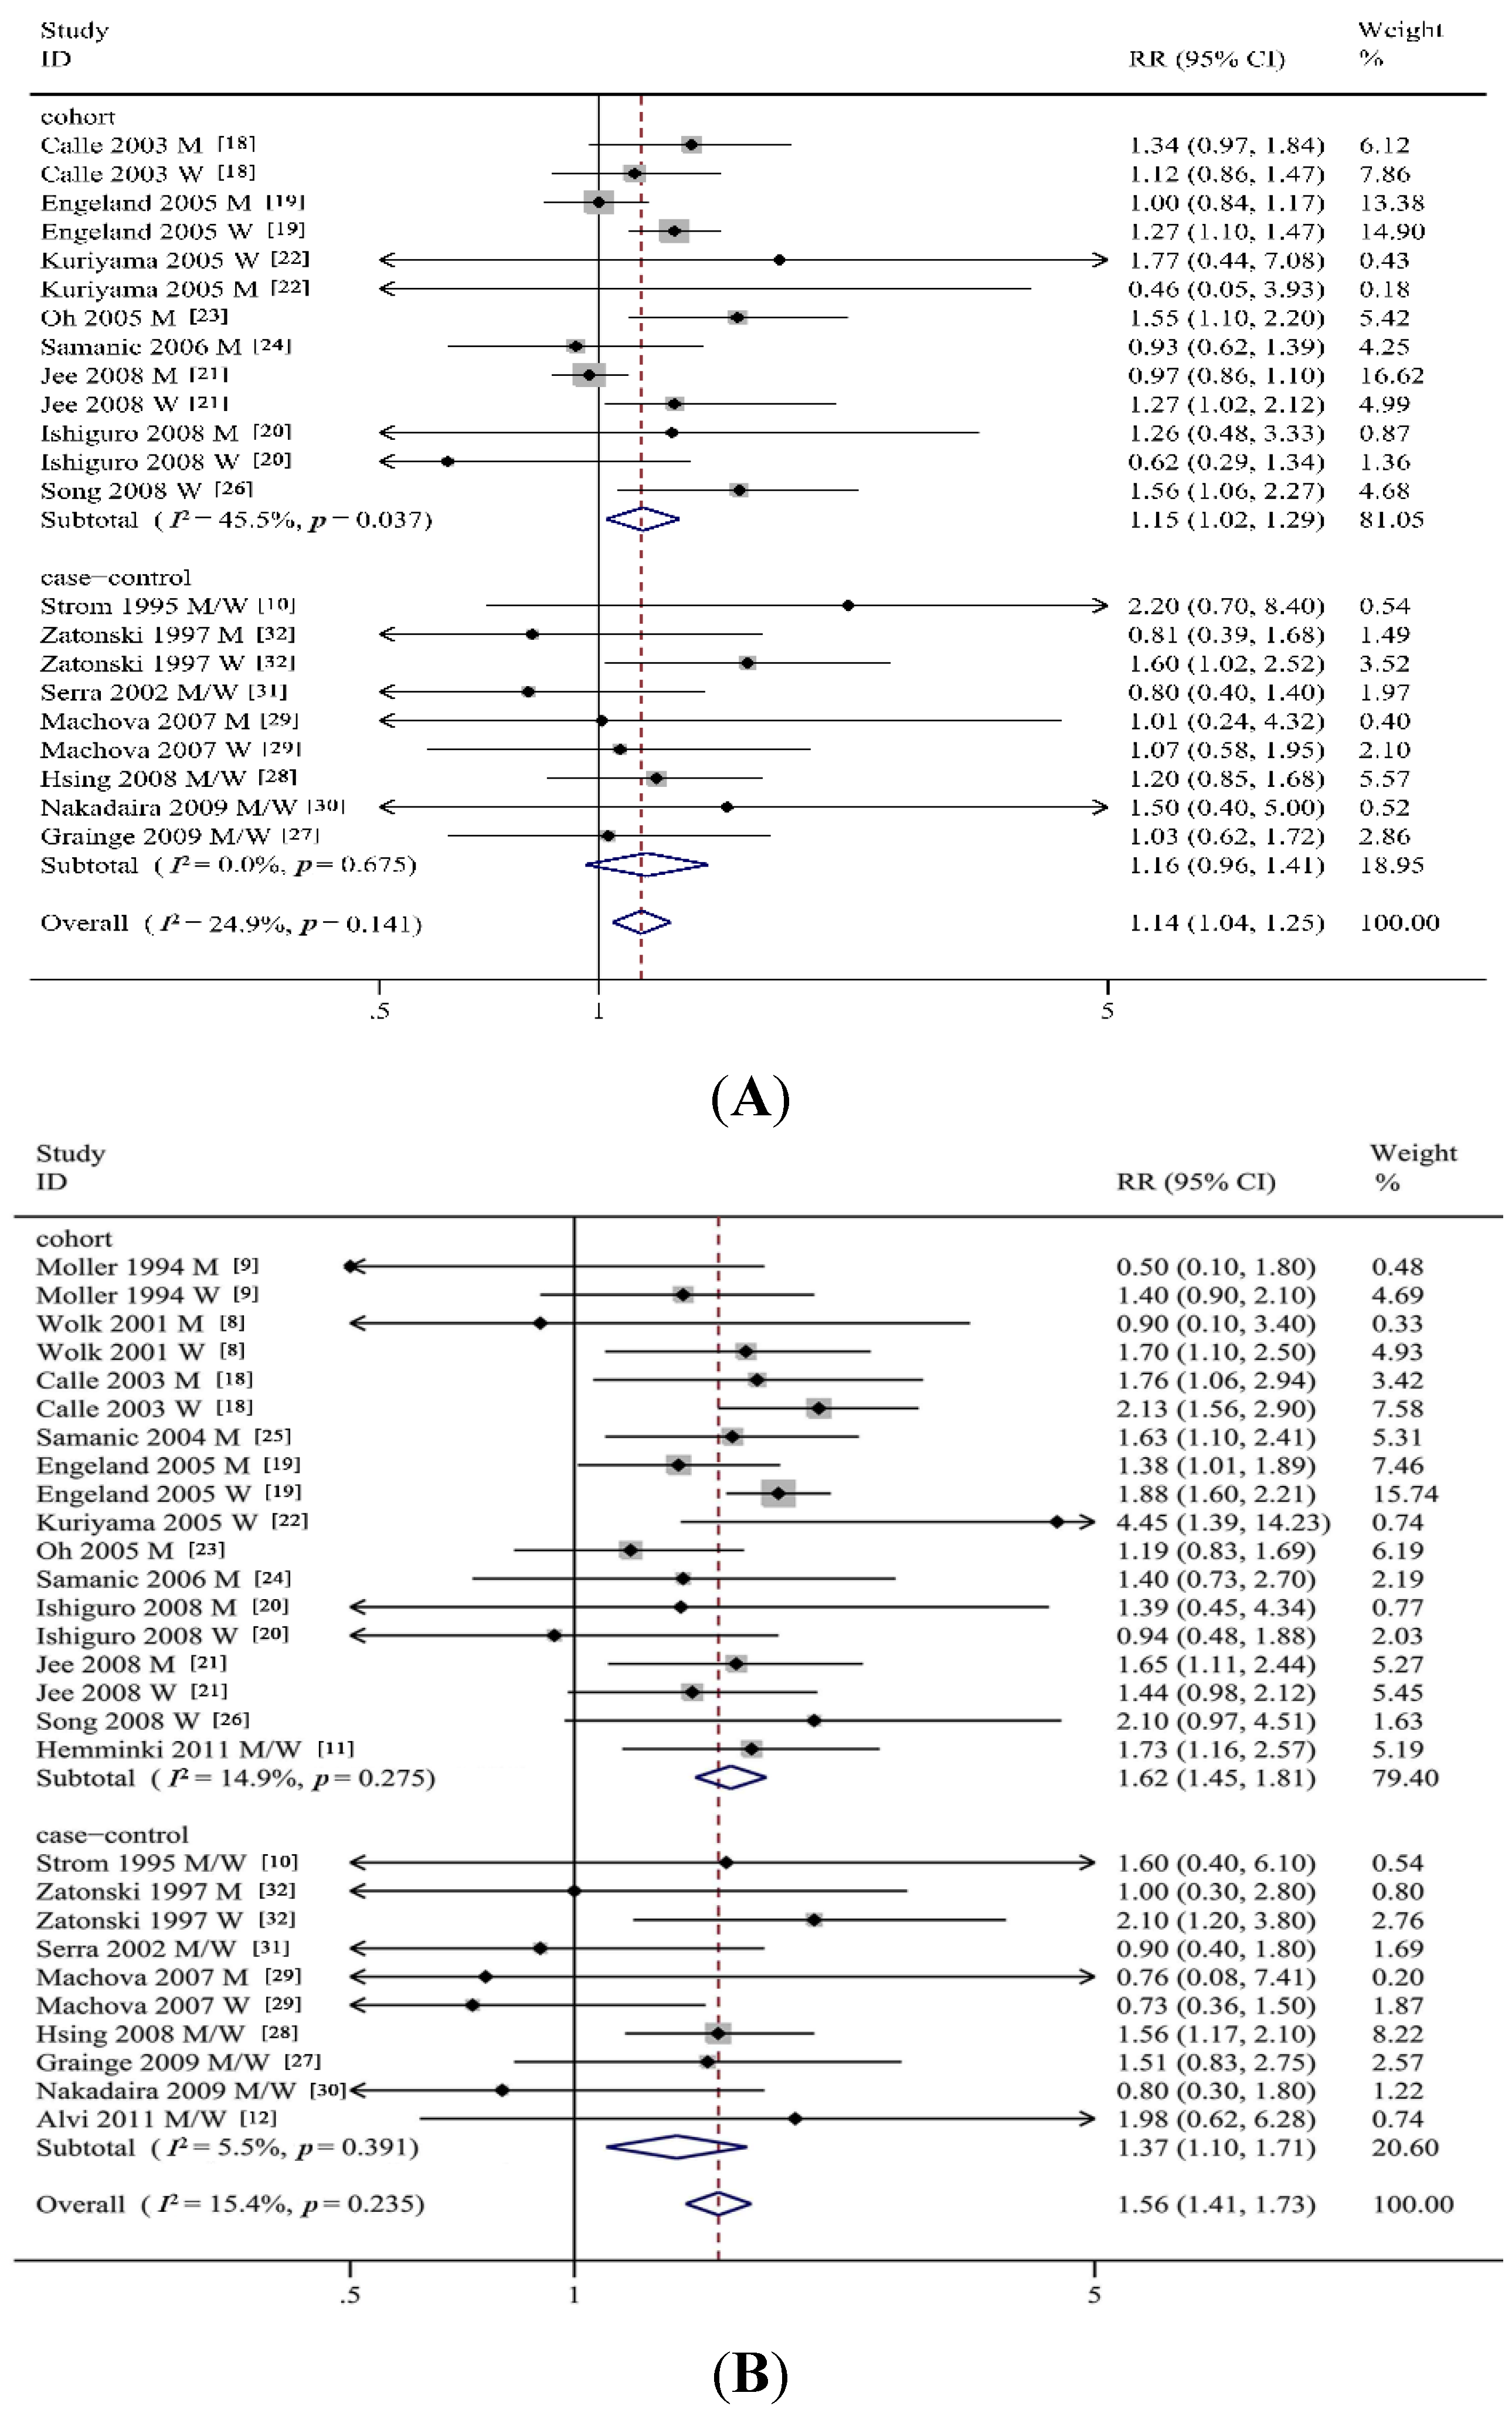
| Cohort studies | 12 | 1.15 (1.02–1.29) | 0.04 | 22.03 | 45.5 | 12 | 1.62 (1.45–1.81) | 0.28 | 19.98 | 14.9 |
| Case-control studies | 8 | 1.16 (0.96–1.41) | 0.68 | 5.75 | 0 | 8 | 1.37 (1.10–1.71) | 0.39 | 9.52 | 5.5 |
| Follow-up time | ||||||||||
| >10 years | 6 | 1.12 (1.00–1.27) | 0.04 | 17.78 | 49.4 | 9 | 1.65 (1.49–1.83) | 0.40 | 13.58 | 4.3 |
| <10 years | 2 | 1.52 (1.06–2.19) | 0.54 | 1.22 | 0 | 3 | 1.69 (0.91–3.17) | 0.10 | 6.32 | 52.5 |
| Control source | ||||||||||
| Hospital | 3 | 1.14 (0.61–2.03) | 0.30 | 2.39 | 16.4 | 4 | 1.07 (0.66–1.74) | 0.57 | 2.03 | 0 |
| Population | 4 | 1.18 (0.96–1.46) | 0.67 | 3.19 | 0 | 4 | 1.43 (1.09–1.89) | 0.30 | 6.12 | 18.3 |
| Sex | ||||||||||
| Men | 9 | 1.06 (0.94–1.20) | 0.24 | 10.33 | 22.5 | 11 | 1.42 (1.21–1.66) | 0.85 | 5.63 | 0 |
| Women | 8 | 1.26 (1.13–1.40) | 0.45 | 6.84 | 0 | 10 | 1.67 (1.38–2.02) | 0.06 | 16.38 | 45.0 |
| Geographic region | ||||||||||
| Asia | 6 | 1.19 (0.98–1.45) | 0.06 | 15.00 | 46.7 | 7 | 1.48 (1.26–1.74) | 0.43 | 8.07 | 0.9 |
| Non-Asia | 9 | 1.14 (1.05–1.25) | 0.43 | 12.20 | 1.7 | 13 | 1.58 (1.40–1.80) | 0.22 | 22.38 | 19.6 |
| BMI ascertainment | ||||||||||
| Self-reported | 7 | 1.18 (1.01–1.36) | 0.46 | 9.74 | 0 | 7 | 1.65 (1.32–2.05) | 0.20 | 12.16 | 26.0 |
| Measured | 7 | 1.14 (1.01–1.30) | 0.04 | 17.40 | 48.3 | 8 | 1.51 (1.29–1.77) | 0.20 | 13.52 | 26.1 |
| Adjustment for confounders smoking | ||||||||||
| Yes | 10 | 1.16 (1.02–1.31) | 0.16 | 20.42 | 26.5 | 11 | 1.55 (1.31–1.83) | 0.21 | 19.06 | 21.3 |
| No | 5 | 1.14 (0.98–1.32) | 0.21 | 7.10 | 29.5 | 9 | 1.59 (1.40–1.80) | 0.32 | 12.61 | 12.8 |
| Alcohol intake | ||||||||||
| Yes | 7 | 1.27 (1.10–1.47) | 0.37 | 10.87 | 8.0 | 7 | 1.64 (1.31–2.07) | 0.15 | 13.31 | 32.4 |
| No | 8 | 1.08 (0.98–1.19) | 0.25 | 12.59 | 20.6 | 13 | 1.56 (1.40–1.73) | 0.36 | 18.44 | 7.8 |
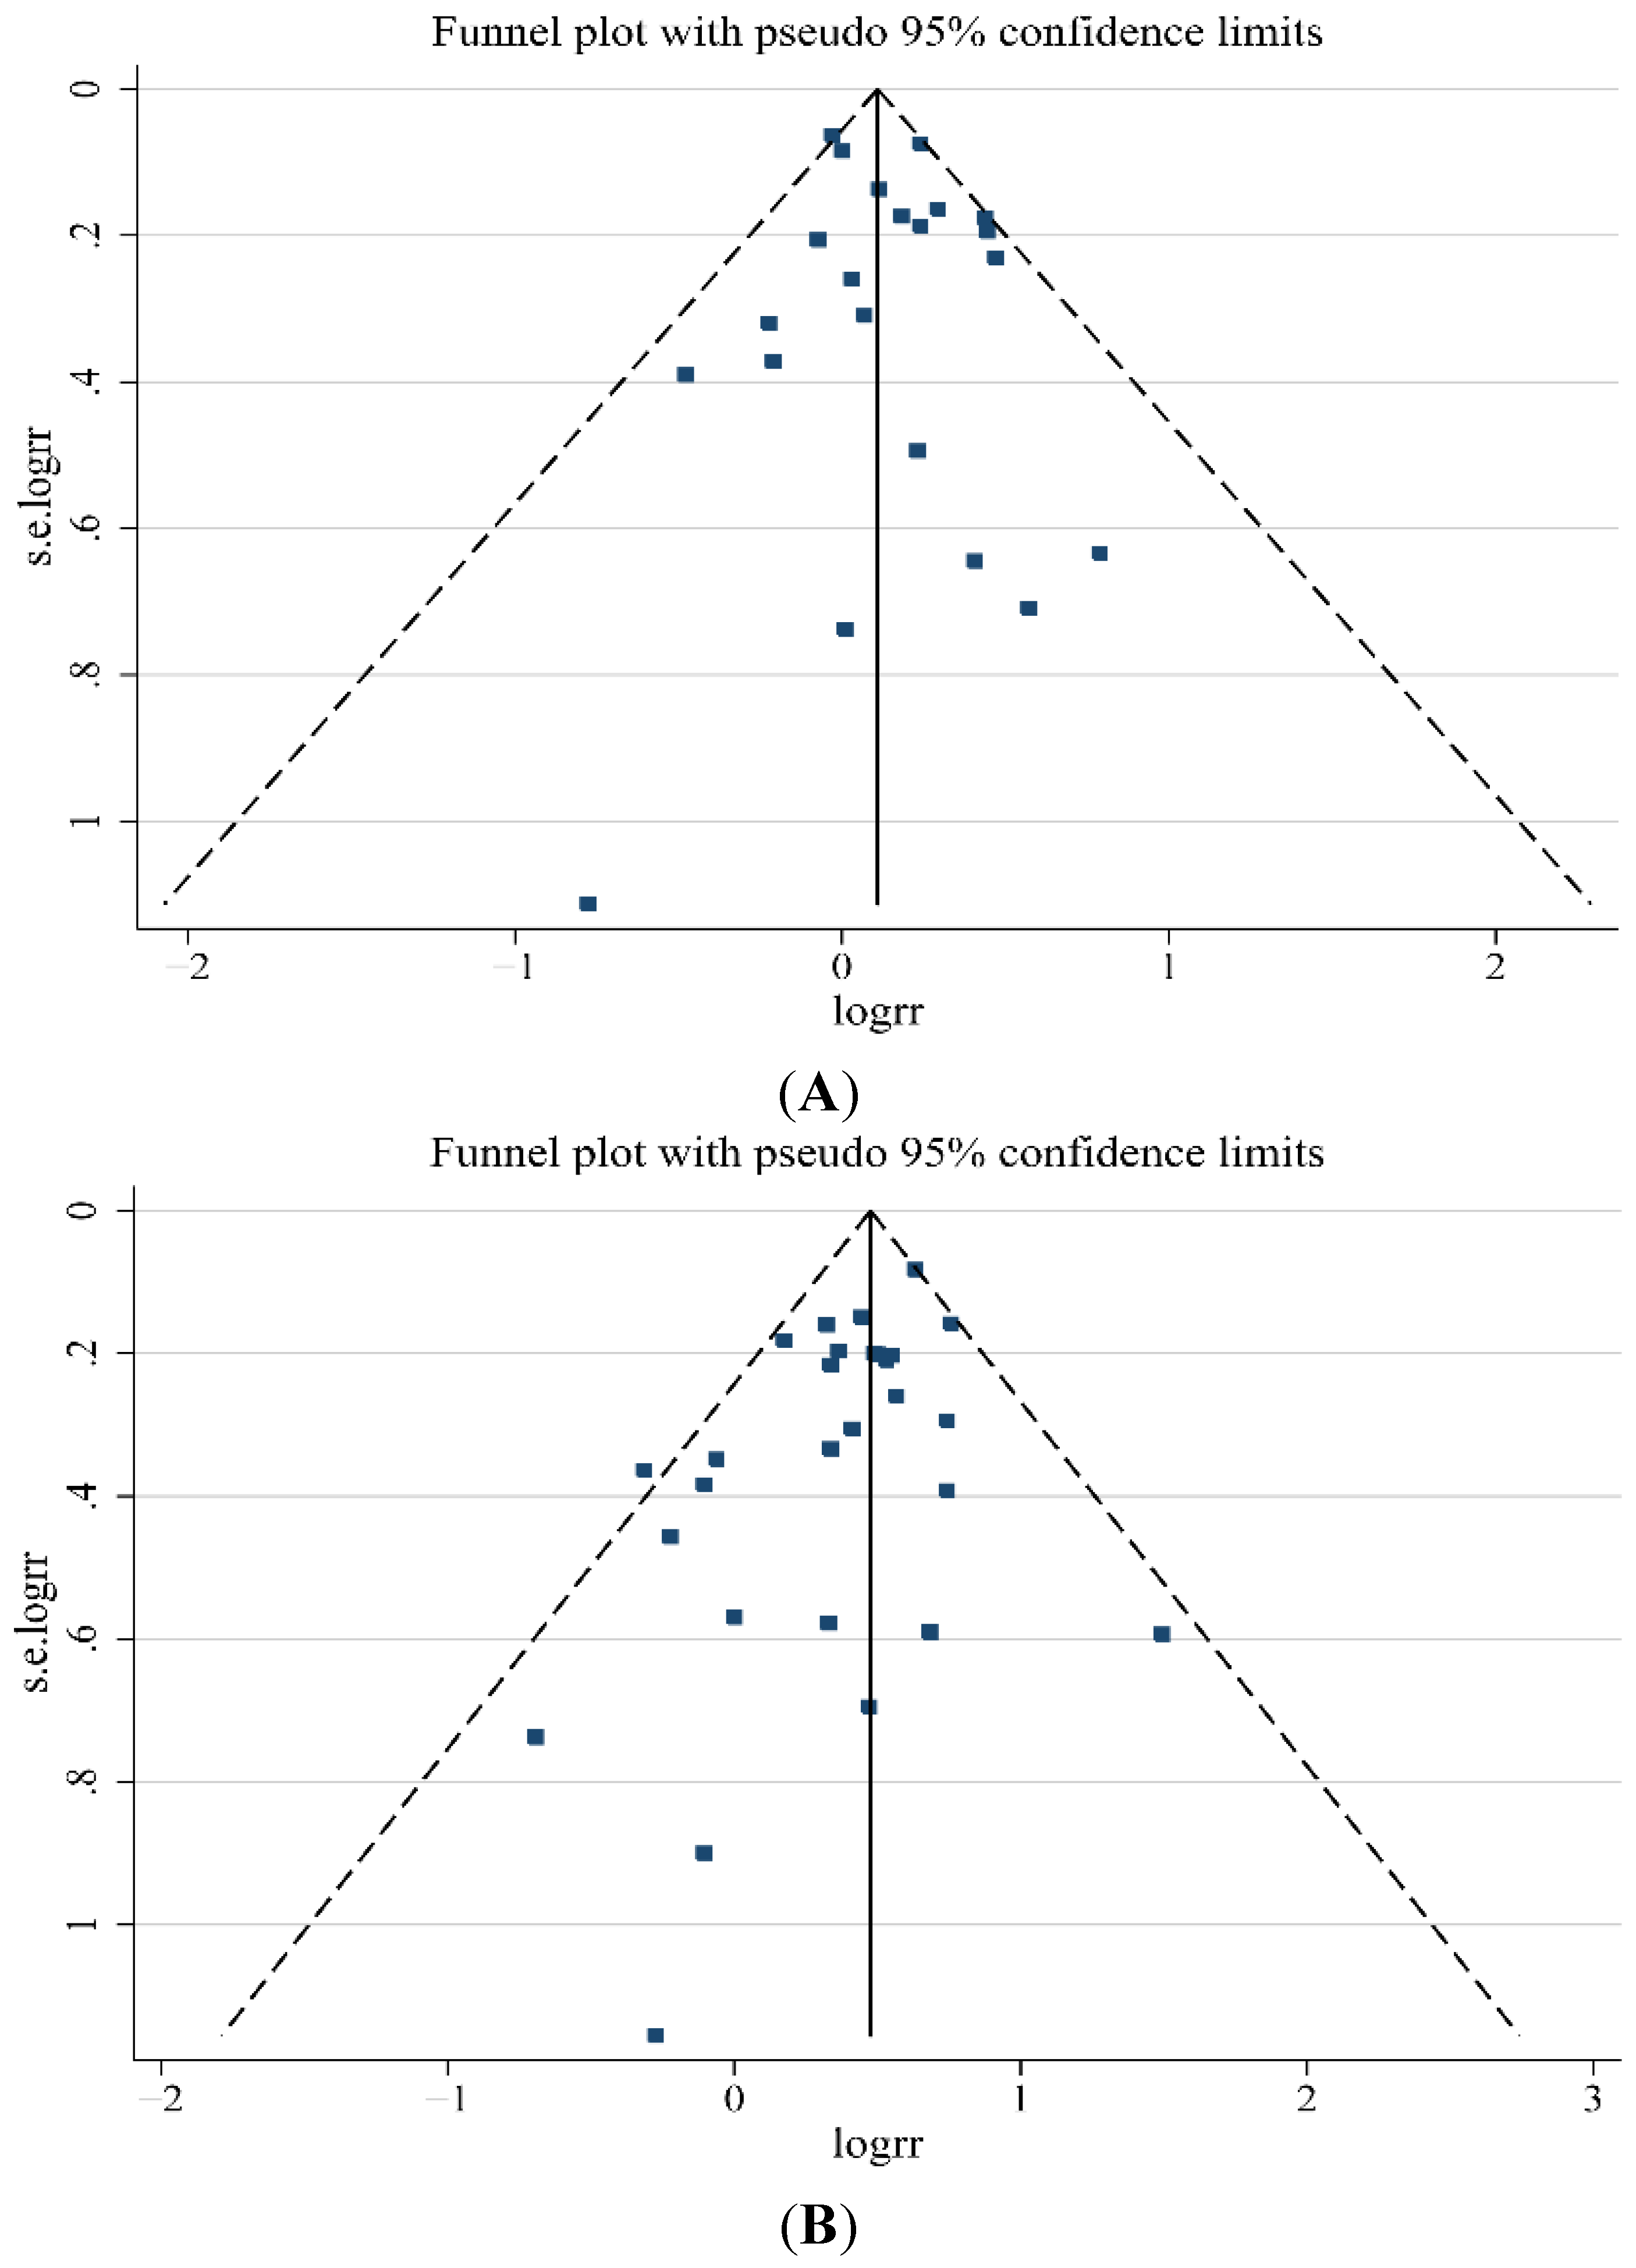
3.3. Sensitivity Analyses and Publication Bias
4. Discussion and Conclusions
Supplementary Files
Supplementary File 1Acknowledgments
Author Contributions
Conflicts of Interest
Abbreviations
| GBC | Gallbladder cancer |
| BMI | Body mass index |
| OR | Odds ratio |
| RR | Relative risk |
| HR | Hazard ratio |
| SRRs | Summary relative risks |
| CI | Confidence intervals |
| DM | Diabetes mellitus |
References
- Misra, S.; Chaturvedi, A.; Misra, N.C.; Sharma, I.D. Carcinoma of the gallbladder. Lancet Oncol. 2003, 4, 167–176. [Google Scholar] [CrossRef]
- Foster, J.M.; Hoshi, H.; Gibbs, J.F.; Iyer, R.; Javle, M.; Chu, Q.; Kuvshinoff, B. Gallbladder cancer: Defining the indications for primary radical resection and radical re-resection. Ann. Surg. Oncol. 2007, 14, 833–840. [Google Scholar] [CrossRef] [PubMed]
- Hsing, A.W.; Bai, Y.; Andreotti, G.; Rashid, A.; Deng, J.; Chen, J.; Goldstein, A.M.; Han, T.Q.; Shen, M.C.; Fraumeni, J.F., Jr.; et al. Family history of gallstones and the risk of biliary tract cancer and gallstones: A population-based study in Shanghai, China. Int. J. Cancer 2007, 121, 832–838. [Google Scholar] [CrossRef] [PubMed]
- Jamal, M.M.; Yoon, E.J.; Vega, K.J.; Hashemzadeh, M.; Chang, K.J. Diabetes mellitus as a risk factor for gastrointestinal cancer among American veterans. World J. Gastroenterol. 2009, 15, 5274–5278. [Google Scholar] [CrossRef] [PubMed]
- Hou, L.; Xu, J.; Gao, Y.T.; Rashid, A.; Zheng, S.L.; Sakoda, L.C.; Shen, M.C.; Wang, B.S.; Deng, J.; Han, T.Q.; et al. CYP17 MspA1 polymorphism and risk of biliary tract cancers and gallstones: A population-based study in Shanghai, China. Int. J. Cancer 2006, 118, 2847–2853. [Google Scholar] [CrossRef] [PubMed]
- Ji, J.; Hemminki, K. Variation in the risk for liver and gallbladder cancers in socioeconomic and occupational groups in Sweden with etiological implications. Int. Arch. Occup. Environ. Health 2005, 78, 641–649. [Google Scholar] [CrossRef] [PubMed]
- Moerman, C.J.; Bueno, D.M.H.; Runia, S. Smoking, alcohol consumption and the risk of cancer of the biliary tract; a population-based case-control study in The Netherlands. Eur. J. Cancer Prev. 1994, 3, 427–436. [Google Scholar] [CrossRef] [PubMed]
- Wolk, A.; Gridley, G.; Svensson, M.; Nyren, O.; McLaughlin, J.K.; Fraumeni, J.F.; Adam, H.O. A prospective study of obesity and cancer risk (Sweden). Cancer Causes Control 2001, 12, 13–21. [Google Scholar] [CrossRef] [PubMed]
- Moller, H.; Mellemgaard, A.; Lindvig, K.; Olsen, J.H. Obesity and cancer risk: A Danish record-linkage study. Eur. J. Cancer 1994, 30, 344–350. [Google Scholar] [CrossRef]
- Strom, B.L.; Soloway, R.D.; Rios-Dalenz, J.L.; Rodriguez-Martinez, H.A.; West, S.L.; Kinman, J.L.; Polansky, M.; Berlin, J.A. Risk factors for gallbladder cancer. An international collaborative case-control study. Cancer 1995, 76, 1747–1756. [Google Scholar] [CrossRef]
- Hemminki, K.; Li, X.; Sundquist, J.; Sundquist, K. Obesity and familial obesity and risk of cancer. Eur. J. Cancer Prev. 2011, 20, 438–443. [Google Scholar] [CrossRef] [PubMed]
- Alvi, A.R.; Siddiqui, N.A.; Zafar, H. Risk factors of gallbladder cancer in Karachi-a case-control study. World J. Surg. Oncol. 2011, 9, 164. [Google Scholar] [CrossRef] [PubMed]
- Stroup, D.F.; Berlin, J.A.; Morton, S.C.; Olkin, I.; Williamson, G.D.; Rennie, D.; Moher, D.; Becker, B.J.; Sipe, T.A.; Thacker, S.B. Meta-analysis of observational studies in epidemiology: A proposal for reporting. JAMA 2000, 283, 2008–2012. [Google Scholar] [CrossRef] [PubMed]
- Wells, G.A.; Shea, B.; O’Connell, D.; Peterson, J.; Welch, V.; Losos, M.; Tugwell, P. The Newcastle-Ottawa Scale (NOS) for Assessing the Quality of Nonrandomised Studies in Meta-Analyses; Ottawa Hospital Research Institute: Ottawa, ON, Canada, 2013. [Google Scholar]
- Higgins, J.P.; Thompson, S.G. Quantifying heterogeneity in a meta-analysis. Stat. Med. 2002, 21, 1539–1558. [Google Scholar] [CrossRef] [PubMed]
- Sterne, J.A.; Egger, M. Funnel plots for detecting bias in meta-analysis: Guidelines on choice of axis. J. Clin. Epidemiol. 2001, 54, 1046–1055. [Google Scholar] [CrossRef]
- Duval, S.; Tweedie, R. Trim and fill: A simple funnel-plot-based method of testing and adjusting for publication bias in meta-analysis. Biometrics 2000, 56, 455–463. [Google Scholar] [CrossRef] [PubMed]
- Calle, E.E.; Rodriguez, C.; Walker-Thurmond, K.; Thun, M.J. Overweight, obesity, and mortality from cancer in a prospectively studied cohort of U.S. adults. N. Engl. J. Med. 2003, 348, 1625–1638. [Google Scholar] [CrossRef] [PubMed]
- Engeland, A.; Tretli, S.; Austad, G.; Bjorge, T. Height and body mass index in relation to colorectal and gallbladder cancer in two million Norwegian men and women. Cancer Causes Control 2005, 16, 987–996. [Google Scholar] [CrossRef] [PubMed]
- Ishiguro, S.; Inoue, M.; Kurahashi, N.; Iwasaki, M.; Sasazuki, S.; Tsugane, S. Risk factors of biliary tract cancer in a large-scale population-based cohort study in Japan (JPHC study); with special focus on cholelithiasis, body mass index, and their effect modification. Cancer Causes Control 2008, 19, 33–41. [Google Scholar] [CrossRef] [PubMed]
- Jee, S.H.; Yun, J.E.; Park, E.J.; Cho, E.R.; Park, I.S.; Sull, J.W.; Ohrr, H.; Samet, J.M. Body mass index and cancer risk in Korean men and women. Int. J. Cancer 2008, 123, 1892–1896. [Google Scholar] [CrossRef] [PubMed]
- Kuriyama, S.; Tsubono, Y.; Hozawa, A.; Shimazu, T.; Suzuki, Y.; Koizumi, Y.; Suzuki, Y.; Ohmori, K.; Nishino, Y.; Tsuji, I. Obesity and risk of cancer in Japan. Int. J. Cancer 2005, 113, 148–157. [Google Scholar] [CrossRef] [PubMed]
- Oh, S.W.; Yoon, Y.S.; Shin, S.A. Effects of excess weight on cancer incidences depending on cancer sites and histologic findings among men: Korea National Health Insurance Corporation Study. J. Clin. Oncol. 2005, 23, 4742–4754. [Google Scholar] [CrossRef] [PubMed]
- Samanic, C.; Chow, W.H.; Gridley, G.; Jarvholm, B.; Fraumeni, J.J. Relation of body mass index to cancer risk in 362,552 Swedish men. Cancer Causes Control 2006, 17, 901–909. [Google Scholar] [CrossRef] [PubMed]
- Samanic, C.; Gridley, G.; Chow, W.H.; Lubin, J.; Hoover, R.N.; Fraumeni, J.J. Obesity and cancer risk among white and black United States veterans. Cancer Causes Control 2004, 15, 35–43. [Google Scholar] [CrossRef] [PubMed]
- Song, Y.M.; Sung, J.; Ha, M. Obesity and risk of cancer in postmenopausal Korean women. J. Clin. Oncol. 2008, 26, 3395–3402. [Google Scholar] [CrossRef] [PubMed]
- Grainge, M.J.; West, J.; Solaymani-Dodaran, M.; Aithal, G.P.; Card, T.R. The antecedents of biliary cancer: A primary care case-control study in the United Kingdom. Br. J. Cancer 2009, 100, 178–180. [Google Scholar] [CrossRef] [PubMed]
- Hsing, A.W.; Sakoda, L.C.; Rashid, A.; Chen, J.; Shen, M.C.; Han, T.Q.; Wang, B.S.; Gao, Y.T. Body size and the risk of biliary tract cancer: A population-based study in China. Br. J. Cancer 2008, 99, 811–815. [Google Scholar] [CrossRef] [PubMed]
- Machova, L.; Cizek, L.; Horakova, D.; Koutna, J.; Lorenc, J.; Janoutova, G.; Janout, V. Association between obesity and cancer incidence in the population of the District Sumperk, Czech Republic. Onkologie 2007, 30, 538–542. [Google Scholar] [CrossRef] [PubMed]
- Nakadaira, H.; Lang, I.; Szentirmay, Z.; Hitre, E.; Kaster, M.; Yamamoto, M. A case-control study of gallbladder cancer in Hungary. Asian Pac. J. Cancer Prev. 2009, 10, 833–836. [Google Scholar] [PubMed]
- Serra, I.; Yamamoto, M.; Calvo, A.; Cavada, G.; Baez, S.; Endoh, K.; Watanabe, H.; Tajima, K. Association of chili pepper consumption, low socioeconomic status and longstanding gallstones with gallbladder cancer in a Chilean population. Int. J. Cancer 2002, 102, 407–411. [Google Scholar] [CrossRef] [PubMed]
- Zatonski, W.A.; Lowenfels, A.B.; Boyle, P.; Maisonneuve, P.; Bueno, D.M.H.; Ghadirian, P.; Jain, M.; Przewozniak, K.; Baghurst, P.; Moerman, C.J.; et al. Epidemiologic aspects of gallbladder cancer: A case-control study of the SEARCH Program of the International Agency for Research on Cancer. J. Natl. Cancer Inst. 1997, 89, 1132–1138. [Google Scholar] [CrossRef] [PubMed]
- Hursting, S.D.; Hursting, M.J. Growth signals, inflammation, and vascular perturbations: Mechanistic links between obesity, metabolic syndrome, and cancer. Arterioscler. Thromb. Vasc. Biol. 2012, 32, 1766–1770. [Google Scholar] [CrossRef] [PubMed]
- Dali-Youcef, N.; Mecili, M.; Ricci, R.; Andres, E. Metabolic inflammation: Connecting obesity and insulin resistance. Ann. Med. 2013, 45, 242–253. [Google Scholar] [CrossRef] [PubMed]
- Shebl, F.M.; Andreotti, G.; Meyer, T.E.; Gao, Y.T.; Rashid, A.; Yu, K.; Shen, M.C.; Wang, B.S.; Han, T.Q.; Zhang, B.H.; et al. Metabolic syndrome and insulin resistance in relation to biliary tract cancer and stone risks: A population-based study in Shanghai, China. Br. J. Cancer 2011, 105, 1424–1429. [Google Scholar] [CrossRef] [PubMed]
- Randi, G.; Franceschi, S.; La Vecchia, C. Gallbladder cancer worldwide: Geographical distribution and risk factors. Int. J. Cancer 2006, 118, 1591–1602. [Google Scholar] [CrossRef] [PubMed]
- Cirillo, D.J.; Wallace, R.B.; Rodabough, R.J.; Greenland, P.; LaCroix, A.Z.; Limacher, M.C.; Larson, J.C. Effect of estrogen therapy on gallbladder disease. JAMA 2005, 293, 330–339. [Google Scholar] [CrossRef] [PubMed]
- Gabbi, C.; Kim, H.J.; Barros, R.; Korach-Andre, M.; Warner, M.; Gustafsson, J.A. Estrogen-dependent gallbladder carcinogenesis in LXRbeta-/- female mice. Proc. Natl. Acad. Sci. USA 2010, 107, 14763–14768. [Google Scholar] [CrossRef] [PubMed]
- Stinton, L.M.; Shaffer, E.A. Epidemiology of gallbladder disease: Cholelithiasis and cancer. Gut Liver 2012, 6, 172–187. [Google Scholar] [CrossRef] [PubMed]
- Ren, H.B.; Yu, T.; Liu, C.; Li, Y.Q. Diabetes mellitus and increased risk of biliary tract cancer: Systematic review and meta-analysis. Cancer Causes Control 2011, 22, 837–847. [Google Scholar] [CrossRef] [PubMed]
© 2015 by the authors; licensee MDPI, Basel, Switzerland. This article is an open access article distributed under the terms and conditions of the Creative Commons Attribution license (http://creativecommons.org/licenses/by/4.0/).
Share and Cite
Tan, W.; Gao, M.; Liu, N.; Zhang, G.; Xu, T.; Cui, W. Body Mass Index and Risk of Gallbladder Cancer: Systematic Review and Meta-Analysis of Observational Studies. Nutrients 2015, 7, 8321-8334. https://doi.org/10.3390/nu7105387
Tan W, Gao M, Liu N, Zhang G, Xu T, Cui W. Body Mass Index and Risk of Gallbladder Cancer: Systematic Review and Meta-Analysis of Observational Studies. Nutrients. 2015; 7(10):8321-8334. https://doi.org/10.3390/nu7105387
Chicago/Turabian StyleTan, Wenbin, Min Gao, Ning Liu, Guoan Zhang, Tong Xu, and Wen Cui. 2015. "Body Mass Index and Risk of Gallbladder Cancer: Systematic Review and Meta-Analysis of Observational Studies" Nutrients 7, no. 10: 8321-8334. https://doi.org/10.3390/nu7105387