Comparison of a Full Food-Frequency Questionnaire with the Three-Day Unweighted Food Records in Young Polish Adult Women: Implications for Dietary Assessment

 ,
, 
Abstract
:1. Introduction
2. Experimental Section
2.1. Participants

| Category | Sample size (n) | Percentage of women (%) |
|---|---|---|
| Age | – | 22.2 ± 0.8 # (21–26) |
| Place of residence | ||
| Village | 23 | 27 |
| town (<50,000 inhabitants) | 22 | 26 |
| small city (50,000–100,000 inhabitants) | 21 | 25 |
| large city (>100,000 inhabitants) | 18 | 21 |
| Self-assessment of economic situation | ||
| below average | 1 | 1 |
| Average | 79 | 94 |
| above average | 4 | 5 |
| Self-assessment of lifestyle | ||
| active | 0 | 0 |
| quite active | 10 | 12 |
| little active | 30 | 36 |
| a sedentary lifestyle | 44 | 52 |
| Self-assessment of health status | ||
| very good | 11 | 13 |
| Good | 66 | 79 |
| quite good | 6 | 7 |
| Poor | 1 | 1 |
| Suffering from chronic diseases | 5 | 6 |
| Time spent in front of TV | ||
| ≥1 h/day | 8 | 10 |
| 2–3 h/day | 34 | 40 |
| ≤0 h/day | 42 | 50 |
| Self-declared to be following a diet | ||
| no diet | 58 | 69 |
| yes, taking care of a slim figure (not overeating) | 19 | 23 |
| yes, low-energy diet | 2 | 2 |
| yes, low-fat diet | 1 | 1 |
| yes, other diet | 4 | 5 |
| Self-declared change in dietary habits during a year (yes) | 72 | 86 |
| Number of meals eaten per day | ||
| 2 | 2 | 2 |
| 3 | 33 | 39 |
| 4 | 36 | 43 |
| 5 | 13 | 15 |
2.2. Dietary Assessment Methods
- –
- place of residence: (i) village; (ii) town (<50,000 inhabitants); (iii) small city (50,000–100,000 inhabitants); (iv) large city (>100,000 inhabitants);
- –
- self-assessment of the economic situation: (i) below average; (ii) average; (iii) above average;
- –
- self-assessment of the lifestyle: (i) active (intensive physical activity every day); (ii) quite active (intensive physical activity 2–3 times per week); (iii) little active (intensive physical activity once a week); (iv) a sedentary lifestyle (no intensive physical activity);
- –
- self-assessment of the health status: (i) very good; (ii) good; (iii) quite good; (iv) poor;
- –
- suffering from chronic diseases: yes, no;
- –
- time spent in front of TV: (i) ≥4 h/day; (ii) 2–3 h/day; (iii) ≤1 h/day;
- –
- self-declared to be following a diet: (i) no diet; (ii) yes; taking care of a slim figure (not overeating); (iii) low-energy diet; (iv) low-fat diet; (v) other diet (e.g., diabetes, easily digestible, vegetarian);
- –
- self-declared change in dietary habits during a last year: yes, no;
- –
- number of meals eaten per day–the respondents could freely indicate the number of meals usually eaten per day.
2.3. Adjustment of the Intake of Energy and Nutrients Obtained from FFQ
- –
- FFQ-adjusted—mean daily intake of energy and nutrients obtained after modification of FFQ-crude using a beta-coefficient equalling 0.5915 (authors’ suggestion), which was calculated as the FR-crude/FFQ-crude ratio of mean daily energy intake. This is a simple way of adjusting the energy and nutrient intake at the group level as proposed by the authors for a quick and effective approximation of the results obtained from the FFQ-crude to the results from the unweighted food record (FR-crude).
- –
- FFQ-regressive—mean daily intake of energy and nutrients obtained after modification of FFQ-crude using regression analysis [26]; separate regression equations were determined for energy and each nutrient.
2.4. Nutritional Assessment According to Dietary Recommendation
2.5. Statistical Analysis
3. Results
3.1. Food Records (FR-Crude) vs. Food Frequency Questionnaire (FFQ-Crude)
| Nutrient (unit) | FR-crude | FFQ-crude | P value | FFQ-adjusted | P value | FFQ-regressive | P value | FR-standardized | FFQ-standardized | P value |
|---|---|---|---|---|---|---|---|---|---|---|
| Energy (kcal) | 1621.0 | 2740.5 | <0.001 | 1621.0 | 0.792 | 1621.0 (1546.6, 1695.3) | 0.181 | 2000.0 | 2000.0 | - |
| (1488.9, 1753.0) | (2501.9, 2979.1) | (1479.8, 1762.1) | ||||||||
| Total protein (g) | 59.3 | 94.0 | <0.001 | 55.6 | 0.030 | 59.3 | 0.242 | 76.0 | 69.7 | <0.001 |
| (55.3, 63.4) | (86.1, 102.0) | (50.9, 60.3) | (57.5, 61.1) | (73.0, 79.0) | (67.2, 72.1) | |||||
| Animal protein (g) | 38.5 | 60.1 | <0.001 | 35.5 | 0.024 | 38.5 | 0.179 | 49.5 | 44.6 | <0.001 |
| (46.7, 52.4) | (42.1, 47.1) | |||||||||
| (35.6, 41.5) | (54.3, 65.8) | (32.1, 38.9) | (37.2, 39.8) | |||||||
| Vegetable protein (g) | 20.7 | 34.0 | <0.001 | 20.1 | 0.256 | 20.7 | 0.145 | 26.3 | 25.1 | 0.117 |
| (19.1, 22.3) | (31.0, 36.9) | (18.3, 21.8) | (20.1, 21.3) | (25.1, 27.6) | (24.2, 25.9) | |||||
| Fat (g) | 61.5 | 110.2 | <0.001 | 65.2 | 0.157 | 61.5 | 0.070 | 73.0 | 79.2 | 0.001 |
| (54.8, 68.3) | (98.6, 121.7) | (58.3, 72.0) | (57.6, 65.4) | (69.7, 76.3) | (76.4, 82.0) | |||||
| SFA (g) | 23.0 | 41.0 | <0.001 | 24.2 | 0.265 | 23.0 | 0.086 | 27.4 | 29.4 | 0.013 |
| (20.4, 25.5) | (36.5, 45.4) | (21.6, 26.9) | (21.4, 24.5) | (26.1, 28.7) | (28.0, 30.8) | |||||
| MUFA (g) | 24.6 | 44.5 | <0.001 | 26.3 | 0.086 | 24.6 | 0.042 | 29.0 | 32.0 | 0.001 |
| (21.7, 27.5) | (39.7, 49.4) | (23.5, 29.2) | (23.1, 26.2) | (27.3, 30.8) | (30.7, 33.4) | |||||
| PUFA (g) | 8.9 | 17.3 | <0.001 | 10.3 | 0.002 | 8.9 | 0.026 | 10.5 | 12.5 | <0.001 |
| (7.7, 10.0) | (15.4, 19.2) | (9.1, 11.4) | (8.3, 9.4) | (9.7, 11.4) | (11.9, 13.1) | |||||
| Cholesterol (mg) | 294 | 310 | 0.117 | 183 | <0.001 | 294 | 0.018 | 354 | 227 | <0.001 |
| (324, 384) | (214, 239) | |||||||||
| (258, 330) | (278, 341) | (165, 202) | (284, 304) | |||||||
| Carbohydrates (g) | 220.0 | 364.0 | <0.001 | 215.3 | 0.258 | 220.0 | 0.189 | 275.7 | 266.5 | 0.046 |
| (203.3, 236.7) | (332.0, 396.0) | (196.5, 234.2) | (211.4, 228.6) | (269.1, 282.3) | (259.5, 273.5) | |||||
| Fibre (g) | 15.9 | 30.2 | <0.001 | 17.9 | 0.045 | 15.9 | 0.106 | 20.0 | 22.1 | <0.001 |
| (14.4, 17.4) | (27.2, 33.2) | (16.1, 19.6) | (15.2, 16.5) | (18.9, 21.1) | (21.0, 23.3) | |||||
| Water (g) | 1237 | 2180 | <0.001 | 1290 | 0.971 | 1237 | 0.237 | 1640 | 1654 | 0.754 |
| (1160, 1315) | (1997, 2364) | (1181, 1398) | (1208, 1267) | (1525, 1756) | (1537, 1772) | |||||
| Sodium (mg) | 1973 | 2510 | <0.001 | 1485 | <0.001 | 1973 | 0.124 | 2589 | 1851 | <0.001 |
| (1820, 2127) | (2281, 2739) | (1349, 1620) | (1953, 1993) | (2396, 2783) | (1782, 1921) | |||||
| Potassium (mg) | 2534 | 4496 | <0.001 | 2660 | 0.586 | 2534 | 0.175 | 3226 | 3318 | 0.181 |
| (2332, 2736) | (4094, 4899) | (2422, 2897) | (2433, 2635) | (3058, 3394) | (3168, 3468) | |||||
| Calcium (mg) | 601 | 1065 | <0.001 | 630 | 0.786 | 601 | 0.128 | 769 | 800 | 0.524 |
| (537, 664) | (945, 1185) | (559, 701) | (568, 633) | (708, 829) | (724, 875) | |||||
| Phosphorus (mg) | 999 | 1663 | <0.001 | 983 | 0.366 | 999 | 0.207 | 1275 | 1236 | 0.149 |
| (922, 1076) | (1519, 1806) | (899, 1068) | (962, 1036) | (1214, 1336) | (1180, 1292) | |||||
| Magnesium (mg) | 230 | 401 | <0.001 | 237 | 0.775 | 230 | 0.159 | 294 | 297 | 0.336 |
| (211, 248) | (366, 436) | (216, 258) | (222, 237) | (277, 311) | (284, 310) | |||||
| Iron (mg) | 8.7 | 14.5 | <0.001 | 8.6 | 0.514 | 8.7 | 0.134 | 11.0 | 10.7 | 0.449 |
| (8.0, 9.4) | (13.2, 15.7) | (7.8, 9.3) | (8.4, 8.9) | (10.4, 11.6) | (10.3, 11.1) | |||||
| Zinc (mg) | 7.7 | 12.6 | <0.001 | 7.5 | 0.240 | 7.7 | 0.176 | 9.8 | 9.3 | 0.051 |
| (7.1, 8.2) | (11.5, 13.7) | (6.8, 8.1) | (7.5, 7.9) | (9.4, 10.2) | (9.0, 9.7) | |||||
| Copper (mg) | 0.96 | 1.58 | <0.001 | 0.93 | 0.378 | 0.96 | 0.131 | 1.21 | 1.16 | 0.209 |
| (0.87, 1.04) | (1.43, 1.72) | (0.85, 1.02) | (0.92, 0.99) | (1.14, 1.28) | (1.11, 1.21) | |||||
| Vitamin A (μg) | 1069 | 1968 | <0.001 | 1164 | 0.019 | 1069 | 0.001 | 1314 | 1434 | 0.003 |
| (853, 1285) | (1729, 2206) | (1023, 1305) | (1023, 1115) | (1047, 1582) | (1304, 1564) | |||||
| Retinol (μg) | 457 | 802 | <0.001 | 474 | 0.241 | 457 | <0.001 | 576 | 574 | 0.138 |
| (279, 636) | (652, 951) | (386, 563) | (457, 458) | (331, 820) | (486, 662) | |||||
| β-carotene (μg) | 3214 | 6989 | <0.001 | 4134 | <0.001 | 3214 | <0.001 | 3921 | 5154 | <0.001 |
| (2544, 3883) | (5978, 7999) | (3536, 4731) | (2925, 3502) | (3197, 4645) | (4510, 5797) | |||||
| Vitamin D (μg) | 0.96 | 3.07 | <0.001 | 1.82 | <0.001 | 0.96 | <0.001 | 1.35 | 2.18 | <0.001 |
| (0.64, 1.28) | (2.63, 3.51) | (1.56, 2.08) | (0.96, 0.96) | (0.89, 1.81) | (1.99, 2.38) | |||||
| Vitamin E (mg) | 7.8 | 15.8 | <0.001 | 9.3 | <0.001 | 7.8 | 0.029 | 9.2 | 11.5 | <0.001 |
| (6.8, 8.8) | (14.3, 17.3) | (8.4, 10.3) | (7.2, 8.3) | (8.5, 10.0) | (11.1, 11.9) | |||||
| Vitamin B1 (mg) | 1.02 | 1.61 | <0.001 | 0.95 | 0.182 | 1.02 | 0.103 | 1.28 | 1.18 | 0.036 |
| (0.93, 1.11) | (1.47, 1.75) | (0.87, 1.04) | (0.99, 1.05) | (1.21, 1.35) | (1.15, 1.22) | |||||
| Vitamin B2 (mg) | 1.30 | 2.17 | <0.001 | 1.28 | 0.218 | 1.30 | 0.226 | 1.69 | 1.62 | 0.092 |
| (1.20, 1.40) | (1.97, 2.37) | (1.17, 1.40) | (1.26, 1.35) | (1.59, 1.79) | (1.52, 1.72) | |||||
| Niacin (mg) | 12.1 | 19.5 | <0.001 | 11.5 | 0.424 | 12.1 | 0.093 | 15.6 | 14.4 | 0.428 |
| (11.1, 13.2) | (17.8, 21.2) | (10.5, 12.5) | (11.8, 12.5) | (14.4, 16.8) | (13.9, 15.0) | |||||
| Vitamin B6 (mg) | 1.44 | 2.55 | <0.001 | 1.51 | 0.570 | 1.44 | 0·133 | 1.82 | 1.86 | 0.184 |
| (1.33, 1.56) | (2.32, 2.78) | (1.37, 1.64) | (1.39, 1.49) | (1.73, 1.92) | (1.8, 1.93) | |||||
| Folic acid (μg) | 77 | 378 | <0.001 | 224 | <0.001 | 77 | 0.001 | 116 | 281 | <0.001 |
| (64, 90) | (346, 411) | (205, 243) | (74, 80) | (92, 140) | (268, 294) | |||||
| Vitamin B12 (μg) | 1.03 | 5.72 | <0.001 | 3.38 | <0.001 | 1.03 | <0.001 | 1.67 | 4.18 | <0.001 |
| (0.78, 1.28) | (5.01, 6.42) | (2.97, 3.79) | (1.00, 1.06) | (1.20, 2.14) | (3.83, 4.53) | |||||
| Vitamin C (mg) | 97.8 | 207.0 | <0.001 | 122.4 | <0.001 | 97.8 | 0.020 | 122.5 | 151.0 | <0.001 |
| (84.4, 111.3) | (182.8, 231.2) | (108.1, 136.8) | (91.2, 104.4) | (109.1, 136.0) | (138.2, 163.7) |
| Nutrient (unit) | FR-crude vs. FFQ-crude | FR-crude vs. FFQ-adjusted | FR-crude vs. FFQ-regressive | FR-standardized vs. FFQ-standardized | ||||||||||||
|---|---|---|---|---|---|---|---|---|---|---|---|---|---|---|---|---|
| FFQ/FR (%) | x ± SDdifference (LOA) | VC (%) | Bland-Altman Index (%) | FFQ/FR (%) | x ± SDdifference (LOA) | VC (%) | Bland-Altman Index (%) | FFQ/FR (%) | x ± SDdifference (LOA) | VC (%) | Bland-Altman Index (%) | FFQ/FR (%) | x ± SDdifference (LOA) | VC (%) | Bland-Altman Index (%) | |
| Energy (kcal) | 179 | 1119.6 ± 908.6 | 42 | 6 | 106 | 0.0 ± 589.4 | 36 | 5 | 110 | 0.0 ± 502.8 | 31 | 5 | 100 | 0.0 ± 0.0 | 0 | – |
| (−661.3, 2900.5) | (−1155.3, 1155.3) | (−985.5, 985.5) | (0.0, 0.0) | |||||||||||||
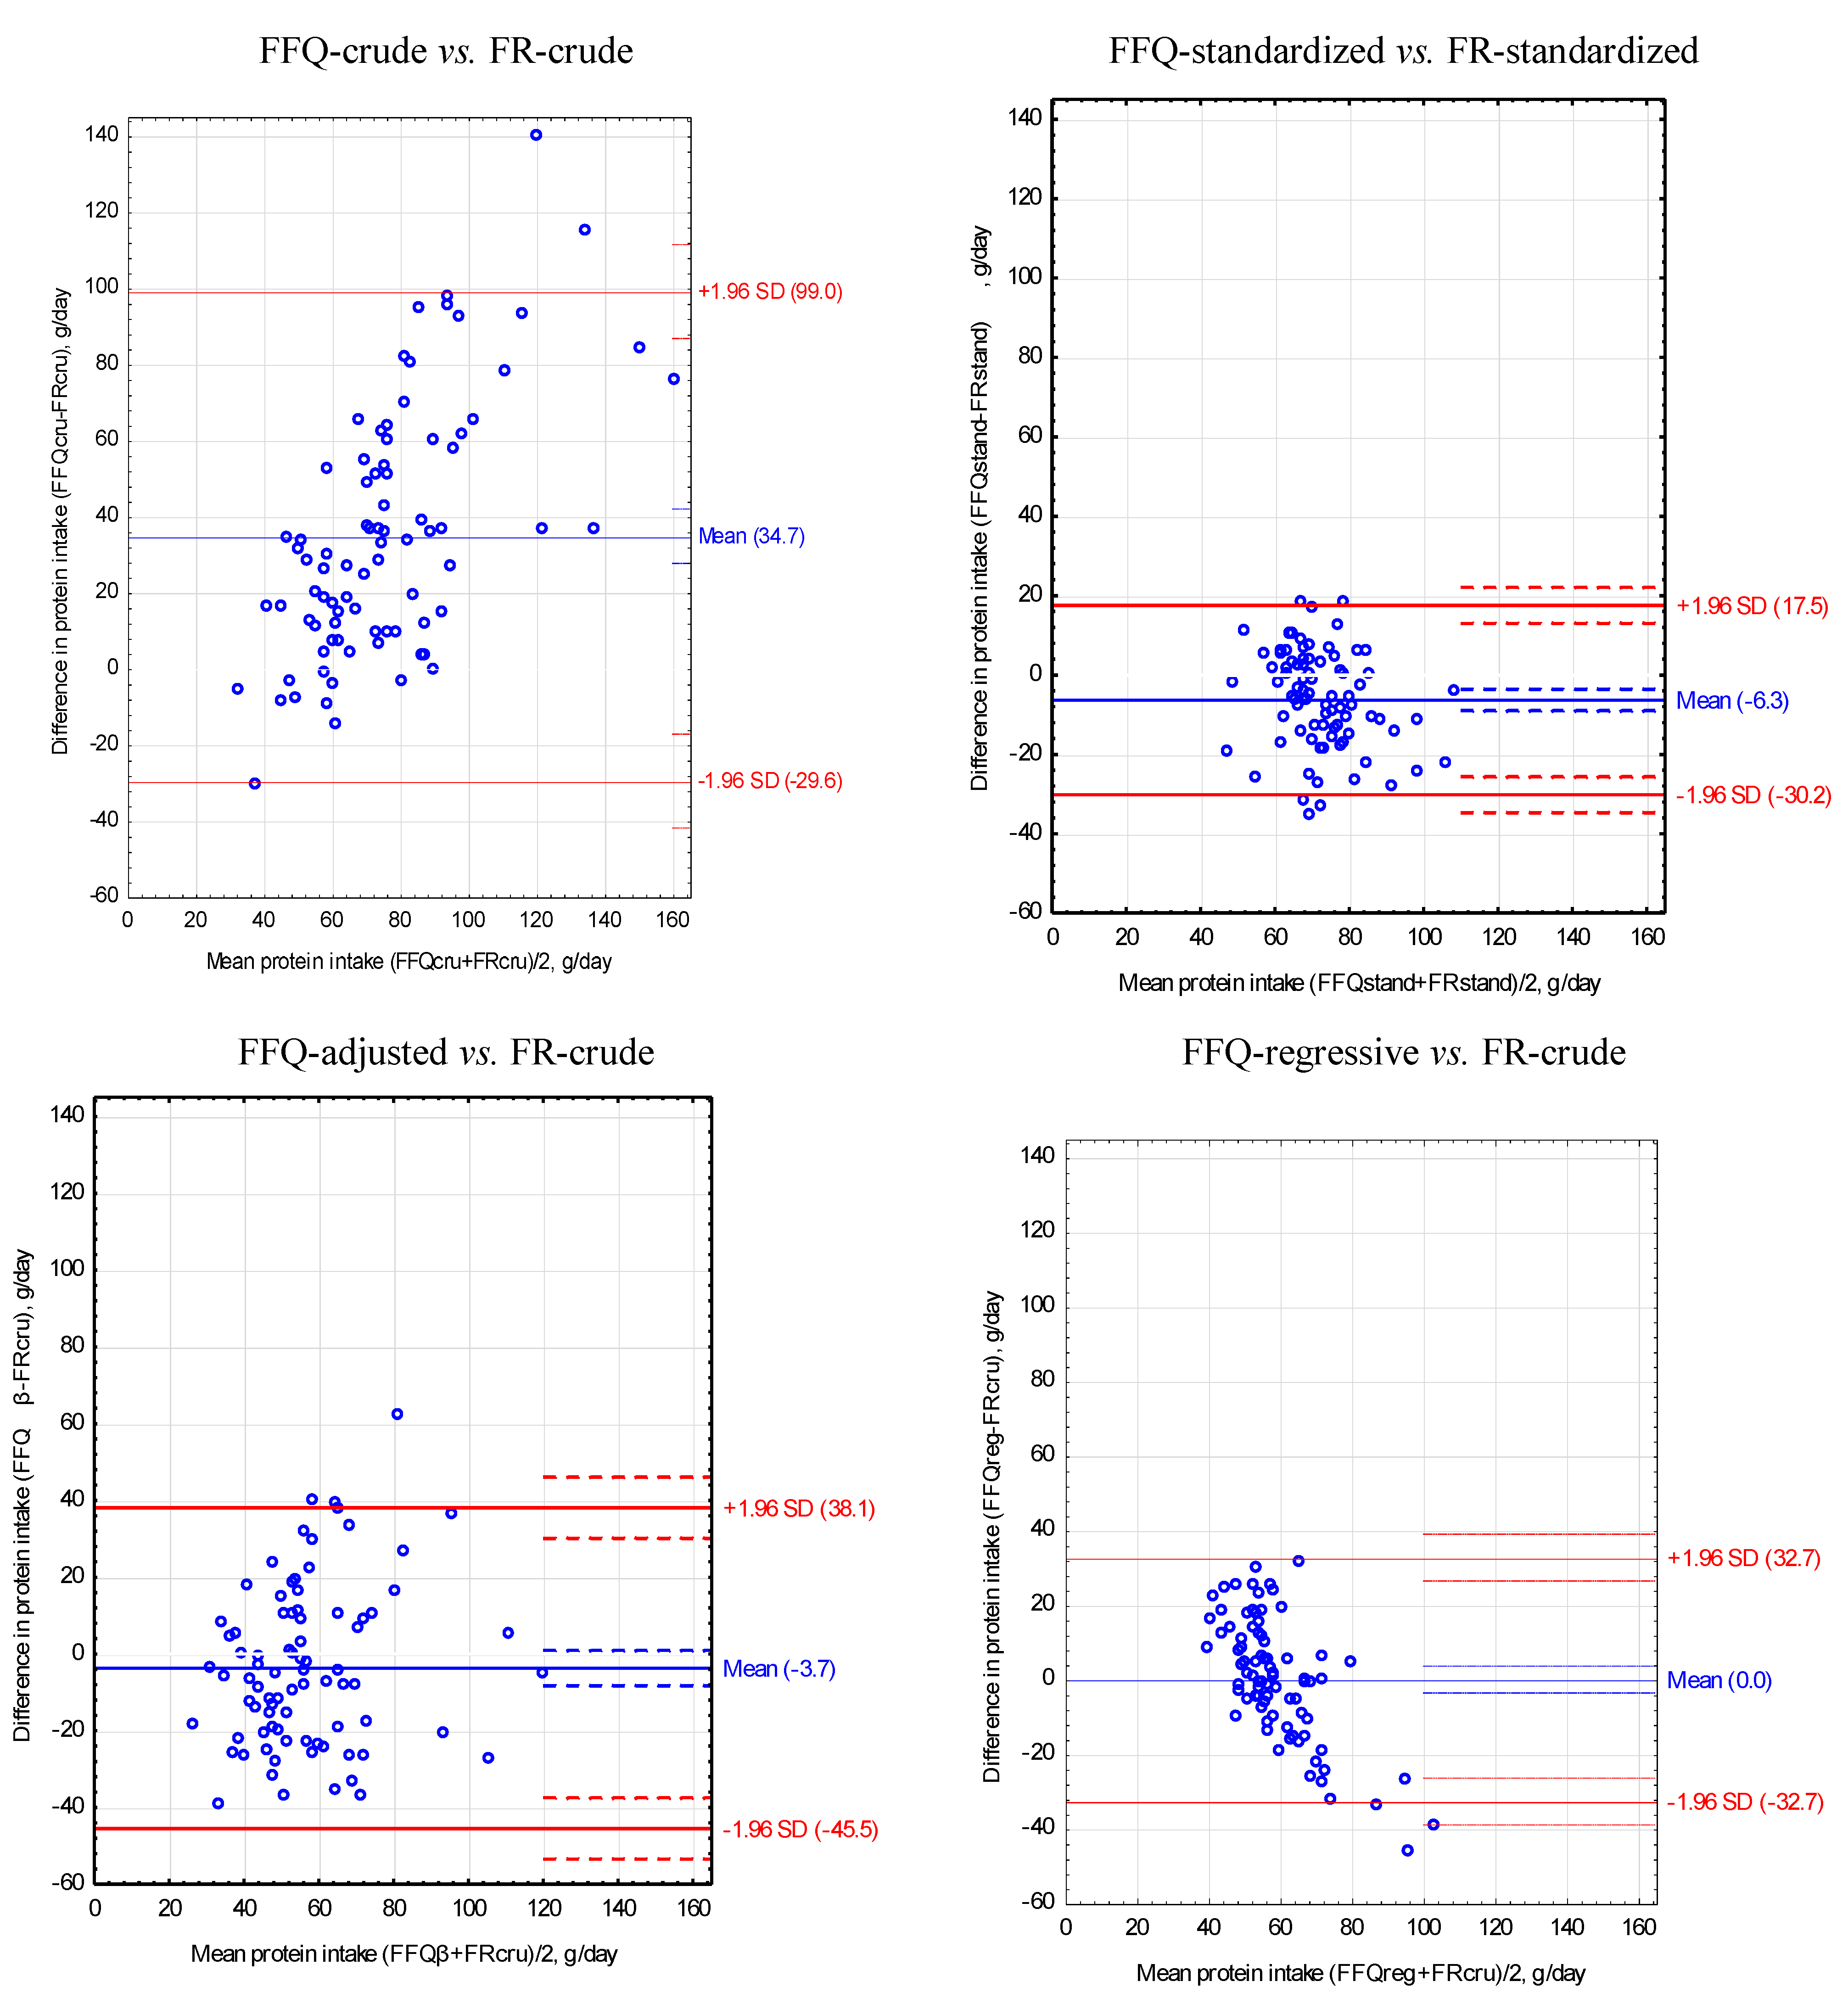
| Total protein (g) | 166 | 34.7 ± 32.8 | 43 | 4 | 98 | −3.7 ± 21.3 | 37 | 4 | 107 | 0.0 ± 16.7 | 28 | 4 | 93 | −6.3 ± 12.2 | 17 | 6 |
| (−29.6, 99.0) | (−45.5, 38.1) | (−32.7, 32.7) | (−30.2, 17.5) | |||||||||||||
| Animal protein (g) | 167 | 21.5 ± 23.6 | 48 | 6 | 99 | −3.0 ± 15.4 | 42 | 5 | 111 | 0.0 ± 12.1 | 31 | 5 | 94 | −4.9 ± 12.3 | 26 | 5 |
| (−24.8, 67.8) | (−33.2, 27.2) | (−23.7, 23.7) | (−29.0, 19.2) | |||||||||||||
| Vegetable protein (g) | 174 | 13.2 ± 12.8 | 47 | 6 | 103 | −0.6 ± 8.8 | 43 | 4 | 110 | 0.0 ± 7.0 | 34 | 5 | 99 | −1.3 ± 6.2 | 24 | 5 |
| (−11.9, 38.4) | (−17.8, 16.5) | (−13.8, 13.8) | (−13.5, 11.0) | |||||||||||||
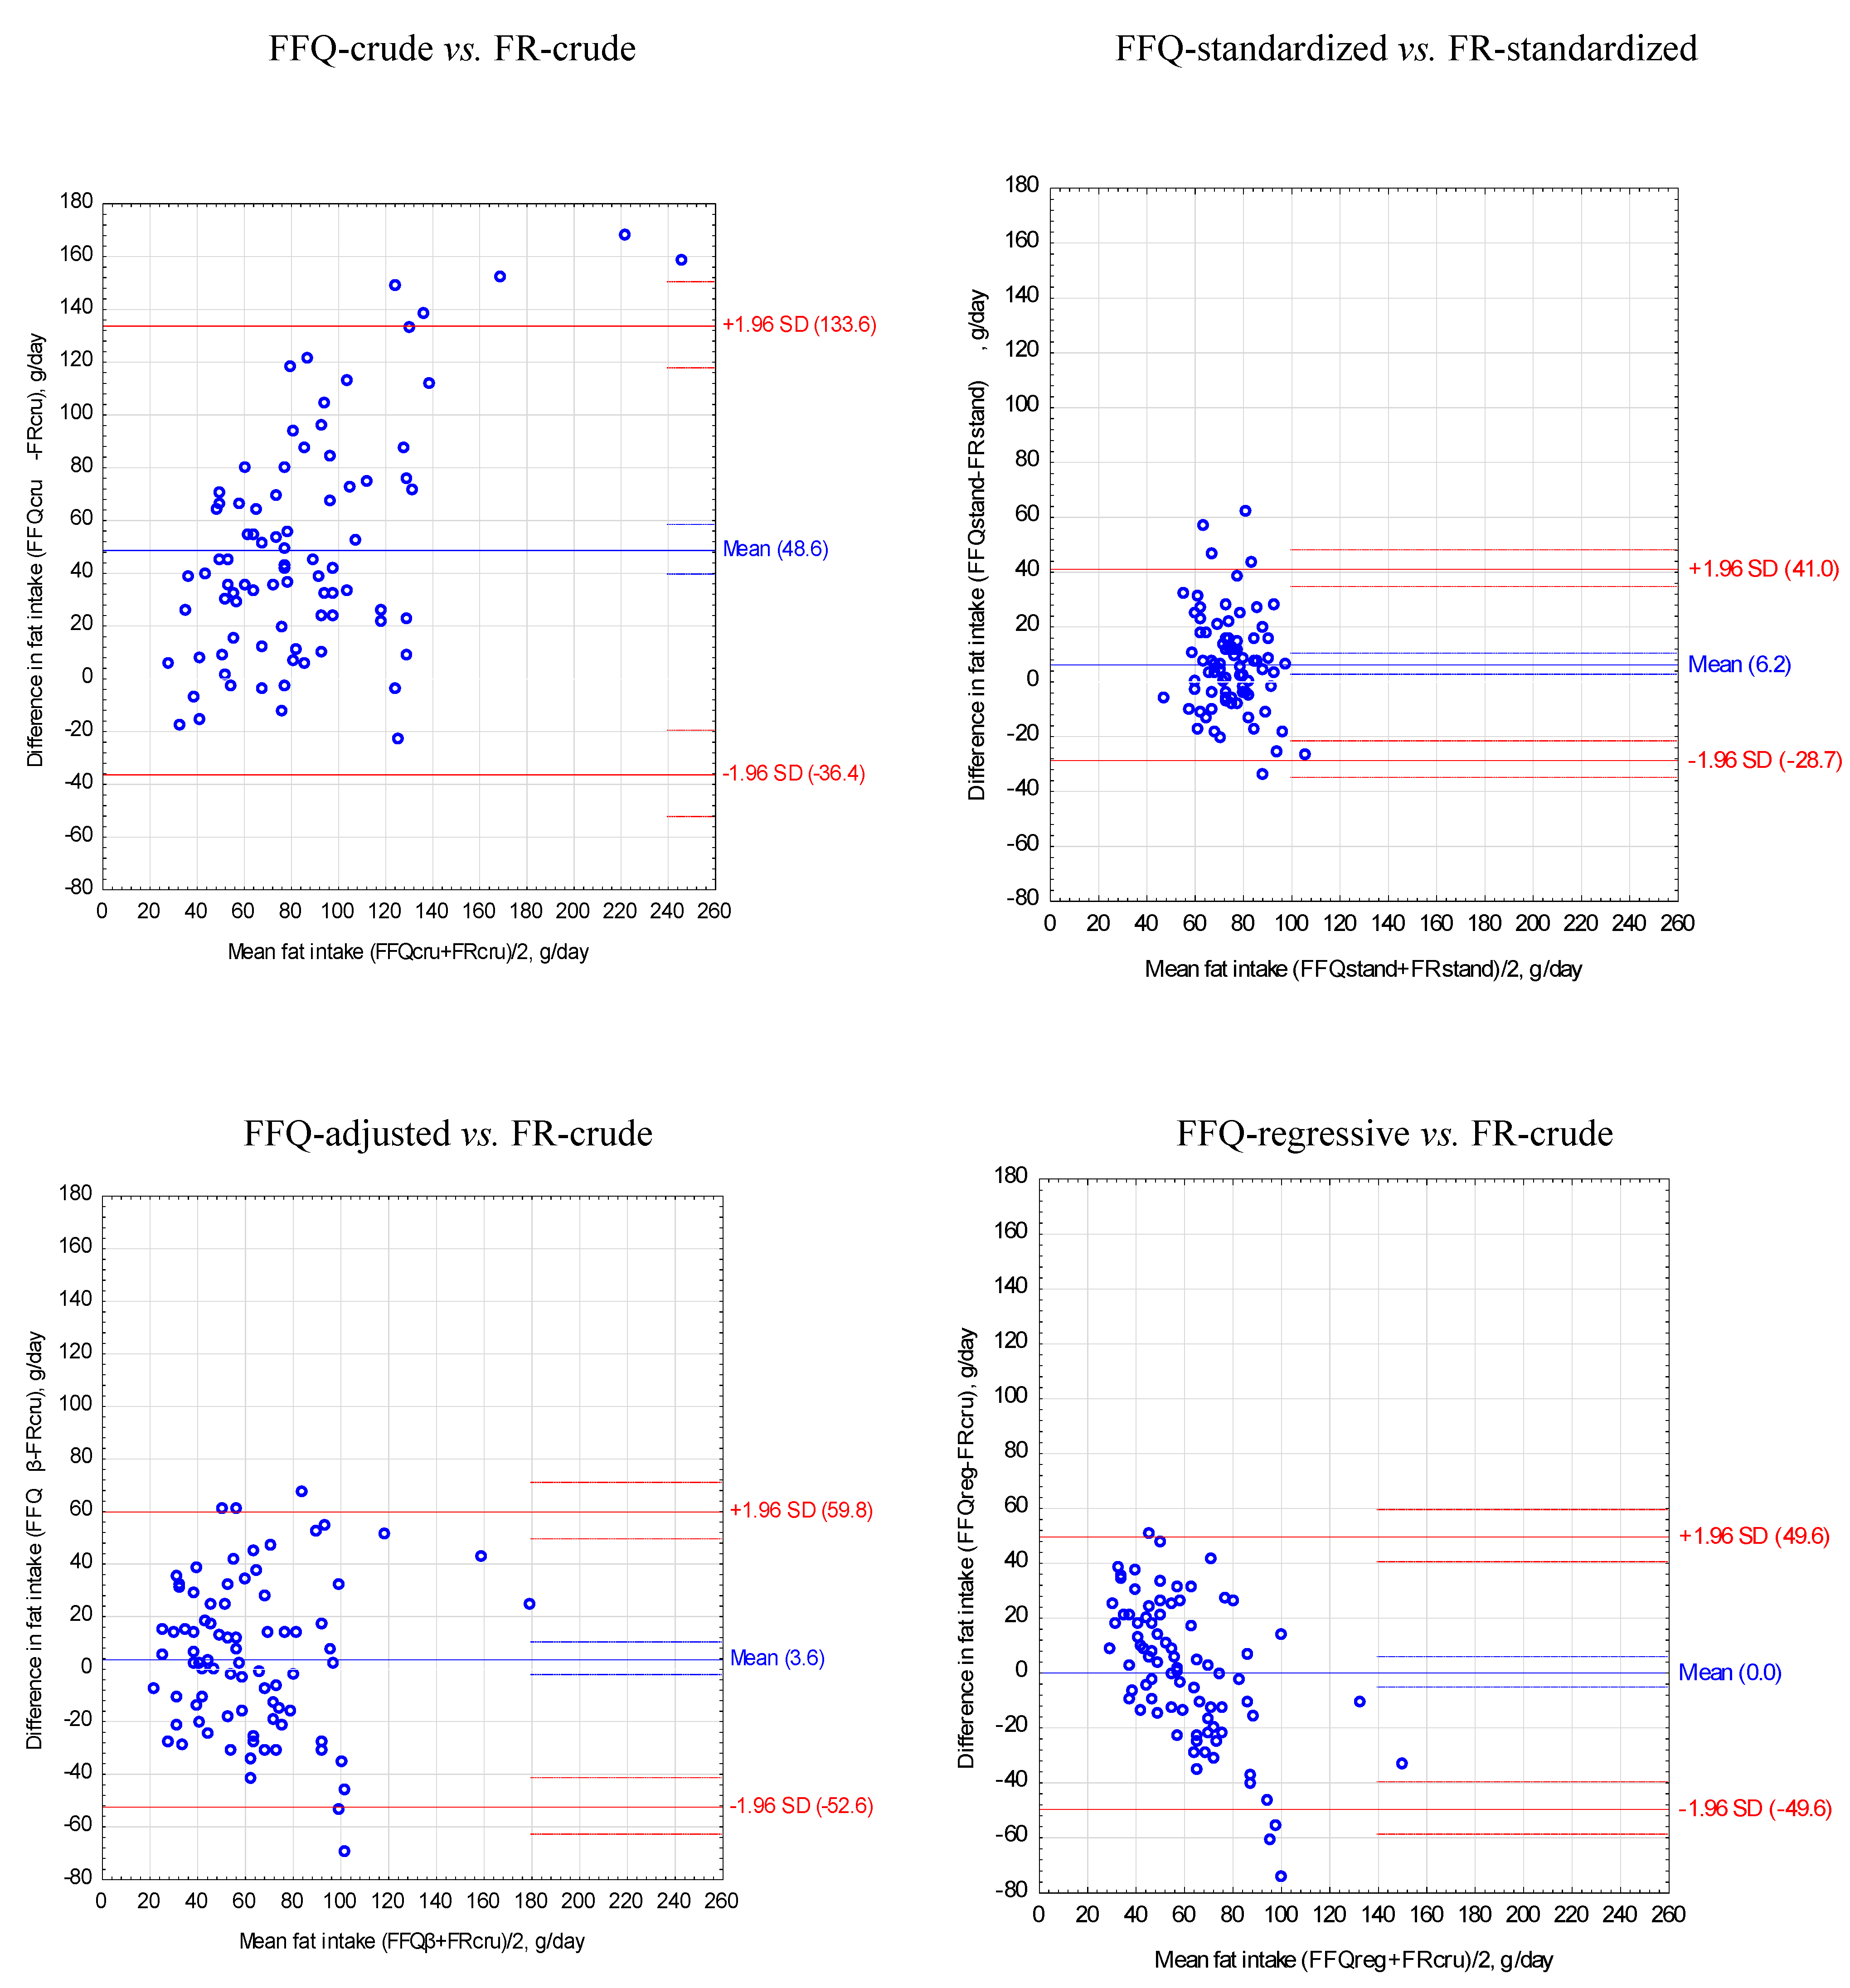
| Fat (g) | 209 | 48.6 ± 43.4 | 51 | 6 | 123 | 3.6 ± 28.7 | 45 | 6 | 122 | 0.0 ± 25.3 | 41 | 5 | 113 | 6.2 ± 17.8 | 23 | 6 |
| (−36.4, 133.6) | ||||||||||||||||
| (−52.6, 59.8) | (−49.6, 49.6) | (−28.7, 41.0) | ||||||||||||||
| SFA (g) | 205 | 18.0 ± 16.4 | 51 | 4 | 121 | 1.3 ± 10.6 | 45 | 4 | 121 | 0.0 ± 9.2 | 40 | 4 | 112 | 2.0 ± 7.1 | 25 | 4 |
| (−14.2, 50.2) | (−19.4, 22.0) | (−18.1, 18.1) | (−12.0, 16.0) | |||||||||||||
| MUFA (g) | 223 | 19.9 ± 18.9 | 55 | 6 | 132 | 1.7 ± 12.8 | 50 | 5 | 130 | 0.0 ± 11.3 | 46 | 4 | 119 | 3.0 ± 9.3 | 30 | 5 |
| (−17.2, 57.0) | (−23.5, 26.9) | (−22.2, 22.2) | (−15.2, 21.2) | |||||||||||||
| PUFA (g) | 243 | 8.5 ± 7.7 | 58 | 6 | 144 | 1.4 ± 5.2 | 55 | 6 | 131 | 0.0 ± 4.6 | 51 | 2 | 132 | 1.9 ± 4.2 | 36 | 5 |
| (−6.6, 23.5) | (−8.9, 11.7) | (−8.9, 8.9) | (−6.2, 10.1) | |||||||||||||
| Cholesterol (mg) | 143 | 16 ± 187 | 62 | 7 | 85 | −111 ± 165 | 69 | 6 | 141 | 0 ± 160 | 54 | 6 | 77 | −127 ± 158 | 54 | 8 |
| (−351, 383) | (−433, 212) | (−314, 314) | (−437, 183) | |||||||||||||
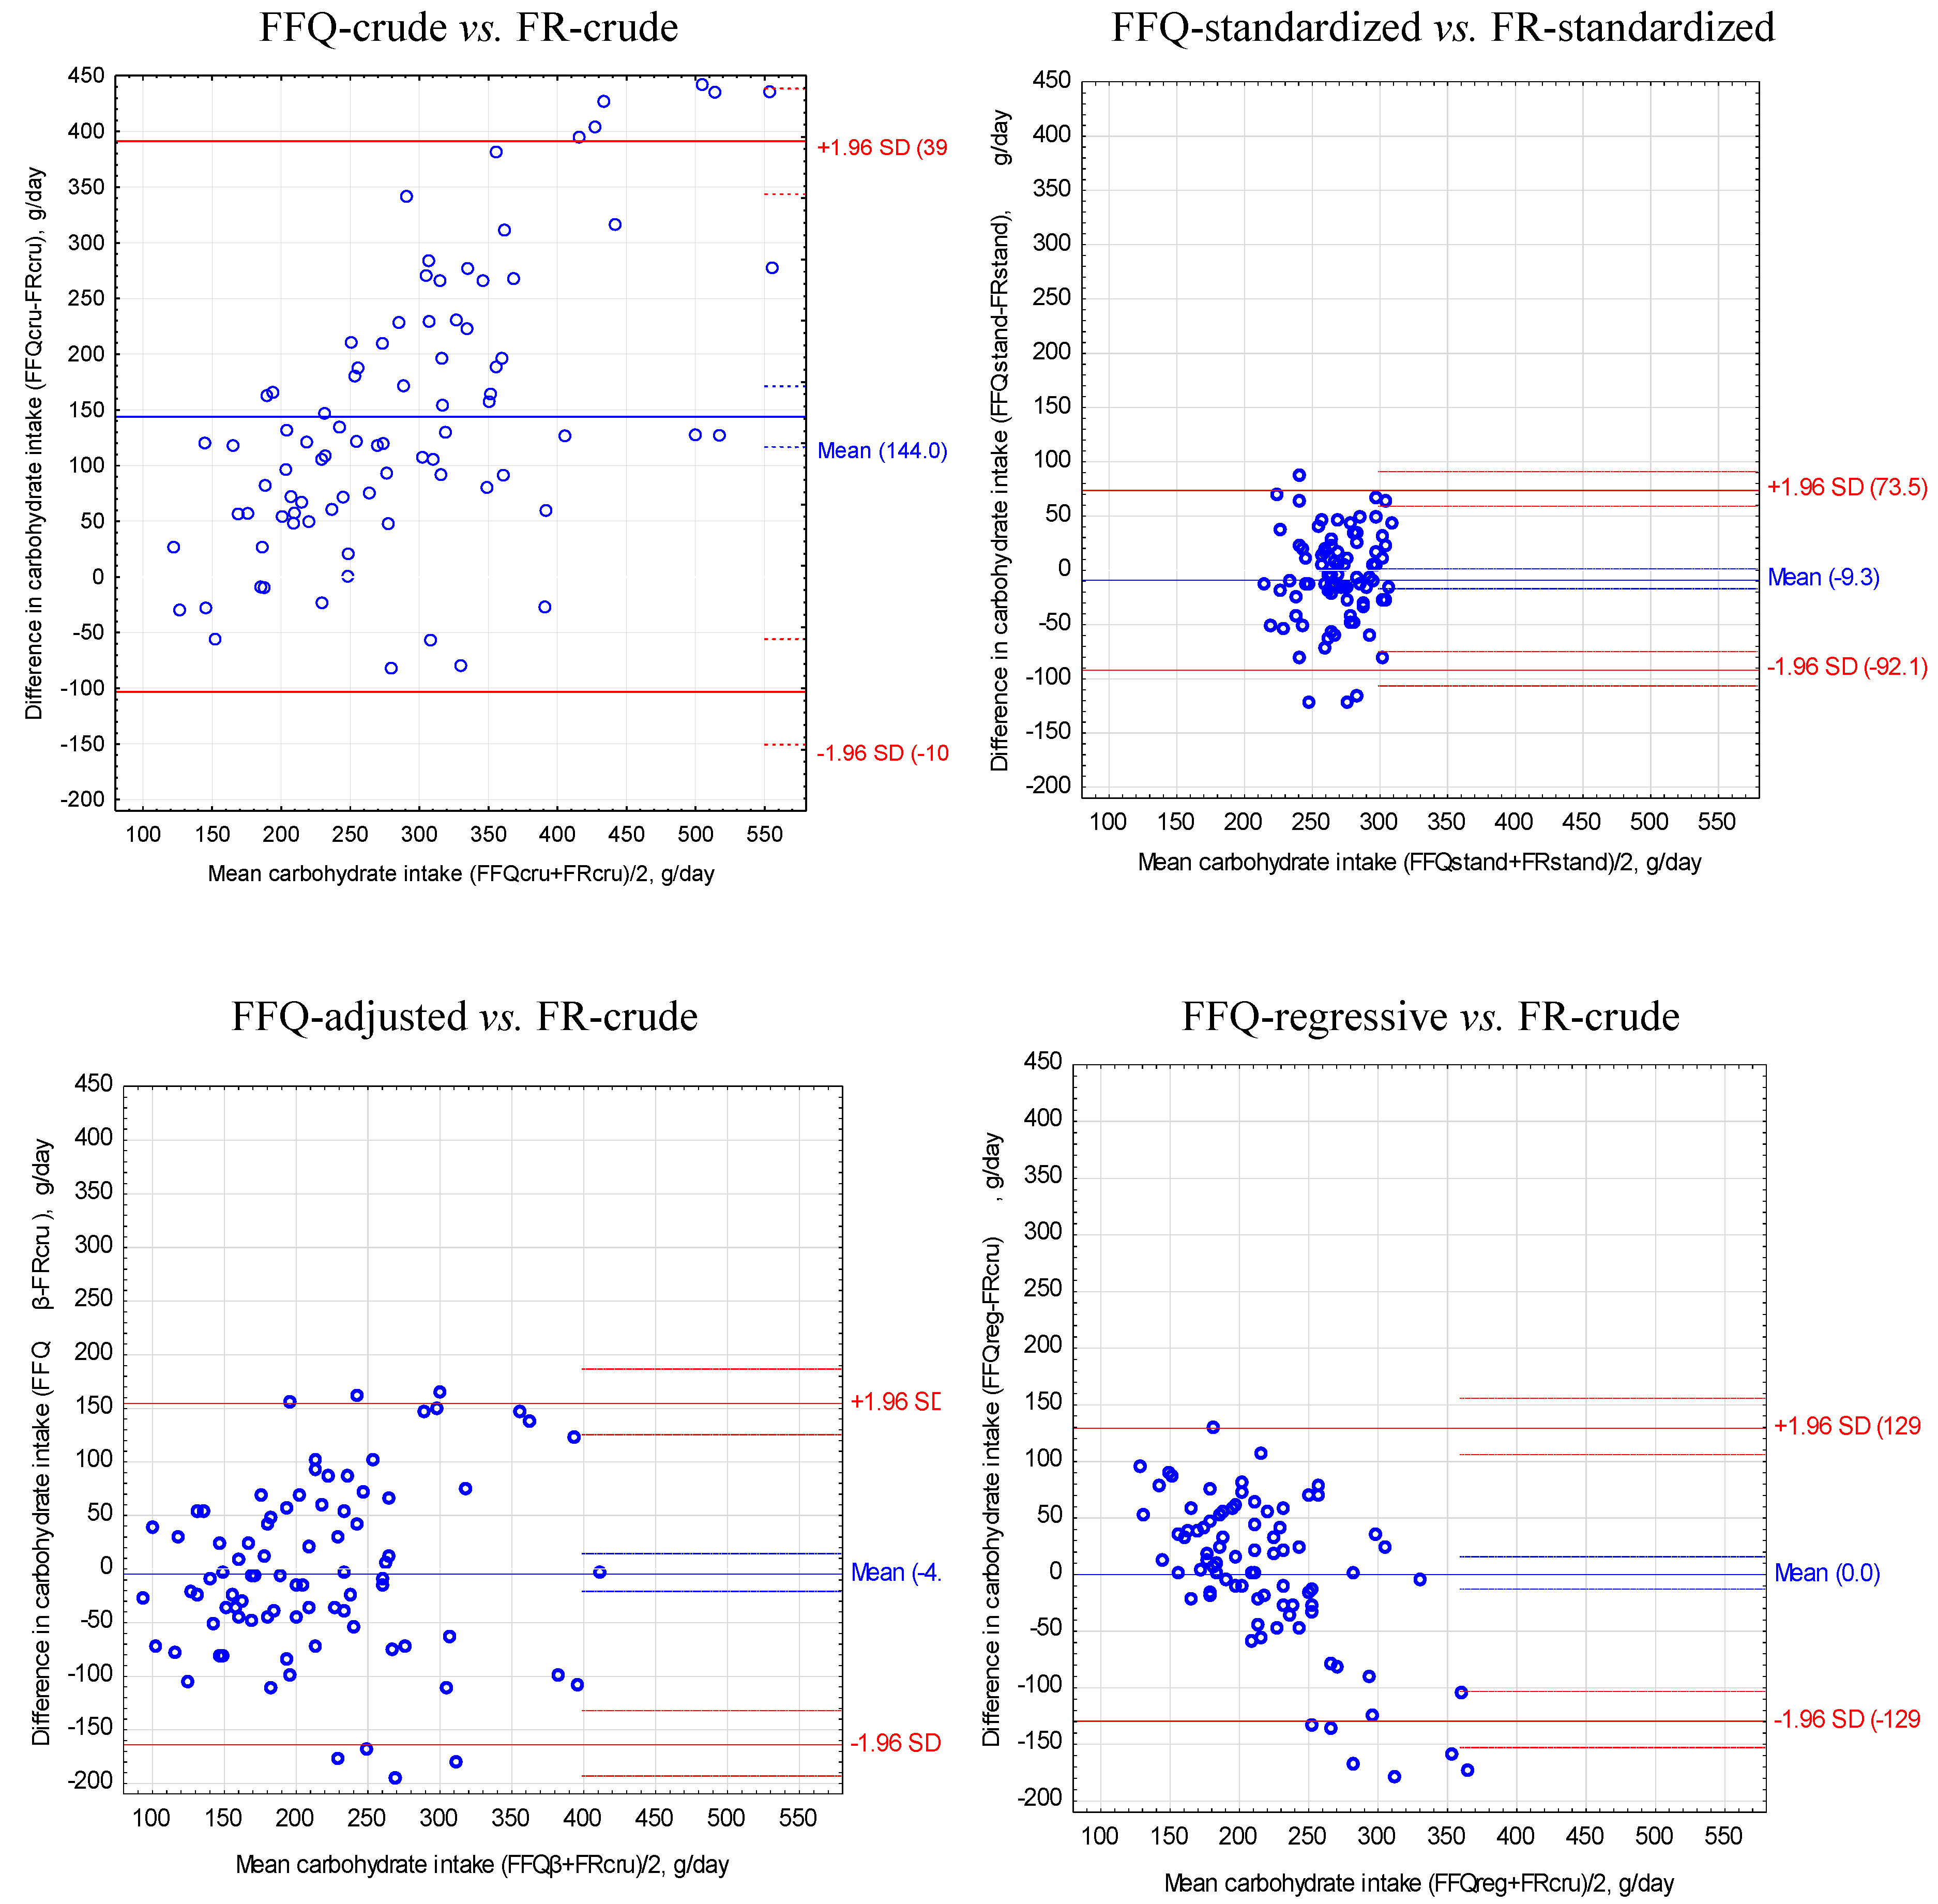
| Carbohydrates (g) | 173 | 144.0 ± 126.1 | 43 | 7 | 102 | −4.7 ± 81.3 | 37 | 7 | 109 | 0.0 ± 66.0 | 30 | 7 | 98 | −9.3 ± 42.2 | 16 | 5 |
| (−103.0, 391.1) | (−164.0, 154.6) | (−129.4, 129.4) | (−92.1, 73.5) | |||||||||||||
| Fibre (g) | 202 | 14.3 ± 12.3 | 53 | 5 | 119 | 2.0 ± 7.9 | 47 | 5 | 112 | 0.0 ± 6.1 | 38 | 6 | 114 | 2.1 ± 5.4 | 26 | 4 |
| (−9.7, 38.4) | (−13.5, 17.5) | (−12.0, 12.0) | (−8.4, 12.7) | |||||||||||||
| Water (g) | 184 | 943 ± 782 | 46 | 7 | 109 | 52 ± 489 | 39 | 7 | 108 | 0 ± 328 | 27 | 7 | 108 | 14 ± 665 | 40 | 5 |
| (−589, 2475) | (−907, 1012) | (−643, 643) | (−1289, 1317) | |||||||||||||
| Sodium (mg) | 140 | 537 ± 1192 | 53 | 6 | 83 | −489 ± 880 | 51 | 5 | 112 | 0 ± 701 | 36 | 4 | 79 | −738 ± 933 | 42 | 6 |
| (−1799, 2873) | (−2214, 1236) | (−1374, 1374) | (−2567, 1091) | |||||||||||||
| Potassium (mg) | 188 | 1962 ± 1606 | 46 | 5 | 111 | 125 ± 1024 | 39 | 2 | 110 | 0 ± 806 | 32 | 5 | 106 | 92 ± 750 | 23 | 5 |
| (−1186, 5110) | (−1882, 2133) | (−1580, 1580) | (−1378, 1562) | |||||||||||||
| Calcium (mg) | 196 | 464 ± 475 | 57 | 5 | 116 | 29 ± 307 | 50 | 5 | 115 | 0 ± 252 | 42 | 8 | 110 | 31 ± 323 | 41 | 5 |
| (−466, 1394) | (−574, 632) | (−493, 493) | (−603, 664) | |||||||||||||
| Phosphorus (mg) | 176 | 664 ± 582 | 44 | 5 | 104 | −16 ± 384 | 39 | 5 | 109 | 0 ± 314 | 31 | 4 | 99 | −39 ± 229 | 18 | 6 |
| (−478, 1805) | (−768, 737) | (−615, 615) | (−487, 409) | |||||||||||||
| Magnesium (mg) | 187 | 171 ± 148 | 47 | 6 | 110 | 8 ± 99 | 42 | 6 | 110 | 0 ± 79 | 34 | 5 | 105 | 3 ± 69 | 23 | 5 |
| (−118, 461) | (−131, 138) | |||||||||||||||
| (−186, 201) | (−155, 155) | |||||||||||||||
| Iron (mg) | 179 | 5.8 ± 5.5 | 48 | 6 | 106 | −0.1 ± 3.8 | 44 | 6 | 111 | 0.0 ± 3.0 | 34 | 5 | 101 | −0.3 ± 2.8 | 26 | 5 |
| (−5.0, 16.6) | (−7.5, 7.3) | (−5.9, 5.9) | (−5.9, 5.2) | |||||||||||||
| Zinc (mg) | 174 | 4.9 ± 4.6 | 45 | 5 | 103 | −0.2 ± 3.1 | 40 | 5 | 109 | 0 ± 2.4 | 31 | 4 | 98 | −0.4 ± 1.9 | 20 | 5 |
| (−4.0, 13.9) | (−6.2, 5.8) | (−4.7, 4.7) | (−4.1, 3.2) | |||||||||||||
| Copper (mg) | 177 | 0.62 ± 0.60 | 47 | 5 | 105 | −0.02 ± 0.41 | 44 | 4 | 112 | 0.00 ± 0.35 | 37 | 5 | 99 | −0.05 ± 0.27 | 23 | 4 |
| (−0.55, 1.79) | (−0.83, 0.78) | (−0.69, 0.69) | (−0.59, 0.48) | |||||||||||||
| Vitamin A (μg) | 273 | 899 ± 1317 | 87 | 4 | 161 | 95 ± 1068 | 96 | 2 | 163 | 0 ± 974 | 91 | 2 | 148 | 120 ± 1318 | 96 | 1 |
| (−1683, 3481) | (−1998, 2188) | (−1908, 1908) | (−2464, 2703) | |||||||||||||
| Retinol (μg) | 269 | 344 ± 1069 | 170 | 4 | 159 | 17 ± 915 | 196 | 2 | 173 | 0 ± 821 | 179 | 1 | 145 | −2 ± 1199 | 209 | 1 |
| (−1751, 2440) | (−1776, 1810) | (−1609, 1609) | (−2353, 2349) | |||||||||||||
| β-carotene (μg) | 447 | 3775 ± 4339 | 85 | 7 | 264 | 920 ± 3128 | 85 | 6 | 229 | 0 ± 2785 | 87 | 5 | 266 | 1233 ± 3416 | 75 | 6 |
| (−4729, 12,279) | (−5211, 7051) | (−5458, 5458) | (−5462, 7928) | |||||||||||||
| Vitamin D (μg) | 1134 | 2.11 ± 2.49 | 124 | 4 | 670 | 0.86 ± 1.89 | 136 | 2 | 421 | 0.00 ± 1.48 | 154 | 2 | 668 | 0.83 ± 2.34 | 132 | 2 |
| (−2.77, 7.00) | (−2.85, 4.56) | (−2.90, 2.90) | (−3.76, 5.42) | |||||||||||||
| Vitamin E (mg) | 263 | 8.0 ± 6.1 | 52 | 6 | 155 | 1.6 ± 4.3 | 50 | 6 | 134 | 0.0 ± 3.9 | 51 | 5 | 143 | 2.2 ± 3.5 | 34 | 5 |
| (−3.9, 20.0) | (−6.8, 10.0) | (−7.7, 7.7) | (−4.7, 9.2) | |||||||||||||
| Vitamin B1 (mg) | 176 | 0.59 ± 0.62 | 47 | 5 | 104 | −0.07 ± 0.44 | 45 | 6 | 116 | 0.00 ± 0.37 | 36 | 5 | 97 | −0.09 ± 0.33 | 27 | 6 |
| (−0.63, 1.81) | (−0.93, 0.80) | (−0.73, 0.73) | (−0.74, 0.55) | |||||||||||||
| Vitamin B2 (mg) | 174 | 0.87 ± 0.83 | 48 | 4 | 103 | −0.02 ± 0.53 | 41 | 4 | 107 | 0.00 ± 0.40 | 31 | 4 | 98 | −0.07 ± 0.45 | 27 | 4 |
| (−0.75, 2.49) | (−1.06, 1.02) | (−0.79, 0.79) | (−0.95, 0.80) | |||||||||||||
| Niacin (mg) | 183 | 7.4 ± 7.7 | 48 | 2 | 108 | −0.6 ± 5.5 | 46 | 5 | 117 | 0.0 ± 4.6 | 38 | 5 | 103 | −1.2 ± 5.5 | 37 | 6 |
| (−7.6, 22.4) | (−11.3, 10.1) | (−9.0, 9.0) | (−11.9, 9.6) | |||||||||||||
| Vitamin B6 (mg) | 192 | 1.11 ± 0.95 | 47 | 4 | 114 | 0.07 ± 0.61 | 42 | 2 | 114 | 0.00 ± 0.47 | 33 | 5 | 108 | 0.04 ± 0.47 | 26 | 6 |
| (−0.75, 2.96) | (−1.13, 1.27) | (−0.92, 0.92) | (−0.88, 0.97) | |||||||||||||
| Folic acid (μg) | 1367 | 302 ± 174 | 77 | 2 | 808 | 147 ± 118 | 79 | 5 | 293 | 0 ± 56 | 73 | 5 | 828 | 165 ± 133 | 67 | 6 |
| (−41, 644) | (−85, 379) | (−110, 110) | (−95, 426) | |||||||||||||
| Vitamin B12 (μg) | 4449 | 4.69 ± 3.55 | 105 | 7 | 2631 | 2.35 ± 2.34 | 106 | 7 | 743 | 0.00 ± 1.14 | 111 | 4 | 2581 | 2.51 ± 2.52 | 86 | 5 |
| (−2.27, 11.65) | (−2.24, 6.94) | (−2.24, 2.24) | (−2.43, 7.46) | |||||||||||||
| Vitamin C (mg) | 260 | 109.2 ± 97.5 | 64 | 6 | 154 | 24.6 ± 64.6 | 59 | 7 | 133 | 0.0 ± 53.8 | 55 | 4 | 150 | 28.4 ± 64.6 | 47 | 5 |
| (−82.0, 300.3) | (−102.0, 151.2) | (−105.5, 105.5) | (−98.2, 155.1) | |||||||||||||

| Nutrient | Women who failed to meet dietary recommendations | Women who met dietary recommendations | ||||||
|---|---|---|---|---|---|---|---|---|
| FR-crude | FFQ-crude | FFQ-adjusted | FFQ-regressive | FR-crude | FFQ-crude | FFQ-adjusted | FFQ-regressive | |
| Energy A,B,C | 14 a,b | 26 | 77 a | 87 b | 2 a,b | 55 a | 10 b | 4 |
| Total protein B | 0 a | 2 | 19 a | 0 | 13 a,b,c | 94 a | 57 b | 93 c |
| Fat B | 14 a,b | 14 | 57 a | 65 b | 7 a,b | 70 a | 23 b | 10 |
| SFA B,C | 10 a,b | 12 | 48 a | 49 b | 10 a,b,c | 75 a | 31 b | 21 c |
| PUFA A,B,C | 52 a,b,c | 36 a | 71 b | 94 c | 4 a | 43 a | 10 | 1 |
| Cholesterol | 13 a,b,c | 42 a | 87 b | 26 c | 17 a | 29 | 6 a | 13 |
| Carbohydrates | 0 a | 0 | 5 a | 0 | 24 a,b,c | 99 a | 92 b | 100 c |
| Fibre A,B | 37 a,b | 36 | 74 a | 96 b | 2 a,b | 50 a | 12 b | 0 |
| Sodium | 0 a,b | 8 a | 42 b | 0 | 5 a,b,c | 82 a | 29 b | 100 c |
| Potassium A,B | 0 a,b,c | 48 a | 92 b | 100 c | 29 a,b | 32 | 4 a | 0 b |
| Calcium A,B,C | 73 a,b | 40 a | 83 | 98 b | 4 a | 38 a | 8 | 1 |
| Phosphorus B | 0 a | 1 | 5 a | 0 | 23 a,b,c | 98 a | 79 b | 100 c |
| Magnesium B | 0 a,b,c | 11 a | 51 b | 52 c | 4 a,b | 75 a | 26 b | 8 |
| Iron | 0 a,b | 6 a | 42 b | 2 | 7 a,b,c | 88 a | 40 b | 37 c |
| Zinc B,C | 0 a | 4 | 36 a | 2 | 10 a,b,c | 90 a | 39 b | 44 c |
| Copper | 0 a | 2 | 21 a | 0 | 10 a,b,c | 93 a | 56 b | 83 c |
| Vitamin A | 4 | 1 | 10 | 0 | 54 a,b,c | 98 a | 86 b | 100 c |
| Vitamin E B,C | 0 a,b,c | 6 a | 35 b | 45 c | 10 a,b,c | 89 a | 46 b | 26 c |
| Vitamin B1 | 0 a | 4 | 38 a | 2 | 13 a,b,c | 82 a | 40 b | 51 c |
| Vitamin B2 | 0 a | 1 | 17 a | 0 | 13 a,b,c | 94 a | 65 b | 99 c |
| Niacin | 0 a,b | 5 a | 37 b | 2 | 6 a,b,c | 83 a | 38 b | 40 c |
| Vitamin B6B | 0 a | 2 | 19 a | 0 | 18 a,b,c | 94 a | 61 b | 83 c |
| Vitamin C B | 0 a | 1 | 15 a | 1 | 36 a,b,c | 94 a | 76 b | 83 c |
3.2. Food Records (FR-Crude) vs. Food Frequency Questionnaire after Adjustment with Beta-Coefficient (FFQ-Adjusted)
3.3. Food Records (FR-Crude) vs. Food Frequency Questionnaire after Adjustment with Regression Equations (FFQ-Regressive)
3.4. Food Records after Standardization (FR-Standardized) vs. Food Frequency Questionnaire after Standardization (FFQ-Standardized)


4. Discussion
4.1. Differences in Energy and Nutritional Value of Diet Obtained by FFQ and Food Record
4.2. Differences in Nutritional Value of Diet after Energy Adjustment
4.3. Study Limitations
4.4. Study Strengths
5. Conclusions
Acknowledgments
Conflict of Interest
| Nutrient | a | b | Estimation error | Regression equations | R2 corrected | P |
|---|---|---|---|---|---|---|
| Energy (kcal) | 0.31 | 766.77 | 505.85 | y = 0.31 × x + 766,77 ± 505.85 | 0.31 | <0.001 |
| Total protein (g) | 0.23 | 37.72 | 16.77 | y = 0.23 × x + 37.72 ± 16.77 | 0.19 | <0.001 |
| Animal protein (g) | 0.23 | 24.72 | 12.14 | y = 0.23 × x + 24.72 ± 12.14 | 0.19 | <0.001 |
| Vegetable protein (g) | 0.21 | 13.75 | 7.07 | y = 0.21 × x + 13.75 ± 7.07 | 0.12 | <0.001 |
| Fat (g) | 0.34 | 24.29 | 25.45 | y = 0.34 × x + 24.29 ± 25.45 | 0.33 | <0.001 |
| SFA (g) | 0.34 | 8.97 | 9.27 | y = 0.34 × x + 8.97 ± 9.27 | 0.36 | <0.001 |
| MUFA (g) | 0.32 | 10.39 | 11.40 | y = 0.32 × x + 10.39 ± 11.40 | 0.27 | <0.001 |
| PUFA (g) | 0.30 | 3.74 | 4.59 | y = 0.30 × x + 3.74 ± 4.59 | 0.23 | <0.001 |
| Cholesterol (mg) | 0.32 | 193.63 | 160.92 | y = 0.32 × x + 193.63 ± 160.92 | 0.07 | <0.05 |
| Carbohydrates (g) | 0.27 | 122.05 | 66.43 | y = 0.27 × x + 122.05 ± 66.43 | 0.25 | <0.001 |
| Fibre (g) | 0.23 | 9.02 | 6.14 | y = 0.23 × x + 9.02 ± 6.14 | 0.20 | <0.001 |
| Water (g) | 0.16 | 882.25 | 330.08 | y = 0.16 × x + 882.25 ± 330.08 | 0.14 | <0.001 |
| Sodium (mg) | 0.09 | 1752.39 | 705.34 | y = 0.09 × x + 1752.39 ± 705.34 | 0.01 | NS |
| Potassium (mg) | 0.25 | 1406.89 | 810.86 | y = 0.25 × x + 1406.89 ± 810.86 | 0.24 | <0.001 |
| Calcium (mg) | 0.27 | 311.23 | 253.14 | y = 0.27 × x + 311.23 ± 253.14 | 0.25 | <0.001 |
| Phosphorus (mg) | 0.26 | 572.36 | 315.71 | y = 0.26 × x + 572.36 ± 315.71 | 0.22 | <0.001 |
| Magnesium (mg) | 0.23 | 139.14 | 79.58 | y = 0.23 × x + 139.14 ± 79.58 | 0.16 | <0.001 |
| Iron (mg) | 0.20 | 5.82 | 3.01 | y = 0.20 × x + 5.82 ± 3.01 | 0.11 | <0.01 |
| Zinc (mg) | 0.20 | 5.11 | 2.42 | y = 0.20 × x + 5.11 ± 2.42 | 0.13 | <0.001 |
| Copper (mg) | 0.26 | 0.54 | 0.35 | y = 0.26 × x + 0.54 ± 0.35 | 0.18 | <0.001 |
| Vitamin A (μg) | 0.19 | 690.11 | 979.55 | y = 0.19 × x + 690.11 ± 979.55 | 0.03 | NS |
| Retinol (μg) | 0.01 | 452.78 | 825.83 | y = 0.01 × x + 452.78 ± 825.83 | –0.01 | NS |
| β-carotene (μg) | 0.29 | 1217.87 | 2801.64 | y = 0.29 × x + 1217.87 ± 2801.64 | 0.18 | <0.001 |
| Vitamin D (μg) | 0.01 | 0.93 | 1.49 | y = 0.01 × x + 0.93 ± 1.49 | –0.01 | NS |
| Vitamin E (mg) | 0.34 | 2.39 | 3.94 | y = 0.34 × x + 2.39 ± 3.94 | 0.26 | <0.001 |
| Vitamin B1 (mg) | 0.23 | 0.65 | 0.37 | y = 0.23 × x + 0.65 ± 0.37 | 0.13 | <0.001 |
| Vitamin B2 (mg) | 0.22 | 0.83 | 0.41 | y = 0.22 × x + 0.83 ± 0.41 | 0.19 | <0.001 |
| Niacin (mg) | 0.21 | 8.07 | 4.60 | y = 0.21 × x + 8.07 ± 4.60 | 0.10 | <0.01 |
| Vitamin B6 (mg) | 0.22 | 0.88 | 0.47 | y = 0.22 × x + 0.88 ± 0.47 | 0.19 | <0.001 |
| Folic acid (μg) | –0.10 | 115.60 | 56.45 | y = –0.10 × x + 115.60 ± 56.45 | 0.06 | <0.05 |
| Vitamin B12(μg) | –0.04 | 1.27 | 1.15 | y= –0.04 × x + 1.27 ± 1.15 | 0.00 | NS |
| Vitamin C (mg) | 0.27 | 41.46 | 54.17 | y = 0.27 × x + 41.46 ± 54.17 | 0.23 | <0.001 |
| Nutrient | Compatible classification of FR-crude and FFQ | FFQ classifies below FR-crude | FFQ classifies above FR-crude | ||||||
|---|---|---|---|---|---|---|---|---|---|
| FFQ-crude | FFQ-adjusted | FFQ-regressive | FFQ-crude | FFQ-adjusted | FFQ-regressive | FFQ-crude | FFQ-adjusted | FFQ-regressive | |
| Energy | 26 | 27 | 26 | 18 a,b | 64 a | 73 b | 56 a,b | 8 a,c | 1 b,c |
| Total protein | 6 a,b | 30 a | 20 b | 2 a | 13 a,b | 0 b | 92 a,b | 57 a,c | 80 b,c |
| Fat | 21 a | 35 a | 33 | 10 a,b | 45 a | 57 b | 69 a,b | 20 a,c | 10 b,c |
| SFA | 18 a,b | 33 a | 35 b | 7 a,b | 37 a | 46 b | 75 a,b | 30 a,c | 19 b,c |
| PUFA | 32 a | 33 b | 56 a,b | 26 a,b | 58 a,c | 43 b,c | 42 a,b | 8 a,c | 1 b,c |
| Cholesterol | 38 a | 21 a,b | 52 b | 33 a | 74 a,b | 31 b | 29 a,b | 5 a,c | 17 b,c |
| Carbohydrates | 4 a | 6 b | 24 a,b | 0 | 4 | 0 | 96 a | 90 b | 76 a,b |
| Fibre | 25 a | 27 | 40 a | 26 a,b | 61 a | 60 b | 49 a,b | 12 a,c | 0 b,c |
| Sodium | 11 a | 39 a,b | 5 b | 6 a,b | 32 a,c | 0 b,c | 83 a,b | 29 a,c | 95 b,c |
| Potassium | 31 a,b | 18 a,c | 71 b,c | 37 a,b | 79 a,c | 0 b,c | 32 a | 4 a,b | 29 b |
| Calcium | 30 a | 20 b | 73 a,b | 32 a | 73 a,b | 26 b | 38 a,b | 7 a,c | 1 b,c |
| Phosphorus | 4 a,b | 15 a | 23 b | 1 | 5 a | 0 a | 95 a,b | 80 a | 77 b |
| Magnesium | 13 a,b | 31 a | 38 b | 10 a,b | 42 a,c | 55 b,c | 77 a,b | 27 a,c | 7 b,c |
| Iron | 6 a,b | 27 a,c | 63 b,c | 6 a | 32 a,b | 5 b | 88 a,b | 40 a | 32 b |
| Zinc | 7 a,b | 33 a,c | 61 b,c | 4 a | 27 a,b | 4 b | 89 a,b | 39 a | 36 b |
| Copper | 6 a,b | 29 a | 26 b | 2 a | 15 a,b | 0 b | 92 a,b | 56 a,c | 74 b,c |
| Vitamin A | 4 a | 7 b | 54 a,b | 1 a | 8 a,b | 0 b | 95 a,b | 85 a,c | 46 b,c |
| Vitamin E | 8 a,b | 27 a | 31 b | 5 a,b | 26 a,c | 49 b,c | 87 a,b | 46 a,c | 20 b,c |
| Vitamin B1 | 12 a,b | 31 a,c | 55 b,c | 4 a | 29 a,b | 5 b | 85 a,b | 40 a | 40 b |
| Vitamin B2 | 6 a | 20 a | 14 | 1 a | 13 a,b | 0 b | 93 a | 67 a,b | 86 b |
| Niacin | 10 a,b | 33 a,c | 56 b,c | 5 a | 27 a,b | 6 b | 86 a,b | 39 a | 38 b |
| Vitamin B6 | 6 a,b | 25 a | 35 b | 2 a | 13 a,b | 0 b | 92 a,b | 62 a | 65 b |
| Vitamin C | 7 a | 11 b | 46 a,b | 1 a | 13 a,b | 4 b | 92 a,b | 76 a,c | 50 b,c |
References
- Gibson, R.S. Principles of Nutritional Assessment, 2nd ed.; Oxford University Press: New York, NY, USA, 2005. [Google Scholar]
- Gronowska-Senger, A. Zarys Oceny Żywienia [Outline of Dietary Assessment]; SGGW: Warszawa, Poland, 2009. [Google Scholar]
- Dehghan, M.; Ilow, R.; Zatonska, K.; Szuba, A.; Zhang, X.; Mente, A.; Regulska-Ilow, B. Development, reproducibility and validity of the food frequency questionnaire in the Poland arm of the Prospective Urban and Rural Epidemiological (PURE) study. J. Hum. Nutr. Diet. 2012, 25, 225–232. [Google Scholar] [CrossRef]
- Thompson, F.E.; Byers, T. Dietary assessment resource manual. J. Nutr. 1994, 124, S2245–S2317. [Google Scholar]
- Thompson, F.E.; Subar, A.F. Dietary Assessment Methodology. In Nutrition in the Prevention and Treatment of Disease, 2nd ed.; Coulston, A.M., Boushey, C.J., Eds.; Academic Press: San Diego, CA, USA, 2008; pp. 3–39. [Google Scholar]
- Brunner, E.; Stallone, D.; Juneja, M.; Bingham, S.; Marmot, M. Dietary assessment in Whitehall II: Comparison of 7 d diet diary and food-frequency questionnaire and validity against biomarkers. Br. J. Nutr. 2001, 86, 405–414. [Google Scholar] [CrossRef]
- Goulet, J.; Nadeau, G.; Lapointe, A.; Lamarche, B.; Lemieux, S. Validity and reproducibility of an interviewer-administered food frequency questionnaire for healthy French-Canadian men and women. Nutr. J. 2004, 3, 13–22. [Google Scholar] [CrossRef] [Green Version]
- Poslusna, K.; Ruprich, J.; de Vries, J.H.M.; Jakubikova, M.; van’t Veer, P. Misreporting of energy and micronutrient intake estimated by food recordsand 24 h recalls, control and adjustment methods in practice. Br. J. Nutr. 2009, 101, S73–S85. [Google Scholar] [CrossRef]
- Ambrosini, G.L.; Mackerras, D.; de Klerk, N.H.; Musk, A.W. Comparison of an Australian food-frequency questionnaire with diet records: Implications for nutrition surveillance. Public Health Nutr. 2003, 6, 415–422. [Google Scholar]
- Cade, J.; Thompson, R.; Burley, V.; Warm, D. Development, validation and utilisation of food-frequency questionnaires—A review. Public Health Nutr. 2002, 5, 567–587. [Google Scholar] [CrossRef]
- Fialkowski, M.K.; McCrory, M.A.; Roberts, S.M.; Tracy, J.K.; Grattan, L.M.; Boushey, C.J. Evaluation of dietary assessment tools used to assess the diet of adults participating in the Communities Advancing the Studies of Tribal Nations Across the Lifespan (CoASTAL) cohort. J. Am. Diet. Assoc. 2010, 110, 65–73. [Google Scholar] [CrossRef]
- Kroke, A.; Klipstein-Grobusch, K.; Voss, S.; Möseneder, J.; Thielecke, F.; Noack, R.; Boeing, H. Validation of a self-administered food-frequency questionnaire administered in the European Prospective Investigation into Cancer and Nutrition (EPIC) Study: Comparison of energy, protein, and macronutrient intakes estimated with doubly-labelled water, urinary nitrogen, and repeated 24-h dietary recall methods. Am. J. Clin. Nutr. 1999, 70, 439–447. [Google Scholar]
- Lee, M.S.; Pan, W.H.; Liu, K.L.; Yu, M.S. Reproducibility and validity of a Chinese food frequency questionnaire used in Taiwan. Asia Pac. J. Clin. Nutr. 2006, 15, 161–169. [Google Scholar]
- Marks, G.C.; Hughes, M.C.; van der Pols, J.C. The effect of personal characteristics on the validity of nutrient intake estimates using a food-frequency questionnaire. Public Health Nutr. 2006, 9, 394–402. [Google Scholar] [CrossRef]
- McKeown, N.M.; Day, N.E.; Welch, A.A.; Runswick, S.A.; Luben, R.N.; Mulligan, A.A.; McTaggart, A.; Bingham, S.A. Use of biological markers to validate self-reported dietary intake in a random sample of the European Prospective Investigation into Cancer United Kingdom Norfolk cohort. Am. J. Clin. Nutr. 2001, 74, 188–196. [Google Scholar]
- Pritchard, J.M.; Seechurn, T.; Atkinson, S.A. A Food Frequency Questionnaire for the Assessment of Calcium, Vitamin D and Vitamin K: A Pilot Validation Study. Nutrients 2010, 2, 805–819. [Google Scholar] [CrossRef]
- Tokudome, Y.; Goto, C.; Imaeda, N.; Hasegawa, T.; Kato, R.; Hirose, K.; Tajima, K.; Tokudome, S. Relative validity of a short food frequency questionnaire for assessing nutrient intake versus three-day weighed diet records in middle-aged Japanese. J. Epidemiol. 2005, 15, 135–145. [Google Scholar] [CrossRef]
- Cook, A.; Pryer, J.; Shetty, P. The problem of accuracy in dietary surveys. Analysis of the over 65 UK National Diet and Nutrition Survey. J. Epidemiol. Commun. Health 2000, 54, 611–616. [Google Scholar] [CrossRef]
- Voss, S.; Kroke, A.; Klipstein-Grobusch, K.; Boeing, H. Is macronutrient composition of dietary intake data affected by under-reporting? Results from the EPIC-Potsdam study. Eur. J. Clin. Nutr. 1998, 52, 119–126. [Google Scholar]
- Willett, W.C.; Howe, G.R.; Kushi, L.H. Adjustment for total energy intake in epidemiologic studies. Am. J. Clin. Nutr. 1997, 65, S1220–S1228. [Google Scholar]
- Wądołowska, L. Walidacja kwestionariusza częstotliwości spożycia żywności–FFQ. Ocena powtarzalności [Validation of food frequency questionnaire–FFQ. Reproducibility assessment]. Bromat. Chem. Toksykol. 2005, 38, 27–33. [Google Scholar]
- Szymelfejnik, E.J.; Wądołowska, L.; Cichon, R.; Przysławski, J.; Bolesławska, I. Dairy products frequency questionnaire (ADOS-Ca) calibration for calcium intake evaluation. Pol. J. Food Nutr. Sci. 2006, 1556, 229–236. [Google Scholar]
- Ambrosini, G.L.; de Klerk, N.H.; Musk, A.W.; Mackerras, D. Agreement between a brief food frequency questionnaire and diet records using two statistical methods. Public Health Nutr. 2001, 4, 255–264. [Google Scholar]
- Szponar, L.; Wolnicka, K.; Rychlik, E. Album Fotografii Produktów i Potraw [Album of Photographs of Food Products and Dishes]; IŻŻ: Warszawa, Poland, 2000. [Google Scholar]
- Kunachowicz, H.; Nadolna, I.; Przygoda, B.; Iwanow, K. Tabele Składu i Wartości Odżywczej Żywności [Food Composition Tables]; PZWL: Warszawa, Poland, 2005. [Google Scholar]
- Stanisz, A. Przystępny kurs Statystyki z Zastosowaniem STATISTICA PL na Przykładach z Medycyny: Modele Liniowe i Nieliniowe [Accessible Course of Statistics with Application of STATISTICA PL Using Medical Examples. Linear and Nonlinear Models]; StatSoft: Kraków, Poland, 2007. [Google Scholar]
- Jarosz, M.; Bułhak-Jachymczyk, B. Normy Żywienia Człowieka. Podstawy Prewencji Otyłości i Chorób Niezakaźnych [Human Nutrition Norms. Basic Prevention of Obesity and Non-Infectious Diseases]; PZWL: Warszawa, Poland, 2008. [Google Scholar]
- Dietary Reference Intakes: The Essential Guide to Nutrient Requirements; Otten, J.J.; Hellwig, J.P.; Meyers, L.D. (Eds.) National Academy Press: Washington, DC, USA, 2006.
- World Health Organization, Diet, Nutrition and the Prevention of Chronic Diseases. Joint WHO/FAO Expert Consultation; WHO Technical Report Series No. 916; WHO: Geneva, Switzerland, 2003.
- Bland, J.M.; Altman, D.G. Statistical methods for assessing agreement between two methods of clinical measurement. Lancet 1986, 1, 307–310. [Google Scholar] [CrossRef]
- British Standards Institution, Precision of Test Methods 1: Guide for the Determination and Reproducibility for a Research Test Method (BS 597, Part 1); BSI: London, UK, 1975.
- Nelson, M.; Atkinson, M.; Darbyshire, S. Food photography II: Use of food photographs for estimating portion size and the nutrient content of meals. Br. J. Nutr. 1996, 76, 31–49. [Google Scholar] [CrossRef]
- Wądołowska, L.; Cichon, R.; Słowińska, M.A.; Szymelfejnik, E. Comparison of eating habits on the basis of single and triple dietary interviews. Pol. J. Food Nutr. Sci. 2004, 13/54, 313–320. [Google Scholar]
- Wądołowska, L. Żywieniowe Podłoże Zagrożeń Zdrowia w Polsce [Nutrition as an Underlying Cause of Health Hazards in Poland]; UWM: Olsztyn, Poland, 2010. [Google Scholar]
- Schaefer, E.J.; Augustin, J.L.; Schaefer, M.M.; Rasmussen, H.; Ordovas, J.M.; Dallal, G.E.; Dwyer, J.T. Lack of efficacy of a food-frequency questionnaire in assessing dietary macronutrient intakes in subjects consuming diets of known composition. Am. J. Clin. Nutr. 2000, 71, 746–751. [Google Scholar]
© 2013 by the authors; licensee MDPI, Basel, Switzerland. This article is an open access article distributed under the terms and conditions of the Creative Commons Attribution license (http://creativecommons.org/licenses/by/3.0/).
Share and Cite
Kowalkowska, J.; Slowinska, M.A.; Slowinski, D.; Dlugosz, A.; Niedzwiedzka, E.; Wadolowska, L. Comparison of a Full Food-Frequency Questionnaire with the Three-Day Unweighted Food Records in Young Polish Adult Women: Implications for Dietary Assessment. Nutrients 2013, 5, 2747-2776. https://doi.org/10.3390/nu5072747
Kowalkowska J, Slowinska MA, Slowinski D, Dlugosz A, Niedzwiedzka E, Wadolowska L. Comparison of a Full Food-Frequency Questionnaire with the Three-Day Unweighted Food Records in Young Polish Adult Women: Implications for Dietary Assessment. Nutrients. 2013; 5(7):2747-2776. https://doi.org/10.3390/nu5072747
Chicago/Turabian StyleKowalkowska, Joanna, Malgorzata A. Slowinska, Dariusz Slowinski, Anna Dlugosz, Ewa Niedzwiedzka, and Lidia Wadolowska. 2013. "Comparison of a Full Food-Frequency Questionnaire with the Three-Day Unweighted Food Records in Young Polish Adult Women: Implications for Dietary Assessment" Nutrients 5, no. 7: 2747-2776. https://doi.org/10.3390/nu5072747