Food Group Intake and Micronutrient Adequacy in Adolescent Girls

Abstract
:1. Introduction
2. Experimental Section
2.1. Participants
2.2. Measurements
2.2.1. Dietary Assessment
2.2.2. Nutrient Intake Reference Values
2.2.3. Physical Activity
2.3. Statistical Analysis
3. Results

| Vit A (RAE) | Thiamin (mg) | Riboflavin (mg) | Niacin (mg) | Vit B6 (mg) | Vit B12 (μg) | Vit C (mg) | Vit D (μg) | ||
|---|---|---|---|---|---|---|---|---|---|
| Girls | Established Estimated Average Requirements (EAR) | ||||||||
| 9–13 years | 420 | 0.7 | 0.8 | 9 | 0.8 | 1.5 | 39 | 10.0 | |
| 14–18 years | 485 | 0.9 | 0.9 | 11 | 1.0 | 2.0 | 56 | 10.0 | |
| 19–20 years | 500 | 0.9 | 0.9 | 11 | 1.1 | 2.0 | 60 | 10.0 | |
| Intakes for NGHS Girls, by Age | |||||||||
| All | n | ( geometric mean ± s.d. ) | |||||||
| 9–13 years | 2360 | 579 ± 1.6 | 1.5 ± 1.3 | 1.7 ± 1.3 | 17.7 ± 1.3 | 1.4 ± 1.3 | 3.9 ± 1.5 | 84.9 ± 1.6 | 4.7 ± 1.6 |
| 14–18 years | 2101 | 494 ± 1.8 | 1.5 ± 1.4 | 1.6 ± 1.4 | 17.5 ± 1.4 | 1.3 ± 1.4 | 3.2 ± 1.7 | 85.1 ± 1.9 | 3.5 ± 1.9 |
| 19–20 years | 999 | 441 ± 2.1 | 1.5 ± 1.5 | 1.5 ± 1.5 | 18.3 ± 1.5 | 1.4 ± 1.6 | 2.9 ± 1.9 | 72.4 ± 2.3 | 3.1 ± 2.4 |
| All | % of Girls Meeting EAR, by Age and Race | ||||||||
| 9–13 years | 2360 | 77.8% | 99.9% | 99.7% | 99.4% | 97.0% | 99.3% | 94.5% | 1.9% |
| 14–18 years | 2101 | 53.2% | 93.4% | 94.1% | 93.9% | 81.3% | 84.4% | 76.8% | 2.4% |
| 19–20 years | 999 | 46.3% | 88.1% | 88.0% | 90.9% | 69.5% | 76.0% | 60.0% | 5.1% |
| p-value | <0.0001 | 0.0469 | 0.0468 | 0.2036 | <0.0001 | <0.0001 | <0.0001 | <0.0001 | |
| White | |||||||||
| 9–13 years | 1157 | 85.2% | 100.0% | 99.9% | 99.3% | 96.5% | 99.1% | 92.9% | 2.9% |
| 14–18 years | 1014 | 63.4% | 93.4% | 95.4% | 91.7% | 78.3% | 82.1% | 71.9% | 3.9% |
| 19–20 years | 446 | 53.1% | 89.2% | 91.0% | 90.4% | 65.5% | 75.8% | 52.2% | 7.6% |
| p-value | <0.0001 | 0.2995 | 0.4448 | 0.3698 | <0.0001 | 0.0015 | <0.0001 | 0.0008 | |
| Black | |||||||||
| 9–13 years | 1203 | 70.7% | 99.8% | 99.5% | 99.5% | 97.3% | 99.4% | 96.1% | 0.9% |
| 14–18 years | 1087 | 43.7% | 93.4% | 92.8% | 95.9% | 84.0% | 86.7% | 81.4% | 1.1% |
| 19–20 years | 553 | 40.7% | 87.2% | 85.5% | 91.3% | 72.7% | 76.1% | 66.2% | 3.1% |
| p-value | <0.0001 | 0.1529 | 0.0969 | 0.4501 | 0.0005 | 0.0014 | <0.0001 | 0.0030 | |
| Vit E (mg) | Ca (mg) | Mg (mg) | Zn (mg) | Fe (mg) | P (mg) | K (mg) 1 | |||
| Girls | Established Estimated Average Requirements (EAR) | ||||||||
| 9–13 years | 9.0 | 1100 | 200 | 7.0 | 5.7 | 1055 | 4500 | ||
| 14–18 years | 12.0 | 1100 | 300 | 7.3 | 7.9 | 1055 | 4700 | ||
| 19–20 years | 12.0 | 800 | 255 | 6.8 | 8.1 | 580 | 4700 | ||
| Intakes for NGHS Girls, by Age | |||||||||
| All | n | ( geometric mean ± s.d. ) | |||||||
| 9–13 years | 2360 | 5.4 ± 1.5 | 756 ± 1.4 | 208 ± 1.3 | 9.2 ± 1.3 | 11.7 ± 1.3 | 1056 ± 1.3 | 1970 ± 1.3 | |
| 14–18 years | 2101 | 5.4 ± 1.5 | 672 ± 1.5 | 198 ± 1.4 | 8.6 ± 1.4 | 11.5 ± 1.4 | 995 ± 1.4 | 1883 ± 1.4 | |
| 19–20 years | 999 | 4.9 ± 1.6 | 632 ± 1.6 | 196 ± 1.5 | 8.5 ± 1.5 | 11.7 ± 1.5 | 991 ± 1.4 | 1863 ± 1.5 | |
| All | % of Girls Meeting EAR, by Age and Race | ||||||||
| 9–13 years | 2360 | 8.5% | 11.3% | 56.5% | 85.5% | 99.6% | 50.8% | 0.0% | |
| 14–18 years | 2101 | 2.4% | 11.3% | 9.0% | 69.9% | 88.7% | 42.8% | 0.1% | |
| 19–20 years | 999 | 1.8% | 33.2% | 25.1% | 73.6% | 81.7% | 92.1% | 0.9% | |
| p-value | <0.0001 | <0.0001 | <0.0001 | 0.0002 | 0.0007 | <0.0001 | <0.0001 | ||
| White | |||||||||
| 9–13 years | 1157 | 4.2% | 17.6% | 60.4% | 84.2% | 99.6% | 56.4% | 0.0% | |
| 14–18 years | 1014 | 1.5% | 17.9% | 11.7% | 65.4% | 89.6% | 48.6% | 0.1% | |
| 19–20 years | 446 | 0.9% | 44.4% | 31.4% | 70.4% | 84.1% | 93.7% | 1.4% | |
| p-value | 0.0072 | <0.0001 | <0.0001 | 0.0020 | 0.0748 | <0.0001 | <0.0001 | ||
| Black | |||||||||
| 9–13 years | 1203 | 12.6% | 5.3% | 52.8% | 86.8% | 99.7% | 45.4% | 0.0% | |
| 14–18 years | 1087 | 3.2% | 5.2% | 6.4% | 74.2% | 88.0% | 37.4% | 0.1% | |
| 19–20 years | 553 | 2.5% | 24.2% | 20.1% | 76.3% | 79.8% | 90.8% | 0.5% | |
| p-value | <0.0001 | <0.0001 | <0.0001 | 0.0665 | 0.0089 | <0.0001 | 0.0382 | ||
| Subjects | Fruit | Vegetables | Dairy | Meats | Grains | |
|---|---|---|---|---|---|---|
| All Girls | Recommended food servings 1,2 | |||||
| 9–13 years | 3.0 | 4.0 | 3.0 | 5.0 | 5.0 | |
| 14–18 years | 3.0 | 5.0 | 3.0 | 5.0 | 6.0 | |
| 19–20 years | 4.0 | 5.0 | 3.0 | 5.5 | 6.0 | |
| Reported intakes at each age | ||||||
| All | n | (geometric mean ± s.d.) | ||||
| 9–13 years | 2360 | 1.1 ± 1.4 | 1.9 ± 1.3 | 1.6 ± 1.3 | 3.9 ± 1.4 | 6.1 ± 1.3 |
| 14–18 years | 2101 | 1.0 ± 1.6 | 2.2 ± 1.4 | 1.5 ± 1.4 | 3.6 ± 1.5 | 5.9 ± 1.4 |
| 19–20 years | 999 | 0.9 ± 1.7 | 2.3 ± 1.6 | 1.3 ± 1.5 | 3.6 ± 1.7 | 5.9 ± 1.6 |
| % NGHS girls meeting recommended food intakes, by age and race | ||||||
| All | ||||||
| 9–13 years | 2360 | 4.6% | 2.8% | 6.4% | 24.8% | 77.2% |
| 14–18 years | 2101 | 7.8% | 2.9% | 7.7% | 24.3% | 51.6% |
| 19–20 years | 999 | 5.6% | 7.8% | 8.9% | 24.3% | 51.3% |
| p-trend | <0.0001 | <0.0001 | 0.0445 | 0.9342 | <0.0001 | |
| White | ||||||
| 9–13 years | 1157 | 5.6% | 1.8% | 11.7% | 11.5% | 79.3% |
| 14–18 years | 1014 | 10.8% | 1.5% | 13.3% | 9.4% | 57.9% |
| 19–20 years | 446 | 7.2% | 6.1% | 16.1% | 10.3% | 57.9% |
| p-trend | 0.0001 | <0.0001 | 0.0817 | 0.3094 | <0.0001 | |
| Black | ||||||
| 9–13 years | 1203 | 3.6% | 3.8% | 1.4% | 37.6% | 75.2% |
| 14–18 years | 1087 | 5.0% | 4.2% | 2.4% | 38.2% | 45.8% |
| 19–20 years | 553 | 4.3% | 9.2% | 3.1% | 35.6% | 45.9% |
| p-trend | 0.2703 | <0.0001 | 0.0604 | 0.7221 | <0.0001 | |
| USDA Recommended Intakes 1 | |||||
|---|---|---|---|---|---|
| Total Energy Intake | Allowance from SoFAS | ||||
| (kcal/day) | (kcal/day) | (% of energy) | |||
| Sedentary Girls | |||||
| 9–13 years | 1600 | 121 | 7.6% | ||
| 14–18 years | 1800 | 161 | 8.9% | ||
| 19–20 years | 2000 | 258 | 12.9% | ||
| Moderately Active Girls | |||||
| 9–13 years | 1800 | 161 | 8.9% | ||
| 14–18 years | 2000 | 258 | 12.9% | ||
| 19–20 years | 2200 | 266 | 12.1% | ||
| Active Girls | |||||
| 9–13 years | 2000 | 258 | 12.9% | ||
| 10–14 years | 2400 | 330 | 13.8% | ||
| 19–20 years | 2400 | 330 | 13.8% | ||
| NGHS Girls Intakes | |||||
| Total Energy Intake | Intake from SoFAS | ||||
| n | (mean ± s.d.) | (mean ± s.d.) | (% of energy) | ||
| All | |||||
| 9–13 years | 2360 | 1877 ± 399 | 792 ± 218 | 42.0 ± 5.4 | |
| 14–18 years | 2101 | 1875 ± 487 | 759 ± 259 | 40.1 ± 7.2 | |
| 19–20 years | 999 | 1920 ± 582 | 767 ± 310 | 39.5 ± 9.4 | |
| Sedentary | |||||
| 9–13 years | 892 | 1864 ± 381 | 790 ± 206 | 42.2 ± 5.4 | |
| 14–18 years | 1848 | 1874 ± 491 | 775 ± 257 | 41.0 ± 6.9 | |
| 19–20 years | 776 | 1938 ± 589 | 801 ± 310 | 41.0 ± 8.8 | |
| Moderately Active | |||||
| 9–13 years | 1187 | 1873 ± 402 | 790 ± 221 | 41.9 ± 5.5 | |
| 14–18 years | 331 | 1858 ± 452 | 715 ± 257 | 37.9 ± 7.6 | |
| 19–20 years | 139 | 1864 ± 535 | 723 ± 296 | 38.3 ± 10.1 | |
| Active | |||||
| 9–13 years | 271 | 1927 ± 442 | 803 ± 235 | 41.3 ± 5.4 | |
| 14–18 years | 46 | 2009 ± 518 | 718 ± 297 | 35.0 ± 8.3 | |
| 19–20 years | 96 | 1849 ± 584 | 671 ± 352 | 35.0 ± 11.1 | |
| Food Intake 1 | n | Vit A (RAE) | Vit B6 (mg) | Vit B12 (μg) | Vit C (mg) | Ca (mg) | Mg (mg) | Zn (mg) | P (mg) |
|---|---|---|---|---|---|---|---|---|---|
| % Meeting EAR | |||||||||
| Fruit | |||||||||
| Low | 1436 | 47.5% | 77.2% | 84.3% | 67.2% | 8.6% | 5.1% | 67.6% | 38.9% |
| Moderate | 326 | 60.1% | 87.7% | 84.4% | 95.4% | 13.5% | 7.7% | 75.8% | 47.6% |
| High | 339 | 70.8% | 92.3% | 85.0% | 99.7% | 20.4% | 26.8% | 74.0% | 54.6% |
| p-value | <0.0001 | 0.0001 | 0.9589 | <0.0001 | <0.0001 | <0.0001 | 0.0026 | <0.0001 | |
| Vegetables | |||||||||
| Low | 1330 | 49.7% | 72.7% | 81.7% | 71.8% | 11.4% | 5.7% | 62.8% | 35.3% |
| Moderate | 549 | 55.7% | 94.7% | 88.0% | 84.0% | 10.2% | 8.4% | 78.9% | 49.5% |
| High | 222 | 68.0% | 99.1% | 91.9% | 89.2% | 13.5% | 30.2% | 90.5% | 70.7% |
| p-value | <0.0001 | <0.0001 | <0.0001 | <0.0001 | 0.4162 | <0.0001 | <0.0001 | <0.0001 | |
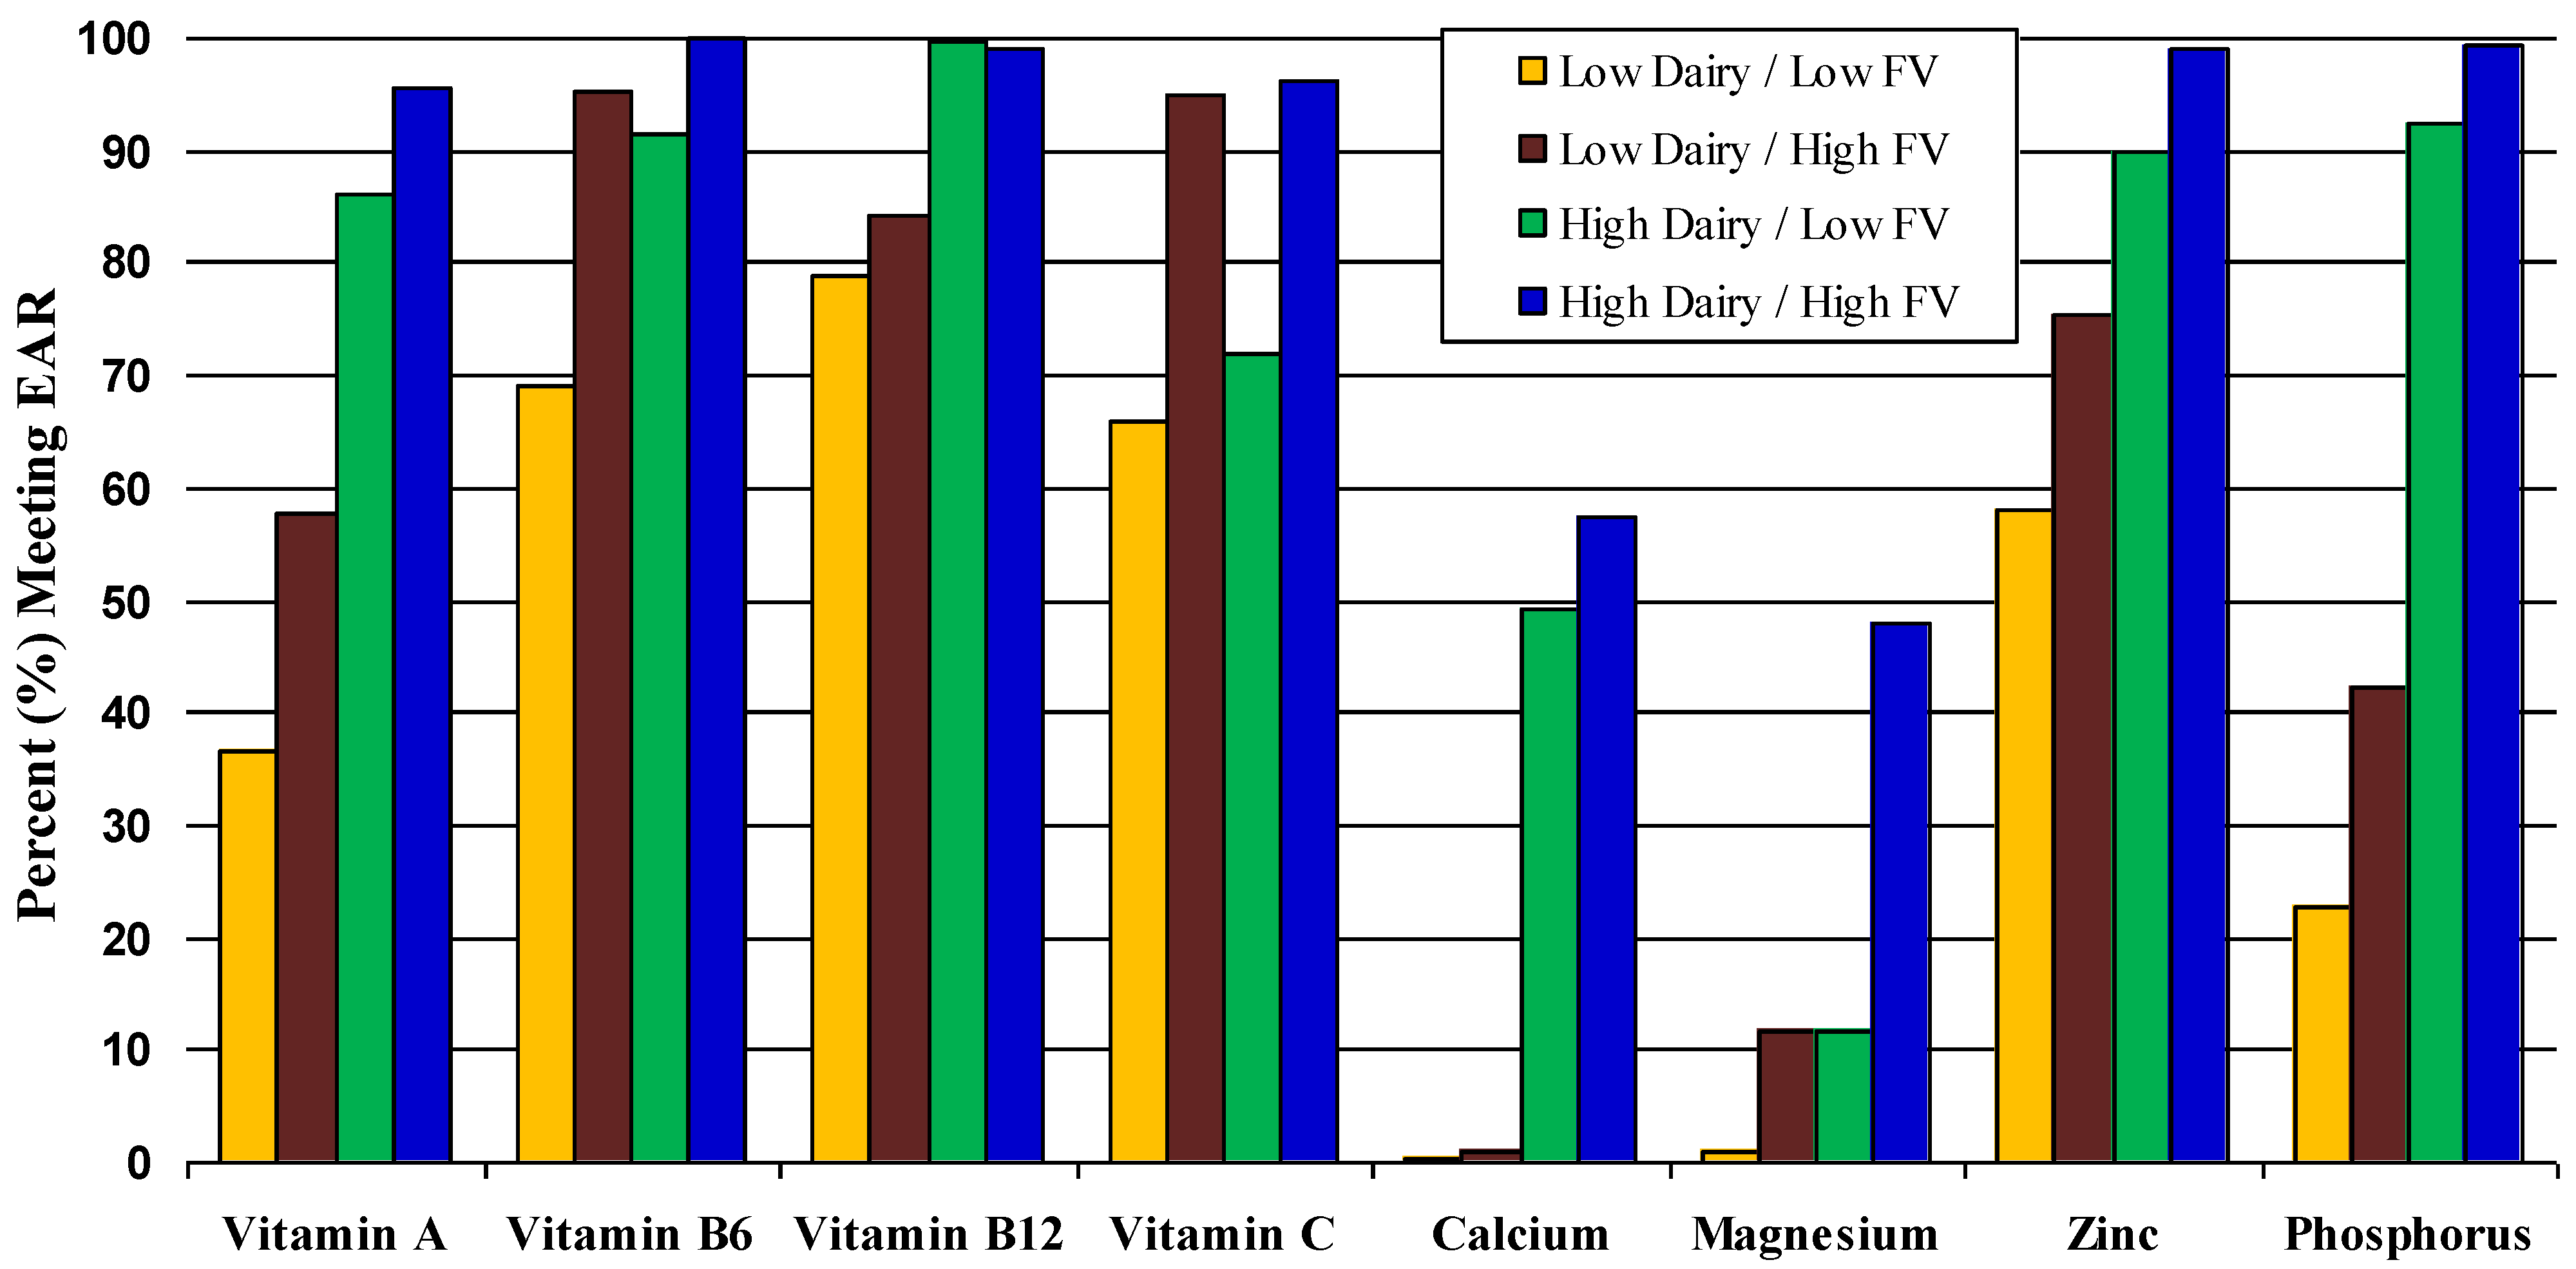
| Dairy | |||||||||
| Low | 1105 | 32.1% | 73.3% | 73.4% | 74.6% | 0.0% | 3.4% | 56.3% | 15.9% |
| Moderate | 561 | 66.1% | 86.3% | 94.7% | 77.2% | 1.4% | 6.1% | 78.4% | 54.9% |
| High | 435 | 90.1% | 94.9% | 99.3% | 82.1% | 52.6% | 26.9% | 93.6% | 95.4% |
| p-value | <0.0001 | <0.0001 | <0.0001 | 0.0059 | <0.0001 | <0.0001 | <0.0001 | <0.0001 | |
| Meat Group | |||||||||
| Low | 477 | 54.5% | 60.4% | 63.1% | 67.7% | 12.6% | 7.1% | 37.3% | 28.3% |
| Moderate | 620 | 52.4% | 77.9% | 83.6% | 75.3% | 11.1% | 6.0% | 61.3% | 32.9% |
| High | 1004 | 53.1% | 93.2% | 95.1% | 82.1% | 10.8% | 11.8% | 90.7% | 55.8% |
| p-value | 0.7850 | <0.0001 | <0.0001 | <0.0001 | <0.0001 | 0.0001 | <0.0001 | <0.0001 | |
| Grains | |||||||||
| Low | 421 | 30.9% | 62.7% | 75.3% | 66.0% | 3.1% | 1.9% | 44.4% | 11.2% |
| Moderate | 595 | 46.6% | 77.1% | 80.8% | 73.5% | 4.5% | 3.4% | 62.4% | 28.4% |
| High | 1085 | 65.5% | 90.7% | 90.0% | 82.9% | 18.2% | 14.8% | 84.0% | 63.0% |
| p-value | <0.0001 | <0.0001 | <0.0001 | <0.0001 | <0.0001 | <0.0001 | <0.0001 | <0.0001 | |


4. Discussion
5. Conclusions
Implications
Acknowledgments
Conflict of Interest
Supplementary Files
References
- Committee on Use of Dietary Reference Intakes in Nutrition Labeling, Dietary Reference Intakes: Guiding Principles for Nutrition Labeling and Fortification; The National Academies Press: Washington, DC, USA, 2003.
- U.S. Department of Agriculture and U.S. Department of Health and Human Services, Dietary Guidelines for Americans 2010, 7th edU.S. Government Printing Office: Washington, DC, USA, 2010.
- U.S. Department of Health and Human Services and U.S. Department of Agriculture, The Report of the Dietary Guidelines Advisory Committee on Dietary Guidelines for Americans; USDA Agricultural Research Service: Washington, DC, USA, 2005.
- Munoz, K.A.; Krebs-Smith, S.M.; Ballard-Barbash, R.; Cleveland, L.E. Food intakes of US children and adolescents compared with recommendations. Pediatrics 1997, 100, 323–329. [Google Scholar] [CrossRef]
- Krebs-Smith, S.M.; Guenther, P.M.; Subar, A.F.; Kirkpatrick, S.I.; Dodd, K.W. Americans do not meet federal dietary recommendations. J. Nutr. 2010, 140, 1832–1838. [Google Scholar] [CrossRef]
- Johnson, R.K.; Johnson, D.G.; Wang, M.Q.; Smiciklas-Wright, H.; Guthrie, H.A. Characterizing nutrient intakes of adolescents by sociodemographic factors. J. Adolesc. Health 1994, 15, 149–154. [Google Scholar] [CrossRef]
- Suitor, C.W.; Gleason, P.M. Using Dietary Reference Intake-based methods to estimate the prevalence of inadequate nutrient intake among school-aged children. J. Am. Diet. Assoc. 2002, 102, 530–536. [Google Scholar] [CrossRef]
- Moshfegh, A.; Goldman, J.; Cleveland, L. What We Eat in America,NHANES 2001-2002: Usual Nutrient Intakes from Food Compared to Dietary Reference Intakes; United States Department of Agriculture, Agricultural Research Service: Washington, DC, USA, 2005. [Google Scholar]
- Moshfegh, A.; Goldman, J.; Ahuja, J.; Rhodes, D.; LaComb, R. What We Eat in America, NHANES 2005–2006, Usual Nutrient Intakes from Food and Water Compared to 1997 Dietary Reference Intakes for Vitamin D, Calcium, Phosphorus, and Magnesium; USDA Agricultural Research Service Beltsville Human Nutrition Research Center Food Surveys Research Group: Washington, DC, USA, 2009. [Google Scholar]
- Clark, M.A.; Fox, M.K. Nutritional quality of the diets of US public school children and the role of the school meal programs. J. Am. Diet. Assoc. 2009, 109, S44–S56. [Google Scholar] [CrossRef]
- Affenito, S.G.; Thompson, D.R.; Franko, D.L.; Striegel-Moore, R.H.; Daniels, S.R.; Barton, B.A.; Schreiber, G.B.; Schmidt, M.; Crawford, P.B. Longitudinal Assessment of Micronutrient Intake among African-American and White Girls: The National Heart, Lung, and Blood Institute Growth and Health Study. J. Am. Diet. Assoc. 2007, 107, 1113–1123. [Google Scholar] [CrossRef]
- Dietary Guidelines Advisory Committee, Report of the Dietary Guidelines Advisory Committee on the Dietary Guidelines for Americans to the Secretary of Agriculture and the Secretary of Health and Human Services; U.S. Department of Agriculture, Agricultural Research Service: Washington, DC, USA, 2010.
- Welch, A.A.; Fransen, H.; Jenab, M.; Boutron-Ruault, M.C.; Tumino, R.; Agnoli, C.; Ericson, U.; Johansson, I.; Ferrari, P.; Engeset, D.; et al. Variation in intakes of calcium, phosphorus, magnesium, iron and potassium in 10 countries in the European Prospective Investigation into Cancer and Nutrition study. Eur. J. Clin. Nutr. 2009, 63 (Suppl. 4), S101–S121. [Google Scholar] [CrossRef]
- Gao, X.; Wilde, P.E.; Lichtenstein, A.H.; Tucker, K.L. Meeting adequate intake for dietary calcium without dairy foods in adolescents aged 9 to 18 years (National Health and Nutrition Examination Survey 2001-2002). J. Am. Diet. Assoc. 2006, 106, 1759–1765. [Google Scholar] [CrossRef]
- Zive, M.M.; Nicklas, T.A.; Busch, E.C.; Myers, L.; Berenson, G.S. Marginal vitamin and mineral intakes of young adults: The Bogalusa Heart Study. J. Adolesc. Health 1996, 19, 39–47. [Google Scholar] [CrossRef]
- Kersting, M.; Alexy, U.; Sichert-Hellert, W. Dietary intake and food sources of minerals in 1 to 18 year old German children and adolescents. Nutr. Res. 2001, 21, 607–616. [Google Scholar] [CrossRef]
- Song, W.O.; Schuette, L.K.; Huang, Y.L.; Hoerr, S. Food Group Intake Patterns in Relation to Nutritional Adequacy of Young Adults. Nutr. Res. 1996, 16, 1507–1519. [Google Scholar] [CrossRef]
- Obarzanek, E.; Schreiber, G.B.; Crawford, P.B.; Goldman, S.R.; Barrier, P.M.; Frederick, M.M.; Lakatos, E. Energy intake and physical activity in relation to indexes of body fat: The National Heart, Lung, and Blood Institute Growth and Health Study. Am. J. Clin. Nutr. 1994, 60, 15–22. [Google Scholar]
- NHLBI Growth and Health Study Research Group. Obesity and cardiovascular disease risk factors in black and white girls: The NHLBI Growth and Health Study. Am. J. Public Health 1992, 82, 1613–1620. [CrossRef]
- Schakel, S.F.; Sievert, Y.A.; Buzzard, I.M. Sources of data for developing and maintaining a nutrient database. J. Am. Diet. Assoc. 1988, 88, 1268–1271. [Google Scholar]
- Cook, A.; Friday, J. Pyramid Servings Database for USDA Survey Food Codes,version 2.0; USDA Agricultural Research Service, Community Nutrition Research Group: Beltsville, MD, USA, 2004. Available online: http://www.barc.usda.gov/bhnrc/cnrg (accessed on 2 November 2012).
- Kimm, S.Y.; Glynn, N.W.; Kriska, A.M.; Fitzgerald, S.L.; Aaron, D.J.; Similo, S.L.; McMahon, R.P.; Barton, B.A. Longitudinal changes in physical activity in a biracial cohort during adolescence. Med. Sci. Sports Exerc. 2000, 32, 1445–1454. [Google Scholar] [CrossRef]
- Kimm, S.Y.; Glynn, N.W.; Kriska, A.M.; Barton, B.A.; Kronsberg, S.S.; Daniels, S.R.; Crawford, P.B.; Sabry, Z.I.; Liu, K. Decline in physical activity in black girls and white girls during adolescence. N. Engl. J. Med. 2002, 347, 709–715. [Google Scholar] [CrossRef]
- Ainsworth, B.E.; Haskell, W.L.; Leon, A.S.; Jacobs, D.R., Jr.; Montoye, H.J.; Sallis, J.F.; Paffenbarger, R.S., Jr. Compendium of physical activities: Classification of energy costs of human physical activities. Med. Sci. Sports Exerc. 1993, 25, 71–80. [Google Scholar] [CrossRef]
- Drewnowski, A.; Fulgoni, V., III. Nutrient profiling of foods: Creating a nutrient-rich food index. Nutr. Rev. 2008, 66, 23–39. [Google Scholar] [CrossRef]
- Cole, N.; Fox, M.K. Diet Quality of American School-Age Children by School Lunch Participation Status: Data National Health and Nutrition Examination Survey, 1999–2004; U.S. Department of Agriculture, Food and Nutrition Service, Office of Research, Nutrition and Analysis: Alexandria, VA, USA, 2008. [Google Scholar]
- Weinberg, L.G.; Berner, L.A.; Groves, J.E. Nutrient contributions of dairy foods in the United States, Continuing Survey of Food Intakes by Individuals, 1994-1996, 1998. J. Am. Diet. Assoc. 2004, 104, 895–902. [Google Scholar] [CrossRef]
- Cheng, S.; Lyytikainen, A.; Kroger, H.; Lamberg-Allardt, C.; Alen, M.; Koistinen, A.; Wang, Q.J.; Suuriniemi, M.; Suominen, H.; Mahonen, A.; et al. Effects of calcium, dairy product, and vitamin D supplementation on bone mass accrual and body composition in 10-12-y-old girls: A 2-y randomized trial. Am. J. Clin. Nutr. 2005, 82, 1115–1126. [Google Scholar]
- Moore, L.L.; Bradlee, M.L.; Gao, D.; Singer, M.R. Effects of average childhood dairy intake on adolescent bone health. J. Pediatr. 2008, 153, 667–673. [Google Scholar] [CrossRef]
- Kerstetter, J.E. Do dairy products improve bone density in adolescent girls? Nutr. Rev. 1995, 53, 328–332. [Google Scholar] [CrossRef]
- Holick, M.F. Vitamin D deficiency. N. Engl. J. Med. 2007, 357, 266–281. [Google Scholar] [CrossRef]
- Whiting, S.J.; Healey, A.; Psiuk, S.; Mirwald, R.; Kowalski, K.; Bailey, D. Relationship between carbonated and other low nutrient dense beverages and bone mineral content of adolescents. Nutr. Res. 2001, 21, 1107–1115. [Google Scholar] [CrossRef]
- Gordon, C.M.; DePeter, K.C.; Feldman, H.A.; Grace, E.; Emans, S.J. Prevalence of vitamin D deficiency among healthy adolescents. Arch. Pediatr. Adolesc. Med. 2004, 158, 531–537. [Google Scholar] [CrossRef]
- Cashman, K.D.; Hill, T.R.; Cotter, A.A.; Boreham, C.A.; Dubitzky, W.; Murray, L.; Strain, J.; Flynn, A.; Robson, P.J.; Wallace, J.M.; et al. Low vitamin D status adversely affects bone health parameters in adolescents. Am. J. Clin. Nutr. 2008, 87, 1039–1044. [Google Scholar]
- Teegarden, D.; Lyle, R.M.; McCabe, G.P.; McCabe, L.D.; Proulx, W.R.; Michon, K.; Knight, A.P.; Johnston, C.C.; Weaver, C.M. Dietary calcium, protein, and phosphorus are related to bone mineral density and content in young women. Am. J. Clin. Nutr. 1998, 68, 749–754. [Google Scholar]
- O’Neil, C.E.; Zanovec, M.; Keast, D.R.; Fulgoni, V.L., III; Nicklas, T.A. Nutrient contribution of total and lean beef in diets of US children and adolescents: National Health and Nutrition Examination Survey 1999-2004. Meat Sci. 2011, 87, 250–256. [Google Scholar] [CrossRef]
- Shaikh, U.; Byrd, R.S.; Auinger, P. Vitamin and mineral supplement use by children and adolescents in the 1999-2004 National Health and Nutrition Examination Survey: Relationship with nutrition, food security, physical activity, and health care access. Arch. Pediatr. Adolesc. Med. 2009, 163, 150–157. [Google Scholar] [CrossRef]
- Poppitt, S.D.; Swann, D.; Black, A.E.; Prentice, A.M. Assessment of selective under-reporting of food intake by both obese and non-obese women in a metabolic facility. Int. J. Obes. Relat. Metab. Disord. 1998, 22, 303–311. [Google Scholar]
© 2012 by the authors; licensee MDPI, Basel, Switzerland. This article is an open-access article distributed under the terms and conditions of the Creative Commons Attribution license (http://creativecommons.org/licenses/by/3.0/).
Share and Cite
Moore, L.L.; Singer, M.R.; Qureshi, M.M.; Bradlee, M.L.; Daniels, S.R. Food Group Intake and Micronutrient Adequacy in Adolescent Girls. Nutrients 2012, 4, 1692-1708. https://doi.org/10.3390/nu4111692
Moore LL, Singer MR, Qureshi MM, Bradlee ML, Daniels SR. Food Group Intake and Micronutrient Adequacy in Adolescent Girls. Nutrients. 2012; 4(11):1692-1708. https://doi.org/10.3390/nu4111692
Chicago/Turabian StyleMoore, Lynn L., Martha R. Singer, M. Mustafa Qureshi, M. Loring Bradlee, and Stephen R. Daniels. 2012. "Food Group Intake and Micronutrient Adequacy in Adolescent Girls" Nutrients 4, no. 11: 1692-1708. https://doi.org/10.3390/nu4111692