Systematic Review on Polyphenol Intake and Health Outcomes: Is there Sufficient Evidence to Define a Health-Promoting Polyphenol-Rich Dietary Pattern?

 , ,
, ,  ,
,  , ,
, ,  ,
, 
Abstract
:1. Introduction
1.1. Search Strategy and Study Selection
1.2. Data Extraction
2. Results
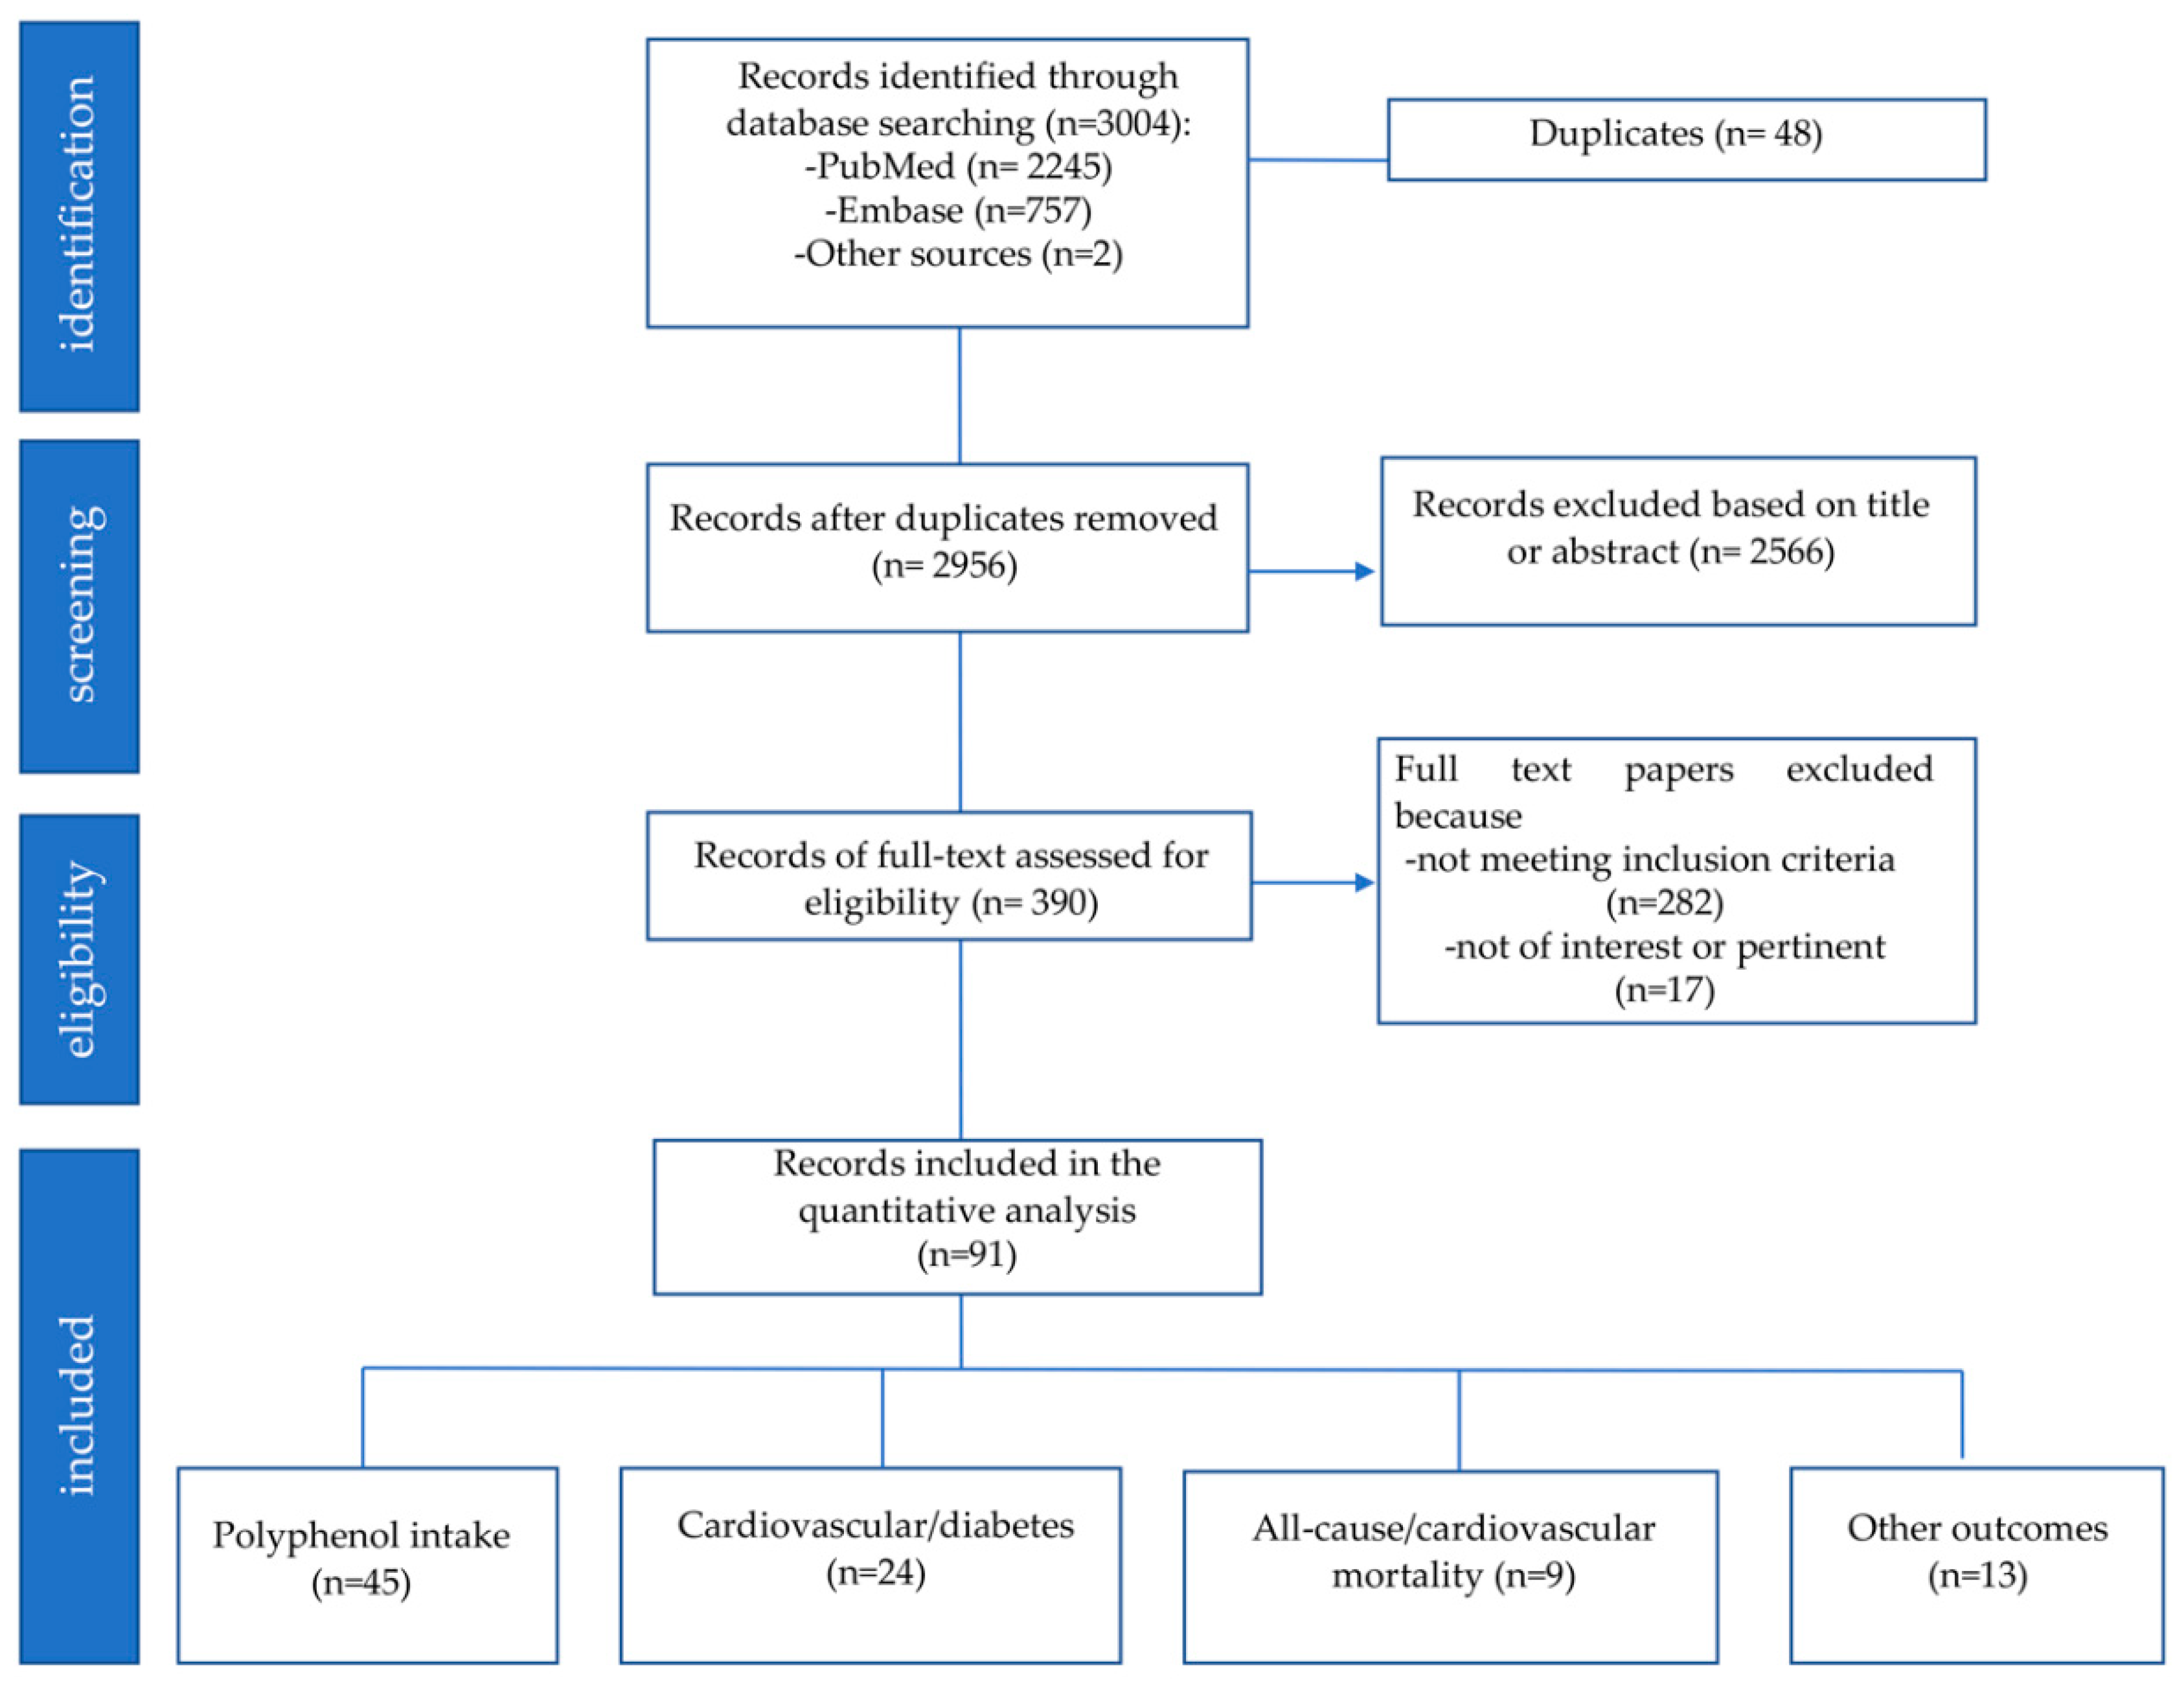
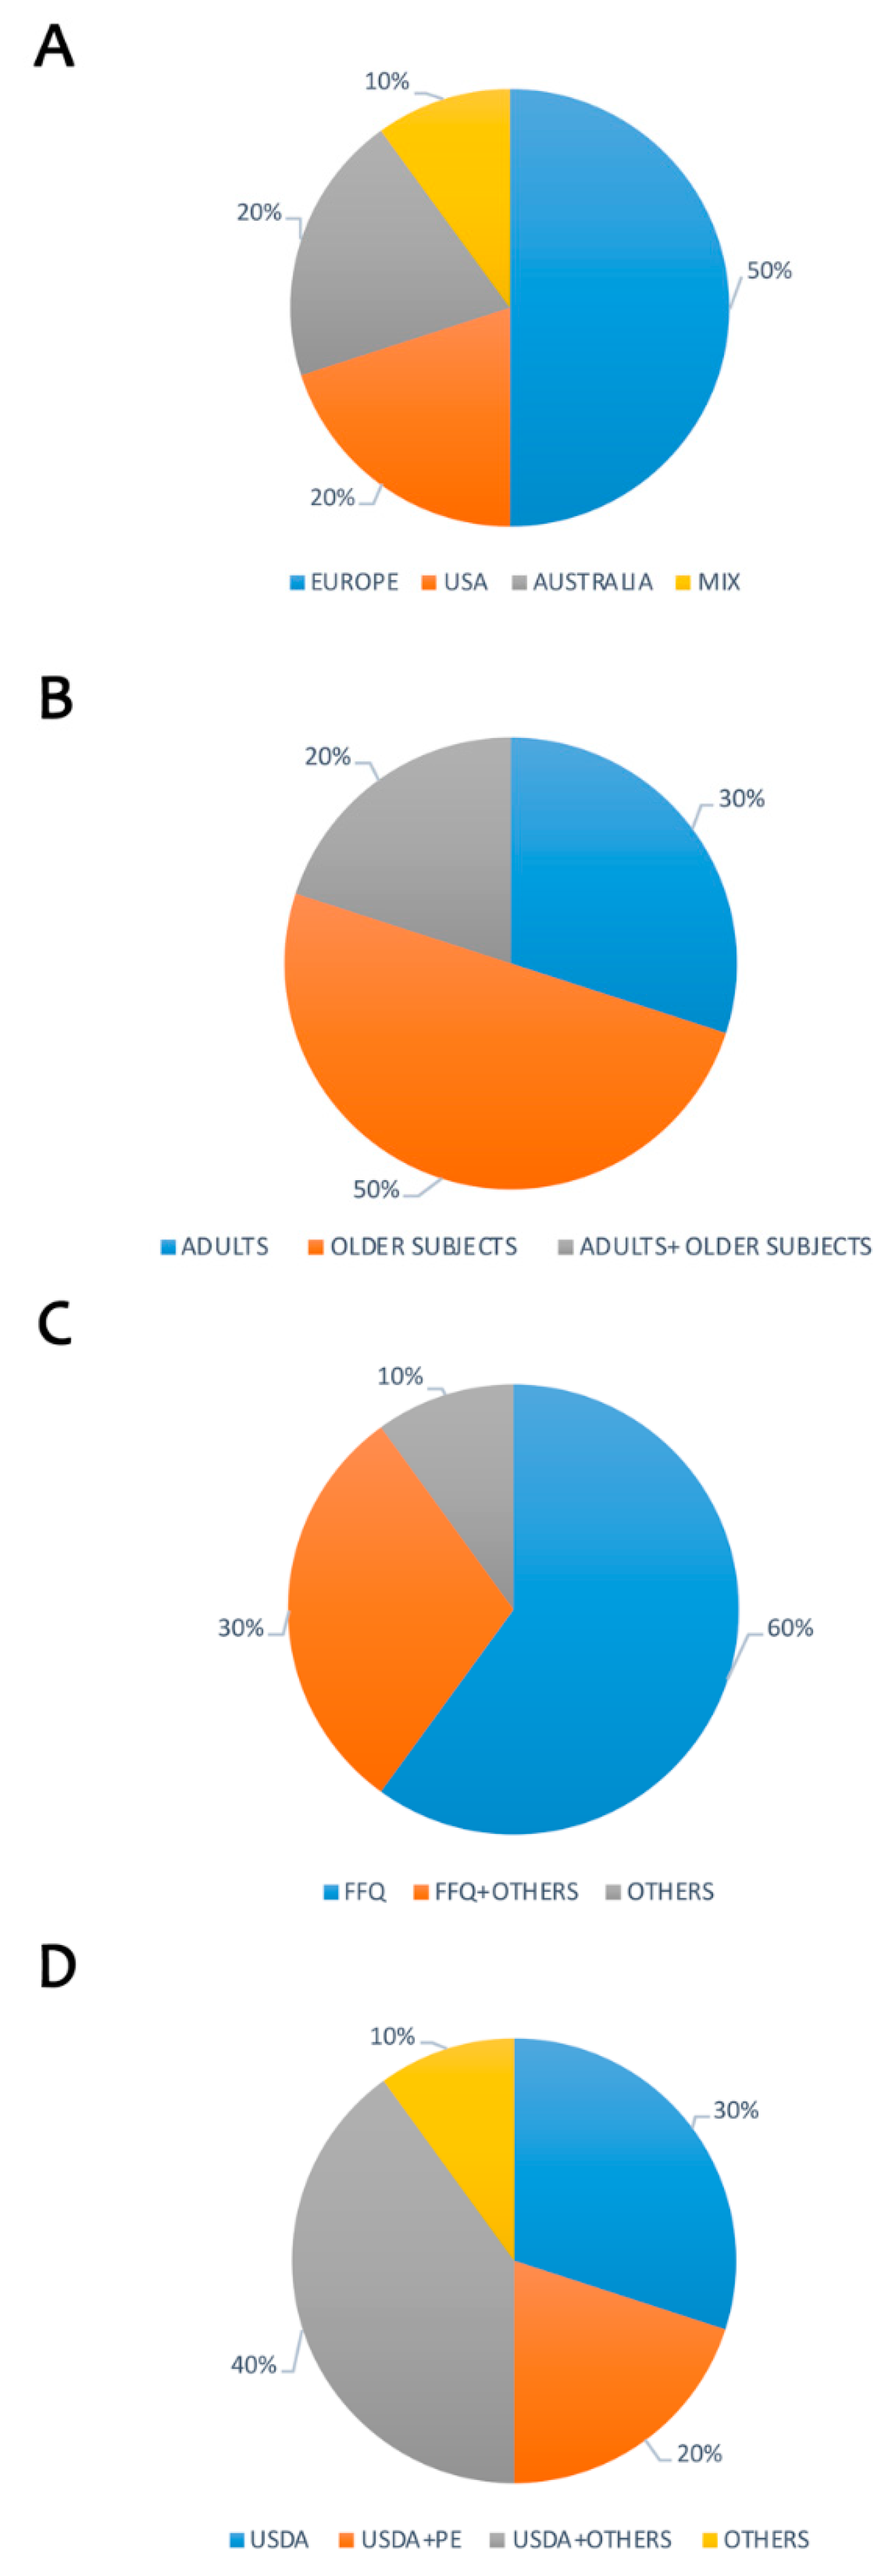
2.1. Study Selection
2.2. Study Characteristics
2.3. Dietary Intake of Polyphenols
2.4. Polyphenol Intake and Cardiovascular Diseases/Diabetes Risk
2.5. Polyphenols Intake and all-Cause/Cardiovascular Mortality
2.6. Polyphenols Intake and other Outcomes
3. Discussion
4. Conclusions
Author Contributions
Funding
Acknowledgments
Conflicts of Interest
References
- Chong, P.Y.Y.; Ho, S.C.; Kreiger, N.; Murphy, P.A.; So, E.K.F.; Chan, S.G.; Darlington, G. Isoflavonoid content of Hong Kong soy foods. J. Agric. Food Chem. 2009, 57, 5386–5390. [Google Scholar]
- Arts, C.; Hollman, P.C.H. Polyphenols and disease risk in epidemiologic studies. Am. J. Clin. Nutr. 2005, 81, 317S–325S. [Google Scholar] [CrossRef] [PubMed] [Green Version]
- Cherniack, E.P. Polyphenols and Aging. Mol. Basis Nutr. Aging Vol. Mol. Nutr. Ser. 2016, 3, 649–657. [Google Scholar]
- Spencer, J.P.E.; Abd El Mohsen, M.M.; Minihane, A.M.; Mathers, J.C. Biomarkers of the intake of dietary polyphenols: Strengths, limitations and application in nutrition research. Br. J. Nutr. 2008, 99, 12–22. [Google Scholar] [CrossRef] [PubMed]
- Song, W.O.; Chun, O.K. Tea is the major source of flavan-3-ol and flavonol in the U.S. diet. J. Nutr. 2008, 138, 1543S–1547S. [Google Scholar] [CrossRef] [PubMed]
- Ilow, R.; Regulska-Ilow, B.; Walkiewicz, G.; Biernat, J.; Kowalisko, A. Evaluation of bioflavonoid intake in the diets of 50-year-old inhabitants of wrocław. Adv. Clin. Exp. Med. 2008, 17, 327–336. [Google Scholar]
- Otaki, N.; Kimira, M.; Katsumata, S.; Uehara, M.; Watanabe, S.; Suzuki, K. Distribution and major sources of flavonoid intakes in the middle-aged Japanese women. J. Clin. Biochem. Nutr. 2009, 44, 231–238. [Google Scholar] [CrossRef] [PubMed]
- Chun, O.K.; Floegel, A.; Chung, S.-J.; Chung, C.E.; Song, W.O.; Koo, S.I. Estimation of antioxidant intakes from diet and supplements in U.S. adults. J. Nutr. 2009, 140, 317–324. [Google Scholar] [CrossRef] [PubMed]
- Yang, J.; Zhang, Y.; Chang, P.; Hao, D.; Cao, J.; Zhang, Y.; Zhao, X.; Chen, W. Reproducibility and relative validity of a food frequency questionnaire to assess intake of dietary flavonol and flavone in Chinese university campus population. Nutr. Res. 2010, 30, 520–526. [Google Scholar]
- Zhang, Y.; Li, Y.; Cao, C.; Cao, J.; Chen, W.; Zhang, Y.; Wang, C.; Wang, J.; Zhang, X.; Zhao, X. Dietary flavonol and flavone intakes and their major food sources in Chinese adults. Nutr. Cancer 2010, 62, 1120–1127. [Google Scholar] [CrossRef]
- Hanna, K.L.; O’Neill, S.; Lyons-Wall, P.M. Intake of isoflavone and lignan phytoestrogens and associated demographic and lifestyle factors in older Australian women. Asia Pac. J. Clin. Nutr. 2010, 19, 540–549. [Google Scholar] [PubMed]
- Pérez-Jiménez, J.; Fezeu, L.; Touvier, M.; Arnault, N.; Manach, C.; Hercberg, S.; Galan, P.; Scalbert, A. Dietary intake of 337 polyphenols in French adults 1–3. Am. J. Clin. Nutr. 2011, 93, 1220–1228. [Google Scholar] [CrossRef] [PubMed]
- Zamora-Ros, R.; Knaze, V.; Luján-Barroso, L.; Slimani, N.; Romieu, I.; Fedirko, V.; De Magistris, M.S.; Ericson, U.; Amiano, P.; Trichopoulou, A.; et al. Estimated dietary intakes of flavonols, flavanones and flavones in the European prospective investigation into cancer and nutrition (EPIC) 24 hour dietary recall cohort. Br. J. Nutr. 2011, 106, 1915–1925. [Google Scholar] [CrossRef] [PubMed]
- Wang, Y.; Chung, S.-J.; Song, W.O.; Chun, O.K. Estimation of daily proanthocyanidin intake and major food sources in the U.S. diet. J. Nutr. 2011, 141, 447–452. [Google Scholar] [CrossRef] [PubMed]
- Knaze, V.; Zamora-Ros, R.; Luján-Barroso, L.; Romieu, I.; Scalbert, A.; Slimani, N.; Riboli, E.; Van Rossum, C.T.M.; Bueno-De-Mesquita, H.B.; Trichopoulou, A.; et al. Intake estimation of total and individual flavan-3-ols, proanthocyanidins and theaflavins, their food sources and determinants in the European prospective investigation into cancer and nutrition (EPIC) study. Br. J. Nutr. 2012, 108, 1095–1108. [Google Scholar] [CrossRef]
- Zamora-Ros, R.; Knaze, V.; Luján-Barroso, L.; Slimani, N.; Romieu, I.; Touillaud, M.; Kaaks, R.; Teucher, B.; Mattiello, A.; Grioni, S.; et al. Estimation of the intake of anthocyanidins and their food sources in the European prospective investigation into cancer and nutrition (EPIC) study. Br. J. Nutr. 2011, 106, 1090–1099. [Google Scholar] [CrossRef] [PubMed]
- Beking, K.; Vieira, A. An assessment of dietary flavonoid intake in the UK and Ireland. Int. J. Food Sci. Nutr. 2011, 62, 17–19. [Google Scholar] [CrossRef]
- Ilow, R.; Regulska-Ilow, B.; Rózańska, D.; Misiewicz, D.; Grajeta, H.; Kowalisko, A.; Biernat, J. Assessment of dietary flavonoid intake among 50-year-old inhabitants of Wroclaw in 2008. Adv. Clin. Exp. Med. 2012, 21, 353–362. [Google Scholar]
- Zujko, M.E.; Witkowska, A.M.; Waœkiewicz, A.; Sygnowska, E. Estimation of dietary intake and patterns of polyphenol consumption in Polish adult population. Adv. Med. Sci. 2012, 57, 375–384. [Google Scholar] [CrossRef]
- Lee, H.S.; Cho, Y.H.; Park, J.; Shin, H.R.; Sung, M.K. Dietary intake of phytonutrients in relation to fruit and vegetable consumption in Korea. J. Acad. Nutr. Diet. 2013, 113, 1194–1199. [Google Scholar] [CrossRef]
- Zamora-Ros, R.; Knaze, V.; Romieu, I.; Scalbert, A.; Slimani, N.; Clavel-Chapelon, F.; Touillaud, M. Impact of thearubigins on the estimation of total dietary flavonoids in the European prospective investigation into cancer and nutrition (EPIC) study. Eur. J. Clin. Nutr. 2019, 67, 779–782. [Google Scholar] [CrossRef] [PubMed]
- Tresserra-Rimbau, A.; Medina-Remón, A.; Pérez-Jiménez, J.; Martínez-González, M.A.; Covas, M.I.; Corella, D.; Salas-Salvadó, J.; Gómez-Gracia, E.; Lapetra, J.; Arós, F.; et al. Dietary intake and major food sources of polyphenols in a Spanish population at high cardiovascular risk: The PREDIMED study. Nutr. Metab. Cardiovasc. Dis. 2013, 23, 953–959. [Google Scholar] [CrossRef] [PubMed]
- Vogiatzoglou, A.; Heuer, T.; Mulligan, A.A.; Lentjes, M.A.H.; Luben, R.N.; Kuhnle, G.G.C. Estimated dietary intakes and sources of flavanols in the German population (German National Nutrition Survey II). Eur. J. Nutr. 2013, 53, 635–643. [Google Scholar] [CrossRef] [PubMed]
- Grosso, G.; Stepaniak, U.; Topor-Madry, R.; Szafraniec, K.; Pajak, A. Estimated dietary intake and major food sources of polyphenols in the Polish arm of the HAPIEE study. Nutrition 2014, 30, 1398–1403. [Google Scholar] [CrossRef] [PubMed] [Green Version]
- Witkowska, A.M.; Zujko, M.E.; Waśkiewicz, A.; Terlikowska, K.M.; Piotrowski, W. Comparison of various databases for estimation of dietary polyphenol intake in the population of polish adults. Nutrients 2015, 7, 9299–9308. [Google Scholar] [CrossRef] [PubMed]
- Kim, Y.J.; Park, M.Y.; Chang, N.; Kwon, O. Intake and major sources of dietary flavonoid in Korean adults: Korean national health and nutrition examination survey 2010–2012. Asia Pac. J. Clin. Nutr. 2015, 24, 456–463. [Google Scholar] [PubMed]
- Zamora-Ros, R.; Knaze, V.; Rothwell, J.A.; Hémon, B.; Moskal, A.; Overvad, K.; Tjønneland, A.; Kyrø, C.; Fagherazzi, G.; Boutron-Ruault, M.C.; et al. Dietary polyphenol intake in Europe: The European prospective investigation into cancer and nutrition (EPIC) study. Eur. J. Nutr. 2016, 55, 1359–1375. [Google Scholar] [CrossRef] [PubMed]
- Vogiatzoglou, A.; Mulligan, A.A.; Lentjes, M.A.H.; Luben, R.N.; Spencer, J.P.E.; Schroeter, H.; Khaw, K.T.; Kuhnle, G.G.C. Flavonoid intake in European adults (18 to 64 Years). PLoS ONE 2015, 10, e0128132. [Google Scholar] [CrossRef]
- Sebastian, R.S.; Enns, C.W.; Goldman, J.D.; Martin, C.L.; Steinfeldt, L.C.; Murayi, T.; Moshfegh, A.J. A new database facilitates characterization of flavonoid intake, sources, and positive associations with diet quality among US adults. J. Nutr. 2015, 145, 1239–1248. [Google Scholar] [CrossRef]
- Kozlowska, A.; Przekop, D.; Szostak-Wegierek, D. Flavonoids intake among Polish and Spanish students. Rocz. Panstw. Zakl. Hig. 2015, 66, 319–325. [Google Scholar]
- Zujko, M.E.; Witkowska, A.M.; Waskiewicz, A.; Mirończuk-Chodakowska, I. Dietary Antioxidant and Flavonoid Intakes Are Reduced in the Elderly. Oxid. Med. Cell. Longev. 2015, 2015, 843173. [Google Scholar] [CrossRef] [PubMed]
- Taguchi, C.; Fukushima, Y.; Kishimoto, Y.; Suzuki-Sugihara, N.; Saita, E.; Takahashi, Y.; Kondo, K. Estimated dietary polyphenol intake and major food and beverage sources among elderly Japanese. Nutrients 2015, 7, 10269–10281. [Google Scholar] [CrossRef] [PubMed]
- Sun, C.; Wang, H.; Wang, D.; Chen, Y.; Zhao, Y.; Xia, W. Using an FFQ to assess intakes of dietary flavonols and flavones among female adolescents in the Suihua area of northern China. Public Health Nutr. 2015, 18, 632–639. [Google Scholar] [CrossRef] [PubMed]
- Kim, K.; Vance, T.M.; Chun, O.K. Estimated intake and major food sources of flavonoids among US adults: Changes between 1999–2002 and 2007–2010 in NHANES. Eur. J. Nutr. 2016, 55, 833–843. [Google Scholar] [CrossRef] [PubMed]
- Burkholder-Cooley, N.; Rajaram, S.; Haddad, E.; Fraser, G.E.; Jaceldo-Siegl, K. Comparison of polyphenol intakes according to distinct dietary patterns and food sources in the Adventist Health Study-2 cohort. Br. J. Nutr. 2016, 115, 2162–2169. [Google Scholar] [CrossRef]
- Pounis, G.; Costanzo, S.; Donati, M.B.; de Gaetano, G.; Iacoviello, L.; Bonaccio, M.; Persichillo, M.; Di Castelnuovo, A.; Krogh, V. Flavonoid and lignan intake in a Mediterranean population: Proposal for a holistic approach in polyphenol dietary analysis, the Moli-sani Study. Eur. J. Clin. Nutr. 2015, 70, 338–345. [Google Scholar] [CrossRef]
- Ivey, K.L.; Croft, K.; Prince, R.L.; Hodgson, J.M. Comparison of flavonoid intake assessment methods. Food Funct. 2016, 7, 3748–3759. [Google Scholar] [CrossRef]
- Godos, J.; Marventano, S.; Mistretta, A.; Galvano, F.; Grosso, G. Dietary sources of polyphenols in the mediterranean healthy eating, aging and lifestyle (MEAL) study cohort. Int. J. Food Sci. Nutr. 2017, 68, 750–756. [Google Scholar] [CrossRef]
- Miranda, A.M.; Steluti, J.; Fisberg, R.M.; Marchioni, D.M. Dietary intake and food contributors of polyphenols in adults and elderly adults of Sao Paulo: A population-based study. Br. J. Nutr. 2016, 115, 1061–1070. [Google Scholar] [CrossRef]
- Burkholder-Cooley, N.M.; Rajaram, S.S.; Haddad, E.H.; Oda, K.; Fraser, G.E.; Jaceldo-Siegl, K. Validating polyphenol intake estimates from a food-frequency questionnaire by using repeated 24-h dietary recalls and a unique method-of-triads approach with 2 biomarkers. Am. J. Clin. Nutr. 2017, 105, 685–694. [Google Scholar] [CrossRef] [Green Version]
- Bawaked, R.A.; Schröder, H.; Barba, L.R.; Cárdenas, G.; Rodrigo, C.P.; Peña-Quintana, L.; Fíto, M.; Majem, L.S. Dietary flavonoids of Spanish youth: Intakes, sources, and association with the Mediterranean diet. PeerJ 2017, 5, e3304. [Google Scholar] [CrossRef]
- Zamora-Ros, R.; Biessy, C.; Rothwell, J.A.; Monge, A.; Lajous, M.; Scalbert, A.; López-Ridaura, R.; Romieu, I. Dietary polyphenol intake and their major food sources in the Mexican teachers’ cohort. Br. J. Nutr. 2018, 120, 353–360. [Google Scholar] [CrossRef] [PubMed]
- Ziauddeen, N.; Rosi, A.; Del Rio, D.; Amoutzopoulos, B.; Nicholson, S.; Page, P.; Scazzina, F.; Brighenti, F.; Ray, S.; Mena, P. Dietary intake of (poly)phenols in children and adults: Cross-sectional analysis of UK national diet and nutrition survey rolling programme (2008–2014). Eur. J. Nutr. 2018. [Google Scholar] [CrossRef] [PubMed]
- Karam, J.; Del Mar Bibiloni, M.; Tur, J.A. Polyphenol estimated intake and dietary sources among older adults from Mallorca Island. PLoS ONE 2018, 13, e0191573. [Google Scholar] [CrossRef] [PubMed]
- Rossi, M.C.; Bassett, M.N.; Sammán, N.C. Dietary nutritional profile and phenolic compounds consumption in school children of highlands of Argentine Northwest. Food Chem. 2018, 238, 111–116. [Google Scholar] [CrossRef] [PubMed]
- Wisnuwardani, R.W.; Marcos, A.; Kersting, M.; Sjöström, M.; Widhalm, K.; Moreno, L.A.; Forsner, M.; Michels, N.; Rothwell, J.A.; Androutsos, O.; et al. Estimated dietary intake of polyphenols in European adolescents: The HELENA study. Eur. J. Nutr. 2018. [Google Scholar] [CrossRef] [PubMed]
- Kent, K.; Charlton, K.E.; Lee, S.; Mond, J.; Russell, J.; Mitchell, P.; Flood, V.M. Dietary flavonoid intake in older adults: How many days of dietary assessment are required and what is the impact of seasonality? Nutr. J. 2018, 17, 7. [Google Scholar] [CrossRef]
- Vitale, M.; Bianchini, F.; Turco, A.A.; Barrea, A.; Riccardi, G.; Mannucci, E.; Fornengo, P.; Giorgino, F.; Romeo, F.; Santini, C.; et al. Dietary intake and major food sources of polyphenols in people with type 2 diabetes: The TOSCA.IT Study. Eur. J. Nutr. 2018, 57, 679–688. [Google Scholar] [CrossRef]
- Nascimento-Souza, M.A.; de Paiva, P.G.; Pérez-Jiménez, J.; do Carmo Castro Franceschini, S.; Ribeiro, A.Q. Estimated dietary intake and major food sources of polyphenols in elderly of Viçosa, Brazil: A population-based study. Eur. J. Nutr. 2018, 57, 617–627. [Google Scholar] [CrossRef]
- Huffman, F.; Vaccaro, J.; Zarini, G.; Dixon, Z. Dietary intake of flavonoids and HDL- and LDL- cholesterol in two black ethnicities with and without type 2 diabetes. Int. J. Cardiovasc. Res. 2012, 7, 1–7. [Google Scholar]
- Pellegrini, N.; Valtueña, S.; Ardigò, D.; Brighenti, F.; Franzini, L.; Del Rio, D.; Scazzina, F.; Piatti, P.M.; Zavaroni, I. Intake of the plant lignans matairesinol, secoisolariciresinol, pinoresinol, and lariciresinol in relation to vascular inflammation and endothelial dysfunction in middle age-elderly men and post-menopausal women living in Northern Italy. Nutr. Metab. Cardiovasc. Dis. 2010, 20, 64–71. [Google Scholar] [CrossRef] [PubMed]
- Jacques, P.F.; Cassidy, A.; Rogers, G.; Peterson, J.J.; Dwyer, J.T. Dietary flavonoid intakes and CVD incidence in the Framingham offspring cohort. Br. J. Nutr. 2015, 114, 1496–1503. [Google Scholar] [CrossRef] [PubMed]
- Yeon, J.Y.; Bae, Y.J.; Kim, E.Y.; Lee, E.J. Association between flavonoid intake and diabetes risk among the Koreans. Clin. Chim. Acta 2015, 439, 225–230. [Google Scholar] [CrossRef] [PubMed]
- Oh, J.S.; Kwon, O.; Vijayakumar, A.; Kim, H.; Kim, Y.; Chang, N. Association of dietary flavonoid intake with prevalence of type 2 diabetes mellitus and cardiovascular disease risk factors in Korean women aged ≥30 years. J. Nutr. Sci. Vitaminol. Nutr. Sci. Vitaminol. 2017, 63, 51–58. [Google Scholar] [CrossRef] [PubMed]
- Goetz, M.E.; Judd, S.E.; Hartman, T.J.; McClellan, W.; Anderson, A.; Vaccarino, V. Flavanone intake is inversely associated with risk of incident ischemic stroke in the reasons for geographic and racial differences in stroke (REGARDS) study. J. Nutr. 2016, 146, 2233–2243. [Google Scholar] [CrossRef] [PubMed]
- Goetz, M.S.M.; Hartman, T.; Vaccarino, V.; Judd, S.; McClellan, W.M. Dietary flavonoid intake and incident coronary heart disease in the reasons for geographic and racial differences in stroke study (REGARDS). Ann. Epidemiol. 2015, 25, 715. [Google Scholar] [CrossRef]
- Miranda, A.M.; Steluti, J.; Fisberg, R.M.; Marchioni, D.M. Association between polyphenol intake and hypertension in adults and older adults: A population-based study in Brazil. PLoS ONE 2016, 11, e0165791. [Google Scholar] [CrossRef]
- Cassidy, A.; Bertoia, M.; Chiuve, S.; Flint, A.; Forman, J.; Rimm, E.B. Habitual intake of anthocyanins and flavanones and risk of cardiovascular disease in men. Am. J. Clin. Nutr. 2016, 104, 587–594. [Google Scholar] [CrossRef] [Green Version]
- Kim, K.; Vance, T.M.; Chun, O.K. Greater flavonoid intake is associated with improved CVD risk factors in US adults. Br. J. Nutr. 2016, 115, 1481–1488. [Google Scholar] [CrossRef] [Green Version]
- Rizzi, F.; Conti, C.; Dogliotti, E.; Terranegra, A.; Salvi, E.; Braga, D.; Ricca, F.; Lupoli, S.; Mingione, A.; Pivari, F.; et al. Interaction between polyphenols intake and PON1 gene variants on markers of cardiovascular disease: A nutrigenetic observational study. J. Transl. Med. 2016, 14, 186. [Google Scholar] [CrossRef]
- Grosso, G.; Stepaniak, U.; Micek, A.; Kozela, M.; Stefler, D.; Bobak, M.; Pajak, A. Dietary polyphenol intake and risk of type 2 diabetes in the Polish arm of the health, alcohol and psychosocial factors in Eastern Europe (HAPIEE) study. Br. J. Nutr. 2017, 118, 60–68. [Google Scholar] [CrossRef] [PubMed]
- Cassidy, A.; Reilly, J.O.; Kay, C.; Sampson, L.; Franz, M.; Forman, J.P.; Curhan, G.; Rimm, E.B. Habitual intake of flavonoid subclasses and incident hypertension. Am. J. Clin. Nutr. 2010, 93, 338–347. [Google Scholar] [CrossRef] [PubMed]
- Witkowska, A.M.; Waśkiewicz, A.; Zujko, M.E.; Szcześniewska, D.; Pająk, A.; Stepaniak, U.; Drygas, W. Dietary polyphenol intake, but not the dietary total antioxidant capacity, is inversely related to cardiovascular disease in postmenopausal Polish women: Results of WOBASZ and WOBASZ II studies. Oxid. Med. Cell. Longev. 2017, 2017, 5982809. [Google Scholar] [CrossRef] [PubMed]
- Grosso, G.; Stepaniak, U.; Micek, A.; Stefler, D.; Bobak, M.; Pająk, A. Dietary polyphenols are inversely associated with metabolic syndrome in Polish adults of the HAPIEE study. Eur. J. Nutr. 2017, 56, 1409–1420. [Google Scholar] [CrossRef] [PubMed]
- Sohrab, G.; Somayeh, H.-N.; Parvin, M.; Ebrahimof, S.; Yuzbashian, E.; Fereidoun, A. Association of dietary intakes of total polyphenol and its subclasses with the risk of metabolic syndrome: Tehran lipid and glucose study. Metab. Syndr. Relat. Disord. 2018, 16, 274–281. [Google Scholar] [CrossRef] [PubMed]
- Mendonça, R.D.; Gea, A.; Martin-Moreno, J.M.; Martinez-Gonzalez, M.A.; Pimenta, A.M.; Carvalho, N.C.; Bes-Rastrollo, M.; Lopes, A.C.S. Total polyphenol intake, polyphenol subtypes and incidence of cardiovascular disease: The SUN cohort study. Nutr. Metab. Cardiovasc. Dis. 2018, 29, 69–78. [Google Scholar] [CrossRef]
- Wedick, N.M.; Pan, A.; Cassidy, A.; Rimm, E.B.; Sampson, L.; Rosner, B.; Willett, W.; Hu, F.B.; Sun, Q.; Van Dam, R.M. Dietary flavonoid intakes and risk of type 2 diabetes in US men and women. Am. J. Clin. Nutr. 2012, 95, 925–933. [Google Scholar] [CrossRef] [Green Version]
- Zamora-ros, R.; Forouhi, N.G.; Sharp, S.J.; Gonz, C.A.; Buijsse, B.; Guevara, M.; Schouw, Y.T.; Van Der Amiano, P.; Boeing, H.; Bredsdorff, L.; et al. Dietary intakes of individual flavanols and flavonols are inversely associated with incident type 2 diabetes in European populations. J. Nutr. 2013, 144, 335–344. [Google Scholar] [CrossRef]
- Zamora-Ros, R.; Forouhi, N.G.; Sharp, S.J.; González, C.A.; Buijsse, B.; Guevara, M.; Van Der Schouw, Y.T.; Amiano, P.; Boeing, H.; Bredsdorff, L.; et al. The association between dietary flavonoid and lignan intakes and incident type 2 diabetes in european populations: The EPIC-InterAct study. Diabetes Care 2013, 36, 3961–3970. [Google Scholar] [CrossRef]
- Jacques, P.F.; Cassidy, A.; Rogers, G.; Dwyer, J.T.; Meigs, J.B.; Peterson, J.J. Higher dietary flavonol intake is associated with lower incidence of type 2 diabetes. J. Nutr. 2013, 143, 1474–1480. [Google Scholar] [CrossRef]
- Tresserra-Rimbau, A.; Medina-Remón, A.; Salas-Salvadó, J.; Estruch, R.; Lamuela-Raventós, R.M.; Rimm, E.B.; Ruiz-Gutiérrez, V.; Corella, D.; Sorlí, J.V.; Vinyoles, E.; et al. Inverse association between habitual polyphenol intake and incidence of cardiovascular events in the PREDIMED study. Nutr. Metab. Cardiovasc. Dis. 2014, 24, 639–647. [Google Scholar] [CrossRef] [PubMed]
- Jennings, A.; Spector, T.; Cassidy, A.; Macgregor, A.; Welch, A.A. Intakes of anthocyanins and flavones are associated with biomarkers of insulin resistance and inflammation in women. J. Nutr. 2013, 144, 202–208. [Google Scholar] [CrossRef] [PubMed]
- Ponzo, V.; Goitre, I.; Fadda, M.; Gambino, R.; de Francesco, A.; Soldati, L.; Gentile, L.; Magistroni, P.; Cassader, M.; Bo, S. Dietary flavonoid intake and cardiovascular risk: A population-based cohort study. J. Transl. Med. 2015, 13, 218. [Google Scholar] [CrossRef] [PubMed]
- McCullough, M.L.; Peterson, J.J.; Patel, R.; Jacques, P.F.; Shah, R.; Dwyer, J.T. Flavonoid intake and cardiovascular disease mortality in a prospective cohort of US adults. Am. J. Clin. Nutr. 2012, 95, 454–464. [Google Scholar] [CrossRef] [PubMed]
- Zamora-ros, R.; Cherubini, A.; Urp, M.; Bandinelli, S.; Ferrucci, L.; Andres-lacueva, C. High concentrations of a urinary biomarker of polyphenol intake are associated with decreased mortality in older adults. J. Nutr. 2013, 143, 1445–1450. [Google Scholar] [CrossRef] [PubMed]
- Zamora-Ros, R.; Jiménez, C.; Cleries, R.; Agudo, A.; Sánchez, M.J.; Sánchez-Cantalejo, E.; Molina-Montes, E.; Navarro, C.; Chirlaque, M.D.; María Huerta, J.; et al. Dietary flavonoid and lignan intake and mortality in a Spanish cohort. Epidemiology 2013, 24, 726–733. [Google Scholar] [CrossRef] [PubMed]
- Ivey, K.L.; Lewis, J.R.; Prince, R.L.; Hodgson, J.M. Tea and non-tea flavonol intakes in relation to atherosclerotic vascular disease mortality in older women. Br. J. Nutr. 2013, 110, 1648–1655. [Google Scholar] [CrossRef] [PubMed] [Green Version]
- Ivey, K.L.; Hodgson, J.M.; Croft, K.D.; Lewis, J.R.; Prince, R.L. Flavonoid intake and all-cause mortality. Am. J. Clin. Nutr. 2015, 101, 1012–1020. [Google Scholar] [CrossRef] [PubMed] [Green Version]
- Dower, J.I.; Geleijnse, J.M.; Hollman, P.C.H.; Soedamah-Muthu, S.S.; Kromhout, D. Dietary epicatechin intake and 25-y risk of cardiovascular mortality: The zutphen elderly study. Am. J. Clin. Nutr. 2016, 104, 58–64. [Google Scholar] [CrossRef]
- Kerry, L.I.; Cassidy, A.; Eliassen, A.H.; Jensen, M.K.; Rimm, E.B.; Hodgson, J.M. Association of flavonoid-rich foods and flavonoids with risk of all-cause mortality. Br. J. Nutr. 2017, 117, 1470–1477. [Google Scholar] [Green Version]
- Zhang, F.F.; Haslam, D.E.; Terry, M.B.; Knight, J.A.; Andrulis, I.L.; Daly, M.B.; Buys, S.S.; John, E.M. Dietary isoflavone intake and all-cause mortality in breast cancer survivors: The breast cancer family registry. Cancer 2017, 123, 2070–2079. [Google Scholar] [CrossRef] [PubMed]
- Pounis, G.; Bonanni, A.; Galuppo, G.; Pampuch, A.; Olivieri, M.; Guszcz, T.; Sciarretta, A.; Centritto, V.; Spagnuolo, P.; Caccamo, S.; et al. Reduced mortality risk by a polyphenol-rich diet: An analysis from the Moli-sani study. Nutrition 2017, 48, 87–95. [Google Scholar] [CrossRef] [PubMed]
- Fisher, N.D.L.; Hurwitz, S.; Hollenberg, N.K. Habitual flavonoid intake and endothelial function in healthy humans. J. Am. Coll. Nutr. 2012, 31, 275–279. [Google Scholar] [CrossRef] [PubMed]
- Ivey, K.L.; Lewis, J.R.; Lim, W.H.; Lim, E.M.; Hodgson, J.M.; Prince, R.L. Associations of proanthocyanidin intake with renal function and clinical outcomes in elderly women. PLoS ONE 2013, 8, e71166. [Google Scholar] [CrossRef] [PubMed]
- Lefèvre-Arbogast, S.; Samieri, C.; Dartigues, J.-F.; Féart, C.; Letenneur, L.; Delcourt, C.; Bensalem, J.; Gaudout, D.; Hejblum, B.P. Pattern of polyphenol intake and the long-term risk of dementia in older persons. Neurology 2018, 90, e1979–e1988. [Google Scholar] [CrossRef] [PubMed] [Green Version]
- Segovia-Siapco, G.; Pribis, P.; Oda, K.; Sabaté, J. Soy isoflavone consumption and age at pubarche in adolescent males. Eur. J. Nutr. 2018, 57, 2287–2294. [Google Scholar] [CrossRef] [PubMed]
- Rabassa, M.; Cherubini, A.; Raul, Z.-R.; Urpi-Sarda, M.; Bandinelli, S.; Ferrucci, L.; Andres-Lacueva, C. Low levels of a urinary biomarker of dietary polyphenol are associated with substantial cognitive decline over a 3-year period in older adults: The invecchiare in chianti study. J. Am. Geriatr. Soc. 2015, 63, 938–946. [Google Scholar] [CrossRef]
- Zhang, Z.-Q.; Su, Y.-X.; Liu, Y.-h.; He, L.-P.; Chen, Y.-M.; Liu, J. Association between dietary intake of flavonoid and bone mineral density in middle aged and elderly Chinese women and men. Osteoporos. Int. 2014, 25, 2417–2425. [Google Scholar] [CrossRef]
- Urpi-Sarda, M.; Andres-Lacueva, C.; Rabassa, M.; Ruggiero, C.; Zamora-Ros, R.; Bandinelli, S.; Ferrucci, L.; Cherubini, A. The relationship between urinary total polyphenols and the frailty phenotype in a community-dwelling older population: The InCHIANTI Study. J. Gerontol. Ser. Biol. Sci. Med. Sci. 2015, 70, 1141–1147. [Google Scholar] [CrossRef]
- Myers, G.; Prince, R.L.; Kerr, D.A.; Devine, A.; Woodman, R.J.; Lewis, J.R.; Hodgson, J.M. Tea and flavonoid intake predict osteoporotic fracture risk in elderly Australian women: A prospective study. Am. J. Clin. Nutr. 2015, 102, 958–965. [Google Scholar] [CrossRef]
- Ma, Y.; Gao, W.; Wu, K.; Bao, Y. Flavonoid intake and the risk of age-related cataract in China’s Heilongjiang Province. Food Nutr. Res. 2015, 59, 29564. [Google Scholar] [CrossRef] [PubMed]
- Rabassa, M.; Zamora-Ros, R.; Andres-Lacueva, C.; Urpi-Sarda, M.; Bandinelli, S.; Ferrucci, L.; Cherubini, A. Association between both total baseline urinary and dietary polyphenols and substantial physical performance decline risk in older adults: A 9-year follow-up of the InCHIANTI study. J. Nutr. Health Aging 2016, 20, 478–485. [Google Scholar] [CrossRef] [PubMed]
- Garcia-Larsen, V.; Janson, C.; Niżankowska-Mogilnicka, E.; Makowska, J.; Keil, T.; Potts, J.; Charles, D.; Brożek, G.; Matricardi, P.; van Zele, T.; et al. Dietary intake of flavonoids and ventilatory function in European adults: A GA2LEN study. Nutrients 2018, 10, 95. [Google Scholar] [CrossRef] [PubMed]
- Gopinath, B.; Liew, G.; Kifley, A.; Flood, V.M.; Joachim, N.; Lewis, J.R.; Hodgson, J.M.; Mitchell, P. Dietary flavonoids and the prevalence and 15-y incidence of age-related macular degeneration. Am. J. Clin. Nutr. 2018, 108, 381–387. [Google Scholar] [CrossRef] [PubMed]
- Pounis, G.; Costanzo, S.; de Gaetano, G.; Donati, M.B.; Bonaccio, M.; Persichillo, M.; Di Castelnuovo, A.; Iacoviello, L.; Arcari, A. Favorable association of polyphenol-rich diets with lung function: Cross-sectional findings from the Moli-sani study. Respir. Med. 2018, 136, 48–57. [Google Scholar] [CrossRef] [PubMed] [Green Version]
- Rothwell, J.A.; Knaze, V.; Zamora-Ros, R. Polyphenols: Dietary assessment and role in the prevention of cancers. Curr. Opin. Clin. Nutr. Metab. Care 2017, 20, 512–521. [Google Scholar] [CrossRef] [PubMed]
- Grosso, G.; Godos, J.; Lamuela-Raventos, R.; Ray, S.; Micek, A.; Pajak, A.; Sciacca, S.; D’Orazio, N.; Del Rio, D.; Galvano, F. A comprehensive meta-analysis on dietary flavonoid and lignan intake and cancer risk: Level of evidence and limitations. Mol. Nutr. Food Res. 2017, 61, 1600930. [Google Scholar] [CrossRef]
- Wang, Z.J.; Ohnaka, K.; Morita, M.; Toyomura, K.; Kono, S.; Ueki, T.; Tanaka, M.; Kakeji, Y.; Maehara, Y.; Okamura, T.; et al. Dietary polyphenols and colorectal cancer risk: The Fukuoka colorectal cancer study. World J. Gastroenterol. 2013, 19, 2683–2690. [Google Scholar] [CrossRef]
- Tse, G.; Eslick, G.D. Soy and isoflavone consumption and risk of gastrointestinal cancer: A systematic review and meta-analysis. Eur. J. Nutr. 2016, 55, 63–73. [Google Scholar] [CrossRef]
- Hui, C.; Qi, X.; Qianyong, Z.; Xiaoli, P.; Jundong, Z.; Mantian, M. Flavonoids, flavonoid subclasses and breast cancer risk: A meta-analysis of epidemiologic studies. PLoS ONE 2013, 8, e54318. [Google Scholar] [CrossRef]
- Cui, L.; Liu, X.; Tian, Y.; Xie, C.; Li, Q.; Cui, H.; Sun, C. Flavonoids, flavonoid subclasses, and esophageal cancer risk: A meta-analysis of epidemiologic studies. Nutrients 2016, 8, 350. [Google Scholar] [CrossRef] [PubMed]
- Ivey, K.L.; Hodgson, J.M.; Croft, K.D.; Lewis, J.R.; Prince, R.L.; Urpi-sarda, M.; Andres-Lacueva, C.; Ruggiero, C.; Zamora-Ros, R.; Bandinelli, S.; et al. Comparison of various databases for estimation of dietary polyphenol intake in the population of polish adults. Am. J. Clin. Nutr. 2015, 102, 10269–10281. [Google Scholar]
- Arranz, S.; Silva, J.M.; Saura-Calixto, F. Nonextractable polyphenols, usually ignored, are the major part of dietary polyphenols: A study on the Spanish diet. Mol. Nutr. Food Res. 2010, 54, 1646–1658. [Google Scholar] [CrossRef] [PubMed] [Green Version]
- González-Sarrías, A.; Espín, J.C.; Tomás-Barberán, F.A. Non-extractable polyphenols produce gut microbiota metabolites that persist in circulation and show anti-inflammatory and free radical-scavenging effects. Trends Food Sci. Technol. 2017, 69, 281–288. [Google Scholar] [CrossRef]
- García-Conesa, M.-T.; Kontogiorgis, C.; Andrés-Lacueva, C.; Ristic, A.K.; Pinto, P.; Combet, E.; Rai, D.; Morand, C.; Istas, G.; Gibney, E.; et al. Meta-analysis of the effects of foods and derived products containing ellagitannins and anthocyanins on cardiometabolic biomarkers: Analysis of factors influencing variability of the individual responses. Int. J. Mol. Sci. 2018, 19, pii–E694. [Google Scholar] [CrossRef] [PubMed]
- Feliciano, R.P.; Pritzel, S.; Heiss, C.; Rodriguez-Mateos, A. Flavonoid intake and cardiovascular disease risk. Curr. Opin. Food Sci. 2015, 2, 92–99. [Google Scholar] [CrossRef]
- Wang, X.; Ouyang, Y.Y.; Liu, J.; Zhao, G. Flavonoid intake and risk of CVD: A systematic review and meta-analysis of prospective cohort studies. Br. J. Nutr. 2014, 111, 1–11. [Google Scholar] [CrossRef]
- Grosso, G.; Micek, A.; Godos, J.; Pajak, A.; Sciacca, S.; Galvano, F.; Giovannucci, E.L. Dietary flavonoid and lignan intake and mortality in prospective cohort studies: Systematic review and dose-response meta-analysis. Am. J. Epidemiol. 2017, 185, 1304–1316. [Google Scholar] [CrossRef]
- Rienks, J.; Barbaresko, J.; Nöthlings, U. Association of polyphenol biomarkers with cardiovascular disease and mortality risk: A systematic review and meta-analysis of observational studies. Nutrients 2017, 9, 415. [Google Scholar] [CrossRef]
- Williamson, G.; Holst, B. Dietary reference intake (DRI) value for dietary polyphenols: Are we heading in the right direction? Br. J. Nutr. 2008, 99, 55–58. [Google Scholar] [CrossRef]

| Reference by Year | Population Characteristics | Country | Dietary Assessment n° Food Containing Items | Polyphenol Database n° Food Items | Estimated Intake (mg/day) mean/median/min-max | Polyphenol Main Subclasses Intake (mg/day or percentage) mean ± ds/median/min-max | Main Dietary Sources (Based on % Contribution) | Overall Results |
|---|---|---|---|---|---|---|---|---|
| Song et al. [5] | 8809 subjects (NHANES 1999–2000 and 2001–2002) W = 4348 M = 4461 Age = >19 year | US | 1 24-h DR | USDA Database (1,2) | Total flavonoids Mean intake = 189.7 ± 11.6 | Flavan3-ols Mean intake = 156.5 ± 11.3 Flavanones Mean intake = 14.4 ± 0.6 Flavanols Mean intake = 12.9 ± 0.4 Anthocyanidins Mean intake = 3.1 ± 0.5 Flavones Mean intake = 1.6 ± 0.2 Isoflavones Mean intake = 1.2 ± 0.2 | Tea (82.8%) Citrus juices (4.3%) Wine (2.1%) Citrus fruits (1.8%) | Different total flavonoids intake was observed between tea consumers (21% of the population) and tea non-consumers (697.9 vs. 32.6 mg/day respectively) with flavonols and flavan-3-ols as main compounds |
| Ilow et al. [6] | 203 subjects W = 121 M = 82 Age = 50 year | Poland | FFQs 48 food items | USDA database (1) | Total flavonoids (median) M+F = 610.8 M = 612.0 F = 609.2 | n.a. | Tea Fruit Vegetable | The flavonoid intake in tea was the same in women as in men. Tea flavonoids constituted about 96% of all the consumed flavonoids in this population |
| Otaki et al. [7] | 514 subjects W = all M = 0 Age = 58 ± 10 year | Japan | 1 24-h WDR | FFF (functional food factor) database | Total polyphenols- | * Total flavanols Mean = 1277 ± 1403 * Total isoflavones Mean = 215.7 ± 147.3 * Total flavonols Mean = 58.4 ± 62.7 * Total flavanones Mean = 30.5 ± 145.8 * Total flavones Mean = 15 ± 51.6 * data expressed in µmol/d | Green tea Onion Soy processed food (tofu, natto and miso) | The study showed higher total flavonoid intake compared to previous studies performed in the Japanese population. The sources of flavonoids differed from those of Western countries. Green tea, soy foods and onion constituted the main sources of flavan-3-ols, isoflavones and flavonols, respectively. Grapefruits and citrus fruits were the main sources of flavanones, while Malabar spinach, green peppers and grapefruits the main sources of flavones |
| Chun et al. [8] | 8809 subjects NHANES 1999–2000 (n = 4175) and 2001–2002 (n = 4634) W = 4348 M = 4461 Age = >19 year | US | 1 24-h DR | USDA Database (1,2) | Total flavonoids (1999–2000) Mean intake = 209.8 ± 18.9 Total flavonoids (2001–2002) Mean intake = 204.5 ± 14.5 | n.a. | Tea (76.8%) Citrus fruit juice (3.7%) Beers and ales (2.9%) Wine (2.4%) Citrus fruit (1.7%) Melon and berries (1.4%) Other vegetables (1.4%) | Daily intake of flavonoids was dependent on sociodemographic characteristics and lifestyle behaviors. Daily flavonoid intake was provided mainly by teas (i.e., catechins) |
| Yang et al. [9] | 128 subjects W = n.a. M = n.a. Age = 20–28 year | China | 2 sFFQs 126 food items 2 7-day 24-h DRs (used to validate FFQs data) | Specifically developed database * | Total flavonoids (FFQ1) Mean intake = 45.39 ± 25.52 Total flavonoids (FFQ2) Mean intake = 46.94 ± 27.72 Total flavonoids (24-h DRs) Mean intake = 50.15 ± 35.83 | FFQ 1 data: Total flavonol Mean intake = 34.74 ± 18.80 Total flavone Mean intake = 10.65 ± 7.02 FFQ 2 data: Total flavonol Mean intake = 35.75 ± 20.45 Total flavone Mean intake = 11.19 ± 7.57 24-h DRs data: Total flavonol Mean intake = 38.37 ± 28.59 Total flavone Mean intake = 11.78 ± 8.45 | n.a. | The FFQ used had reasonable reproducibility (measured 1 year apart) and validity to estimate dietary intake of flavonols (quercetin, kaempferol, isorhamnetin) and flavones (apigenin, luteolin) in the Chinese population, as compared to the other type of assessment methods |
| Zhang et al. [10] | 5046 subjects W = 2910 M = 2136 Age = 18–72 year | China | 2 sFFQs 126 food items 2 7-day 24-h DRs (used to validate FFQs data) | Specifically developed database * | Total flavonols-Flavones Mean intake = 19.13 ± 8.28 | Flavonols Mean intake Quercetin = 5.96 ± 3.09 Kaempferol = 4.14 ±1.95 Myricetin = 1.81 ± 1.24 Isorhamnetin = 2.34 ± 1.48 Flavones Mean intake Apigenin = 1.06 ± 0.56 Luteolin = 3.82 ± 1.88 | Apple (12%) Potato (8%) Celery (7%) Eggplant (7%) Actinidia (5%) | The total intake of flavonols and flavones was higher in men than in women. Gender and above all age were independent predictors for total flavonols and flavones intake. Main food sources were vegetables (61%) and fruits (36%) while tea was only a minor source |
| Hanna et al. [11] | 551 subjects W = 551 M = 0 Age = 40–79 year | Australia | Phytoestrogen frequency questionnaire 112-item | USDA and specific literature | Total isoflavones-lignans Mean = 8.44 ± 17.03 Median intake = 2.2 Min and max = 0.44–174 | Total isoflavones Mean = 4.5 ± 10.07 Median = 0.03 Min and max = 0–98 Total Lignans Mean = 2.71 ± 3.04 Median intake = 1.83 Min and max = 0.16–33 | Soy and soy product (tofu, miso, soy grits or cereal) | Isoflavone intake was significantly different depending on age, i.e., 40–49 years and 50–59 years age groups introduced higher isoflavone amount compared to 60–69 years and 70–79 years age groups. There was no significant difference in lignan intake among age groups |
| Péréz-Jimenéz et al. [12] | 4942 subjects (SU.VI.MAX cohort 1994.1995) W = 2346 M = 2596 Age = 45–60 year | France | 6 24-h DRs 736 food items | Phenol Explorer | Total polyphenols Mean intake = 1193 ± 510 Median intake = 1123 | Flavonoids Mean intake = 506 ± 219 Phenolic acids Mean intake = 639 ± 273 | Non-alcoholic beverages (55.2%) Fruit (17.3%) Alcoholic beverages (8.3%) Cocoa products (7.5%) Vegetables (6.8%) Cereals (3.9%) | Total polyphenol intake was higher in men than in women. Age had no significant influence on intake. Three beverages Coffee, tea, and red wine accounted for 44%, 9%, and 6% of the total polyphenol intake while fruit, cocoa products, vegetables, and cereals for 17%, 8%, 7%, and 4% of the total polyphenol intake confirming data from other Western populations |
| Zamora-Ros et al. [13] | 36,037 subjects (EPIC cohort) W = 23,009 M = 13,028 Age = 35–74 year | 10 European countries | 1 24-h DR (EPIC-SOFT) | USDA database expanded with Phenol Explorer 1877 food items | Total flavonols-flavanones-flavones Mean intake ± SEM = 66.76 ± 0.89 W = 70.32 ± 0.65 Min W = 37.2 mg/day (Sweden) Min M = 36.7 mg/day (Sweden) Max W = 97.0 mg/day (UK) Max M = 130.9 mg/day (UK) | Flavonols Min = 38.5% (South) Max = 47.4% (North) Flavanones Min = 46.6% (UK) Max = 52.9% (South) Flavones Min = 5.8% (North) Max = 8.6%. (South) | Citrus fruits Citrus-based juices Tea Wine Fruits Vegetables | A large variation in flavanols, flavanones and flavones intake across European regions was registered Overall, flavanones were the main compounds introduced and UK health-conscious group the highest consumers. The total intake was higher in women and dependent on sociodemographic and lifestyle factors. Main food sources differed being juices and tea intake higher in the north while citrus fruit, juices, vegetables and wine in the south |
| Wang et al. [14] | 8809 subjects NHANES 1999–2000 (n = 4175) and 2001–2002 (n = 4634) W = 4348 M = 4461 Age = >19 year | US | 1 24-h DR | USDA Database (3) | Total proanthocyanidins (1999–2000) Mean intake (PI) = 88.8 ± 6.3 Total proanthocyanidins (2001–2002) Mean intake (PII) = 100.0 ± 4.2 | Monomers Mean intakePI = 20.9 ± 1.5 PII = 20.7 ± 1.4 Dimers Mean intake PI = 15.0 ± 1.0 PII = 15.9 ± 1.1 Trimers Mean intake PI = 4.7 ± 0.3 PII = 5.3 ± 0.2 4–6mers Mean intake PI = 13.5 ± 1.2 PII = 15.7 ± 0.5 7–10mers Mean intake PI = 9.4 ± 0.9 PII = 11.2 ± 0.5 Polymers Mean intake PI = 25.4 ± 2.8 PII = 31.4 ± 1.9 | Tea Legumes Wines | A south to north gradient intake was observed. In general, a mean intake of 95 mg/day was found represented by polymers (30%), monomers (22%), dimers (16%), 4–6 mers (15%), 7–10 mers (11%), and trimers (5%). After adjustment for energy intake, the PA intake increased with age, in women and in alcohol consumer. Tea, legumes, and wines, contributed to about 48% of daily PA intake |
| Knaze et al. [15] | 36,037 subjects (EPIC cohort) W = 23,009 M = 13,028 Age = 35–74 year | 10 European countries | 1 24-h DR (EPIC-SOFT) | USDA database Phenol Explorer 1877 food items | Total flavan-3-ols Mean intake ± SE MED countries = 268.8 ± 2.6 Non-MED countries = 274.7 ± 1.9 UK = 406.6 ± 7.6 Total monomers Mean intake ± SE MED countries = 90.2 ± 0.7 UK = 182.4 ± 3.0 Total proanthocyanidins (Mean intake ± SE MED countries = 217.2 ± 2.2 Non-MED countries = 177.9 ± 1.5 UK = 198.4 ± 6.3 Total theaflavins (Mean intake ± SE) MED countries = 1.6 ± 0.1 Non-MED countries = 6.5 ± 0.1 UK = 25.9 ± 0.3 | Flavan-3-ols subclasses: Flavan-3-ol monomers MED 18.6% non-MED 32.9% UK 44.9% PA or condensed tannins MED 80.8% non-MED 64.8% UK 48.8%; Theaflavins MED 0.6% non-MED 2.4% UK 6.4% | Tea Wine Fruits Pulses (UK) | Socio-demographic, anthropometric and lifestyle factors were associated with consumption of flavan-3-ols, PA and theaflavins. Differences among different countries were observed. Flavan-3-ol intake in the UK (health-conscious) was about 2-fold that of the MED countries and mainly due to tea providing theaflavins and epigallocatechins. Overall PA intake was higher in the MED countries, even if with large differences, and non-citrus fruit (i.e., apples and pears) and wine the main sources |
| Zamora-Ros et al. [16] | 36,037 subjects (EPIC cohort) W = 23,009 M = 13,028 Age = 35–74 year | 10 European countries of EPIC cohort | 1 24-h DR (EPIC-SOFT) | USDA database expanded with Phenol Explorer 1877 food items | Total anthocyanidin W: Mean ± SE = 33.52 ± 0.39 Max intake = 44.08 (Turin, Italy) Min intake = 18.73 (Granada, Spain) M: Mean ± SE = 29.44 ± 0.53 Max intake = 64.88 (Turin, Italy) Min intake = 19.83 (Bilthoven, The Netherlands) | Cyanidin Mean intake W = 15.09 ± 0.23 M = 12.01 ± 0.31 Delphinidin Mean intake W = 2.71 ± 0.09 M = 2.26 ± 0.13 Malvidin Mean intake W = 9.94 ± 0.18 M = 10.27 ± 0.25 Pelargonidin Mean intake W = 3.02 ± 0.09 M = 2.19 ± 0.12 Peonidin Mean intake W = 1.64 ± 0.04 M = 1.49 ± 0.05 Petunidin Mean intake W = 1.13 ± 0.02 M = 1.23 ± 0.03 | Fruits, nuts and seeds (38.1–61.2%) Wines (14.4–24.5%) Non-alcoholic beverages (15.8%) Vegetables (4.8–9.7%) | The highest total anthocyanidins (mainly cyanidins and malvidins). intake was recorded in the south European region. Women (central- southern regions) were the highest consumers. Main food sources were different depending on countries. Central and northern countries: non-citrus fruits (berries, apples and pears, and grapes), wine and non-alcoholic beverages (juices and soft drinks of anthocyanidin-rich fruits). Southern countries: wine, non-citrus fruits (grapes, stone fruits, apples and pears, and olives) and leafy vegetable. A possible underestimation of anthocyanidin intake have been hypothesized due to missing food composition data |
| Beking et al. [17] | Subjects = n.a. | UK Ireland | FAO Food Balance Sheets | USDA Database (1) Lacking data from literature | Total flavonoids Mean intake Ireland = 176.8 UK = 182.2 | Ireland (mean intake): Anthocyanidins = 60.3 Flavanols = 47.4 Flavanones = 29.0 Flavones = 5.8 Flavonols = 34.2 UK (mean intake): Anthocyanidins = 69.2 Flavanols = 52.4 Flavanones = 26.0 Flavones = 4.0 Flavonols = 30.3 | Grapes and oranges (41.6% UK, 34.9% Ireland) Beer and wine (8.8% UK, 12.8% Ireland) Apples and onions (6.8% UK, 6.5% Ireland) Tea (4.0% UK, 5.3% Ireland). | Estimated dietary intake of anthocyanidins, flavanones, flavanols, flavonols, flavones, and all five combined is similar in the UK and Ireland. Anthocyanidins and flavanols were about 65% of total intake. Data on flavones and flavonols were in line with those obtained in food intake surveys in UK and US. In general, as more types of food flavonoids are analyzed and included in food composition databases, intake estimates are expected to rise and to be more accurate |
| Ilow et al. [18] | 1520 subjects Cardiovascular Disease Prevention Program) W = 879 M = 641 Age = 49–50 year | Poland | FFQs 1 24-h DR | USDA Database (1) | Total flavonoids Mean intake W = 622.6 M = 616.9 | Flavan-3-ols W = 93.6% of total flavonoid M = 94.2% Flavonols W = 4.0% M = 4.2% Anthocyanidins W = 0.9% M = 1.1% Flavanones W = 0.9% M = 0.9% Flavones W = 0.1% M = 0.1% | Tea (93.6%, 94.2%) Fruits (2.2%, 1.6%) Vegetables (1.4%, 1.1%) Fruit juices (0.7%, 0.8%) Chocolate (0.1%, 0.1%) | A higher flavonoid intake was reported in comparison with other studies. Tea was the main food source of total flavonoids and mainly of flavan-3-ols intake (from tea, fruits, fruit juices, chocolate) |
| Zujko et al. [19] | 6661 subjects (Polish National Multicenter Health Survey, WOBASZ) W = 3529 M = 3132 Age = 20–74 year | Poland | 1 24-h DR | Database of polyphenol contents in food products (developed by the authors) 118 items | Total polyphenols Mean intake W = 10,311,054 (20–40 years) 1089 (41–60 years) 947 (61–74 years) M = 1172 1251 (20–40 years) 1183 (41–60 years) 1076 (61–74 years) | n.a. | Beverages (tea, coffee) Vegetables (potato) Fruits (apples) Cereals (white bread) | Polyphenol intake was about 1 g independently from gender and age and apparently similar to that of other countries. However, patterns of consumption were different depending on gender and age groups |
| Lee et al. [20] | 8502 subjects W = n.a. M = n.a. Age = >2 year | Korea | 1 24-h DR | Phytonutrient database (Korea National Academy of Agricultural Science) | Total polyphenols- | Subjects meeting the recommendations Anthocyanidins = 73 ± 4.8 Hesperitin = 25.4 ± 3.2 Catechin = 24.8 ± 1.4 Quercetin = 9.1 ± 0.3 Isoflavones = 25.8 ± 2.8 Gallic Acid = 18.9 ± 2.6 Subjects not meeting the recommendations: Anthocyanidins = 8.7 ± 0.3 Hesperitin = 3.5 ± 0.5 Catechin = 2.2 ± 0.2 Quercetin = 2.9 ± 0.1 Isoflavones = 5.4 ± 0.5 Gallic acid = 4.3 ± 0.7 | Fruits Onions Soybeans Nuts | Flavonoids (anthocyanidins, hesperitin, quercetin, catechin, and isoflavones), and one phenolic compound (gallic acid) were significantly higher among subjects who met the recommendations for fruit and vegetable consumption compared with those who did not |
| Zamora-Ros et al. [21] | 36,037 subjects (EPIC cohort) W = 23,009 M = 13,028 Age = 35–74 year | 10 European countries | 1 24-h DR (EPIC-Soft) | USDA database (1) | Total polyphenols- | Total thearubigins M: Min = 0.9 Max = 532.5 W: Min = 1.2 Max = 455.6 | Tea | Large differences in dietary thearubigins (TR) estimations intake across European countries; TR intake is low in Spanish men and high in men from UK; TR contributed < 5% to the total flavonoid intake in Greece, Spain and Italy while contributed 48% to the total flavonoids intake in UK |
| Tresserra-Rimbau et al. [22] | 7200 subjects (PREDIMED) W = n.a. M = n.a. Age = 55–80 year | Spain | FFQs | Phenol Explorer 137 foods item | Total polyphenols Mean intake = 820 ± 323 | Flavonoids = 443 ± 218 Phenolic acids = 304 ± 156 Other polyphenols = 71.2 ± 46.7 | Fruits (44%) non-alcoholic beverages i.e., coffee (55%), vegetables (12%) alcoholic beverages (10%) Olive oil (11%) | Coffee and fruits resulted the main sources of polyphenols even if olives and olive oil represented significant and peculiar Mediterranean dietary sources of polyphenols (i.e., hydroxycinnamic acids, other phenolic acids, lignans and other polyphenols) with respect to other countries |
| Vogiatzoglou et al. [23] | 15,371 subjects W = 8278 M = 7093 Age = 14–80 year | Germany | 1 24-h DR (EPIC-SOFT) | FLAVIOLA Database | Total polyphenols- | Total flavanols Mean intake = 385.9 Min = 195.8 Max = 840.7 Proanthocyanidins Mean intake = 196.4 Min = 138.7 Max = 300.3 Flavan-3-ol monomers Mean intake = 119.8 Min = 18.3 Max = 414.3 Theaflavins Mean intake = 69.7 Min = 38.8 Max = 126.1 | Data are referred to total flavanols: Pome fruits (27%) Black tea (25%) Non-alcoholic beverages (46%) Green/fruit herbal tea (10–16%) Berries (6%) | Women had slightly higher intakes of total flavanols than men in all age groups, except for the elderly. There was a steep age gradient with an increase in total flavanols, flavan-3-ol monomers, and theaflavins across the age groups. Proanthocyanidins were the main contributor of total flavanols in both men and women |
| Grosso et al. [24] | 10,477 subjects (HAPIEE study) W = 5340 M = 5137 Age = 45–69 year | Poland | FFQs 148 items | Phenol Explorer | Total polyphenols Mean intake = 1740.7 ± 630.2 Median intake = 1662.5 | Total flavonoids Mean intake = 897.6 ± 423.4 Total phenolic acids Mean intake = 800.2 ± 345.8 | Coffee (40%) Tea (27%) Chocolate (8%) | Intakes were slightly higher in men than in women, but when adjusted for energy intake, women had a higher intake of polyphenols than men. Age had significant influence on total and energy-adjusted polyphenol intake, being higher among younger participants |
| Witkowska et al. [25] | 6661 subjects W = 3529 M = 3132 Age = 20–74 year | Poland | 24-h DR | Phenol Explorer USDA database (1–3) | Total polyphenols Mean Intake = 989.3 ± 360 | Total flavonoids Mean Intake USDA = 524.6 ± 155 PE = 403.5 ± 150 Total phenolic acids Mean Intake USDA = n.a. PE = 556.3 ± 204 | Total polyphenols (PE): Non-alcoholic beverages (75%) Total flavonoids: Non-alcoholic beverages: (PE 78.5%) (USDA 90%) | Flavonoids estimated through various databases might substantially differ. The use of several databases can truly reflect the real intake but it will be difficult to comparison for which only one method has been used for calculations |
| Kim et al. [26] | 11,474 Subjects W = n.a. M = n.a. Age = ≥ 19 year | Korea | 1 24-h DR | USDA database (1) Korean-targeted flavonoid database | Total flavonoids Mean Intake ± SE = 96.6 ± 1.34 Median = 70.4 P10 – P90 = 22.8 – 192 | Total anthocyanidins Mean Intake ± SE = 26.4 ± 0.9 Median = 6.36 P10 – P90 = 0 – 68.1 Total flavanols Mean Intake ± SE = 25.5 ± 1.8 Median = 1.08 P10 – P90 = 0 – 43.2 Total flavanones Mean Intake ± SE = 8.15 ± 0.39 Median = 0P10 – P90 = 0 – 25.1 Total flavones Mean Intake ± SE = 0.87 ± 0.03 Median = 0.45 P10 – P90 = 0.13 – 1.86 Total flavonols Mean Intake ± SE = 24.6 ± 0.42 Median = 16.8 P10 – P90 = 4.88 – 50.2 Total isoflavones Mean Intake ± SE = 21.9 ± 0.39 Median = 12.1 P10 – P90 = 0.27 – 53.9 | Kimchi (traditional fermented vegetable product) (12%) Green tea (9%) Persimmon (7%) Soybean (7%) Onion (7%) Tofu (6%) Radish (5%) Tangerine (5%) Apple (4%) Pear (3%) | Total Flavonoid intake was lower in Korea than in western countries. A major difference came from tea intake and also by the lower flavonoid density of major sources (kimchi, persimmon, tangerine, onion, radish etc.) in Korea than those (tea, citrus fruit, apples, pears, wine, etc.) in western countries. Contrast the isoflavone intake was much higher than the estimates for western countries due to high intakes of soybeans, tofu, and fermented soy pastes |
| Zamora-Ros et al. [27] | 36,037 Subjects W = 23,009 M = 13,028 Age = 35–74 year | 10 European countries of EPIC cohort | 1 24-h DR | Phenol Explorer | Total polyphenols Mean intake ± SEW = 1192 ± 6 M = 1177 ± 8 highest in Denmark M = 1786 W = 1626 lowest in Greece M = 744 W = 584 | Total flavonoids: Mean intake ± SEW = 546 ± 4 M = 492 ± 5 Total phenolic acids Mean intake ± SEW = 625 ± 6 M = 593 ± 5 Total lignans Mean intake ± SEW = 3.6 ± 0.1 M = 2.5 ± 0.2 Total stilbenes Mean intake ± SEW = 2.4 ± 0.0 M = 3.0 ± 0.1 | MED countries: Coffee (36%) Fruits (25%) Wine (10%) Non-MED countries: Coffee (41%) Tea (17%) Fruits (13%) | Mean intake of polyphenols was three times higher in men from Denmark than in women from Greece. Stratifying by region, mean of total polyphenols intake was in non-MED countries due to the higher intake of phenolic acids. The study showed a large heterogeneity in both the nature of polyphenols and levels of intake across the countries due to different habits and socio-demographics status |
| Vogiatzoglou et al. [28] | 30,000 subjects W = n.a M = n.a Age = 18–64 year | 14 Countries | 2–7 24-h DR | FLAVIOLA Database | Total flavonoids: Mean Intake = 428 ± 49 central region = 506 ± 75 northern region = 348 ± 20 southern region = 301 ± 27 Median Intake = 164 ± 55 central region = 249 ± 87 northern region = 56 ± 22 southern region = 47 ± 7 | Theaflavins and thearubigins Mean intake = 168 ± 39 Median intake = 89 ± 38 Proanthocyanidins: Mean intake = 124 ± 7 Median intake = 27 ± 5 (Epi)catechin Mean intake = 24 ± 2Median intake = 7 ± 2 Gallated compounds Mean intake = 53 ± 12 Median intake = 28 ± 12 Anthocyanidins Mean intake = 19 ± 2 Median intake = 3 ± 1 Flavonols Mean intake = 23 ± 2 Median intake = 8 ± 2 Flavanones Mean intake = 14 ± 2 Median intake = 1 ± 0 Flavones Mean intake = 4 ± 1 Median intake = 1 ± 0 Flavonoids (monomeric) Mean intake = 136 ± 14 Median intake = 49 ± 15 | Non-alcoholic beverages Fruits | Large regional differences, both in the type of flavonoids consumed and the distribution of intake. Intakes of anthocyanidins (in particular cyanidin) and flavanones (in particular hesperetin) were highest in the Northern Region, in particular in Finland. Within the Central Region, there was also a large variability of intake between countries. While overall flavonoid intake in Ireland was the highest in Europe, the intake of anthocyanidins was the lowest overall, and intake of flavanones was also very low. France was included in the Southern Region as dietary intake was more comparable with intake in Italy and Spain. However, there are some important differences, and the intake of flavan-3-ols and anthocyanidins in France is considerably higher than in the other countries of the Southern Region |
| Sebastian et al. [29] | 5420 subjects W = 2758 M = 2662 Age = >20 year | USA | 1 24-h DR | USDA database (1) | Total flavonoids Mean intake = 251 ± 16.8 IQR = 18.8–272 W Mean intake = 241 ± 15.2 IQR = 16.3–272 M Mean intake = 263 ± 20.4 IQR = 20.4–271 | Mean intake: Total flavonols = 19.4 ± 0.91 IQR = 6.05–25.4 Total flavones = 0.9 ± 0.1 IQR = 0.1–1.1 Total flavanones = 13.1 ± 0.88 IQR = 0.00–5.15 Total isoflavones = 1.7 ± 0.3 IQR = 0–0 Total flavanols = 204 ± 15.6 IQR = 3.07–189 Total anthocyanidins = 11.6 ± 1.07 IQR = 0–9.92 | Tea (80%) Fruit Vegetables | A positive association between flavonoid intake and dietary quality suggest that a diet high in flavonoids is synonymous with greater compliance with national guidance. Individuals with higher flavonoids intake not only consume more fruit and vegetables but also eat more healthfully |
| Kozłowska et al. [30] | 151 subjects Polish = 91 Spanish = 60 Polish W = 74 M = 17 Spanish W = 36 M = 24 Total: W = 110 M = 41 Age = n.a. | PolandSpain | FFQs | USDA Database (1) | Total flavonoids Mean intake Polish students = 801 Spanish students = 297 | n.a. | Polish Students: Black and green tea Oranges Orange juice Spanish Students: Oranges Green tea Orange Juice | Flavonoid consumption in Polish students was more than two times higher than in the Spanish students. The main sources of flavonoids in Spanish and Polish diets were different as black tea in the Spanish group provided weekly about 236 mg of flavonoids, over 12 times less than in the Polish group. On the other hand, the Spanish diet was richer than the polish diet in sources of flavonoids such as oranges, chickpeas, dried parsley, onions, strawberries, almonds or pomelo |
| Zujko et al. [31] | 6661 subjects M = 3132 W = 3529 Age = 20–74 year | Poland | 1 24-h DR | Database developed by the authors | Total flavonoids Mean intake = 276 W (20–40 year) = 278 CI95% = 266–290 M (20–40 year) = 304CI95% = 291–317 W (41–60 year) = 275 CI95% = 264–286 M (41–60 year) = 291 CI95% = 279–311 W (61–74 year) = 238 CI95% = 227–249 M (61–74 year) = 268 CI95% = 256–280 | n.a. | Beverages (47%) Fruit and fruit jams (27%) Tea (22%) Vegetables (18%) Apples (12%) Coffee (8%) | The consumption of tea, coffee, and apples was associated with the largest contributions to the flavonoid content. In comparison to the young and middle age participants, the elderly consumed less beverages and vegetables with a lower level of flavonoids |
| Taguchi et al. [32] | 610 subjects M = 569 W = 41 Age = 52–89 year | Japan | FFQs | Database developed by the author | Total polyphenols Mean intake = 1492 ± 665 | n.a. | Coffee (43.2%) Green tea (26.6%) | The present study showed that a population of elderly Japanese (mostly men) consumed higher amounts of polyphenols than previous data in Japanese adults, and coffee and green tea were the largest sources of polyphenols in their daily life |
| Sun et al. [33] | 887 subjects W = 887 Age = 12–18 year | China | FFQs 4 24-h DR | Flavonoids database developed by the authors | Total flavonoids Mean intake = 20.60 ± 14.12 | Total flavonol = 16.29 ± 11.91 Quercetin = 5.51 ± 4.00 Kaempferol = 5.49 ± 3.68 Myrucetin = 2.29 ± 1.84 Isorhamntin = 3.00 ± 2.37 Total flavones = 4.31 ± 2.21 Luteolin = 3.27 ± 1.63 Apigenin = 1.03 ± 0.58 | Apple (11.7%) Potatoes (9.9%) Lettuce (7.3%) Oranges (7.0%) Chinese Cabbage (4.7%) Tomatoes (4.2%) Celery (4.2%) Soyabean Sprouts (4.2%) Leeks (3.9%) Aubergine (3.9%) | The dietary flavonoid intakes among female adolescents in the Suihua area were similar to those reported in previous studies. In the present study, apples, potatoes, lettuce, oranges, soyabean sprouts and leeks were the main food sources of flavonols, whereas tomatoes, aubergine, white radishes, celery and sweet potatoes were the main sources of flavones |
| Kim et al. [34] | 9801 subjects W = 5032 M = 4769 Age = >19 year | US | 2 24-h DR | USDA databases (1,2) | Total flavonoids Mean intake = 200.1 ± 8.9 | Total flavonols Mean intake = 15.9 ± 0.4 Total flavones Mean intake = 1.2 ± 0.1 Total flavanones Mean intake = 12.2 ± 0.5 Total flavanols Mean intake = 158.4 ± 8.5 Total anthocyanidins Mean intake = 11.5 ± 0.7 Total isoflavones Mean intake = 0.9 ± 0.1 | Tea Citrus fruit juices Berries Citrus fruit Wine Apples | Flavonoid intake increased with age from 19 to 30 years until 50–70 years in both men and women. After adjusting for energy intake, flavonoid density of women was greater than those of men (p < 0.0001). The difference of flavonoid density among ethnicity was reduced after adjusting for energy intake. Flavonoid density of alcohol non-consumer was greater than that of alcohol consumer (p < 0.05) |
| Burkholder-Cooley et al. [35] | 77,441 subjects W = 50,336 M = 27,105 Age = 57 year | USA Canada | FFQs | Phenol Explorer USDA database (1-2) | Total polyphenols Mean intake coffee consumers = 1370 ± 1069 non-coffee consumers = 541 ± 368 | Total flavonoids Mean intake non-coffee consumer = 305 ± 238 coffee consumer = 273 ± 213 Total phenolic acids Mean intake non-coffee consumers = 125 ± 106 coffee consumers = 986 ± 1030 | Coffee Fruit Vegetables Fruit juice Legumes (including soya) | Significant differences in mean adjusted total polyphenol intakes were observed between dietary patterns. 34% of the participants reported coffee consumption in the FFQ. In the group of non-coffee consumers vegans reported the highest intake of total polyphenols followed by pesco-vegetarians, lacto-ovo vegetarians, semi- vegetarians and non-vegetarians. In the group of coffee consumers non- vegetarians reporting the highest intakes, followed by vegans, semi-vegetarians, pesco-vegetarians and lacto-ovo-vegetarians |
| Pounis et al. [36] | 14,029 subjects W = 7048 M = 6981 Age = n.a. | Italy | EPIC-FFQs specifically adapted for the Italian population 164 food items | Eurofir-eBASIS USDA database | Total polyphenols - | Median intake: Total flavonols = 17.0 Total flavones = 0.7 Total flavanones = 32.4 Total flavanols = 51.2 Total anthocyanidins = 144 Total isoflavones = 23.5 Total lignans = 80 | Seasonal fruits Citrus fruits Leafy vegetable Grain Root vegetables Onions Garlic | Total energy intake was positively associated with the consumption of all polyphenol classes and sub-classes in both genders. Men or older participants seemed to have higher intakes of most of the polyphenols compared with women or younger participants. No significant sex difference was observed for lignans. Educational level did not account for differences in most of flavonoid and lignan intake among participants. No/former smokers presented higher intake of polyphenols. Participants with higher physical activity level consumed greater quantities of all classes of polyphenols |
| Ivey et al. [37] | 1063 subjects W = 1063 M = 0 Age = >75 year Mean age = 80 ± 3 year | Australia | sFFQs | Phenol Explorer USDA database (1–3) | Total flavonoids USDA database (1–3) Mean intake = 834 ± 394 PE Mean intake = 487 ± 243 | Total flavonols USDA = 30 ± 17 PE = 104 ± 61 Total flavanols USDA = 666 ± 345 PE = 327 ± 179 Total flavones USDA = 4 ± 3 PE = 13 ± 7 Total flavanones USDA = 40 ± 36 PE = 33 ± 31 Total anthocyanidins USDA = 88 ± 77 PE = 11 ± 11 | n.a. | The mean flavonol PE intake of the cohort was nearly 350% greater than the flavonol USDA estimate. This difference may be, in part, due to the fact that the PE database provides data for five additional groups of flavonol compounds which were not expressed in USDA. Furthermore, the USDA database does not include the flavonol content data of chocolate |
| Godos et al. [38] | 1937 subjects W = n.a. M = n.a. Age = >18 year | Italy | FFQs 110 food items | Phenol Explorer | Total polyphenols Mean intake = 663.7 ± 608.1 | Total flavonoids Mean intake = 258.7 ± 199.1 Total flavonols Mean intake = 57 ± 45.6 Total flavanols Mean intake = 93.9 ± 118.2 Total flavanones Mean intake = 37.9 ± 42.0 Total flavones Mean intake = 8.4 ± 10.2 Total anthocyanins Mean intake = 55.4 ± 55.3 Total isoflavones Mean intake = 4.0 ± 14.4 Total phenolic acids Mean intake = 362.7 ± 516.0 Total stilbenes Mean intake = 1.9 ± 3.5 Total lignans Mean intake = 2.8 ± 2.6 | Nuts (29%) Non-alcoholic beverages (23%) Fruits (20%) Vegetables (15%) Alcoholic beverages (7%) | Compared to other Mediterranean cohorts the main differences with all the other cohorts was the contribution of nuts. In this population nuts were among the main contributors of hydroxybenzoic acids, which in other cohorts were generally provided by tea and red wine. |
| Miranda et al. [39] | 1103 subjects W = 678 M = 425 Age = >20 year | Brazil | 1 24-h DR | Phenol Explorer | Total polyphenols Mean intake ± SE = 377.5 ± 15.3 Median intake = 300.3 IQR = 154.1–486.9 | Mean ± SE Phenolic acids = 284 ± 15.9 Hydroxycinnamic acids = 281.2 ± 15.9 Hydroxybenzoic acids = 3.4 ± 0.4 Flavonoids = 54.6 ± 3.5 Flavanones = 16.1 ± 1.9 Flavonols = 14.6 ± 0.9 Flavanols = 11.4 ± 0.8 Anthocyanins = 6.8 ± 1.1 Flavones = 3.6 ± 0.3 | Coffee (70.5%) Citrus fruit (4.6%) Tropical fruit (3.4%) | The polyphenol intake was three times lower than the estimated value compared with other countries probably due to sociodemographic differences and food choices. Older subjects (>60 y) consumed more flavonoids and tyrosol than adults (20–59 y) and also more fruits. |
| Burkholder-Cooley et al. [40] | 899 subjects W = 602 M = 297 Age = 58 ± 13.2 year | USA Canada | 24-h DR FFQs | Phenol Explorer USDA database (1,2) | Total polyphenols FFQs Mean intake = 717 ± 646 24-h DR Mean intake = 402 ± 345 | n.a. | Coffee Fruit juice | Beverages and fruit were key contributors to total daily polyphenol intake. Subjects could over-report the frequency of intake of fruit and fruit juice in the FFQ even if a positive correlation with 24-h DR is observed. |
| Bawaked et al. [41] | 3534 subjects W = 2015 M = 1509 Age = 2–24 year | Spain | 1 24-h DR | USDA database (1) Phenol Explorer | Total Flavonoids Mean intake = 70.7 ± 84.1 Median intake = 48.1 25th–75th percentile = 19.3–93.1 | Total flavonols Mean intake = 15.6 ± 30.6 Median intake = 5.9 25th–75th percentile = 1.8–17.2 Total flavones Mean intake = 2.2 ± 9.1 Median intake = 0.3 25th–75th percentile = 0.0–1.1 Total flavanones Mean intake = 19.7 ± 34.1 Median intake = 0.1 25th–75th percentile = 0.0–28.1 Total flavan-3-ols Mean intake = 25.2 ± 47.1 Median intake = 14.1 25th–75th percentile = 4.7–28.1 Total anthocyanins Mean intake = 7.7 ± 27.1 Median intake = 0.3 25th–75th percentile = 0.0–4.2 Total isoflavones Mean intake = 0.1 ± 1.4 Median intake = 0.0 25th–75th percentile = 0.0–0.0 | Fruit (42.8%) Cocoa powder and chocolate (23.5%) Vegetables (spinach, onions, artichokes and lettuce) (22%) | Higher adherence to the Mediterranean diet was correlated with higher flavonoids intake. Fruits were the main source of dietary flavonoids |
| Zamora-Ros et al. [42] | 115,315 subjects W = 115,315 M = 0 Age = >25 year | Mexico | sFFQs 140 food items | Phenol Explorer | Total polyphenols Median intake = 694 Min and max = 536 and 750 25th–75th percentile = 413–1103 | Total flavonoids Median intake = 235 Min and max = 188–270 25th–75th percentile = 141–367 Total phenolic acid Median intake = 361 Min and max = 243 and 439 25th–75th percentile = 166–690 | Total polyphenol: Coffee (29%) Decaffeinated coffee (19%) Total flavonoids: Apple (19%) Orange and mandarins (13%) Orange juice (12%) | Large heterogeneity in intakes of individual polyphenols among Mexican women, but a moderate heterogeneity across Mexican states. Main food sources were also similar in the different states |
| Ziauddeen et al. [43] | 9374 subjects W = 5075 M = 4299 Children (age < 18 year) = 4636 Adults or older (age > 18 year) = 4738 Age > 1.5 year | UK | 4D-FR | Phenol Explorer | Total polyphenols Mean intake by age ranges = (1.5–3 year) = 266.6 ± 166.1 (4–10 year) = 388.8 ± 188.8 (11–18 year) = 455.0 ± 263.2 (19–34 year) = 635.9 ± 448.9 (35–49 year) = 846.1 ± 514.1 (50–64 year) = 1053.2 ± 545.3 (65+ year) = 1035.1 ± 544.3 | Total flavonoids (1.5–3 year) = 212.2 ± 151.7 (4–10 year) = 312.1 ± 170.3 (11–18 year) = 355.4 ± 230.9 (19–34 year) = 433.8 ± 335.1 (35–49 year) = 568.3 ± 398.2 (50–64 year) = 714.5 ± 415.2 (65+ year) = 716.2 ± 404.9 Phenolic acids (1.5–3 year) = 54.3 ± 24.8 (4–10 year) = 76.5 ± 43.2 (11–18 year) = 99.6 ± 63.4 (19–34 year) = 201.3 ± 228.5 (35–49 year) = 276.2 ± 232.6 (50–64 year) = 336.7 ± 292.0 (65+ year) = 317.6 ± 297.0 Stilbenes (1.5–3 year) = 0.1 ± 0.2 (4–10 year) = 0.1 ± 0.1 (11–18 year) = 0.1 ± 0.4 (19–34 year) = 0.8 ± 2.4 (35–49 year) = 1.6 ± 3.8 (50–64 year) = 1.9 ± 4.1 (65+ year) = 1.3 ± 3 | Non-alcoholic beverages Fruits | Polyphenol intake increased with age (p < 0.001) and was higher in males with exception of adults aged between 19–34 and 50–64 that showed higher levels in females |
| Karam et al. [44] | 211 subjects W = 112 M = 99 Age = 55–80 year | Spain | 2 24-h DR | Phenol Explorer USDA databases pecific literature. (449 food items; 245 polyphenol containing products considered) | Total polyphenols Mean intake = 332.7 ± 197.4 Median intake = 299.5 IQR = 250.4 Energy adjusted Mean intake = 187.5 ± 100.5 Median intake = 172.9 IQR = 140.3 | Flavonoids = 170.3 ± 144.4 Flavanols = 46.0 ± 57.7 Flavonols = 22.7 ± 29.9 Flavanones = 30.7 ± 50.6 Flavones = 10.7 ± 20.3 Anthocyanin = 36.7 ± 61.9 Dihydrochalcones = 0.3 ± 1.8 Isoflavonoids = 19.3 ± 71.1 Phenolic acids = 100.0 ± 130.0 Lignans = 7.2 ± 15.6 Stilbenes = 2.6 ± 4.4 | Total polyphenol: Red wine 17.7% Artichoke 6.2% Soy milk 5.4% Total flavonoids: Red wine 26.8% Soy milk 10.8% Orange 9.5% | Flavonoids were the highest ingested polyphenols in the older population under analysis. Polyphenol intake was generally higher in female (adjusted for energy intake), in subjects aged 64–67 y, in physically active and alcoholic product drinkers |
| Rossi et al. [45] | 241 subjects W = n.a M = n.a Age = 6–12 year | Argentine | sFFQs | Phenol Explorer Lacking data from literature | Total polyphenols Mean intake = 412 | Phenolic acid Mean intake = 310 Flavonoids Mean intake = 94.1 | Mate (60%) Tea (19%) Coffee (5%) Onion (3%) | Low intake of polyphenols was found in this scholar population of high region of the northwest Argentine due to the very low consumption of fruits and vegetables |
| Wisnuwardani et al. [46] | 2428 subjects (HELENA study) W = 1289 M = 1139 Age = 12.5–17.5 year | Different European countries (Greece, Germany, Belgium, France, Hungary, Italy, Sweden, Austria, Spain) | 2 24-h DR | Phenol Explorer | Total polyphenols Mean intake = 329 Median intake = 326 Q1 = 167 Q4 = 564 Mean intake by age ranges (12.5–13.99 year) = 346 ± 0.1 (14–14.99 year) = 345 ± 0.2 (15–15.99 year) = 356 ± 0.2 (16–17.49 year) = 396 ± 0.2 | Total flavonoids (12.5–13.99 year) = 267 ± 0.1 (14–14.99 year) = 256 ± 0.1 (15–15.99 year) = 253 ± 0.1 (16–17.49 year) = 271 ± 0.1 Phenolic acids (12.5–13.99 year) = 75 ± 0.1 (14–14.99 year) = 75 ± 0.1 (15–15.99 year) = 85 ± 0.1 (16–17.49 year) = 104 ± 0.1 Stilbenes (12.5–13.99 year) = 0.038 ± 0.0 (14–14.99 year) = 0.048 ± 0.0 (15–15.99 year) = 0.046 ± 0.0 (16–17.49 year) = 0.060 ± 0.0 Lignans (12.5–13.99 year) = 1.0 ± 0.0 (14–14.99 year) = 1.0 ± 0.0 (15–15.99 year) = 1.1 ± 0.0 (16–17.49 year) = 1.1 ± 0.0 | Fruit (apple and pear 16%) (23%) Chocolate products (19.2%) Fruit and vegetable juices (16%) | Total polyphenol intake was lower compared to intake of adults reported in previous studies. Polyphenol intake differed largely among countries. Overall, intake for flavonoids was = 75–76% of total polyphenol, for phenolic acids was = 17–19% of total polyphenol and for stilbenes and lignans was = <1% of total polyphenol. |
| Kent et al. [47] | 79 subjects (The Blue Mountains Eye Study) W = 45 M = 34 Age mean = 70.1 year Age = 60–80 year | Australia | 12 24-h DR (weighed) | USDA database (1) | Total flavonoids Mean intake = 678.69 ± 498.53 Median intake = 581.84 IQR = 619.58 | Anthocyanins Mean intake = 6.73 ± 12.7 Median intake = 1.05 IQR = 7.88 Flavonols Mean intake = 28.04 ± 33.29 Median intake = 24.06 IQR = 21.21 Flavones Mean intake = 1.87 ± 4.78 Median intake = 0.55 IQR = 2.11 Flavan 3-ols Mean intake = 596.17 ± 494.95 Median intake = 499.72 IQR = 622.95 Flavanones Mean intake = 21.43 ± 61.46 Median intake = 2.15 IQR = 12.14 | n.a. | Substantial within-individual variation and between individual variation was documented for both total flavonoid intake and intake of flavonoid subclasses. The within-individual variation was in the range 80–140% while the between individual variation was in the range 60–117%. It is speculated that a minimum of 6-day weighed food records is necessary to obtain a reliable estimate of flavonoid intake. |
| Vitale et al. [48] | 2573 subjects (TOSCA.IT Study) W = n. a. M = n. a. Age = 50–75 year Mean = 62.2 ± 0.1 year | Italy | FFQs (Epic) | USDA (1) Phenol Explorer Lacking data from literature | Total polyphenols Mean intake = 683.3 ± 5.8 Mean intake (mg/1000 Kcal/day) Mean = 376.6 ± 3.2 W = 374.0 ± 4.9 M = 378.7 ± 4.1 Mean intake by geographical area North = 387.4 ± 6.0 Center = 355.2 ± 6.1 South = 381.9 ± 4.5 Mean intake by age <60 year = 367.9 ± 4.7 60–65 year = 376.1 ± 5.8 >65 year = 388.4 ± 6.1 | Total flavonoids Mean intake = 324.7 ± 4.1 Phenolic acids Mean intake = 324.2 ± 3.0 Lignans Mean intake = 4.1 ± 0.06 Stilbenes Mean intake = 3.5 ± 0.11 Other polyphenols Mean intake = 27.0 ± 0.27 | Non-alcoholic beverages (coffee 54%, tea 27%), fruits (apple 37%, orange 13%), alcoholic beverages (red wine 93%) and vegetables (artichokes 40%, spinach 20%, onions 18%) | A lower intake of polyphenols has been registered in diabetic subjects compared with other groups, showing a different dietary pattern in this type of Italian population. |
| Nascimento-Souza et al. [49] | 620 subjects W = 330 M = 290 Age = 60–98 years | Brazil | Multiple 24-h DR | Phenol Explorer | Total polyphenols Mean intake = 1198.6 ± 693.8 Median = 1052.7 IQR = 740.5–1477.9 Mean intake by sex W Mean intake = 1097.6 ± 616 Median = 949.4 IQR = 692.4–1407.9 M Mean intake = 1313.5 ± 757.3 Median = 1169.2 IQR = 844.7–1610.3 Mean intake by age 60–74 years Mean intake = 1197.8 ± 619.3 Median = 1092.4 IQR = 806.9–1502.9 >75 years Mean intake = 1310.2 ± 699.4 Median = 1186.9 IQR = 818.3–1582.2 Mean intake energy-adjusted Mean = 1198.6 ± 591.1 Median = 1102.8 IQR = 817.3–1504.8 Mean intake by sex W Mean intake = 1183.8 ± 545.4 Median = 1097.6 IQR = 816.7–1494.8 M Mean intake = 1215.4 ± 639.8 Median = 1116.0 IQR = 829.5–1537.2 Mean intake by age 60–74 years Mean intake = 1197.8 ± 619.1 Median = 1092.4 IQR = 806.9–1502.9 >75 years Mean intake = 1200.7 ± 522.1 Median = 1143.9 IQR = 858.5–1508.6 | Total flavonoids Mean intake = 444.7 ± 345.1 Phenolic acids Mean intake = 729.5 ± 545.4 Lignans Mean intake = 13.6 ± 25.5 | Non-alcoholic beverages (coffee 45.8%), beans (32.8%), polenta (1.3%) | The intake of polyphenols was in a range similar to that reported for other populations, in particular European countries, but it differs for the main food contributors (high in beans and polenta, low in fruits and vegetables) |
| References | Type of Study | Population Characteristics | Country | Dietary Assessment - n° food-containing items | Polyphenol Database Source n° Food Items | Estimated Polyphenol Intake (mg/day) mean ± sd/quantile/min-max/IQR | Overall Results/Association with Outcome |
|---|---|---|---|---|---|---|---|
| Huffman et al. [50] | Cohort study | 507 subjects W = 263 M = 244 Age = 43–65 year | USA | FFQs | USDA database (1) | Total flavonoids Median intake: without diabetes = 280 (387 IQR) with diabetes = 222 (260 IQR) | ↓ LDL associated with higher flavanones intake in the group with diabetes ↓ LDL associated with higher flavan-3-ols, and flavanones intake in the group without diabetes ↓ LDL associated with lower polyflavonoids intake in the group without diabetes ↑ HDL associated with higher anthocyanidins and flavan-3-ols intake in the group without diabetes ↓ HDL associated with lower polyflavonoids intake in the group without diabetes There was no relationship between HDL and flavonoids for the group with diabetes. |
| Pellegrini et al. [51] | Cross-sectional study | 242 subjects W = 91 M = 151 Age = 60 year | Italy | 3D-WR | Information provided by specific literature a | Total lignans Mean (95%CI) Q1 = 382 (332–433) Q2 = 586 (537–636) Q3 = 788 (739–837) Q4 = 1101 (1051–1152) | Total lignans intake are not associated with vascular inflammation and endothelial dysfunction |
| Cassidy et al. [52] | Cohort study (from NHS I, NHS II, and from HPFS) | 156,957 subjects W = 133,914 M = 23,043 Age = 25–75 year | USA | FFQs | USDA database (1–3) EuroFIR | Total flavonoids NHS I Mean = 358 Q1 = 93 Q5 = 944 NHS II Mean = 413 Q1 = 103 Q5 = 1122 HPFS Mean = 376 Q1 = 115 Q5 = 933 | ↓ 6% hypertension incidence risk associated with higher total flavonoids’ intake (Q5 vs. Q1; RR = 0.94; 95% CI: 0.90–0.99) in NHS I Total flavonoids’ intake was not significantly associated with the risk of hypertension incidence in NHS II (RR = 1.01; 95% CI: 0.95–1.07) e HPFS (RR = 1.06; 95% CI: 0.97–1.16) |
| Wedick et al. [53] | Cohort study (from NHS I, NHS II, and from HPFS) | 200,894 subjects W = 159,560 M = 41,334 Age = 25–75 year | USA | FFQs 118–131-item | USDA database (1) | Total flavonoids NHS I Q1 = 105.2 Q2 = 174.8 Q3 = 249.2 Q4 = 369.1 Q5 = 718.1 NHS II Q1 = 112.1 Q2 = 182.5 Q3 = 256.1 Q4 = 378.4 Q5 = 770.3 HPFS Q1 = 112.5 Q2 = 182.2 Q3 = 251.7 Q4 = 352.9 Q5 = 624.3 | ↓ 15% type 2 diabetes risk associated with higher total flavonoids’ intake (Q5 vs. Q1; HR = 0.85; 95% CI: 0.79–0.92) in NHS I Total flavonoids’ intake was not significantly associated with the risk of hypertension incidence in NHS II (HR = 0.99; 95% CI: 0.89–1.11) e HPFS (HR = 0.92; 95% CI: 0.81–1.04) |
| Zamora-Ros et al. [54] | Center stratified subcohort from Cohort study (EPIC-InterAct sub-cohort) | 12,403 subjects W = 11,067 M = 5768 Age = 52.4 ± 9.1 year | 8 European countries | 24-h DR | Phenol Explorer USDA database (1–3) | Flavanols Mean = 334 ± 286 Median = 246 5th–95th percentile = 60.9–938 Flavonols Mean = 24.8 ± 16.0 Median = 20.4 5th–95th percentile = 7.8–57.4 Proanthocyanidins Mean = 183 ± 140 Median = 15 15th–95th percentile = 41.7–423 | ↓8% type 2 diabetes risk associated with higher consumption of myricetin (Q5 = >5.38 vs. Q1 = <0.37; cut off for each quintile) (P-trend = 0.001; HR = 0.92; 95% CI: 0.88, 0.96). ↓14% type 2 diabetes risk associated with higher consumption of proanthocyanidin dimers (Q5 = >49.5 vs. Q1 = <14.1; cut off for each quintile) (P-trend = <0.003; HR = 0.94; 95% CI: 0.90, 0.99). ↓7% type 2 diabetes risk associated with higher consumption of (-)-Epicatechin (Q5 = >28.75 vs. Q1 = <6.76; cut off for each quintile) (P-trend = <0.040; HR = 0.93; 95% CI: 0.89, 0.98). ↓6% type 2 diabetes risk associated with higher consumption of (+)-Catechin (Q5 = >20.08 vs. Q1 = <5.50; cut off for each quintile) (P-trend = <0.005; HR = 0.94; 95% CI: 0.91, 0.98). ↓2% type 2 diabetes risk associated with higher consumption of (+)-Gallocatechin (Q5 = >3.45 vs. Q1 = <0.04; cut off for each quintile) (P-trend = <0.027; HR = 0.98; 95% CI: 0.97, 0.99). |
| Zamora-Ros et al. [55] | Cohort study (EPIC cohort) | 15,258 subjects W = 9484 M = 5774 Age = 52.4 ± 9.1 year | Denmark, France, Germany, Greece, Italy, Netherlands, Norway, Spain, Sweden, and the United Kingdom | FFQs (98–266-item) Diet histories Food record | EPIC Nutrient Database based on: Phenol Explorer USDA database (1) | Total flavonoids Mean intake = 414.9 ± 311.7 median intake = 326.7 5th percentile = 93.2 95th percentile = 1050.4 Median intake Q1 = 126.8 Q2 = 223.7 Q3 = 326.7 Q4 = 478.4 Q5 = 817.5 | ↓10% type 2 diabetes risk associated with higher consumption of total flavonoids (HR 0.90 [95% CI 0.72–1.07; P value trend = 0.040) ↓18% type 2 diabetes risk associated with higher consumption of flavanols (HR 0.82 [95% CI 0.68–0.99; P value trend = 0.012) ↓27% type 2 diabetes risk associated with higher consumption of flavan-3-ol monomers (HR 0.73 [95% CI 0.57–0.93; P value trend = 0.029) ↓19% type 2 diabetes risk associated with higher consumption of flavonols (HR 0.81 [95% CI 0.69–0.95; P value trend = 0.020) Conversely lignans did not show any association (HR 0.88 [95% CI 0.72–1.07] P value trend = 0.119) |
| Jacques et al. [56] | Cohort study (Framingham Heart Study Offspring cohort) | 2915 subjects W = 1341 M = 1574 Age = 54 years CL = 53.8–54.5 year | USA | FFQs | USDA database (1–3) | Total flavonoids Median = 210 Min = 2 Max = 1963 Median intake Q1 = 85 Q2 = 165 Q3 = 272 Q4 = 537 | Total flavonoids’ intake was not significantly associated with the risk of diabetes incidence (HR = 0.89; 95% CI: 0.75–1.05) ↓ risk of diabetes incidence associated with flavanols (HR = 0.68; 95% CI: 0.54–0.86) P-trend = 0.001 |
| Tresserra-Rimbau et al. [57] | Cohort study (PREDIMED cohort) | 7172 subjects W = 3923 M = 3249 Age = 67 ± 6 year | Spain | FFQs | Phenol Explorer | Total polyphenols Median intake Q1 = 562 Q2 = 701 Q3 = 800 Q4 = 917 Q5 = 1170 | ↓ 46% CV events risk associated with higher total polyphenol intake (Q5 vs. Q1; HR = 0.54; 95%CI: 0.33–0.91) ↓ CV events risk associated with several polyphenols’ subclasses:Lignans (HR = 0.51; 95% CI: 0.30–0.86) Flavanols (HR = 0.40; 95% CI: 0.23–0.72) Hydroxybenzoic acids (HR = 0.47; 95% CI: 0.26–0.86) |
| Jennings et al. [58] | Cross-sectional-study | 1997 subjects W = 1997 M = 0 Age = 18–76 year | UK | FFQs (131-item) | USDA database (1–3) | Total flavonoids Mean intake = 1170 ± 639 IQR = 617–1700 | Total flavonoids were not significant associated with cardiovascular outcomesTotal flavonoids inversely associated with biomarkers of insulin resistance and inflammation: ↓ HOMA-IR, insulin, hs-CRP associated with anthocyanins intake (Q5 vs. Q1) ↓ HOMA-IR, insulin, adiponectin associated with flavones intake (Q5 vs. Q1) |
| Ponzo et al. [59] | Cohort study | 1658 subjects W = 878 M = 780 Age = 45–64 year | Italy | FFQs | USDA Database (1-2-3) extended with information from a European database | Total flavonoids Median intake T1 = 89 T2 = 251.4 T3 = 532.3 | ↓ 54% non-fatal CV events risk associated with higher flavonoid intake (T3 vs. T1; HR = 0.46; 95% CI: 0.28–0.75) ↓ non-fatal CV events risk associated with several flavonoids’ subclasses: Proanthocyanids (HR = 0.43; 95% CI: 0.27–0.70) Flavan-3-ols (HR = 0.42; 95% CI: 0.26–0.68) Anthocyanidins (HR = 0.56; 95% CI: 0.36–0.89) Flavanones (HR = 0.48; 95% CI: 0.29–0.77) Flavonols (HR = 0.53; 95% CI: 0.34–0.83) Total and subclasses of flavonoids were not significantly associated with the risk of CV mortality ↓ all-cause mortality associated with the T3 of several flavonoid subclasses: Flavan-3-ols (HR = 0.68; 95% CI 0.48–0.96) Anthocyanidins (HR = 0.66; 95% CI 0.46–0.95) Flavanones (HR = 0.59; 95% CI 0.40–0.85) |
| Jacques et al. [60] | Cohort study (Framingham Heart Study Offspring cohort) | 2880 subjects W = 1302 M = 1578 Age = 54 year CL = 53.8–54.5 | USA | FFQs | USDA database (1–3) | Total flavonoids Exam 5 (1991–1995) Median = 212 25th = 124 75th = 372 Exam 8 (2005–2008) Median = 259 25th = 157 75th = 436 | Total flavonoids’ intake was not significantly associated with the risk of incidence of CVD events (RR = 0.93; 95% CI: 0.82–1.06) |
| Yeon et al. [61] | Cohort study | 4186 subjects W = 2575 M = 1611 Age = 40–59 year | Korea | 24-h DR | USDA Database (1) | Flavanones W = 29.24 ± 4.17 M = 21.26 ± 4.37 Flavones W = 0.48 ± 0.04 M = 0.36 ± 0.02 Flavonols W = 17.06 ± 0.55 M = 15.72 ± 0.59 | ↓ insulin (β-coefficient = −0.0067; p for trend = 0.0092) and HOMA (β-coefficient = −0.0016; p for trend = 0.0239) associated with flavonols intake in men ↓ insulin (β-coefficient = −0.0008; p for trend = 0.0063) and HOMA (β-coefficient = −0.0002; p for trend = 0.0119) associated with flavanones intake in women |
| Oh et al. [62] | Cohort study | 7963 subjects W = 7963 M = 0 Age = >30 years | Korea | 24-h DR | Flavonoid Korean Database | Total flavonoids Mean Intake: Normal fasting glucose group = 107.40 ± 1.69 Type 2 diabetes mellitus group = 97.81 ± 8.11 | ↓prevalence of type 2 diabetes associated with intake of flavones above the 25th percentile (≥0.25 mg/day) compared with intake below the 25th percentile (OR = 0.593, 95% CI: 0.414–0.847) |
| Goetz et al. [63] | cohort study | 20,024 subjects W = 11,253 M = 8771 Age = >45 years | US | FFQs (107-item) | USDA database (1–3) | Total flavonoids Median intake (range) Q1 = 34.3 (<50.8) Q2 = 66.6 (50.9–83.4) Q3 = 102.9 (83.5–127.0) Q4 = 156.9 (127.1–208.3) Q5 = 296.8 (≥ 208.4) | ↓risk of incident acute ischemic stroke (HR = 0.72; 95% CI: 0.55, 0.95; P-trend = 0.03) was associated with flavanone intake, but not total or other flavonoid subclasses. Associations did not differ by sex race, or region for any flavonoid measure. |
| Goetz et al. [64] | Cohort study | 16,678 subjects W = 9798 M = 6880 Age = >45 years | US | FFQs (107-item) | USDA database (1–3) | Total flavonoids W: Mean intake = 234 Median intake = 131 M: Mean intake = 227 Median intake = 131 | ↓incident CHD associated with consumption of anthocyanidin and proanthocyanidin. Anthocyanidins Q1 vs. Q5; HR = 0.71; 95% CI: 0.52–0.98; P-trend = 0.04; proanthocyanidins Q1 vs. Q5; HR = 0.63; 95% CI: 0.47–0.84; P-trend = 0.02). There was no significant effect modification by age, sex, race, or region of residence |
| Miranda et al. [65] | Cohort study | 550 subjects W = 346 M = 204 Age = 20–59 years Age older adults = >60 years | Brazil | 2 24-h DR | Phenol Explorer | Total polyphenols Mean intake = 392.6 Median intake = 360.6 | ↓hypertension associated with highest tertiles of some classes of polyphenols: tyrosols (OR = 0.33; 95% CI 0.18–0.64), alkylphenols (OR = 0.45; 95% CI 0.23–0.87), lignans (OR = 0.49; 95% CI 0.25–0.98), as well as stilbenes (OR = 0.60; 95% CI 0.36–0.98), and other polyphenols (OR = 0.33; 95% CI 0.14–0.74). ↓hypertension associated with middle tertiles of total polyphenols and phenolic acids.There was no significant association for total flavonoids |
| Cassidy et al. [66] | Cohort study (HPFS cohort) | 43,880 subjects M = 43,880 W = 0 Age = 32–81 years | UK | FFQs | USDA database (1) | Anthocyanins Q1 = 1.9 Q2 = 4.5 Q3 = 7.8 Q4 = 13.7 Q5 = 26.3 intake range = 0–613 IQR = 3.9–15.7 Flavanones Q1 = 7.5 Q2 = 23.6 Q3 = 43.5 Q4 = 64.5 Q5 = 103.9 intake range = 0–728 IQR = 18.8–70.9 | ↓total or fatal MI risk associated with higher anthocyanin intake (HR = 0.87; 95% CI: 0.75–1.00; P = 0.04; P-trend = 0.098); this association was stronger in normotensive participants (HR = 0.81; 95% CI: 0.69–0.96; P-interaction = 0.03). Anthocyanin intake was not associated with stroke risk. ↓ischemic stroke associated with higher flavanone intake (HR = 0.78; 95% CI: 0.62–0.97; P = 0.03, P-trend = 0.059); with the greatest magnitude in participants aged > 65 years (P-interaction = 0.04). Flavanone intake was not associated with MI or total stroke risk |
| Kim et al. [67] | Cohort study | 4042 subjects W = 1970 M = 2072 Age = >19 years | US | 2 24-h DR | USDA Database (1-2-3) | Total flavonoids Mean intake Q1 = 12.5 Q2 = 59 Q3 = 197.6 Q4 = 585.5 | Changes in percentages of cardiovascular risk factors with a 100% increase in flavonoid intake: ↑ 0.54% HDL-cholesterol associated with higher total flavonoid intake ↓ 1.25% TAG and ↓ 1.60% TAG:HDL-cholesterol ratio associated with anthocyanidin intake ↓ 1.31% TAG and ↓ 1.83% TAG:HDL-cholesterol ratio associated with total flavonoid intake ↓ 3.18% insulin and ↓ 3.10% HOMA-IR were associated with flavone intake ↓ 3.11% insulin and ↓ 4.01% HOMA-IR were associated with isoflavone intake ↓ 0.60% BMI associated with anthocyanidin intake |
| Rizzi et al. [68] | Cohort study | 443 subjects W = 175 M = 268 Age = 20–85 years | Italy | 24-h DR | USDA Database (1) Phenol Explorer EIO Database | Total polyphenols range intake T1 = 99.4–804.5 T3 = 1288.0–4342.2 | High polyphenols intake was not associated with significant differences in the lipid profile compared with low polyphenols intake |
| Grosso et al. [69] | Cohort study (HAPIEE study) | 5806 subjects W = 3075 M = 2731 Age = 45–69 years | Poland | FFQs (148-item) | Phenol Explorer | Total polyphenols Mean intake Q1 = 1026.7 ± 212 Q2 = 1469.6 ± 102.2 Q3 = 1872.6 ± 136.7 Q4 = 2632.1 ± 608 | ↓ 32% of risk of type 2 diabetes in the whole population associated with highest intake of total polyphenol (Q4 vs. Q1) |
| Witkowska et al. [70] | Cohort study | 2599 subjects W = 2599 M = 0 Age = 20−74 years | Poland | 24-h DR (367-item) | Phenol Explorer | Total polyphenols Mean intake Q1 = 948.2 ± 236 Q2 = 1523.2 ± 142 Q3 = 2016.3 ± 154 Q4 = 2975.8 ± 724 | ↓ 1.1% odds ratio of CVD in postmenopausal women with higher dietary polyphenol intake (per 100 mg/day) |
| Grosso et al. [71] | Cohort study (HAPIEE study) | 8821 subjects W = 4530 M = 4291 Age = 50–65 years | Poland | FFQs (148-item) | Phenol Explorer | Total polyphenols n.a. | ↓ metabolic syndrome associated with the highest quartile of polyphenol intake (OR = 0.80; 95% CI: 0.64–0.98 and OR = 0.70; 95% CI: 0.56–0.86 for both men and women, respectively). ↓ blood pressure, waist circumference, high lipoprotein cholesterol, and triglycerides associated with high total polyphenol intake in women. ↓ fasting plasma glucose associated with high total polyphenol intake in both genders. |
| Sohrab et al. [72] | Cohort study | 1265 Subjects W = 711 M = 554 Age = 19–74 years | Iran | FFQs | Phenol Explorer | Total polyphenols Median Intake (range) T1 = 827 (≤1128) T2 = 1425 (1129–1819) T3 = 2459 (≥1820) Total flavonoids Median intake (range) T1 = 38.4 (≤52.8) T2 = 69.5 (52.9–88.4) T3 = 115.1 (≥88.5) | Total polyphenols were not significant associated with metabolic syndrome ↓ 31% metabolic syndrome risk (OR = 0.69; 95% CI: 0.48–0.98, P-trend: 0.04) associated with total flavonoid intake (T3 vs. T1) |
| Mendonça et al. [73] | Cohort study (SUN cohort) | 17,065 Subjects W = 10,358 M = 6707 Age = 20–89 years | Spain | FFQs 136-item | Phenol Explorer USDA database | Total polyphenols Mean Intake Q1 = 396 (±134) Q2 = 526 (±149) Q3 = 653 (±149) Q4 = 812 (±156) Q5 = 1248 (±405) Total flavonoids Mean Intake Q1 = 186 (±72) Q2 = 234 (±86) Q3 = 302 (±97) Q4 = 424 (±105) Q5 = 772 (±330) | Total polyphenols were not significant associated with cardiovascular events (HR = 0.61; 95% CI: 0.33–1.13 P for trend 0.28) Total flavonoids were not significant associated with cardiovascular events (HR = 0.53; 95% CI: 0.29–0.98 P for trend 0.09) |
| References | Type of Study | Population Characteristics | Country | Dietary Assessment - n° Food-Containing Items | Polyphenol Database Source n° Food Items | Estimated Polyphenol Intake (mg/day) mean± sd/quantile/ min-max/IQR | Overall Results/Association with Outcome |
|---|---|---|---|---|---|---|---|
| McCullough et al. [74] | Cohort study (American Cancer Society’s CPS-II Nutrition Cohort Study) | 98,469 subjects W = 60,289 M = 38,180 Mean Age W = 70 years Mean Age M = 69 years | USA | FFQs (152 food items) | USDA database (1-2-3) other research publications | Total flavonoids Mean intake (energy-adjusted) Men Mean intake = 268 Median intake = 203 10th–90th percentile = 99–498 Women Mean intake = 268 Median intake = 201 10th–90th percentile = 92–522 | Cardiovascular mortality Age-adjusted model: Inverse association were observed for high total flavonoid, anthocyanidins (median 22.2 (≥16.7) mg/day), flavan-3-ols (median 63.7 (≥37.2) mg/day), flavones (median 3.0 (≥2.1) mg/day), flavonols (median 27.2 (≥20.6) mg/day), proanthocyanidins (median 379.4 (≥253.6) mg/day) and isoflavones (median 0.713 (≥0.142) mg/day) in both the sex. Inverse association for flavanones (median 49.9 (≥35.4) mg/day) in women. Multivariable-adjusted model3: No association in men. Inverse association for high total flavonoid, anthocyanidin, flavan-3-ol intake in women. Subjects with high total flavonoid consumption (median 512.5 (≥359.7) mg/day) showed a low risk of death (−18%) in both the sex.Inverse association for high anthocyanidin, flavan-3-ol, flavones, flavanol and proanthocyanidin intake by considering women + men. Ischemic heart disease mortality Age-adjusted model: Inverse association for high anthocyanidin and flavone intake in both the sex. Inverse association for high total flavonoid intake in men and women + men; high flavanone intake in women + men; high flavanol intake in women and women + men; high proanthocyanidin intake in women + men; high isoflavone intake in men and women + men. Multivariable-adjusted model3: Inverse association for high flavone intake in women and women + men Stroke mortality Age-adjusted model: Inverse association for high total flavonoid intake in men, and high flavones intake in men and women + men. Multivariable-adjusted model3: Inverse association for high total flavonoid intake in men |
| Zamora-Ros et al. [75] | Cohort study(Invecchiare in Chianti study) | 807 subjects W = 447 M = 360 Age = 74.3 ± 6.9 years Survived W = 313 M = 240 Age = 71.8 ± 5.3 years Died W = 134 M = 140 Age = 79.2 ± 7.2 years | Italy | FFQs (Italian version) Urinary polyphenol assessment | Phenol Explorer USDA database | Total polyphenols Mean intake = 594 ± 196 Survived Mean intake = 600 ± 201 Died Mean intake = 584 ± 185 | No association between total dietary polyphenols and all-cause mortality |
| Zamora-Ros et al. [76] | Cohort study (EPIC Spain Study) | 40,622 subjects W = 25,298 M = 15,324 Age = 29–69 years | Spain | FFQs computerized diet history questionnaire developed and validated specifically for the EPIC study in Spain | USDA database Phenol-explorer UK Food Standards Agency (10% missing values in 1877 food items) | Total flavonoids Mean intake = 387.3 ± 280.2 Median intake = 329.8 25th percentile = 218.4 75th percentile = 489.6 Total lignans Mean intake = 1.0 ± 0.5 Median intake = 0.9 25th percentile = 0.7 75th percentile = 1.2 | Multivariable-adjusted model2: subjects with high flavanones (>51.3 mg/day), flavanols (>28.0 mg/day) and total flavonoids intake (>447.8 mg/day) showed a low risk of all-cause mortality (flavanones: 0.60 (95% CI = 0.38–0.94) and flavonols: 0.59 (95% CI = 0.40–0.88). This reduction was due entirely to a decrease in mortality from CVD. Proanthocyanidins were the most important contributor (66%) to total flavonoid intake, followed by flavanones (11%), flavan-3-ol monomers (9%), anthocyanidins (7%), and flavonols (6%), flavones (1%), isoflavones (0.1%), and theaflavins (<0.1%). No evidence of an association between dietary flavonoid or lignan intake and mortality from cancer or other causes. |
| Ivey et al. [77] | Cohort study | 1063 Subjects W = 1063 Age > 75 years | Australia | FFQs developed by the AntiCancer Council of Victoria | USDA | Total flavonoids Flavonol: 31 ± 14 Flavan-3-ol: 431 ± 279 Proanthocyanidin: 215 ± 147 Flavone: 3 ± 2 Flavanone: 53 ± 38 Anthocyanidin: 37 ± 26 Isoflavone: 5 ± 6 | Unadjusted model: Subjects with high intake of total flflavonol (>35 mg/day), flflavan3-ol (>563 mg/day), flavone (>3 mg/day) and flavanone (>61 mg/day) showed a reduced risk of atherosclerotic vascular disease mortality. Age- and energy-adjusted model and multivariate-adjusted model4: Subjects with high intake of total flflavonol (>35 mg/day), flflavan3-ol (>563 mg/day) showed a reduced risk of atherosclerotic vascular disease mortality No association was observed for the other flavonoid subclasses Tea contributed 59% of total flavonoid intake; the major contributors were flavonols (65%) and flavan-3-ols (93%). Multivariate-adjusted model4: Subjects with high intake of flavonols derived from tea and non-tea sources (≥12 mg/day and ≥27 mg/d, respectively) showed a low risk of atherosclerotic vascular disease mortality. |
| Ivey et al. [78] | Cohort study | 1063 subjects W = 1063 M = 0 Age > 75 years | Australia | FFQs (93 items) Beverage questionnaire (to assess tea and coffee consumption) | Phenol Explorer (47 foods recorded as not containing flavonoids or not present in the database) USDA database (1-2-3) (19 foods recorded as not containing flavonoids or not present in the database) | Total flavonoids (PE) Mean intake = 674 ± 326 Median intake = 648 IQR = 449–872 Total flavonoids (USDA) Mean intake = 696 ± 322 Median intake = 668 IQR = 468–889 | Subjects with high total flavonoid intake (≥813 mg/day USDA; ≥788 mg/day PE) showed a low risk of all-cause mortality and cardiovascular mortality |
| Ponzo et al. [59] | Cohort study | 1658 subjects W = 878 M = 780 Age = 45–64 year | Italy | FFQs | USDA Database (1-2-3) extended with information from an European database | Total flavonoids Median intake T1 = 89 T2 = 251.4 T3 = 532.3 | Total and subclasses of flavonoids were not significantlyassociated with the risk of CV mortality The third tertile of flavan-3-ols (HR = 0.68; 95% CI 0.48–0.96), anthocyanidins (HR = 0.66; 95% CI 0.46–0.95) and flavanones (HR = 0.59; 95% CI 0.40–0.85) was inversely associated with all-cause mortality |
| Dower et al. [79] | Cohort study (Zutphen Elderly Study) | 774 subjects W = 0 M = 774 Age = 65–84 years | The Netherlands | Cross-check dietary history (adapted for the Dutch setting) 5 | Monomeric flavan-3-ol contents of 120 commonly consumed plant foods and beverages were determined with the use of reverse-phase HPLC with ultraviolet and fluorescence detection. (−)-epicatechin, (+)-catechin, (−)-epigallocatechin,(−)-epicatechin gallate (ECg), (−)-epigallocatechin gallate (EGCg), and (+)-gallocatechin concentrations were determined as reported in previous published papers 6 | Total epicatechins Mean intake = 15.2 ± 7.7 Range intake = 0.01–60.6 | Coronary heart disease mortality Subjects with high epicatechin intake (>18 mg/day) showed a low (−38%) risk of CHD mortality Cardiovascular disease mortality Subjects with high epicatechin intake (>18 mg/day) showed a low (−46%) risk of CVD mortality in men with prevalent CVD but not in men who were free of CVD The major dietary sources of epicatechin intake were tea (7.8 mg/day; 51% of total epicatechin intake), apples (4.3 mg/day; 28% of total epicatechin intake), cocoa (1.1 mg/day; 7% of total epicatechin intake), and other sources (2.0 mg/day; 13% of total epicatechin intake) |
| Ivey et al. [80] | Cohort study (Nurses’ Health Study II) | 93,145 subjects W = 93.145 M = 0 Age = 25–42 years | USA | FFQs | USDA database | Total flavonoids Mean intake = 379 ± 374 | Age-adjusted model: subjects with high total flavonoids intake (≥518 mg/day) showed a 19% reduction of overall mortality in the 18-year follow-up period. Subjects with high flavan-3-ols (≥86 mg/day), proanthocyanidins (≥356 mg/day) and anthocyanin intake (≥17 mg/day) showed a low risk of mortality for CVD and other causes. Multivariable adjusted model1: no association High consumption (more than once per week) of red wine, tea, peppers, blueberries and strawberries was associated with reduced risk of total and cause-specific mortality. |
| Zhang et al. [81] | Cohort study | 6235 subjects with breast cancer W = 6235 M = 0 Age = 51.8 ± 10.6 years | USA, Canada, Australia | FFQs | USDA database | Total isoflavones Mean intake: 1.8 ± 3.9 Median intake: 0.7 IQR intake: 1.2 | Quartile 4 (≥1494 mg/day) associated with a 21% decrease in all-cause mortality. This result was limited to women with negative tumor hormone receptors and those not treated with hormonal therapy for breast cancer |
| Pounis et al. [82] | Cohort study (Moli-sani cohort Study) | 21,302 subjects W = 10,980 M = 10,322 Age = 54–56 years | Italy | FFQs | Eurofir-eBASIS FCTs USDA database (1-2-3) | Data reported as polyphenol antioxidant content (PAC)-score 6 (−28 to 28) | Risk for all-cause mortality Women: low risk for high intake of flavones (>1.12 mg/day), flavanones (>46.5 mg/day), isoflavones (>32.7 mg/day), and lignans (>116.1 mg/day) had a low risk. After adjustments for potential confounders (model 4)7: the effects remained significant for Q4 (4–13) and Q5 (>13) of PAC-score Men: low risk for some quintile of intake; flavonols (Q2: 11.2–15.1 mg/day and Q5: >25.8 mg/day), flavones (Q3: 0.61–0.81 mg/day), flavanones (Q2: 22–29 mg/day), isoflavones (Q2: 16.5–21 mg/day, Q3: 21–25.7 mg/day and Q5: >32.7 mg/day), lignans (Q3: 72.8–90.3 mg/day). After adjustments for potential confounders (model 4)8: the effects remained significant for Q2 (−13 to −4), Q3 (−4 to 4) and Q4 (4–13) of PAC-score Vascular causes Women: no association Men: low risk of mortality for Q2 (−13 to −4) and Q3 (−4 to 4) Other causes Women and men at Q2 (−13 to −4) and Q4 (4–13) of PAC-score showed a low mortality risk from other causes |
| References | Type of Study | Population Characteristics | Country | Dietary Assessment - n° Food-Containing Items | Polyphenol Database Source n° Food Items | Estimated Polyphenol Intake (mg/day) mean ± SD/quantile/min-max/IQR | Overall Results/Association with Outcome |
|---|---|---|---|---|---|---|---|
| Fisher et al. [83] | Analytical | 19 subjects W = 11 M = 8 Age = 72 ± 7 years | US | FFQs | USDA database (1–3) (22 food item) | Total flavonoids Median intake = 2428 mg/week Median = 347 Q1–Q4 = 1242–4789 mg/week | Habitual dietary intake of flavonoids was associated with higher endothelial function evaluated as reactive hyperemia (RH)-PAT response. Subjects with habitual flavonoid intake (>4500 mg/week) had significantly higher (RH)-PAT response |
| Ivey et al. [84] | Prospective | 948 subjects W = 948 M = 0 Age = ≥75 years | Australia | FFQs | USDA database (1-2-3) | Total Proanthocyanidins Mean intake = 215 ± 147 Min-max = 18–1728 | Over 50% of total proanthocyanidin intake were from fruit (89 ± 63 mg/day), chocolate (43 ± 75 mg/day), and alcoholic beverages (32 ± 86 mg/day). Subjects with habitual proanthocyanidin intake (≥229 mg/day) had lower risk of moderate chronic kidney insufficiency and renal failure events |
| Zhang et al. [85] | Cross-sectional | 3317 subjects W = 2239 M = 1078 Age = 60.2 years | China | FFQs (79-item) | USDA database (1–3) Hong Kong database of isoflavones 1 | Total flavonoids Median intake W(Q1) = 53.3 IQR = 40.5–66.3 W(Q2) = 110.0 IQR = 92.2–132.1 W(Q3) = 232.4 IQR = 194.8–274.4 W(Q4) = 486.9 IQR = 402.2–584.4 M(Q1) = 63.1 IQR = 44.9–94.6 M(Q2) = 207.9 IQR = 174.4–237.2 M(Q3) = 351.8 IQR = 297.6–392.2 M(Q4) = 555.3 IQR = 479.6–618.2 | High total flavonoid intake (Q4 vs. Q1) was associated with higher bone mineral density (BMD) in women, but not in men. A dose dependent positive relationship was found for all BMD measured sites. In addition, a significant association was found also for flavonoid subclasses (flavonols, flavan-3-ols, flavones, and proanthocyanidins) |
| Urpi- Sarda et al. [86] | Cross-sectional (Invecchiare CHIANTI Study) | 811 subjects W = 446 M = 364 Age = >65 years | Italy | FFQs | Phenol explorer USDA database | Total polyphenols Mean intakeAll (N = 811) = 595.2 ± 195.6 Non-frail (n = 418) = 608.5 ± 199.8 Prefrail (n = 321) = 587.3 ± 195.9 Frail (n = 72) = 550.5 ± 158.7 1T < 509.2 2T = 509.2–645.2 3T < 645.2 | No association between total dietary polyphenols and frailty and pre-frailty in older subjects |
| Rabassa et al. [95] | Cross-sectional (Invecchiare CHIANTI Study) | 652 subjects W = 361 M = 291 Mean Age = 73 | Italy | FFQs | Phenol explorer USDA database | Total polyphenols Median intake All (n = 652) = 574 IQR = 472–701 1T = 430 IQR = 354–470 2T = 574 IQR = 543–610 3T = 766 IQR = 701–855 | No association between total dietary polyphenols and any cognitive test in older subjects |
| Myers et al. [87] | Prospective | 1188 subjects W = 1188 Age = >70 years | Australia | FFQs Beverage questionnaire | USDA database (1-2-3) | Total flavonoids Median intake Tea Low consumer = 266 IQR = 191–361 Tea Moderate consumer = 845 IQR = 672–959 Tea High consumer = 1570 IQR = 1325–1915 | Higher intake of black tea and flavonoids was associated with lower hospitalization (30–40% reduction) for fractures in older women at high risk |
| Ma et al. [88] | Case-control | 249 subjects (cases) 66 subjects (controls) W = 182 M = 133 Age = 50–70 years | China | FFQs 3 24-h DR | USDA database | Total flavonoids Cases Median intake = 51.13 IQR = 38.06–64.21 Controls Median intake = 64.92 IQR = 53.66–75.61 | Total dietary anthocyanidin, flavan-3-ol, flavanone, flavone, and flavonol intake was not associated with age related cataract risk. Only quercetin and isorhamnetin intake appeared to be associated with the risk in this population |
| Rabassa et al. [89] | Cross-sectional (Invecchiare CHIANTI Study) | 368 subjects W = 199 M = 169 Age = >65 years | Italy | FFQs | USDA database (1–3) Phenol explorer 236 food items | Total polyphenols Baseline Median intake = 556 IQR = 462–682 3-year follow-up Median = 539 IQR = 429–656 6-years Median = 513 IQR = 415–619 9-years Median = 500 IQR = 407–595 | Total dietary polyphenol (TDP) intake was higher in older subjects and women with higher physical activity level. No association between TDP and physical performance decline was found |
| Garcia-Larsen et al. [90] | Cross-sectional (GA2LEN study) | 2599 subjects W = 1516 M = 1083 Age = 47.2 ± 14.5 years | Denmark Finland Sweden UK Portugal Belgium Germany Netherlands Poland | FFQs (250-item) | USDA database (1–3) | Total flavonoids Median intake = 291.2 IQR = 126.8–569.4 | Total flavonoid intake and pro-anthocyanidins was positively associated with a good ventilatory function (forced vital capacity), while a negative association with spirometric restriction was found in the cohort. In particular, subjects with total flavonoid intake at the highest quintile had a 42% lower risk of reduced forced vital capacity |
| Gopinath et al. [91] | Cohort study (Blue Mountains Eye Study) | 2856 subjects W = 1597 M = 1259 Age = ≥ 49 years | Australia | FFQs (145-item) | USDA database (1-2-3) | Total flavonoids Median intake = 875 Q1 ≤ 410.6 Q2 = 412.4–881.5 Q3 = 881.6–1232.3 Q4 ≥ 1232.4 | Total flavonoids and subclasses (e.g., flavonols and flavanones), were associated with age-related macular degeneration (AMD) among older adults. The consumption of oranges and orange juice, contributing to total flavanone intake, was found to significantly affect AMD risk |
| Pounis et al. [92] | Cross-sectional (Moli-sani study) | 9659 subjects W = 4551 M = 5108 Age = ≥35 years | Italy | FFQs (164-item) | Eurofir–e BASIS USDA database (1-2-3) | Flavonols Median intake (Q1–Q3) W = 15.4 (11.1–21.2) M = 19.1 (14.1–26.0) Isoflavones Median intake (Q1–Q3) W = 23.3 (17.9–31.0) M = 23.7 (18.1–31.1) Flavones Median intake (Q1–Q3) W = 0.77 (0.53–1.10) M = 0.65 (0.44–0.95) Flavanones Median intake (Q1–Q3) W = 31.1 (22.9–42.1) M = 35.0 (26.1–45.9) Flavanols Median intake (Q1–Q3) W = 41.6 (24.4–73.0) M = 66.1 (36.3–108.8) Anthocyanidins Median intake (Q1–Q3) W = 145.3 (99.8–209.3) M = 148.0 (101.9–216.3) Lignans Median intake (Q1–Q3) W = 82.7 (61.1–109.8) M = 81.2 (61.1–107.2) | Higher polyphenol intake was associated with better pulmonary function (forced vital capacity, and forced expiratory volume in the first second) in the population under study. A potential anti-inflammatory activity of polyphenols was hypothesized in men where a reduction in C-reactive protein and white blood cells was observed |
| Lefevre-Arbogast et al. [93] | Cohort study (The 3C Bordeaux cohort) | 1329 subjects W = 824 M = 505 Mean Age = 75.8 years | France | 24-h DR | Phenol Explorer | Total polyphenols Mean intake All subjects = 1071 ± 570 Incident dementia = 1029 ± 542 (n = 256) No dementia = 1081 ± 576 (n = 1073) | Polyphenol intake was associated with a decreased risk of all-cause dementia and of Alzheimer disease (AD) over 12 years. Subjects in the higher quintile of intake had a ≈ 50% lower risk of both dementia and AD. The pattern of polyphenol intake associated with the reduced risk was characterized by flavonoids (e.g., dihydroflavonols, anthocyanins, isoflavonoids, and flavanones), stilbenes (including resveratrol), lignans, and additional isolated polyphenols (hydroxybenzaldehydes, naphthoquinones, and furanocoumarins) |
| Segovia-Siapco et al. [94] | Cross-sectional (The Teen Food and Development Study) | 248 subjects W = 0 M = 248 Age = 12–18 years | USA | Web-FFQs (151-item) | Nutrition Data Systems for Research (NDS-R) Specific database 2 | Total Isoflavones Mean intake = 22.1 Min and max = 18.3–26.0 | Moderate (3–20 mg/day) and high (>20 mg/day) consumers of soy isoflavones nearly follow the same pattern for pubertal development. Whether soy isoflavones play a role in the rate of maturation and sequencing of pubertal development in boys cannot be determined based on our study findings |
© 2019 by the authors. Licensee MDPI, Basel, Switzerland. This article is an open access article distributed under the terms and conditions of the Creative Commons Attribution (CC BY) license (http://creativecommons.org/licenses/by/4.0/).
Share and Cite
Del Bo’, C.; Bernardi, S.; Marino, M.; Porrini, M.; Tucci, M.; Guglielmetti, S.; Cherubini, A.; Carrieri, B.; Kirkup, B.; Kroon, P.; et al. Systematic Review on Polyphenol Intake and Health Outcomes: Is there Sufficient Evidence to Define a Health-Promoting Polyphenol-Rich Dietary Pattern? Nutrients 2019, 11, 1355. https://doi.org/10.3390/nu11061355
Del Bo’ C, Bernardi S, Marino M, Porrini M, Tucci M, Guglielmetti S, Cherubini A, Carrieri B, Kirkup B, Kroon P, et al. Systematic Review on Polyphenol Intake and Health Outcomes: Is there Sufficient Evidence to Define a Health-Promoting Polyphenol-Rich Dietary Pattern? Nutrients. 2019; 11(6):1355. https://doi.org/10.3390/nu11061355
Chicago/Turabian StyleDel Bo’, Cristian, Stefano Bernardi, Mirko Marino, Marisa Porrini, Massimiliano Tucci, Simone Guglielmetti, Antonio Cherubini, Barbara Carrieri, Benjamin Kirkup, Paul Kroon, and et al. 2019. "Systematic Review on Polyphenol Intake and Health Outcomes: Is there Sufficient Evidence to Define a Health-Promoting Polyphenol-Rich Dietary Pattern?" Nutrients 11, no. 6: 1355. https://doi.org/10.3390/nu11061355