Role of Nutrition and Adherence to the Mediterranean Diet in the Multidisciplinary Approach of Hidradenitis Suppurativa: Evaluation of Nutritional Status and Its Association with Severity of Disease

 ,
, 
 , ,
, , 

Abstract
:1. Introduction
2. Materials and Methods
2.1. Design and Setting
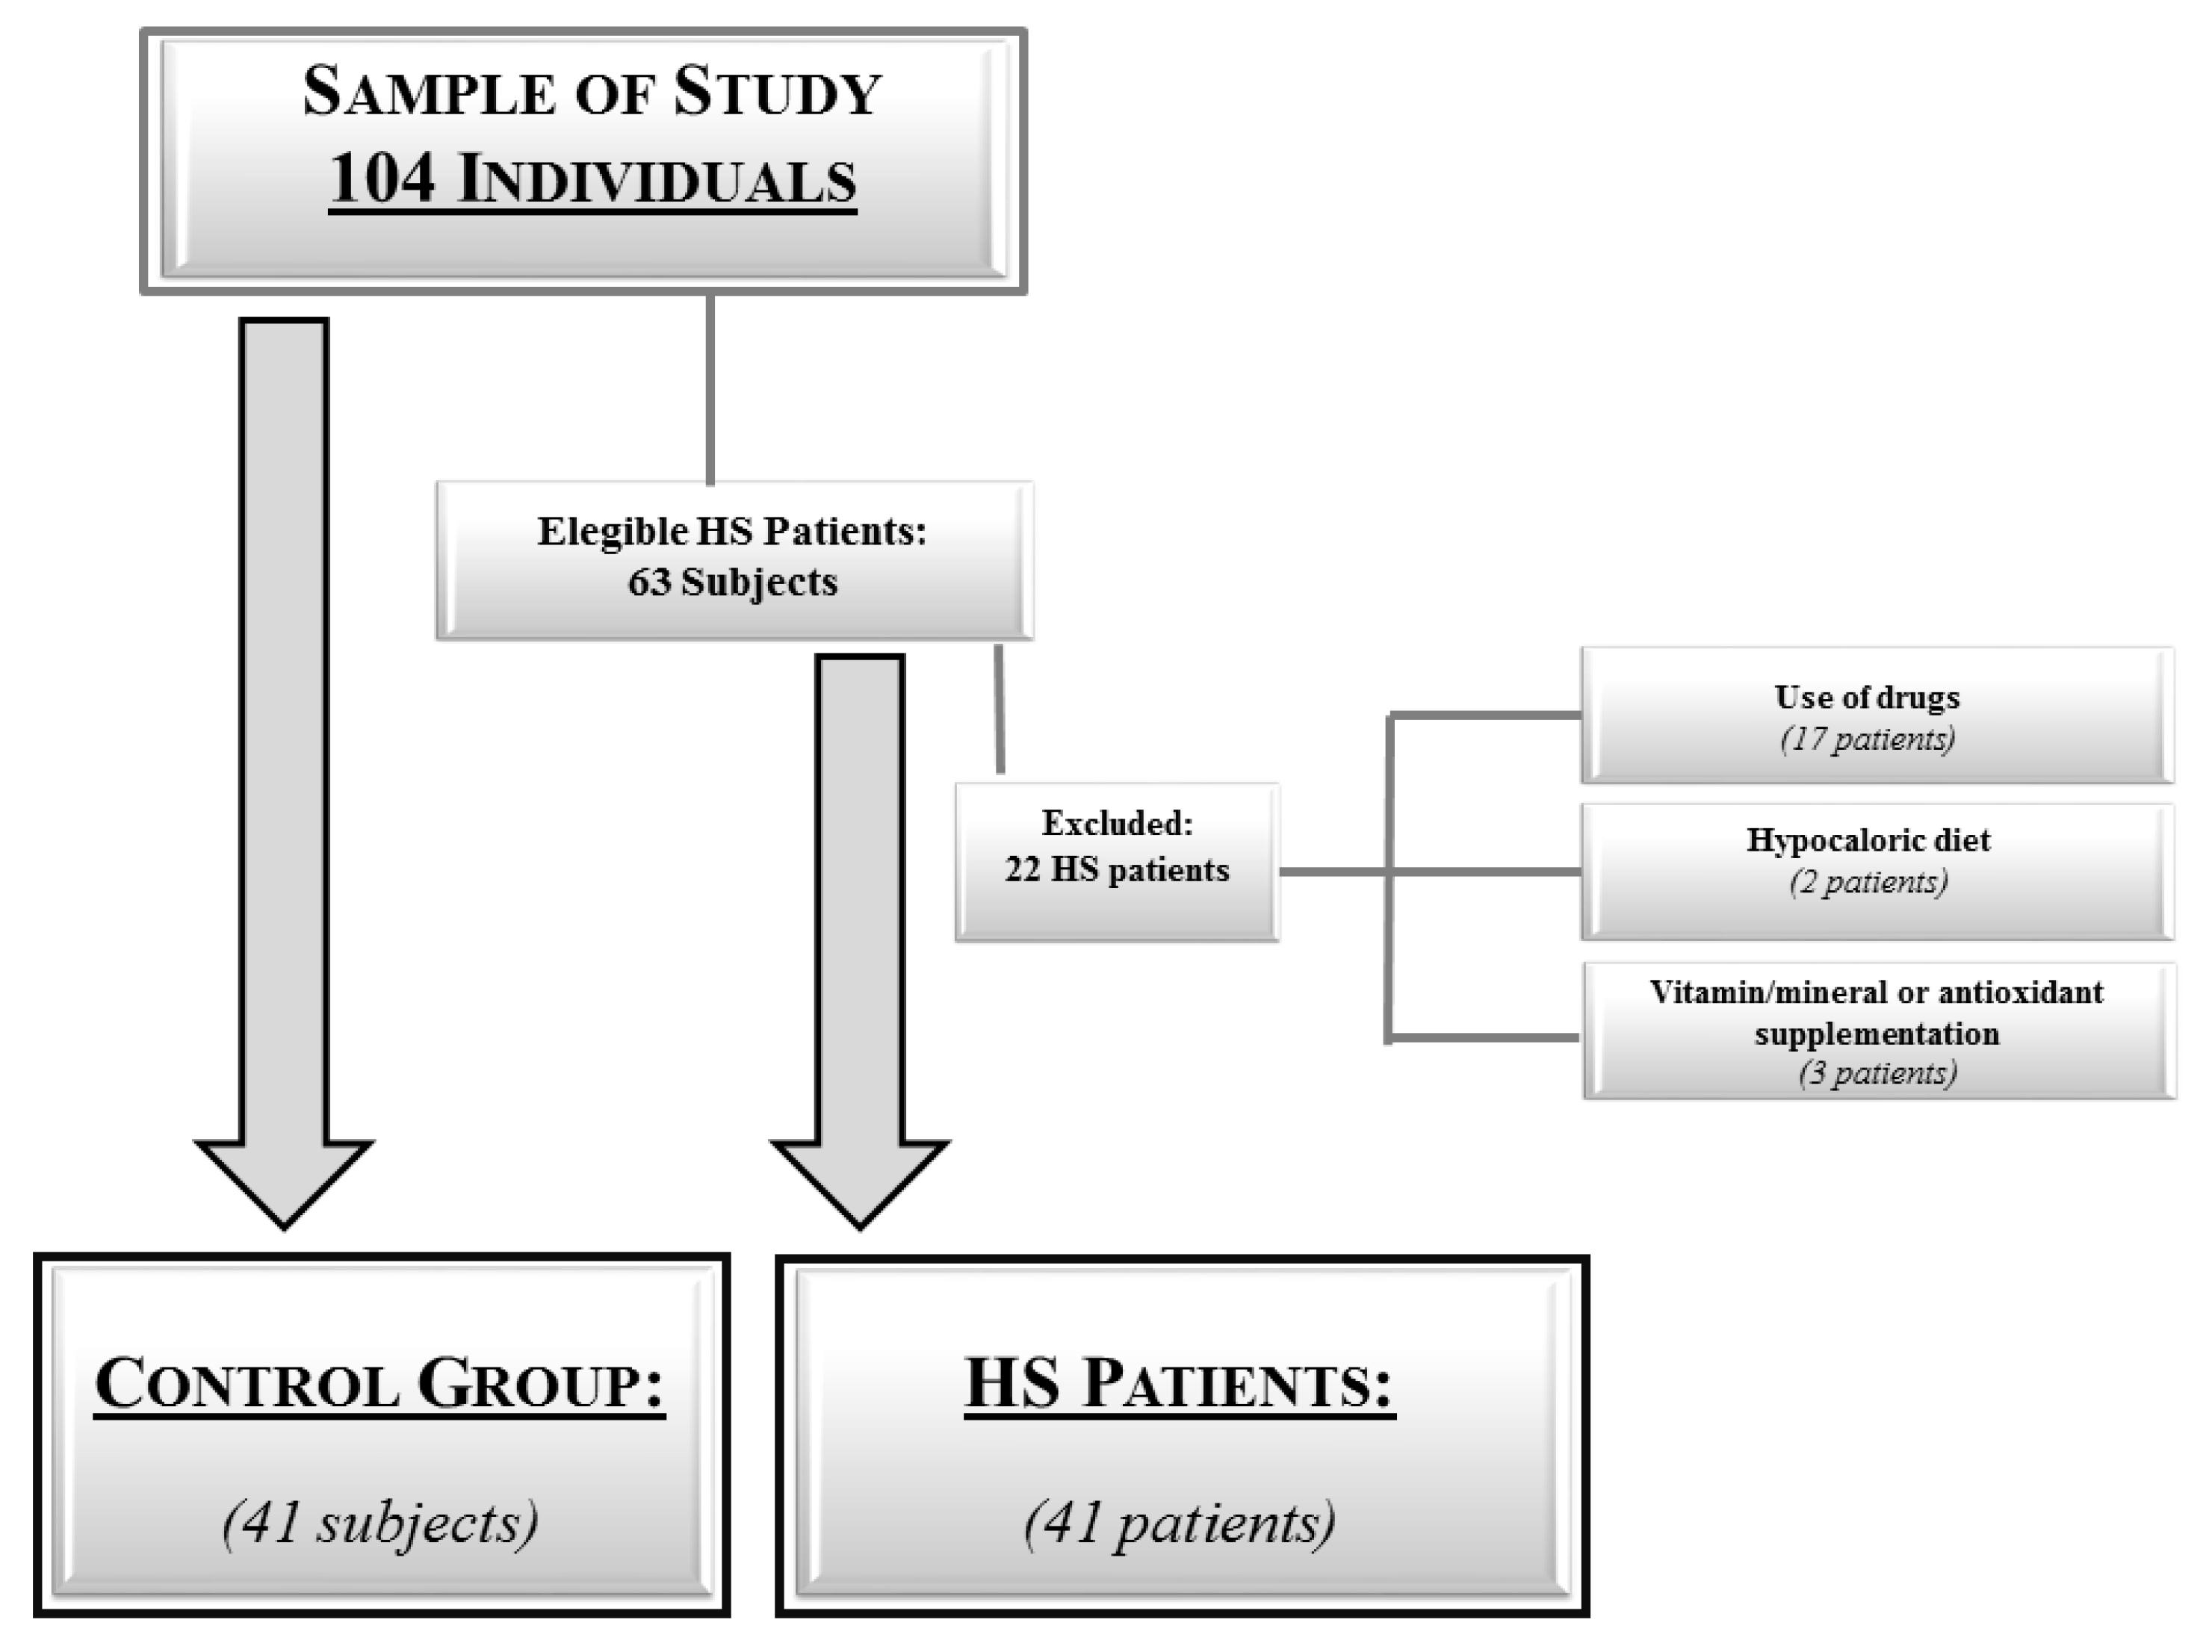
2.2. Population Study
Power Size Justification
2.3. Lifestyle Habits
2.4. Anthropometric Measurements and Blood Pressure
2.5. Bioelectrical Impedance Analysis
2.6. Adherence to the MD
2.7. Dietary Assessment
2.8. Classification and Severity Assessment of HS
2.9. Evaluation of the Oxidized Low-Density Lipoprotein Levels
2.10. Statistical Analysis
3. Results
Correlation Studies
4. Discussion
5. Conclusions
Supplementary Materials
Author Contributions
Funding
Acknowledgments
Conflicts of Interest
Abbreviations
| HS | Hidradenitis suppurativa |
| MD | Mediterranean diet |
| BIA | Bioelectrical Impedance Analysis |
| PREDIMED | PREvención con DIeta MEDiterránea |
| PhA | phase angle |
| BMI | body mass index |
| WC | waist circumference |
| SD | Standard Deviation |
| R | resistance |
| Xc | reactance |
| GA | Physician’s Global Assessment |
| ox-LDL | oxidized low-density lipoprotein |
| OR | Proportional Odds Ratio |
| IC | interval confidence |
| ROC | receiver operator characteristic |
| AUC | area under the curve |
| ICW | Intra-cellular Water |
| ECW | Extra-cellular Water |
| FM | Fat Mass |
| MUFA | Monounsaturated Fatty Acids |
| PUFA | Polyunsaturated Fatty Acids |
| SFA | Saturated Fatty Acid |
| FFM | Free Fat Mass |
References
- Verneuil, A. Etudes sur les tumeurs de la peau; de quelques maladies des glandes sudoripares. Arch. Gen. Med. 1854, 4, 447–468. [Google Scholar]
- Saunte, D.M.L.; Jemec, G.B.E. Hidradenitis suppurativa: Advances in diagnosis and treatment. JAMA 2017, 318, 2019–2032. [Google Scholar] [CrossRef] [PubMed]
- Revuz, J.E.; Canoui-Poitrine, F.; Wolkenstein, P.; Viallette, C.; Gabison, G.; Pouget, F.; Poli, F.; Faye, O.; Roujeau, J.C.; Bonnelye, G.; et al. Prevalence and factors associated with hidradenitis suppurativa: Results from two case-control studies. J. Am. Acad. Dermatol. 2008, 59, 596–601. [Google Scholar] [CrossRef] [PubMed]
- Jemec, G.B.; Heidenheim, M.; Nielsen, N.H. The prevalence of hidradenitis suppurativa and its potential precursor lesions. J. Am. Acad. Dermatol. 1996, 35, 191–194. [Google Scholar] [CrossRef]
- Jemec, G.B. The symptomatology of hidradenitis suppurativa in women. Br. J. Dermatol. 1988, 119, 345–350. [Google Scholar] [CrossRef] [PubMed]
- Vazquez, B.G.; Alikhan, A.; Weaver, A.L.; Wetter, D.A.; Davis, M.D. Incidence of hidradenitis suppurativa and associated factors: A population-based study of Olmsted County, Minnesota. J. Invest. Dermatol. 2013, 133, 97–103. [Google Scholar] [CrossRef]
- Cosmatos, I.; Matcho, A.; Weinstein, R.; Montgomery, M.O.; Stang, P. Analysis of patient claims data to determine the prevalence of hidradenitis suppurativa in the United States. J. Am. Acad. Dermatol. 2013, 69, 819. [Google Scholar] [CrossRef]
- Napolitano, M.; Megna, M.; Timoshchuk, E.A.; Patruno, C.; Balato, N.; Fabbrocini, G.; Monfrecola, G. Hidradenitis suppurativa: From pathogenesis to diagnosis and treatment. Clin. Cosmet. Investig. Dermatol. 2017, 10, 105–115. [Google Scholar] [CrossRef]
- Von der Werth, J.M.; Williams, H.C. The natural history of hidradenitis suppurativa. J. Eur. Acad. Dermatol. Venereol. 2000, 14, 389–392. [Google Scholar] [CrossRef]
- Canoui-Poitrine, F.; Revuz, J.E.; Wolkenstein, P.; Viallette, C.; Gabison, G.; Pouget, F.; Poli, F.; Faye, O.; Bastuji-Garin, S. Clinical characteristics of a series of 302 French patients with hidradenitis suppurativa, with an analysis of factors associated with disease severity. J. Am. Acad. Dermatol. 2009, 61, 51–57. [Google Scholar] [CrossRef]
- Prens, E.; Deckers, I. Pathophysiology of hidradenitis suppurativa: An update. J. Am. Acad. Dermatol. 2015, 73, S8–S11. [Google Scholar] [CrossRef] [PubMed]
- Kohorst, J.J.; Kimball, A.B.; Davis, M.D. Systemic associations of hidradenitis suppurativa. J. Am. Acad. Dermatol. 2015, 73, S27–S35. [Google Scholar] [CrossRef] [PubMed]
- Scheinfeld, N. Hidradenitis suppurativa: A practical review of possible medical treatments based on over 350 hidradenitis patients. Dermatol. Online J. 2013, 19, 1. [Google Scholar] [PubMed]
- Alikhan, A.; Lynch, P.J.; Eisen, D.B. Hidradenitis suppurativa: A comprehensive review. J. Am. Acad. Dermatol. 2009, 60, 539–561. [Google Scholar] [CrossRef] [PubMed]
- Schneider, M.R.; Paus, R. Deciphering the functions of the hair follicle infundibulum in skin physiology and disease. Cell Tissue Res. 2014, 358, 697–704. [Google Scholar] [CrossRef] [PubMed]
- Wong, V.W.; Akaishi, S.; Longaker, M.T.; Gurtner, G.C. Pushing back: Wound mechanotransduction in repair and regeneration. J. Invest. Dermatol. 2011, 131, 2186–2196. [Google Scholar] [CrossRef] [PubMed]
- Okorodudu, D.O.; Jumean, M.F.; Montori, V.M.; Romero-Corral, A.; Somers, V.K.; Erwin, P.J.; Lopez-Jimenez, F. Diagnostic performance of body mass index to identify obesity as defined by body adiposity: A systematic review and meta-analysis. Int. J. Obes. 2010, 34, 91–99. [Google Scholar] [CrossRef] [PubMed]
- The National Institute of Health. Clinical guidelines on the identification, evaluation, and treatment of overweight and obesity in adults—The evidence report. National Institutes of Health. Obes. Res. 1998, 6 (Suppl. 2), 51S–209S. [Google Scholar]
- Bosy-Westphal, A.; Booke, C.A.; Blöcker, T.; Kossel, E.; Goele, K.; Later, W.; Hitze, B.; Heller, M.; Glüer, C.C.; Müller, M.J. Measurement site for waist circumference affects its accuracy as an index of visceral and abdominal subcutaneous fat in a Caucasian population. J. Nutr. 2010, 140, 954–961. [Google Scholar] [CrossRef]
- Jensen, M.D. Role of body fat distribution and the metabolic complications of obesity. J. Clin. Endocrinol. Metab. 2008, 93, S57–S63. [Google Scholar] [CrossRef]
- Vossen, A.R.; van der Zee, H.H.; Onderdijk, A.J.; Boer, J.; Prens, E.P. Hidradenitis suppurativa is not associated with the metabolic syndrome based on body type: A cross-sectional study. J. Dermatol. 2017, 44, 154–159. [Google Scholar] [CrossRef] [PubMed]
- Stefanadi, E.C.; Dimitrakakis, G.; Antoniou, C.K.; Challoumas, D.; Punjabi, N.; Dimitrakaki, I.A.; Punjabi, S.; Stefanadis, C.I. Metabolic syndrome and the skin: A more than superficial association. Reviewing the association between skin diseases and metabolic syndrome and a clinical decision algorithm for high risk patients. Diabetol. Metab. Syndr. 2018, 10, 9. [Google Scholar] [CrossRef] [PubMed]
- Shah, A.; Alhusayen, R.; Amini-Nik, S. The critical role of macrophages in the pathogenesis of hidradenitis suppurativa. Inflamm. Res. 2017, 66, 931–945. [Google Scholar] [CrossRef] [PubMed]
- Romaní, J.; Agut-Busquet, E.; Corbacho, M.; Herrerías-Moreno, J.; Luelmo, J. Body fat composition in hidradenitis suppurativa: A hospital-based cross-sectional study. Int. J. Dermatol. 2017, 56, e62–e63. [Google Scholar] [CrossRef] [PubMed]
- Miller, I.M.; Rytgaard, H.; Mogensen, U.B.; Miller, E.; Ring, H.C.; Ellervik, C.; Jemec, G.B. Body composition and basal metabolic rate in Hidradenitis Suppurativa: A Danish population-based and hospital-based cross-sectional study. J. Eur. Acad. Dermatol. Venereol. 2016, 30, 980–988. [Google Scholar] [CrossRef] [PubMed]
- Böhm, A.; Heitmann, B.L. The use of bioelectrical impedance analysis for body composition in epidemiological studies. Eur. J. Clin. Nutr. 2013, 67 (Suppl. 1), S79. [Google Scholar] [CrossRef]
- Smith, M.K.; Nicholson, C.L.; Parks-Miller, A.; Hamzavi, I.H. Hidradenitis suppurativa: An update on connecting the tracts. F1000Res. 2017, 6, 1272. [Google Scholar] [CrossRef]
- Danby, F.W. Diet in the prevention of hidradenitis suppurativa (acne inversa). J. Am. Acad. Dermatol. 2015, 73, S52–S54. [Google Scholar] [CrossRef]
- Cannistrà, C.; Finocchi, V.; Trivisonno, A.; Tambasco, D. New perspectives in the treatment of hidradenitis suppurativa: Surgery and brewer’s yeast-exclusion diet. Surgery 2013, 154, 1126–1130. [Google Scholar] [CrossRef]
- Hu, F.B. Dietary pattern analysis: A new direction in nutritional epidemiology. Curr. Opin. Lipidol. 2002, 13, 3–9. [Google Scholar] [CrossRef]
- Høidrup, S.; Andreasen, A.H.; Osler, M.; Pedersen, A.N.; Jørgensen, L.M.; Jørgensen, T.; Schroll, M.; Heitmann, B.L. Assessment of habitual energy and macronutrient intake in adults: Comparison of a seven day food record with a dietary history interview. Eur. J. Clin. Nutr. 2002, 56, 105–113. [Google Scholar] [CrossRef] [PubMed]
- Nishida, C.; Ko, G.T.; Kumanyika, S. Body fat distribution and noncommunicable diseases in populations: Overview of the 2008 WHO expert consultation on waist circumference and waist-hip ratio. Eur. J. Clin. Nutr. 2010, 64, 2–5. [Google Scholar] [CrossRef] [PubMed]
- Yanovski, S.Z.; Hubbard, V.S.; Heymsfield, S.B.; Lukaski, H.C. Bioelectrical impedance analysis in body composition measurement: National institutes of health technology assessment conference statement. Am J. Clin. Nutr. 1996, 64, 524S–532S. [Google Scholar] [CrossRef]
- Barrea, L.; Muscogiuri, G.; Macchia, P.E.; Di Somma, C.; Falco, A.; Savanelli, M.C.; Colao, A.; Savastano, S. Mediterranean diet and phase angle in a sample of adult population: Results of a pilot study. Nutrients 2017, 9, 151. [Google Scholar] [CrossRef] [PubMed]
- Barrea, L.; Macchia, P.E.; Di Somma, C.; Napolitano, M.; Balato, A.; Falco, A.; Savanelli, M.C.; Balato, N.; Colao, A.; Savastano, S. Bioelectrical phase angle and psoriasis: A novel association with psoriasis severity, quality of life and metabolic syndrome. J. Transl. Med. 2016, 14, 130. [Google Scholar] [CrossRef] [PubMed]
- Barrea, L.; Balato, N.; Di Somma, C.; Macchia, P.E.; Napolitano, M.; Savanelli, M.C.; Esposito, K.; Colao, A.; Savastano, S. Nutrition and psoriasis: Is there any association between the severity of the disease and adherence to the Mediterranean diet? J. Transl. Med. 2015, 13, 18. [Google Scholar] [CrossRef] [PubMed]
- Barrea, L.; Altieri, B.; Muscogiuri, G.; Laudisio, D.; Annunziata, G.; Colao, A.; Faggiano, A.; Savastano, S. Impact of nutritional status on gastroenteropancreatic neuroendocrine tumors (GEP-NET) aggressiveness. Nutrients 2018, 10, 1854. [Google Scholar] [CrossRef] [PubMed]
- Kyle, U.G.; Bosaeus, I.; De Lorenzo, A.D.; Deurenberg, P.; Elia, M.; Manuel Gómez, J.; Lilienthal Heitmann, B.; Kent-Smith, L.; Melchior, J.C.; Pirlich, M.; et al. Bioelectrical impedance analysis-part II: Utilization in clinical practice. Clin. Nutr. 2004, 23, 1430–1453. [Google Scholar] [CrossRef] [PubMed]
- Kushner, R.F. Bioelectrical impedance analysis: A review of principles and applications. J. Am. Coll. Nutr. 1992, 11, 199–209. [Google Scholar]
- Martínez-González, M.A.; García-Arellano, A.; Toledo, E.; Salas-Salvadó, J.; Buil-Cosiales, P.; Corella, D.; Covas, M.I.; Schröder, H.; Arós, F.; Gómez-Gracia, E.; et al. A 14-item Mediterranean diet assessment tool and obesity indexes among high-risk subjects: The PREDIMED trial. PLoS ONE 2012, 7, e43134. [Google Scholar] [CrossRef]
- Barrea, L.; Muscogiuri, G.; Di Somma, C.; Tramontano, G.; De Luca, V.; Illario, M.; Colao, A.; Savastano, S. Association between Mediterranean diet and hand grip strength in older adult women. Clin. Nutr. 2018. [Google Scholar] [CrossRef] [PubMed]
- Barrea, L.; Muscogiuri, G.; Di Somma, C.; Annunziata, G.; Megna, M.; Falco, A.; Balato, A.; Colao, A.; Savastano, S. Coffee consumption, metabolic syndrome and clinical severity of psoriasis: Good or bad stuff? Arch. Toxicol. 2018, 92, 1831–1845. [Google Scholar] [CrossRef] [PubMed]
- Barrea, L.; Di Somma, C.; Macchia, P.E.; Falco, A.; Savanelli, M.C.; Orio, F.; Colao, A.; Savastano, S. Influence of nutrition on somatotropic axis: Milk consumption in adult individuals with moderate-severe obesity. Clin. Nutr. 2017, 36, 293–301. [Google Scholar] [CrossRef] [PubMed]
- Savanelli, M.C.; Barrea, L.; Macchia, P.E.; Savastano, S.; Falco, A.; Renzullo, A.; Scarano, E.; Nettore, I.C.; Colao, A.; Di Somma, C. Preliminary results demonstrating the impact of Mediterranean diet on bone health. J. Transl. Med. 2017, 15, 81. [Google Scholar] [CrossRef] [PubMed] [Green Version]
- Barrea, L.; Tarantino, G.; Di Somma, C.; Muscogiuri, G.; Macchia, P.E.; Falco, A.; Colao, A.; Savastano, S. Adherence to the mediterranean diet and circulating levels of sirtuin 4 in obese patients: A novel association. Oxid. Med. Cell. Longev. 2017, 2017, 6101254. [Google Scholar] [CrossRef] [PubMed]
- Vuolo, L.; Barrea, L.; Savanelli, M.C.; Savastano, S.; Rubino, M.; Scarano, E.; Soprano, M.; Illario, M.; Colao, A.; Di Somma, C. Nutrition and osteoporosis: Preliminary data of campania region of European PERsonalised ICT supported service for independent living and active ageing. Transl. Med. UniSa 2016, 13, 13–18. [Google Scholar] [PubMed]
- Barrea, L.; Macchia, P.E.; Tarantino, G.; Di Somma, C.; Pane, E.; Balato, N.; Napolitano, M.; Colao, A.; Savastano, S. Nutrition: A key environmental dietary factor in clinical severity and cardio-metabolic risk in psoriatic male patients evaluated by 7-day food-frequency questionnaire. J. Transl. Med. 2015, 13, 303. [Google Scholar] [CrossRef]
- Barrea, L.; Annunziata, G.; Muscogiuri, G.; Laudisio, D.; Di Somma, C.; Maisto, M.; Tenore, G.C.; Colao, A.; Savastano, S. Trimethylamine N-oxide (TMAO), mediterranean diet and nutrition in healthy, normal-weight subjects: Is it also a matter of gender? Nutrition 2018. [Google Scholar] [CrossRef]
- Barrea, L.; Annunziata, G.; Muscogiuri, G.; Di Somma, C.; Laudisio, D.; Maisto, M.; de Alteriis, G.; Tenore, G.C.; Colao, A.; Savastano, S. Trimethylamine-N-oxide (TMAO) as novel potential biomarker of early predictors of metabolic syndrome. Nutrients 2018, 10, 1971. [Google Scholar] [CrossRef]
- Turconi, G.; Guarcello, M.; Berzolari, F.G.; Carolei, A.; Bazzano, R.; Roggi, C. An evaluation of a colour food photography atlas as a tool for quantifying food portion size in epidemiological dietary surveys. Eur. J. Clin. Nutr. 2005, 59, 923–931. [Google Scholar] [CrossRef] [Green Version]
- Sartorius, K.; Emtestam, L.; Jemec, G.B.; Lapins, J. Objective scoring of hidradenitis suppurativa reflecting the role of tobacco smoking and obesity. Br. J. Dermatol. 2009, 161, 831–839. [Google Scholar] [CrossRef] [PubMed]
- Zouboulis, C.C.; Desai, N.; Emtestam, L.; Hunger, R.E.; Ioannides, D.; Juhász, I.; Lapins, J.; Matusiak, L.; Prens, E.P.; Revuz, J.; et al. European S1 guideline for the treatment of hidradenitis suppurativa/acne inversa. J. Eur. Acad. Dermatol. Venereol. 2015, 29, 619–644. [Google Scholar] [CrossRef] [PubMed] [Green Version]
- Kimball, A.B.; Kerdel, F.; Adams, D.; Mrowietz, U.; Gelfand, J.M.; Gniadecki, R.; Prens, E.P.; Schlessinger, J.; Zouboulis, C.C.; van der Zee, H.H.; Rosenfeld, M.; et al. Adalimumab for the treatment of moderate to severe Hidradenitis suppurativa: A parallel randomized trial. Ann. Intern. Med. 2012, 157, 846–855. [Google Scholar] [CrossRef] [PubMed]
- Macri, A.; Scanarotti, C.; Bassi, A.M.; Giuffrida, S.; Sangalli, G.; Traverso, C.E.; Iester, M. Evaluation of oxidative stress levels in the conjunctival epithelium of patients with or without dry eye, and dry eye patients treated with preservative-free hyaluronic acid 0.15 % and vitamin B12 eye drops. Graefes Arch. Clin. Exp. Ophthalmol. 2015, 253, 425–430. [Google Scholar] [CrossRef] [PubMed]
- Mancini, S.; Mariani, F.; Sena, P.; Benincasa, M.; Roncucci, L. Myeloperoxidase expression in human colonic mucosa is related to systemic oxidative balance in healthy subjects. Redox Rep. 2017, 22, 399–407. [Google Scholar] [CrossRef] [PubMed]
- Baumgartner, R.N.; Ross, R.; Heymsfield, S.B. Does adipose tissue influence bioelectric impedance in obese men and women? J. Appl. Physiol. 1998, 84, 257–262. [Google Scholar] [CrossRef] [PubMed]
- Deurenberg, P. Limitations of the bioelectrical impedance method for the assessment of body fat in severe obesity. Am. J. Clin. Nutr. 1996, 64, 449S–452S. [Google Scholar] [CrossRef] [PubMed] [Green Version]
- Stobäus, N.; Pirlich, M.; Valentini, L.; Schulzke, J.D.; Norman, K. Determinants of bioelectrical phase angle in disease. Br. J. Nutr. 2012, 107, 1217–1220. [Google Scholar] [CrossRef] [PubMed]
- Norman, K.; Stobäus, N.; Zocher, D.; Bosy-Westphal, A.; Szramek, A.; Scheufele, R.; Smoliner, C.; Pirlich, M. Cutoff percentiles of bioelectrical phase angle predict functionality, quality of life, and mortality in patients with cancer. Am. J. Clin. Nutr. 2010, 92, 612–619. [Google Scholar] [CrossRef] [PubMed] [Green Version]
- Sardinha, L.B. Physiology of exercise and phase angle: Another look at BIA. Eur. J. Clin. Nutr. 2018, 72, 1323–1327. [Google Scholar] [CrossRef]
- Norman, K.; Stobäus, N.; Pirlich, M.; Bosy-Westphal, A. Bioelectrical phase angle and impedance vector analysis--clinical relevance and applicability of impedance parameters. Clin. Nutr. 2012, 31, 854–861. [Google Scholar] [CrossRef] [PubMed]
- Kyle, U.G.; Soundar, E.P.; Genton, L.; Pichard, C. Can phase angle determined by bioelectrical impedance analysis assess nutritional risk? A comparison between healthy and hospitalized subjects. Clin. Nutr. 2012, 31, 875–881. [Google Scholar] [CrossRef] [PubMed]
- Siddiqui, N.I.; Khan, S.A.; Shoeb, M.; Bose, S. Anthropometric predictors of bio-impedance analysis (BIA) phase angle in healthy adults. J. Clin. Diagn. Res. 2016, 10, CC01–CC04. [Google Scholar] [CrossRef] [PubMed]
- Barbosa-Silva, M.C.; Barros, A.J.; Wang, J.; Heymsfield, S.B.; Pierson Jr, R.N. Bioelectrical impedance analysis: Population reference values for phase angle by age and sex. Am. J. Clin. Nutr. 2005, 82, 49–52. [Google Scholar] [CrossRef] [PubMed]
- Piccoli, A.; Rossi, B.; Pillon, L.; Bucciante, G. A new method for monitoring body fluid variation by bioimpedance analysis: The RXc graph. Kidney Int. 1994, 46, 534–539. [Google Scholar] [CrossRef] [PubMed] [Green Version]
- Chertow, G.M.; Lowrie, E.G.; Wilmore, D.W.; Gonzalez, J.; Lew, N.L.; Ling, J.; Leboff, M.S.; Gottlieb, M.N.; Huang, W.; Zebrowski, B. Nutritional assessment with bioelectrical impedance analysis in maintenance hemodialysis patients. J. Am. Soc. Nephrol. 1995, 6, 75–81. [Google Scholar]
- Tresserra-Rimbau, A.; Rimm, E.B.; Medina-Remon, A.; Martinez-Gonzalez, M.A.; Lopez-Sabater, M.C.; Covas, M.I.; Corella, D.; Salas-Salvadó, J.; Gómez-Gracia, E.; Lapetra, J.; et al. Polyphenol intake and mortality risk: A re-analysis of the PREDIMED trial. BMC Med. 2014, 12, 77. [Google Scholar] [CrossRef]
- Casas, R.; Urpi-Sardà, M.; Sacanella, E.; Arranz, S.; Corella, D.; Castañer, O.; Lamuela-Raventós, R.M.; Salas-Salvadó, J.; Lapetra, J.; Portillo, M.P.; Estruch, R. Anti-inflammatory effects of the mediterranean diet in the early and late stages of atheroma plaque development. Mediat. Inflamm. 2017, 2017, 3674390. [Google Scholar] [CrossRef]

| Parameters | HS Patients n = 41 | Control Group n = 41 | p-Value |
|---|---|---|---|
| Lifestyle Habits | |||
| Gender, male (n, %) | 14, 34.1% | 14, 34.1% | χ2 = 0.071, p = 0.789 |
| Age (years) | 26.22 ± 9.88 | 27.07 ± 8.06 | 0.298 |
| Smoking (yes) | 22, 53.7% | 21, 51.2% | χ2 = 0.00, p = 1.00 |
| Physical activity (yes) | 16, 39.0% | 15, 36.6% | χ2 = 0.00, p = 1.00 |
| Anthropometric Measurement | |||
| Weight (kg) | 84.97 ± 21.33 | 84.24 ± 19.46 | 0.543 |
| Height (m) | 1.65 ± 0.09 | 1.65 ± 0.07 | 1.000 |
| BMI (kg/m2) | 31.05 ± 7.66 | 30.88 ± 7.01 | 0.750 |
| Normal-weight (n, %) | 7, 17.1% | 10, 24.4% | χ2 = 0.30, p = 0.586 |
| Overweight (n, %) | 14, 34.1% | 11, 26.8% | χ2 = 0.23, p = 0.631 |
| Grade I obesity (n, %) | 12, 29.3% | 10, 24.4% | χ2 = 0.06, p = 0.803 |
| Grade II obesity (n, %) | 4, 9.8% | 6, 14.6% | χ2 = 0.011, p = 0.736 |
| Grade III obesity (n, %) | 4, 9.8% | 4, 9.8% | χ2 = 0.14, p = 0.710 |
| WC male (cm) | 101.62 ± 15.86 | 94.52 ± 19.19 | 0.215 |
| <cut-off (n, %) | 7, 50% | 8, 57.1% | χ2 = 0.00, p = 1.00 |
| >cuf-off (n, %) | 7, 50% | 6, 42.9% | |
| WC female (cm) | 92.73 ± 19.05 | 95.11 ± 16.97 | 0.590 |
| <cut-off (n, %) | 11, 40.7% | 10, 37.0% | χ2 = 0.00, p = 1.00 |
| >cuf-off (n, %) | 16, 59.3% | 17, 63.0% |
| BIA Parameters | HS Patients n = 41 | Control Group n = 41 | |
|---|---|---|---|
| Mean ± SD | Mean ± SD | p Value | |
| R (Ω) | 486.85 ± 73.06 | 500.29 ± 65.96 | 0.442 |
| Xc (Ω) | 52.15 ± 9.60 | 58.54 ± 7.82 | 0.003 |
| PhA (°) | 6.06 ± 0.76 | 6.7 ± 0.67 | <0.001 |
| FM (kg) | 30.61 ± 16.90 | 29.79 ± 16.34 | 0.938 |
| FM (%) | 33.35 ± 11.63 | 33.05 ± 12.61 | 0.842 |
| FFM (kg) | 55.72 ± 8.52 | 54.45 ± 6.87 | 0.350 |
| FFM (%) | 65.67 ± 11.98 | 66.95 ± 12.61 | 0.504 |
| TBW (Lt) | 40.68 ± 6.23 | 39.86 ± 5.03 | 0.410 |
| TBW (%) | 48.66 ± 8.52 | 49.01 ± 9.23 | 0.756 |
| ECW (Lt) | 18.65 ± 3.36 | 17.07 ± 2.39 | <0.001 |
| ECW (%) | 45.79 ± 3.57 | 42.85 ± 2.80 | <0.001 |
| ICW (Lt) | 22.02 ± 3.56 | 22.79 ± 3.17 | 0.224 |
| ICW (%) | 54.20 ± 3.57 | 57.16 ± 2.81 | <0.001 |
| Questions PREDIMED Questionnaire | HS Patients n = 41 | Control Group n = 41 | ||||
|---|---|---|---|---|---|---|
| n | % | n | % | χ2 | p-Value | |
| Use of extra virgin olive oil as main culinary lipid | 38 | 92.7 | 40 | 97.6 | 0.26 | 0.608 |
| Extra virgin olive oil > 4 tablespoons | 25 | 61.0 | 31 | 75.6 | 1.41 | 0.235 |
| Vegetables ≥ 2 servings/day | 14 | 34.1 | 17 | 41.5 | 0.207 | 0.649 |
| Fruits ≥ 3 servings/day | 18 | 43.9 | 26 | 63.4 | 2.41 | 0.121 |
| Red/processed meats < 1/day | 18 | 43.9 | 31 | 75.6 | 7.30 | 0.007 |
| Butter, cream, margarine < 1/day | 22 | 53.7 | 25 | 61.0 | 0.20 | 0.655 |
| Soda drinks < 1/day | 17 | 41.5 | 20 | 48.8 | 0.19 | 0.657 |
| Wine glasses ≥ 7/week | 11 | 26.8 | 14 | 34.1 | 0.23 | 0.631 |
| Legumes ≥ 3/week | 23 | 56.1 | 19 | 46.3 | 0.44 | 0.508 |
| Fish/seafood ≥ 3/week | 16 | 39.0 | 31 | 75.6 | 9.77 | 0.001 |
| Commercial sweets and confectionery ≤2 /week | 18 | 43.9 | 14 | 34.1 | 0.46 | 0.497 |
| Tree nuts ≥ 3/week | 19 | 46.3 | 24 | 58.5 | 0.78 | 0.376 |
| Poultry more than red meats | 24 | 58.5 | 21 | 51.2 | 0.20 | 0.657 |
| Use of sofrito sauce ≥2 /week | 20 | 48.8 | 19 | 46.3 | 0.00 | 1.00 |
| Parameters | HS Patients n = 41 | Control Group n = 41 | p-Value |
|---|---|---|---|
| Total energy (kcal) | 2281.49 ± 269.81 | 2302.68 ± 168.63 | 0.443 |
| Protein (gr of total kcal) | 100.21 ± 17.63 | 101.54 ± 11.77 | 0.587 |
| Carbohydrate (gr of total kcal) | 310.21 ± 39.44 | 314.19 ± 24.29 | 0.391 |
| Complex (gr of total kcal) | 208.53 ± 28.30 | 216.02 ± 18.22 | 0.043 |
| Simple (gr of total kcal) | 101.68 ± 13.53 | 98.18 ± 9.53 | 0.111 |
| Fat (gr of total kcal) | 71.09 ± 8.90 | 71.08 ± 6.39 | 0.996 |
| SFA (gr of total kcal) | 24.73 ± 3.16 | 21.81 ± 2.30 | <0.001 |
| MUFA (gr of total kcal) | 32.25 ± 4.74 | 33.79 ± 2.99 | 0.030 |
| PUFA (gr of total kcal) | 14.11 ± 2.57 | 15.47 ± 2.55 | 0.016 |
| n-6 PUFA (gr/day) | 5.81 ± 2.72 | 4.62 ± 1.24 | 0.008 |
| n-3 PUFA (gr/day) | 8.30 ± 1.69 | 10.85 ± 1.68 | <0.001 |
| BIA Parameters | Simple Correlations n = 41 | After Adjusted for Sex, Age, BMI and Total Energy Intake | ||
|---|---|---|---|---|
| r | p Value | r | p Value | |
| R (Ω) | −0.308 | 0.050 | 0.008 | 0.961 |
| Xc (Ω) | −0.095 | 0.553 | 0.114 | 0.501 |
| PhA (°) | −0.905 | <0.001 | −0.897 | <0.001 |
| FM (kg) | 0.023 | 0.886 | 0.531 | 0.001 |
| FM (%) | 0.017 | 0.915 | 0.293 | 0.079 |
| FFM (kg) | −0.240 | 0.130 | −0.088 | 0.606 |
| FFM (%) | −0.102 | 0.526 | −0.334 | 0.044 |
| TBW (Lt) | 0.236 | 0.137 | 0.105 | 0.535 |
| TBW (%) | −0.020 | 0.900 | −0.282 | 0.091 |
| ECW (Lt) | 0.581 | <0.001 | 0.463 | 0.004 |
| ECW (%) | 0.844 | <0.001 | 0.837 | <0.001 |
| ICW (Lt) | −0.136 | 0.398 | −0.508 | 0.001 |
| ICW (%) | −0.844 | <0.001 | −0.837 | <0.001 |
| Parameters | Simple Correlations n = 41 | After Adjusted for Sex, Age, BMI and Total Energy Intake | ||
|---|---|---|---|---|
| R | p-Value | r | p-Value | |
| Total energy (kcal) | 0.273 | 0.085 | −0.060 | 0.719 |
| Protein (gr of total kcal) | 0.148 | 0.357 | −0.160 | 0.339 |
| Carbohydrate (gr of total kcal) | 0.322 | 0.040 | 0.111 | 0.507 |
| Complex (gr of total kcal) | 0.280 | 0.077 | 0.026 | 0.875 |
| Simple (gr of total kcal) | 0.353 | 0.024 | 0.201 | 0.227 |
| Fat (gr of total kcal) | 0.155 | 0.334 | −0.114 | 0.496 |
| SFA (gr of total kcal) | 0.193 | 0.226 | −0.089 | 0.598 |
| MUFA (gr of total kcal) | 0.151 | 0.347 | −0.103 | 0.536 |
| PUFA (gr of total kcal) | 0.020 | 0.902 | −0.070 | 0.674 |
| n-6 PUFA (gr/day) | −0.005 | 0.976 | −0.062 | 0.711 |
| n-3 PUFA (gr/day) | −0.350 | 0.025 | −0.342 | 0.035 |
| Parameters | Multiple Regression Analysis | |||
|---|---|---|---|---|
| Model 1 | r2 | β | t | p value |
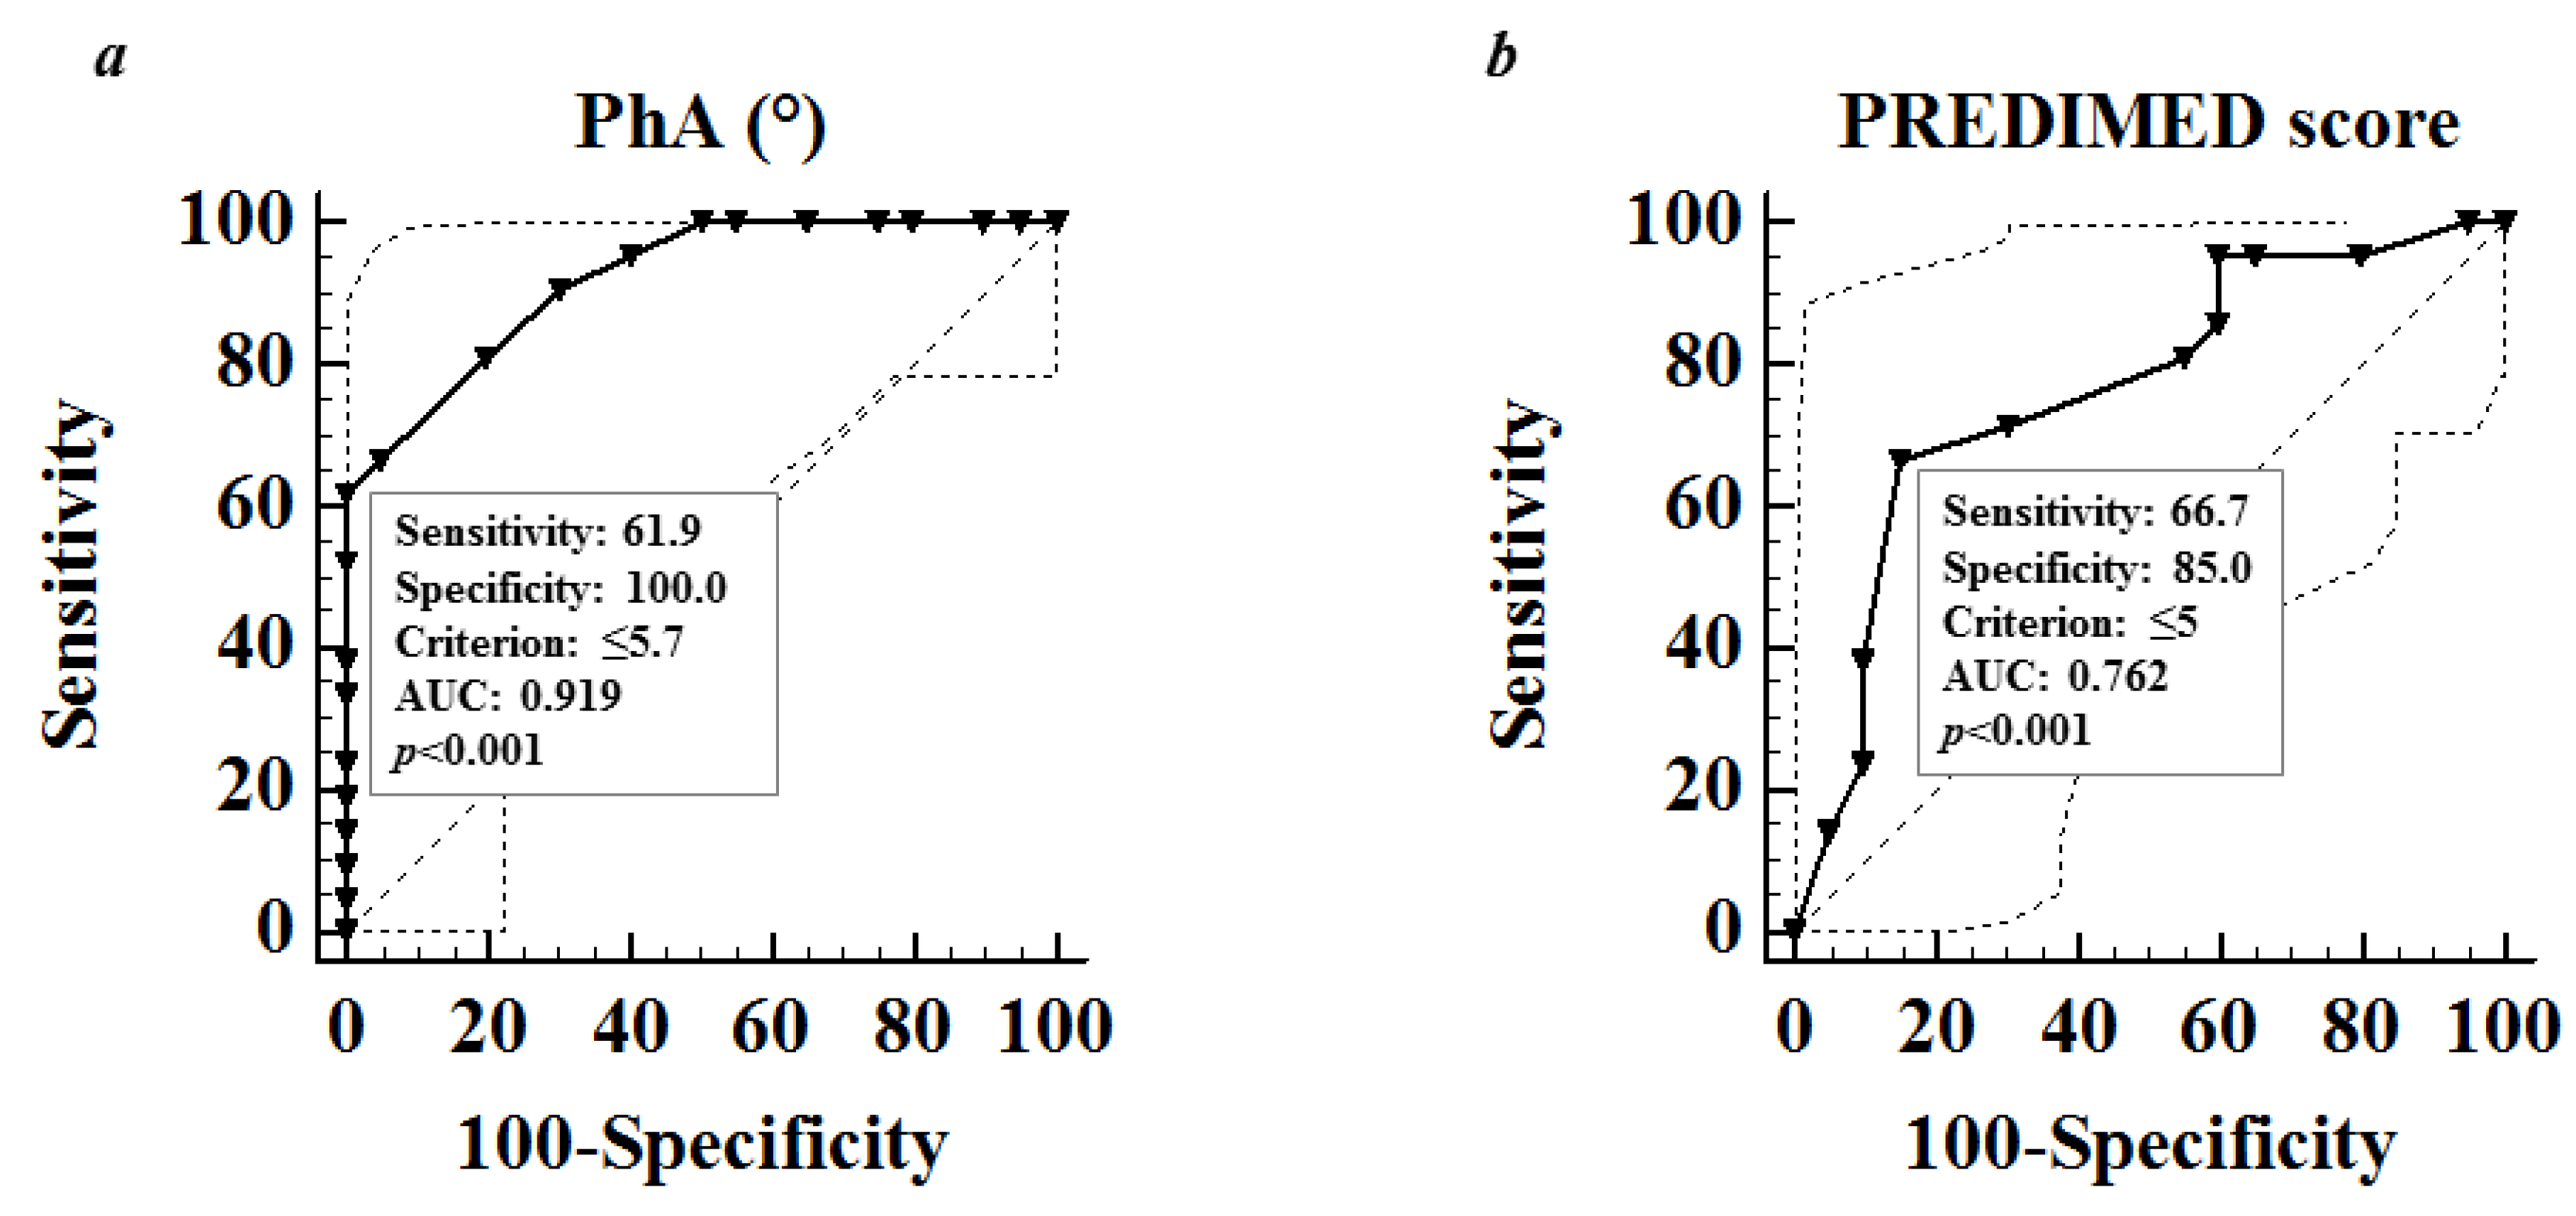
| PhA | 0.820 | –0.905 | –13.33 | <0.001 |
| Variable excluded: FM, FFM, ECW, ICW | ||||
| Model 2 | r2 | β | t | p value |
| PREDIMED Score | 0.304 | –0.552 | –4.13 | <0.001 |
| Variable excluded: n-3 PUFA and ox-LDL | ||||
© 2018 by the authors. Licensee MDPI, Basel, Switzerland. This article is an open access article distributed under the terms and conditions of the Creative Commons Attribution (CC BY) license (http://creativecommons.org/licenses/by/4.0/).
Share and Cite
Barrea, L.; Fabbrocini, G.; Annunziata, G.; Muscogiuri, G.; Donnarumma, M.; Marasca, C.; Colao, A.; Savastano, S. Role of Nutrition and Adherence to the Mediterranean Diet in the Multidisciplinary Approach of Hidradenitis Suppurativa: Evaluation of Nutritional Status and Its Association with Severity of Disease. Nutrients 2019, 11, 57. https://doi.org/10.3390/nu11010057
Barrea L, Fabbrocini G, Annunziata G, Muscogiuri G, Donnarumma M, Marasca C, Colao A, Savastano S. Role of Nutrition and Adherence to the Mediterranean Diet in the Multidisciplinary Approach of Hidradenitis Suppurativa: Evaluation of Nutritional Status and Its Association with Severity of Disease. Nutrients. 2019; 11(1):57. https://doi.org/10.3390/nu11010057
Chicago/Turabian StyleBarrea, Luigi, Gabriella Fabbrocini, Giuseppe Annunziata, Giovanna Muscogiuri, Marianna Donnarumma, Claudio Marasca, Annamaria Colao, and Silvia Savastano. 2019. "Role of Nutrition and Adherence to the Mediterranean Diet in the Multidisciplinary Approach of Hidradenitis Suppurativa: Evaluation of Nutritional Status and Its Association with Severity of Disease" Nutrients 11, no. 1: 57. https://doi.org/10.3390/nu11010057