The Decreasing Trend in Dietary Glycaemic Index and Glycaemic Load in Australian Children and Adolescents between 1995 and 2012

 and
and
Abstract
:1. Introduction
2. Materials and Methods
2.1. Data Used
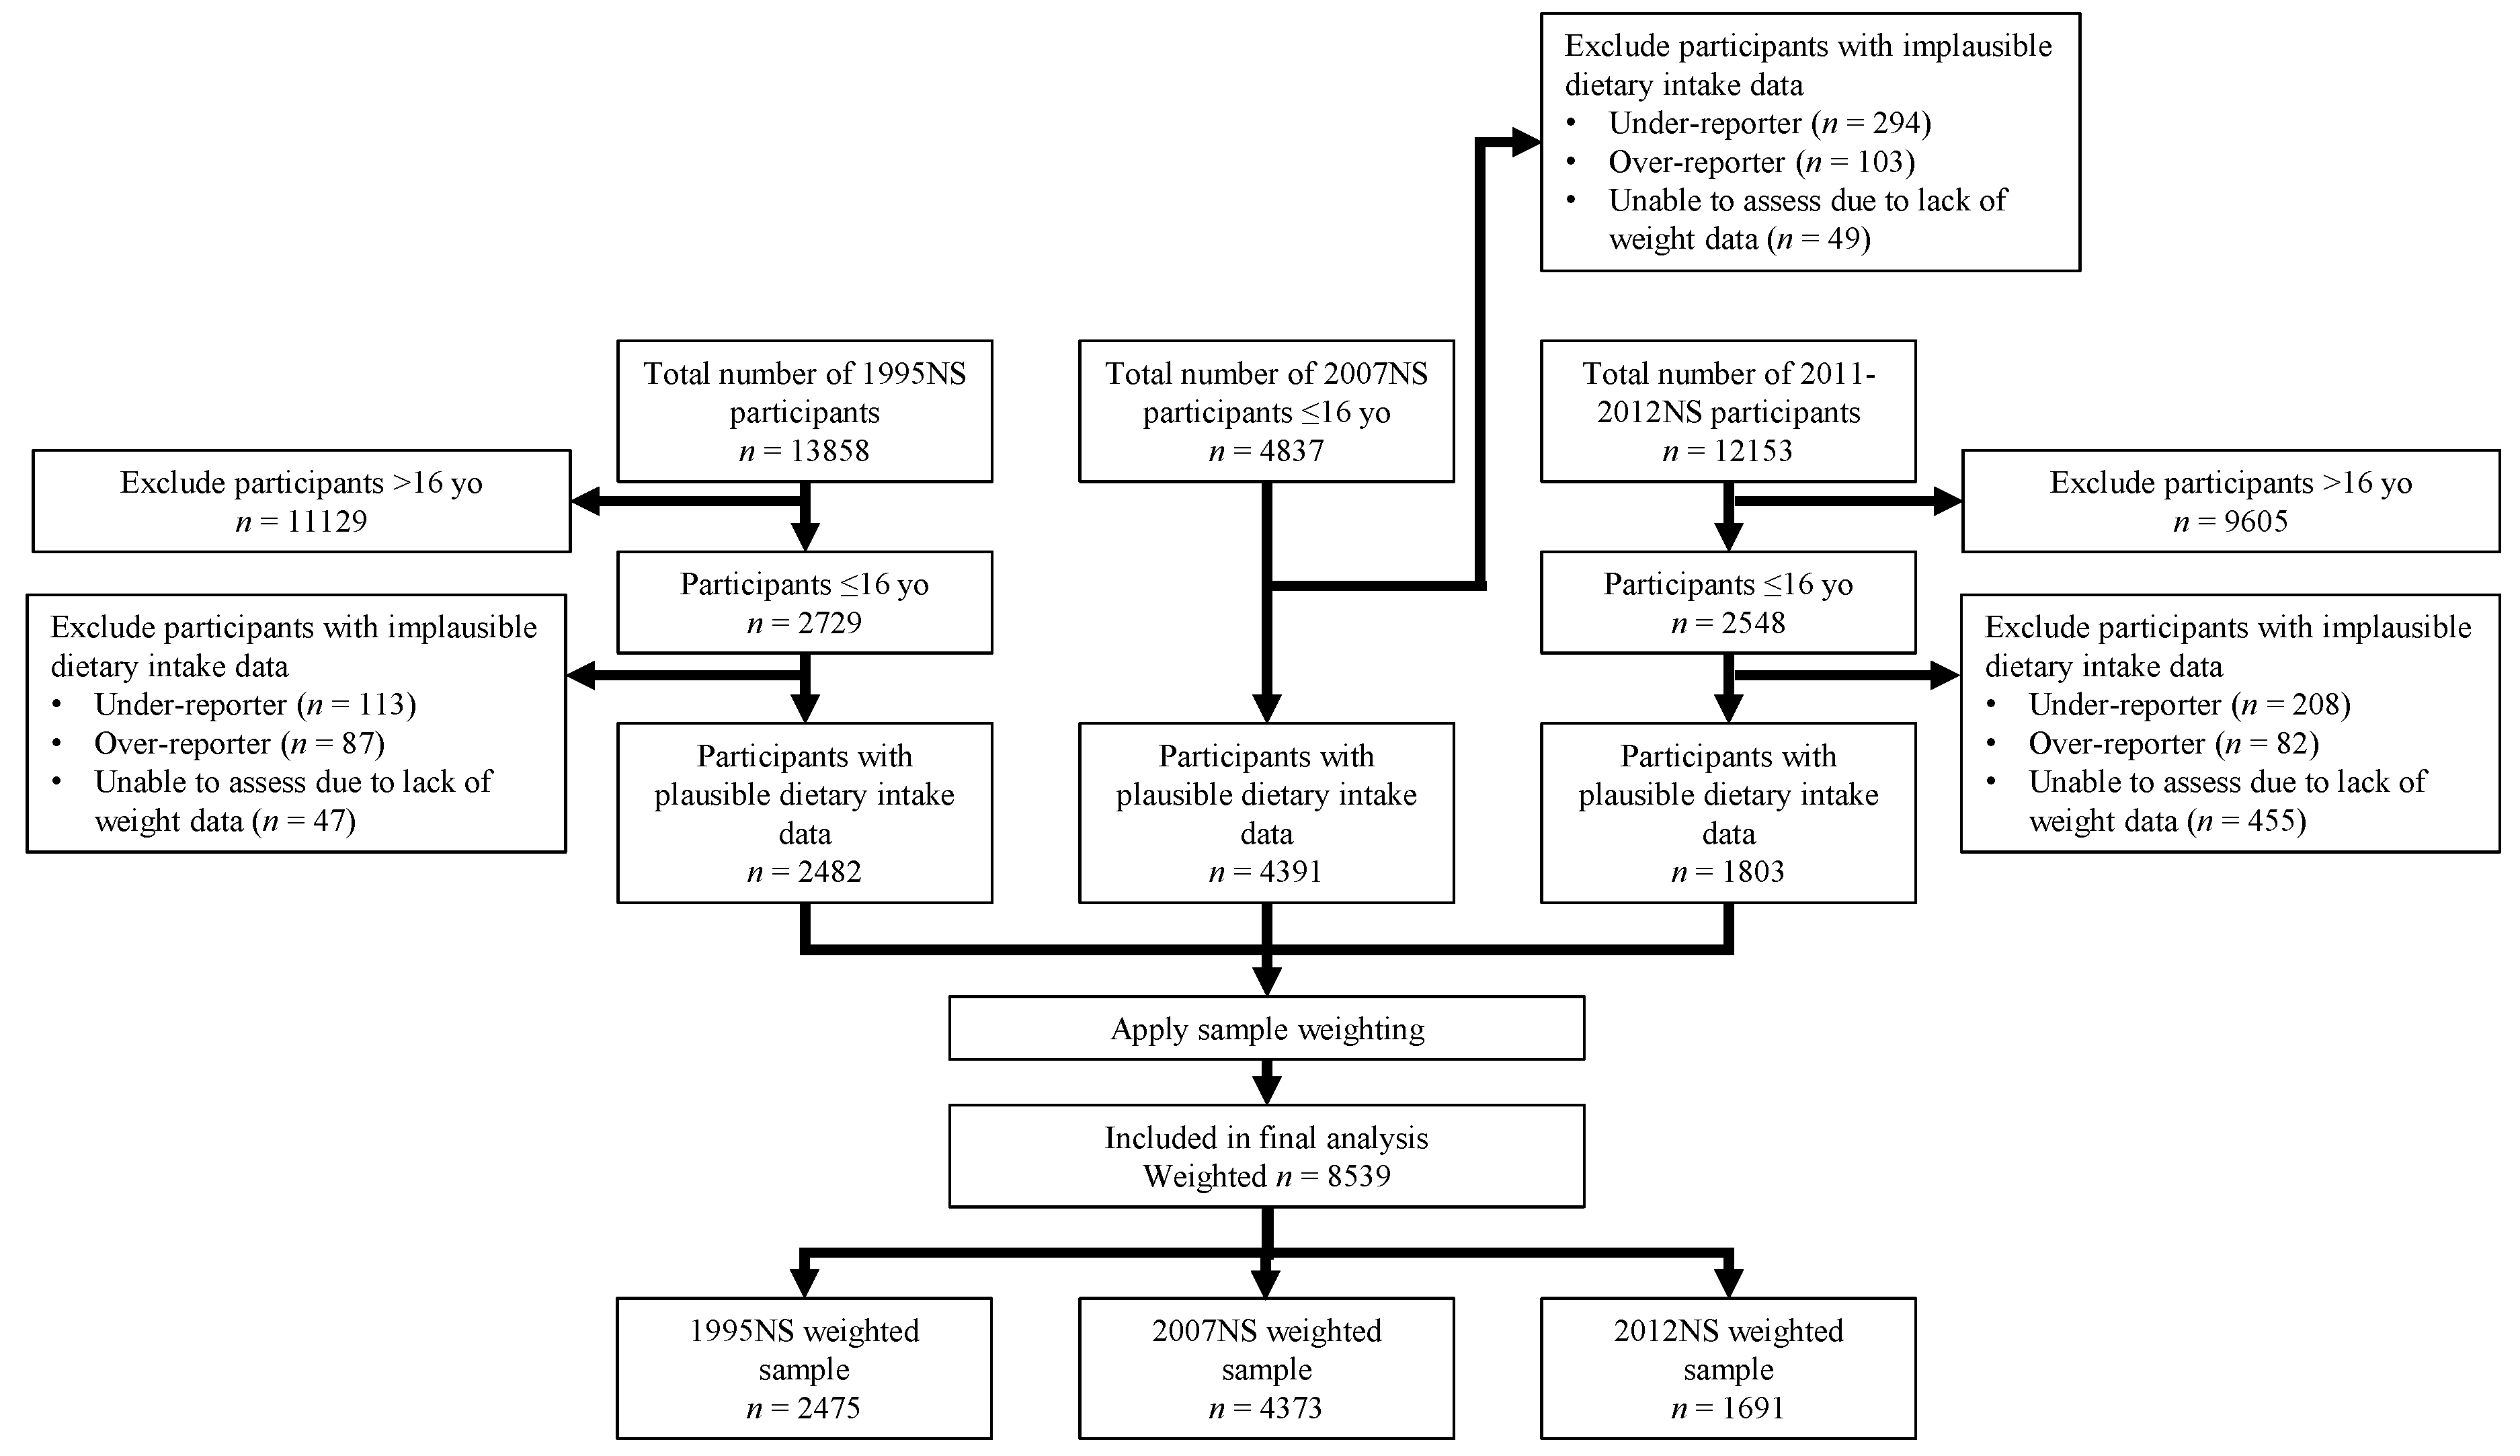
2.1.1. 1995 Australian National Nutrition Survey (1995NS)
2.1.2. 2007 Australian National Children’s Nutrition and Physical Activity Survey (2007NS)
2.1.3. 2011-12 National Nutrition and Physical Activity Survey (2012NS)
2.2. Dietary Glycemic Load and Dietary Glycemic Index Calculation
2.3. Re-Coding and Classification of Food Groups in the Three Surveys
2.4. Data Cleaning
2.5. Statistical Analysis
3. Results
3.1. Characteristics of Participants
3.2. Trends in BMI, GI, GL, Energy, Macronutrients and Fiber Intake
3.3. GL Contribution, Per Capita
3.4. GL Contribution, Per Consumer
3.5. Inter-Individual Variations in Dietary GI and GL
4. Discussion
5. Conclusions
Author Contributions
Funding
Acknowledgments
Conflicts of Interest
Appendix A


| New Code | New Food Group | 1995NS Code | 1995NS Food Group | 2007NS Code | 2007NS Food Group | 2012NS Code | 2012NS Food Group |
|---|---|---|---|---|---|---|---|
| 111 | Tea | 111 | Tea | 111 | Tea | 111 | Tea |
| 112 | Coffee and coffee substitute | 112 | Coffee and coffee substitutes | 112 | Coffee and coffee substitutes | 112 | Coffee and coffee substitutes |
| 113 | Fruit and vegetable juices and drinks | 113 | Fruit and vegetables juices and drinks | 113 | Fruit and vegetable juices, and drinks | 113 | Fruit and vegetables juices and drinks |
| 114 | Cordials | 114 | Cordials | ||||
| 114 | Sweetened beverages | 114 | Soft drinks, flavored mineral waters and electrolyte drinks | 115 | Soft drinks, and flavored mineral waters | 115 | Soft drinks, and flavored mineral waters |
| 116 | Electrolyte, energy and fortified drinks | 116 | Electrolyte, energy and fortified drinks | ||||
| 115 | Mineral waters | 115 | Mineral waters and water | 117 | Mineral waters and water | 117 | Waters, municipal and bottled, unflavored |
| 116 | Other beverage flavorings and prepared beverages | 116 | Water with other additions as a beverage | 118 | Other beverage flavorings and prepared beverages | 118 | Other beverage flavorings and prepared beverages |
| 301 | Beverage flavorings | ||||||
| 121 | Flours and other cereal grains and starches | 121 | Flours and other cereal grains and starches | 121 | Flours and other cereal grains and starches | 121 | Flours and other cereal grains and starches |
| 126 | Rice and rice products | ||||||
| 122 | Bread and bread rolls | 122 | Regular breads, and rolls | 122 | Regular breads, and bread rolls (plain/unfilled/untopped varieties) | 122 | Regular breads, and bread rolls (plain/unfilled/untopped varieties) |
| 123 | Breakfast cereals (ready to eat) | 123 | BF cereals, plain, single source | 125 | Breakfast cereals and bars, unfortified and fortified varieties | 125 | Breakfast cereals, ready to eat |
| 124 | Fancy breads | 124 | Fancy breads, flat breads, English-style muffins and crumpets | 123 | English-style muffins, flat breads, and savoury and sweet breads | 123 | English-style muffins, flat breads, and savory and sweet breads |
| 125 | Pasta and pasta products | 125 | Pasta and pasta products | 124 | Pasta and pasta products | 124 | Pasta and pasta products (without sauce) |
| 127 | Breakfast Cereals, Mixed Source | ||||||
| 128 | Breakfast cereals (hot porridge) | 128 | Bf cereal, hot porridge type | 126 | Breakfast cereal, hot porridge type | 126 | Breakfast cereals, hot porridge style |
| 131 | Sweet biscuits | 131 | Sweet biscuit | 131 | Sweet biscuits | 131 | Sweet biscuits |
| 132 | Savory biscuits | 132 | Savory biscuit | 132 | Savory biscuits | 132 | Savory biscuits |
| 133 | Cake-type desserts | 133 | Cakes, buns, muffins, scones, cake-type desserts | 133 | Cakes, buns, muffins, scones, cake-type desserts | 133 | Cakes, muffins, scones, cake-type desserts |
| 134 | Pastries | 134 | Pastries | 134 | Pastries | 134 | Pastries |
| 135 | Cereal-based dishes | 135 | Mixed dishes where cereal is the major ingredient | 135 | Mixed dishes where cereal is the major ingredient | 135 | Mixed dishes where cereal is the major ingredient |
| 136 | Batter-based products | 136 | Batter-based products | 136 | Batter-based products | 136 | Batter-based products |
| 141 | Butters | 141 | Dairy fats | 141 | Butters | 141 | Butters |
| 142 | Dairy blends | 142 | Dairy blends | ||||
| 142 | Margarine and table spreads | 142 | Margarine | 143 | Margarine and table spreads | 143 | Margarine and table spreads |
| 143 | Vegetable oils | 143 | Vegetable oil | 144 | Vegetable/nut oil | 144 | Plant oils |
| 144 | Other fats | 144 | Other fats | 145 | Other fats | 145 | Other fats |
| 145 | Unspecified fats | 145 | Unspecified fats | 146 | Unspecified fats | 146 | Unspecified fats |
| 151 | Fin fish (excluding canned) | 151 | Fin fish (excluding canned) | 151 | Fin fish (excluding commercially sterile) | 151 | Fin fish (excluding commercially sterile) |
| 152 | Crustacea and molluscs (excluding canned) | 152 | Crustacea and molluscs (excluding canned) | 152 | Crustacea and molluscs (excluding commercially sterile) | 152 | Crustacea and molluscs (excluding commercially sterile) |
| 153 | Other sea and freshwater foods | 153 | Other sea and freshwater foods | 153 | Other sea and freshwater foods | 153 | Other sea and freshwater foods |
| 154 | Packed (canned and bottled) fish and seafood | 154 | Packed (canned and bottled) fish and seafood | 154 | Packed (commercially sterile) fish and seafood | 154 | Packed (commercially sterile) fish and seafood |
| 155 | Fish and seafood products | 155 | Fish and seafood products | 155 | Fish and seafood products (homemade and takeaway) | 155 | Fish and seafood products (homemade and takeaway) |
| 156 | Mixed dishes with fish or seafood as the major component | 156 | Mixed dishes with fish or seafood as the major component | 156 | Mixed dishes with fish or seafood as the major component | 156 | Mixed dishes with fish or seafood as the major component |
| 161 | Pome fruit | 161 | Pome fruit | 161 | Pome fruit | 161 | Pome fruit |
| 162 | Berry fruit | 162 | Berry fruit | 162 | Berry fruit | 162 | Berry fruit |
| 163 | Citrus fruit | 163 | Citrus fruit | 163 | Citrus fruit | 163 | Citrus fruit |
| 164 | Stone fruit | 164 | Stone fruit | 164 | Stone fruit | 164 | Stone fruit |
| 165 | Tropical fruit | 165 | Tropical fruit | 165 | Tropical fruit | 165 | Tropical and subtropical fruit |
| 166 | Other fruit | 166 | Other fruit | 166 | Other fruit | 166 | Other fruit |
| 167 | Fruit combinations | 167 | Mixtures of two or more groups of fruit | 167 | Mixtures of two or more groups of fruit | 167 | Mixtures of two or more groups of fruit |
| 168 | Dried fruits | 168 | Dried fruit, preserved fruit | 168 | Dried fruit, preserved fruit | 168 | Dried fruit, preserved fruit |
| 169 | Fruit dishes | 169 | Mixed dishes where fruit is the major component | 169 | Mixed dishes where fruit is the major component | 169 | Mixed dishes where fruit is the major component |
| 171 | Eggs | 171 | Eggs | 171 | Eggs | 171 | Eggs |
| 173 | Egg substitutes and dishes | ||||||
| 172 | Egg-based dishes | 172 | Dishes where egg is the major ingredient | 172 | Dishes where egg is the major ingredient | 172 | Dishes where egg is the major ingredient |
| 181 | Muscle meat | 181 | Muscle meat | 181 | Muscle meat | 181 | Beef, sheep and pork, unprocessed |
| 182 | Game and other carcase meats | 182 | Game and other carcase meats | 182 | Game and other carcase meats | 182 | Mammalian game meats |
| 183 | Poultry and feathered game | 183 | Poultry and feathered game | 183 | Poultry and feathered game | 183 | Poultry and feathered game |
| 184 | Organ meats and offal, products and dishes | 184 | Organ meats and offal, products and dishes | 184 | Organ meats and offal, products and dishes | 184 | Organ meats and offal, products and dishes |
| 185 | Sausages, frankfurts and saveloys | 185 | Sausages, frankfurts and saveloys | 185 | Sausages, frankfurts and saveloys | 185 | Sausages, frankfurts and saveloys |
| 186 | Processed meat | 186 | Processed meat | 186 | Processed meat | 186 | Processed meat |
| 187 | Mixed dishes where beef or veal is the major component | 187 | Mixed dishes where beef or veal is the major component | 187 | Mixed dishes where beef, veal or lamb is the major component | 187 | Mixed dishes where beef, sheep, pork or mammalian game is the major component |
| 188 | Mixed dishes where lamb or pork, bacon, ham is the major component | 188 | Mixed dishes where lamb or pork, bacon, ham is the major component | 188 | Mixed dishes where pork, bacon, ham is the major component | 188 | Mixed dishes where sausage, bacon, ham or other processed meat is the major component |
| 189 | Mixed dishes where poultry or game is the major component | 189 | Mixed dishes where poultry or game is the major component | 189 | Mixed dishes where poultry or game is the major component | 189 | Mixed dishes where poultry or feathered game is the major component |
| 191 | Dairy milk | 191 | Dairy milk | 191 | Dairy milk (cow, sheep and goat) | 191 | Dairy milk (cow, sheep and goat) |
| 192 | Yogurt | 192 | Yogurt | 192 | Yoghurt | 192 | Yoghurt |
| 193 | Cream | 193 | Cream | 193 | Cream | 193 | Cream |
| 194 | Cheese | 194 | Cheese | 194 | Cheese | 194 | Cheese |
| 195 | Frozen milk products | 195 | Frozen milk products | 195 | Frozen milk products | 195 | Frozen milk products |
| 196 | Milk and milk products based dishes | 196 | Other dishes where milk or a milk product is the major component | 196 | Custards | 196 | Custards |
| 197 | Other dishes where milk or a milk product is the major component | 197 | Other dishes where milk or a milk product is the major component | ||||
| 197 | Milk substitutes | 197 | Milk substitutes | 201 | Dairy milk substitutes, unflavored | 201 | Dairy milk substitutes, unflavored |
| 202 | Dairy milk substitutes, flavored | 202 | Dairy milk substitutes, flavored | ||||
| 203 | Cheese substitute | 203 | Cheese substitute | ||||
| 204 | Soy-based ice confection | 204 | Soy-based ice confection | ||||
| 205 | Soy-based yoghurts | 205 | Soy-based yoghurts | ||||
| 198 | Flavored milks | 198 | Flavored milks | 198 | Flavored milks | 198 | Flavored milks and milkshakes |
| 201 | Soup | 201 | Soup | 211 | Soup (prepared, ready to eat) | 211 | Soup, homemade from basic ingredients |
| 213 | Soup, prepared from dry soup mix | ||||||
| 202 | Dry soup mix | 202 | Dry soup mix | 212 | Dry soup mix | 212 | Dry soup mix |
| 203 | Canned condensed soup | 203 | Canned condensed soup | 213 | Canned condensed soup (unprepared) | 214 | Canned condensed soup (unprepared) |
| 215 | Soup, commercially sterile, prepared from condensed or sold ready to eat | ||||||
| 216 | Soup, not commercially sterile, purchased ready to eat | ||||||
| 211 | Seeds and seed products | 211 | Seeds and seed products | 221 | Seeds and seed products | 221 | Seeds and seed products |
| 212 | Nuts and nuts products | 212 | Nuts and nuts products | 222 | Nuts and nut products | 222 | Nuts and nut products |
| 221 | Gravies and savoury sauces | 221 | Gravies and savoury sauces | 231 | Gravies and savoury sauces | 231 | Gravies and savoury sauces |
| 235 | Dips | ||||||
| 222 | Pickles, chutneys and relishes | 222 | Pickles, chutneys and relishes | 232 | Pickles, chutneys and relishes | 232 | Pickles, chutneys and relishes |
| 224 | Salad dressings | 224 | Salad dressings | 233 | Salad dressings | 233 | Salad dressings |
| 225 | Stuffings | 225 | Stuffings | 234 | Stuffings | 234 | Stuffings |
| 231 | Potatoes | 231 | Potatoes | 241 | Potatoes | 241 | Potatoes |
| 232 | Cabbage, cauliflower and similar brassica vegetables | 232 | Cabbage, cauliflower and similar brassica vegetables | 242 | Cabbage, cauliflower and similar brassica vegetables | 242 | Cabbage, cauliflower and similar brassica vegetables |
| 233 | Carrot and similar root vegetables | 233 | Carrot and similar root vegetables | 243 | Carrot and similar root vegetables | 243 | Carrot and similar root vegetables |
| 234 | Leaf and stalk vegetables | 234 | Leaf and stalk vegetables | 244 | Leaf and stalk vegetables | 244 | Leaf and stalk vegetables |
| 235 | Peas and beans | 235 | Peas and beans | 245 | Peas and beans | 245 | Peas and beans |
| 236 | Tomato and tomato products | 236 | Tomato and tomato products | 246 | Tomato and tomato products | 246 | Tomato and tomato products |
| 237 | Other fruiting vegetables | 237 | Other fruiting vegetables | 247 | Other fruiting vegetables | 247 | Other fruiting vegetables |
| 238 | Other vegetables and vegetable combinations | 238 | Other vegetables and vegetable combinations | 248 | Other vegetables and vegetable combinations | 248 | Other vegetables and vegetable combinations |
| 239 | Dishes where vegetable is the major component | 239 | Dishes where vegetable is the major component | 249 | Dishes where vegetable is the major component | 249 | Dishes where vegetable is the major component |
| 241 | Mature legumes and pulses | 241 | Mature legumes and pulses | 251 | Mature legumes and pulses | 251 | Mature legumes and pulses |
| 242 | Mature legume and pulse products and dishes | 242 | Mature legume and pulse products and dishes | 252 | Mature legume and pulse products and dishes | 206 | Meat substitutes |
| 207 | Dishes where meat substitutes are the major component | ||||||
| 252 | Mature legume and pulse products and dishes | ||||||
| 251 | Potato snacks | 251 | Potato snacks | 261 | Potato snacks | 261 | Potato snacks |
| 252 | Corn snacks | 252 | Corn snacks | 262 | Corn snacks | 262 | Corn snacks |
| 253 | Extruded snacks | 253 | Extruded snacks | 263 | Extruded or reformed snacks | 263 | Extruded or reformed snacks |
| 254 | Pretzels and other snacks | 254 | Pretzels and other snacks | 264 | Pretzels | 264 | Other snacks |
| 265 | Other snacks | ||||||
| 261 | Sugar, honey and syrups | 261 | Sugar, honey and syrups | 271 | Sugar, honey and syrups | 271 | Sugar, honey and syrups |
| 262 | Jam and lemon spreads, chocolate spreads | 262 | Jam and lemon spreads, chocolate spreads | 272 | Jam and lemon spreads, chocolate spreads, sauces | 272 | Jam and lemon spreads, chocolate spreads, sauces |
| 263 | Dishes and products other than confectionery where sugar is the major component | 263 | Dishes and products other than confectionery where sugar is the major component | 273 | Dishes & products other than confectionery where sugar is major component | 273 | Dishes and products other than confectionery where sugar is the major component |
| 271 | Chocolate and chocolate-based confectionery | 271 | Chocolate and chocolate-based confectionery | 281 | Chocolate and chocolate-based confectionery | 281 | Chocolate and chocolate-based confectionery |
| 272 | Cereal-, fruit-, nut-, and seed-bars | 272 | Cereal-, fruit-, nut-, and seed-bars | 282 | Cereal-, fruit-, nut- and seed-bars | 282 | Fruit, nut and seed-bars |
| 283 | Muesli or cereal style bars | ||||||
| 273 | Other confectionery | 273 | Other confectionery | 283 | Other confectionery | 284 | Other confectionery |
| 281 | Beers | 281 | Beers | 291 | Beers | 291 | Beers |
| 282 | Wines | 282 | Wines | 292 | Wines | 292 | Wines |
| 283 | Spirits | 283 | Spirits | 293 | Spirits | 293 | Spirits |
| 284 | Other alcoholic beverages | 284 | Other alcoholic beverages | 294 | Other alcoholic beverages | 294 | Cider and perry |
| 295 | Pre-mixed drinks | 295 | Other alcoholic beverages | ||||
| 291 | Formula dietary foods | 291 | Formula dietary foods | 301 | Formula dietary foods | 301 | Formula dietary foods |
| 292 | Enteral formula | 302 | Enteral formula | ||||
| 302 | Yeast: yeast, vegetable and meat extracts | 302 | Yeast: yeast, vegetable and meat extracts | 311 | Yeast, yeast, vegetable and meat extracts | 311 | Yeast, and yeast vegetable or meat extracts |
| 303 | Artificial sweetening agents | 303 | Artificial sweetening agents | 312 | Intense sweetening agents | 312 | Intense sweetening agents |
| 304 | Herbs, spices, seasonings and stock cubes | 304 | Herbs, spices, seasonings and stock cubes | 313 | Herbs, spices, seasonings and stock cubes | 313 | Herbs, spices, seasonings and stock cubes |
| 305 | Essences | 314 | Essences | 314 | Essences | ||
| 306 | Chemical raising agents and cooking ingredients | 306 | Chemical raising agents and cooking ingredients | 315 | Chemical raising agents and cooking ingredients | 315 | Chemical raising agents and cooking ingredients |
| 311 | Infant formulae and human breast milk | 311 | Infant formulae and human breast milk | 321 | Infant formulae and human breast milk | 321 | Infant formulae and human breast milk |
| 312 | Infant cereal products | 312 | Infant cereal products | 322 | Infant cereal products | 322 | Infant cereal products |
| 313 | Infant foods | 313 | Infant foods | 323 | Infant foods | 323 | Infant foods |
| 314 | Infant drinks | 314 | Infant drinks | 324 | Infant drinks | 324 | Infant drinks |
| Food Groups | 1995NS | 2007NS | 2012NS | β ± SE | R2 | ptrend 1 | |||
|---|---|---|---|---|---|---|---|---|---|
| Rank | Mean ± SD | Rank | Mean ± SD | Rank | Mean ± SD | ||||
| Bread and bread rolls | 1 | 18.3 ± 14.0 | 1 | 15.6 ± 13.6 2 | 1 | 15.4 ± 13.9 2 | −0.199 ± 0.000 | 0.964 | <0.001 |
| Fruit and vegetable juices | 2 | 10.0 ± 10.8 | 3 | 6.5 ± 8.5 2 | 4 | 5.8 ± 8.6 2 | −0.277 ± 0.000 | 0.992 | <0.001 |
| Breakfast cereals (ready to eat) | 3 | 9.1 ± 10.7 | 2 | 9.1 ± 11.4 | 3 | 7.0 ± 10.0 2,3 | −0.084 ± 0.001 | 0.332 | <0.001 |
| Potatoes | 4 | 7.5 ± 10.7 | 4 | 5.7 ± 9.1 2 | 6 | 4.3 ± 8.7 2,3 | −0.181 ± 0.000 | 0.950 | <0.001 |
| Sweetened beverages | 5 | 5.9 ± 10.4 | 7 | 3.9 ± 7.7 2 | 7 | 4.0 ± 9.0 2 | −0.132 ± 0.000 | 0.890 | <0.001 |
| Cereal based dishes | 6 | 3.9 ± 9.1 | 9 | 3.6 ± 8.6 | 2 | 9.8 ± 15.0 2,3 | 0.229 ± 0.004 | 0.287 | <0.001 |
| Cake-type dessert | 7 | 3.2 ± 7.8 | 10 | 3.0 ± 7.3 | 8 | 3.9 ± 9.5 3 | 0.023 ± 0.001 | 0.167 | <0.001 |
| Flours, cereals and starches | 8 | 3.1 ± 9.8 | 6 | 4.1 ± 11.0 2 | 5 | 4.6 ± 12.2 2 | 0.088 ± 0.000 | 0.995 | <0.001 |
| Dairy milk | 9 | 3.1 ± 3.6 | 8 | 3.8 ± 4.2 2 | 10 | 3.1 ± 4.2 3 | 0.019 ± 0.001 | 0.126 | <0.001 |
| Sweet biscuits | 10 | 2.8 ± 5.3 | 12 | 2.7 ± 5.6 | 9 | 3.2 ± 6.4 3 | 0.015 ± 0.000 | 0.161 | <0.001 |
| Frozen milk products | 11 | 2.4 ± 4.7 | 21 | 1.6 ± 3.7 2 | 20 | 1.5 ± 3.6 2 | −0.060 ± 0.000 | 0.972 | <0.001 |
| Pastas | 12 | 2.2 ± 6.2 | 5 | 4.2 ± 8.7 2 | 17 | 1.8 ± 6.3 3 | 0.044 ± 0.002 | 0.059 | <0.001 |
| Sugar, honey and syrups | 13 | 2.1 ± 3.8 | 19 | 1.8 ± 3.8 | 18 | 1.6 ± 3.8 2 | −0.027 ± 0.000 | 0.911 | <0.001 |
| Pome fruit | 14 | 2.0 ± 3.6 | 15 | 2.3 ± 3.9 | 12 | 2.7 ± 4.3 2,3 | 0.035 ± 0.000 | 0.810 | <0.001 |
| Pastries | 15 | 1.9 ± 5.3 | 17 | 2.0 ± 5.7 | 16 | 1.8 ± 5.5 | −0.001 ± 0.000 | 0.006 | <0.001 |
| Other confectionery | 16 | 1.9 ± 5.7 | 14 | 2.5 ± 7.3 2 | 22 | 1.2 ± 3.9 3 | −0.005 ± 0.001 | 0.004 | <0.001 |
| Chocolates | 17 | 1.7 ± 4.2 | 16 | 2.1 ± 5.5 | 21 | 1.5 ± 4.5 3 | 0.002 ± 0.000 | 0.002 | <0.001 |
| Savory biscuits | 18 | 1.5 ± 4.2 | 13 | 2.6 ± 5.9 2 | 11 | 3.0 ± 7.2 2 | 0.093 ± 0.000 | 0.999 | <0.001 |
| Tropical and subtropical fruit | 19 | 1.4 ± 3.6 | 18 | 1.9 ± 4.3 2 | 14 | 1.9 ± 4.5 2 | 0.038 ± 0.000 | 0.925 | <0.001 |
| Fancy breads | 20 | 1.3 ± 4.7 | 11 | 2.8 ± 7.3 2 | 13 | 2.6 ± 7.5 2 | 0.095 ± 0.000 | 0.871 | <0.001 |
| Potato snacks | 21 | 1.1 ± 3.0 | 25 | 1.2 ± 3.6 | 23 | 1.2 ± 3.9 | 0.006 ± 0.000 | 0.929 | <0.001 |
| Batter-based product | 22 | 1.0 ± 4.5 | 20 | 1.7 ± 5.7 2 | 28 | 0.9 ± 4.0 3 | 0.015 ± 0.001 | 0.068 | <0.001 |
| Confectionery based dishes | 23 | 1.0 ± 3.5 | 28 | 0.8 ± 3.1 | 26 | 1.0 ± 3.4 | −0.007 ± 0.000 | 0.162 | <0.001 |
| Cereal-, fruit-, nut-,seed-bars | 24 | 1.0 ± 2.6 | 22 | 1.3 ± 3.9 2 | 15 | 1.9 ± 4.7 2,3 | 0.048 ± 0.000 | 0.804 | <0.001 |
| Extruded snacks | 25 | 0.8 ± 3.5 | 43 | 0.2 ± 1.7 2 | 34 | 0.5 ± 3.0 2,3 | −0.031 ± 0.000 | 0.538 | <0.001 |
| Milk and milk products based dishes | 26 | 0.8 ± 2.7 | 36 | 0.5 ± 2.3 2 | 39 | 0.4 ± 2.1 2 | −0.025 ± 0.000 | 0.994 | <0.001 |
| Gravies and savory sauces | 27 | 0.6 ± 1.3 | 27 | 0.8 ± 1.8 2 | 33 | 0.6 ± 2.0 3 | 0.006 ± 0.000 | 0.098 | <0.001 |
| Poultry based dishes | 28 | 0.6 ± 2.2 | 33 | 0.6 ± 2.2 | 19 | 1.5 ± 4.9 2,3 | 0.038 ± 0.001 | 0.341 | <0.001 |
| Food Groups | 1995NS | 2007NS | 2012NS | β ± SE | R2 | Ptrend 2 | ||||||
|---|---|---|---|---|---|---|---|---|---|---|---|---|
| Rank | Mean ± SD | % 1 | Rank | Mean ± SD | % 1 | Rank | Mean ± SD | % 1 | ||||
| Flour, cereals and starches | 1 | 23.0 ± 15.7 | 13.7 | 1 | 22.6 ± 15.8 | 18.3 | 1 | 27.1 ± 16.6 4 | 16.9 | 0.144 ± 0.009 | 0.138 | <0.001 |
| Bread and bread rolls | 2 | 21.8 ± 12.6 | 84.2 | 2 | 20.5 ± 12.0 3 | 76.4 | 3 | 21.2 ± 12.0 | 72.5 | −0.038 ± 0.001 | 0.126 | <0.001 |
| Cereal-based dishes | 3 | 16.5 ± 11.8 | 23.7 | 6 | 16.0 ± 11.4 | 22.6 | 2 | 24.1 ± 14.5 3,4 | 40.8 | 0.431 ± 0.010 | 0.395 | <0.001 |
| Breakfast cereals (hot porridge) | 4 | 16.1 ± 8.3 | 2.7 | 3 | 18.2 ± 13.0 | 3.3 | 8 | 15.3 ± 10.8 | 5.3 | −0.050 ± 0.006 | 0.145 | <0.001 |
| Breakfast cereals (ready to eat) | 5 | 16.0 ± 9.4 | 56.6 | 4 | 17.3 ± 10.2 3 | 52.3 | 7 | 15.9 ± 9.3 4 | 43.9 | 0.046 ± 0.001 | 0.193 | <0.001 |
| Sweetened beverages | 6 | 15.5 ± 11.8 | 37.8 | 11 | 12.4 ± 9.3 3 | 31.4 | 18 | 10.9 ± 12.0 3 | 36.9 | −0.258 ± 0.001 | 0.919 | <0.001 |
| Potatoes | 7 | 14.9 ± 10.8 | 50.2 | 9 | 13.4 ± 9.5 3 | 42.5 | 10 | 12.9 ± 10.6 3 | 33.7 | −0.157 ± 0.000 | 0.996 | <0.001 |
| Batter-based products | 8 | 14.5 ± 9.7 | 7.0 | 10 | 13.2 ± 10.3 | 12.5 | 11 | 12.7 ± 8.6 | 7.2 | −0.125 ± 0.000 | 0.986 | <0.001 |
| Cake-type desserts | 9 | 14.3 ± 10.8 | 22.2 | 8 | 14.2 ± 9.8 | 21.1 | 4 | 19.1 ± 12.6 3,4 | 20.2 | 0.204 ± 0.007 | 0.278 | <0.001 |
| Fruit and vegetable juices | 10 | 14.2 ± 10.3 | 70.7 | 14 | 11.1 ± 8.5 3 | 58.4 | 16 | 11.6 ± 8.1 3 | 39.8 | −0.180 ± 0.001 | 0.807 | <0.001 |
| Pastas | 11 | 14.1 ± 9.2 | 15.3 | 5 | 16.0 ± 9.9 | 26.2 | 5 | 17.7 ± 10.6 3 | 10.0 | 0.128 ± 0.000 | 0.998 | <0.001 |
| Fancy breads | 12 | 13.1 ± 7.8 | 10.1 | 7 | 15.3 ± 10.1 | 18.0 | 6 | 17.6 ± 10.7 3,4 | 14.8 | 0.204 ± 0.005 | 0.548 | <0.001 |
| Pastries | 13 | 10.8 ± 8.1 | 17.6 | 12 | 12.1 ± 8.4 | 16.7 | 12 | 12.7 ± 8.9 | 14.0 | 0.168 ± 0.000 | 1.000 | <0.001 |
| Extruded snacks | 14 | 9.9 ± 7.4 | 8.6 | 18 | 8.9 ± 6.4 | 2.5 | 17 | 11.1 ± 8.5 | 4.7 | 0.037 ± 0.005 | 0.101 | <0.001 |
| Other confectionery | 15 | 8.8 ± 9.5 | 21.3 | 13 | 12.1 ± 11.8 3 | 21.1 | 34 | 7.0 ± 6.7 4 | 17.7 | 0.100 ± 0.005 | 0.162 | <0.001 |
| Dried fruit, preserved fruit | 16 | 8.8 ± 8.3 | 4.8 | 19 | 8.8 ± 8.1 | 6.7 | 20 | 9.7 ± 8.1 | 4.9 | 0.041 ± 0.002 | 0.377 | <0.001 |
| Pretzels and other snacks | 17 | 8.4 ± 10.8 | 0.7 | 36 | 6.3 ± 5.7 | 5.2 | 37 | 6.9 ± 6.7 | 4.9 | −0.094 ± 0.002 | 0.813 | <0.001 |
| Sweet biscuit | 18 | 8.2 ± 6.2 | 34.1 | 20 | 8.7 ± 7.0 | 30.5 | 21 | 9.6 ± 7.8 3 | 33.7 | 0.061 ± 0.001 | 0.728 | <0.001 |
| Confectionery-based dishes | 19 | 8.0 ± 6.7 | 12.4 | 23 | 8.4 ± 6.8 | 9.0 | 26 | 8.3 ± 6.3 | 11.7 | 0.064 ± 0.000 | 0.997 | <0.001 |
| Savory biscuit | 20 | 7.6 ± 6.3 | 20.2 | 16 | 9.9 ± 7.6 3 | 26.5 | 15 | 11.7 ± 9.8 3,4 | 26.0 | 0.187 ± 0.001 | 0.953 | <0.001 |
| Frozen milk products | 21 | 7.5 ± 5.5 | 31.8 | 34 | 6.5 ± 5.0 3 | 24.3 | 36 | 6.9 ± 4.8 | 21.5 | −0.043 ± 0.001 | 0.462 | <0.001 |
| Tropical and subtropical fruit | 22 | 7.3 ± 5.0 | 19.1 | 27 | 8.1 ± 5.2 | 23.9 | 23 | 9.1 ± 5.4 3 | 21.4 | 0.086 ± 0.000 | 0.998 | <0.001 |
| Milk and milk products based dishes | 23 | 6.9 ± 4.7 | 11.5 | 29 | 8.1 ± 5.0 | 6.3 | 30 | 7.3 ± 5.7 | 5.2 | 0.056 ± 0.004 | 0.194 | <0.001 |
| Fruit dishes | 24 | 6.9 ± 3.7 | 0.5 | 15 | 10.9 ± 7.1 | 0.4 | 35 | 6.9 ± 8.5 | 0.5 | -0.069 ± 0.055 | 0.038 | 0.217 |
| Infant formulae / breast milk | # | 6.7 ± 15.8 | 0.0 | 24 | 8.4 ± 8.7 | 0.6 | 9 | 15.3 ± 15.6 | 0.5 | 0.113 ± 0.058 | 0.292 | 0.057 |
| Chocolates | 25 | 6.4 ± 6.1 | 26.5 | 22 | 8.4 ± 8.4 3 | 24.7 | 27 | 7.7 ± 7.5 | 19.0 | 0.061 ± 0.000 | 0.891 | <0.001 |
| Fruit combinations | 26 | 6.4 ± 6.4 | 2.5 | 28 | 8.1 ± 5.5 | 3.0 | 22 | 9.6 ± 7.3 | 3.3 | 0.200 ± 0.001 | 0.988 | <0.001 |
| Flavored milks | 27 | 6.4 ± 4.2 | 6.5 | 32 | 7.6 ± 4.3 | 8.1 | 14 | 12.7 ± 9.0 3,4 | 8.5 | 0.246 ± 0.007 | 0.649 | <0.001 |
| Potato snacks | 28 | 6.1 ± 4.3 | 18.4 | 33 | 7.1 ± 6.1 | 16.7 | 32 | 7.1 ± 6.6 | 17.2 | 0.021 ± 0.000 | 0.935 | <0.001 |
| Infant foods | 29 | 6.1 ± 5.8 | 0.6 | 35 | 6.4 ± 5.0 | 0.4 | # | 9.3 ± 7.2 | 0.2 | 0.081 ± 0.005 | 0.878 | <0.001 |
| Cereal-, fruit-, nut-, and seed-bars | 30 | 6.0 ± 3.6 | 15.9 | 17 | 9.4 ± 5.7 3 | 14.2 | 19 | 10.6 ± 5.5 3,4 | 17.7 | 0.243 ± 0.000 | 1.000 | <0.001 |
| Fish and seafood products | 31 | 5.8 ± 5.1 | 5.0 | 44 | 3.9 ± 3.0 3 | 5.2 | 31 | 7.2 ± 5.5 4 | 3.7 | 0.028 ± 0.007 | 0.028 | <0.001 |
| Other fruits | 32 | 5.8 ± 6.1 | 9.9 | 30 | 7.9 ± 6.7 3 | 16.1 | 38 | 6.3 ± 5.4 4 | 15.2 | 0.083 ± 0.004 | 0.230 | <0.001 |
| Pome fruits | 33 | 5.7 ± 4.0 | 34.8 | 37 | 6.0 ± 4.1 | 37.9 | 33 | 7.1 ± 4.2 3,4 | 37.2 | 0.053 ± 0.001 | 0.390 | <0.001 |
| Soups | 34 | 5.7 ± 5.9 | 6.1 | 25 | 8.3 ± 6.5 3 | 6.6 | 42 | 5.3 ± 6.2 4 | 5.0 | 0.064 ± 0.008 | 0.101 | <0.001 |
| Legume and legume-based dishes | 35 | 5.5 ± 6.0 | 4.2 | 42 | 4.6 ± 4.5 | 4.7 | 40 | 6.1 ± 6.6 | 3.3 | -0.026 ± 0.003 | 0.201 | <0.001 |
| Vegetable-based dishes | 36 | 5.5 ± 5.7 | 1.6 | 49 | 2.8 ± 6.1 | 7.0 | 56 | 1.5 ± 4.7 3 | 13.4 | -0.251 ± 0.004 | 0.854 | <0.001 |
| Corn snacks | 37 | 5.3 ± 5.7 | 6.5 | 21 | 8.6 ± 7.6 3 | 7.5 | 28 | 7.3 ± 7.8 | 6.8 | 0.102 ± 0.003 | 0.568 | <0.001 |
| Yogurt | 38 | 4.7 ± 4.3 | 8.1 | 41 | 4.8 ± 3.9 | 19.6 | 47 | 4.1 ± 5.1 | 18.2 | -0.048 ± 0.002 | 0.257 | <0.001 |
| Sugar, honey and syrups | 39 | 4.7 ± 4.5 | 45.1 | 39 | 5.1 ± 4.8 | 36.0 | 39 | 6.2 ± 5.3 3,4 | 26.3 | 0.058 ± 0.001 | 0.598 | <0.001 |
| Fish and seafood based dishes | 40 | 4.5 ± 4.0 | 2.3 | 51 | 2.1 ± 2.4 | 0.4 | 24 | 8.8 ± 11.2 | 1.1 | 0.059 ± 0.022 | 0.062 | 0.010 |
| Canned condensed soup | # | 4.4 ± 5.7 | 0.1 | 45 | 3.9 ± 4.6 | 0.4 | 13 | 12.7 ± 8.6 | 0.4 | 0.762 ± 0.205 | 0.310 | <0.001 |
| Food Groups | dGI | dGL | ||||
|---|---|---|---|---|---|---|
| β ± SE | Partial R2 | p Value | β ± SE | Partial R2 | p Value | |
| Model R2 = 0.433 | Model R2 = 0.912 | |||||
| Bread and bread rolls | 2.03 ± 0.13 | 0.082 | <0.001 | 17.23 ± 0.69 | 0.191 | <0.001 |
| Fruit and vegetable juices | −0.14 ± 0.02 | 0.014 | <0.001 | 3.21 ± 0.12 | 0.218 | <0.001 |
| Breakfast cereals (ready to eat) | 3.01 ± 0.22 | 0.066 | <0.001 | 32.73 ± 1.15 | 0.234 | <0.001 |
| Potatoes | 1.62 ± 0.08 | 0.133 | <0.001 | 6.64 ± 0.42 | 0.086 | <0.001 |
| Sweetened beverages | 0.24 ± 0.03 | 0.026 | <0.001 | 4.20 ± 0.15 | 0.227 | <0.001 |
| Cereal based dishes | 0.34 ± 0.07 | 0.009 | <0.001 | 3.96 ± 0.37 | 0.042 | <0.001 |
| Cake-type dessert | −0.30 ± 0.15 | 0.002 | 0.045 | 9.93 ± 0.78 | 0.058 | <0.001 |
| Flours, cereals and starches | 1.06 ± 0.09 | 0.053 | <0.001 | 10.67 ± 0.45 | 0.173 | <0.001 |
| Dairy milk | −0.44 ± 0.03 | 0.079 | <0.001 | −1.03 ± 0.15 | 0.017 | <0.001 |
| Sweet biscuits | 0.10 ± 0.34 | <0.001 | 0.776 | 9.23 ± 1.78 | 0.010 | <0.001 |
| Frozen milk products | −0.77 ± 0.09 | 0.026 | <0.001 | 1.52 ± 0.48 | 0.004 | 0.002 |
| Pastas | −0.93 ± 0.09 | 0.036 | <0.001 | 2.45 ± 0.49 | 0.009 | <0.001 |
| Sugar, honey and syrups | 1.75 ± 0.48 | 0.005 | <0.001 | 28.88 ± 2.51 | 0.048 | <0.001 |
| Pome fruit | −0.93 ± 0.07 | 0.058 | <0.001 | 1.51 ± 0.38 | 0.006 | <0.001 |
| Pastries | −0.42 ± 0.11 | 0.006 | <0.001 | −0.12 ± 0.56 | <0.001 | 0.830 |
| Other confectionery | 3.96 ± 0.39 | 0.039 | <0.001 | 46.65 ± 2.01 | 0.169 | <0.001 |
| Chocolates | −1.56 ± 0.30 | 0.010 | <0.001 | 4.03 ± 1.58 | 0.002 | 0.011 |
| Savory biscuits | 2.30 ± 0.48 | 0.009 | <0.001 | 13.79 ± 2.50 | 0.011 | <0.001 |
| Tropical and subtropical fruit | −0.70 ± 0.15 | 0.008 | <0.001 | 4.52 ± 0.80 | 0.012 | <0.001 |
| Fancy breads | 1.37 ± 0.31 | 0.007 | <0.001 | 12.33 ± 1.62 | 0.022 | <0.001 |
| Food Groups | dGI | dGL | ||||
|---|---|---|---|---|---|---|
| β ± SE | Partial R2 | p Value | β ± SE | Partial R2 | p Value | |
| Model R2 = 0.362 | Model R2 = 0.881 | |||||
| Bread and bread rolls | 2.58 ± 0.12 | 0.084 | <0.001 | 15.88 ± 0.55 | 0.149 | <0.001 |
| Breakfast cereals (ready to eat) | 4.11 ± 0.18 | 0.094 | <0.001 | 35.86 ± 0.82 | 0.284 | <0.001 |
| Fruit and vegetable juices | 0.05 ± 0.03 | <0.001 | 0.113 | 3.12 ± 0.14 | 0.093 | <0.001 |
| Potatoes | 1.79 ± 0.08 | 0.092 | <0.001 | 7.74 ± 0.36 | 0.087 | <0.001 |
| Pastas | −0.55 ± 0.06 | 0.015 | <0.001 | 5.01 ± 0.29 | 0.060 | <0.001 |
| Flours, cereals and starches | 1.65 ± 0.08 | 0.089 | <0.001 | 13.60 ± 0.34 | 0.249 | <0.001 |
| Sweetened beverages | 0.23 ± 0.03 | 0.016 | <0.001 | 2.91 ± 0.12 | 0.115 | <0.001 |
| Dairy milk | −0.36 ± 0.03 | 0.034 | <0.001 | −0.61 ± 0.12 | 0.005 | <0.001 |
| Cereal based dishes | −0.01 ± 0.06 | <0.001 | 0.819 | 3.91 ± 0.27 | 0.042 | <0.001 |
| Cake-type dessert | 0.07 ± 0.16 | <0.001 | 0.643 | 8.65 ± 0.69 | 0.031 | <0.001 |
| Fancy breads | 1.60 ± 0.20 | 0.013 | <0.001 | 13.96 ± 0.9 | 0.047 | <0.001 |
| Sweet biscuits | 1.56 ± 0.32 | 0.005 | <0.001 | 17.29 ± 1.43 | 0.029 | <0.001 |
| Savory biscuits | 3.92 ± 0.39 | 0.020 | <0.001 | 20.87 ± 1.75 | 0.029 | <0.001 |
| Other confectionery | 5.20 ± 0.26 | 0.075 | <0.001 | 49.42 ± 1.18 | 0.268 | <0.001 |
| Pome fruit | −0.86 ± 0.06 | 0.036 | <0.001 | 2.11 ± 0.29 | 0.011 | <0.001 |
| Chocolates | −0.14 ± 0.26 | <0.001 | 0.595 | 11.97 ± 1.18 | 0.021 | <0.001 |
| Pastries | 0.11 ± 0.10 | <0.001 | 0.264 | 2.67 ± 0.43 | 0.008 | <0.001 |
| Tropical and subtropical fruit | −0.44 ± 0.10 | 0.004 | <0.001 | 3.74 ± 0.46 | 0.014 | <0.001 |
| Sugar, honey and syrups | 2.04 ± 0.46 | 0.004 | <0.001 | 32.06 ± 2.07 | 0.048 | <0.001 |
| Batter-based product | 2.79 ± 0.22 | 0.033 | <0.001 | 16.39 ± 0.97 | 0.056 | <0.001 |
| Food Groups | dGI | dGL | ||||
|---|---|---|---|---|---|---|
| β ± SE | Partial R2 | p Value | β ± SE | Partial R2 | p Value | |
| Model R2 = 0.303 | Model R2 = 0.871 | |||||
| Bread and bread rolls | 1.94 ± 0.19 | 0.042 | <0.001 | 13.76 ± 0.81 | 0.108 | <0.001 |
| Cereal based dishes | 0.50 ± 0.06 | 0.025 | <0.001 | 4.22 ± 0.27 | 0.092 | <0.001 |
| Breakfast cereals (ready to eat) | 3.32 ± 0.35 | 0.038 | <0.001 | 28.71 ± 1.46 | 0.141 | <0.001 |
| Fruit and vegetable juices | −0.02 ± 0.05 | <0.001 | 0.673 | 3.15 ± 0.21 | 0.088 | <0.001 |
| Flours, cereals and starches | 2.11 ± 0.13 | 0.098 | <0.001 | 16.39 ± 0.56 | 0.266 | <0.001 |
| Potatoes | 1.61 ± 0.13 | 0.066 | <0.001 | 7.40 ± 0.53 | 0.076 | <0.001 |
| Sweetened beverages | 0.12 ± 0.03 | 0.005 | <0.001 | 3.45 ± 0.14 | 0.201 | <0.001 |
| Cake-type dessert | −0.57 ± 0.17 | 0.005 | <0.001 | 8.36 ± 0.74 | 0.052 | <0.001 |
| Sweet biscuits | 0.12 ± 0.39 | <0.001 | 0.752 | 17.85 ± 1.63 | 0.048 | <0.001 |
| Dairy milk | −0.57 ± 0.04 | 0.066 | <0.001 | −1.04 ± 0.19 | 0.013 | <0.001 |
| Savory biscuits | 3.06 ± 0.41 | 0.023 | <0.001 | 18.82 ± 1.75 | 0.047 | <0.001 |
| Pome fruit | −0.87 ± 0.09 | 0.041 | <0.001 | 2.04 ± 0.37 | 0.013 | <0.001 |
| Fancy breads | 1.32 ± 0.29 | 0.009 | <0.001 | 12.81 ± 1.21 | 0.045 | <0.001 |
| Tropical and subtropical fruit | −0.54 ± 0.17 | 0.004 | 0.001 | 4.00 ± 0.70 | 0.013 | <0.001 |
| Cereal-, fruit-, nut-, seed-bars | 2.93 ± 0.68 | 0.008 | <0.001 | 20.07 ± 2.86 | 0.020 | <0.001 |
| Pastries | −0.68 ± 0.15 | 0.008 | <0.001 | 0.16 ± 0.66 | <0.001 | 0.811 |
| Pastas | −0.06 ± 0.13 | <0.001 | 0.653 | 3.38 ± 0.56 | 0.015 | <0.001 |
| Sugar, honey and syrups | 3.54 ± 0.80 | 0.008 | <0.001 | 42.32 ± 3.39 | 0.062 | <0.001 |
| Poultry based dishes | 0.40 ± 0.13 | 0.004 | 0.002 | 0.19 ± 0.55 | <0.001 | 0.731 |
| Frozen milk products | −1.07 ± 0.19 | 0.014 | <0.001 | 1.31 ± 0.79 | 0.001 | 0.094 |
References
- Jenkins, D.J.; Wolever, T.M.; Taylor, R.H.; Barker, H.; Fielden, H.; Baldwin, J.M.; Bowling, A.C.; Newman, H.C.; Jenkins, A.L.; Goff, D.V. Glycemic index of foods: A physiological basis for carbohydrate exchange. Am. J. Clin. Nutr. 1981, 34, 362–366. [Google Scholar] [CrossRef] [PubMed]
- Atkinson, F.S.; Foster-Powell, K.; Brand-Miller, J.C. International Tables of Glycemic Index and Glycemic Load Values: 2008. Diabetes Care 2008, 31, 2281–2283. [Google Scholar] [CrossRef] [PubMed] [Green Version]
- Holt, S.H.; Miller, J.C.; Petocz, P. An insulin index of foods: The insulin demand generated by 1000-kJ portions of common foods. Am. J. Clin. Nutr. 1997, 66, 1264–1276. [Google Scholar] [CrossRef] [PubMed]
- Salmeron, J.; Ascherio, A.; Rimm, E. Dietary fiber, glycaemic load, and risk of NIDDM in men. Diabetes Care 1997, 20, 545–550. [Google Scholar] [CrossRef] [PubMed]
- Bao, J.; Atkinson, F.; Petocz, P.; Willett, W.C.; Brand-Miller, J.C. Prediction of postprandial glycemia and insulinemia in lean, young, healthy adults: Glycemic load compared with carbohydrate content alone. Am. J. Clin. Nutr. 2011, 93, 984–996. [Google Scholar] [CrossRef] [PubMed]
- Augustin, L.S.; Kendall, C.W.; Jenkins, D.J.; Willett, W.C.; Astrup, A.; Barclay, A.W.; Björck, I.; Brand-Miller, J.C.; Brighenti, F.; Buyken, A.E.; et al. Glycemic index, glycemic load and glycemic response: An International Scientific Consensus Summit from the International Carbohydrate Quality Consortium (ICQC). Nutr. Metab. Cardiovasc. Dis. 2015, 25, 795–815. [Google Scholar] [CrossRef] [PubMed] [Green Version]
- The Sydney Morning Herald. Fuel up for the Day with Nature’s Powerfoods. Available online: https://www.smh.com.au/national/fuel-up-for-the-day-with-natures-powerfoods-20031120-gdhthg.html (accessed on 22 August 2018).
- The Sydney Morning Herald. Big Brands Clamber Aboard GI Bandwagon. Available online: https://www.smh.com.au/business/big-brands-clamber-aboard-gi-bandwagon-20050519-gdlcn3.html (accessed on 22 August 2018).
- Wan, L. Australia Still Leading the Way with Low-GI Products but Hopes Are High That Asia Can Follow Suit. Available online: https://www.foodnavigator-asia.com/Article/2018/06/19/Australia-still-leading-the-way-with-low-GI-products-but-hopes-are-high-that-Asia-can-follow-suit (accessed on 22 August 2018).
- Brand-Miller, J.C.; Barclay, A.W. Declining consumption of added sugars and sugar-sweetened beverages in Australia: A challenge for obesity prevention. Am. J. Clin. Nutr. 2017, 105, 854–863. [Google Scholar] [CrossRef] [PubMed]
- Ridoutt, B.; Baird, D.; Bastiaans, K.; Hendrie, G.; Riley, M.; Sanguansri, P.; Syrette, J.; Noakes, M. Changes in Food Intake in Australia: Comparing the 1995 and 2011 National Nutrition Survey Results Disaggregated into Basic Foods. Foods 2016, 5, 40. [Google Scholar] [CrossRef] [PubMed]
- Australian Curriculum, Assessment and Reporting Authority. F-10 Curriculum—Health and Physical Education—Structure—Learning Area—Focus Areas—Food and Nutrition. 2016. Available online: https://www.australiancurriculum.edu.au/f-10-curriculum/health-and-physical-education/structure (accessed on 22 August 2018).
- Willett, W.; Manson, J.; Liu, S. Glycemic index, glycemic load, and risk of type 2 diabetes. Am. J. Clin. Nutr. 2002, 76, 274S–280S. [Google Scholar] [CrossRef] [PubMed]
- Schulze, M.B.; Liu, S.; Rimm, E.B.; Manson, J.E.; Willett, W.C.; Hu, F.B. Glycemic index, glycemic load, and dietary fiber intake and incidence of type 2 diabetes in younger and middle-aged women. Am. J. Clin. Nutr. 2004, 80, 348–356. [Google Scholar] [CrossRef] [PubMed] [Green Version]
- Gnagnarella, P.; Gandini, S.; La Vecchia, C.; Maisonneuve, P. Glycemic index, glycemic load, and cancer risk: A meta-analysis. Am. J. Clin. Nutr. 2008, 87, 1793–1801. [Google Scholar] [CrossRef] [PubMed]
- .Bhupathiraju, S.N.; Tobias, D.K.; Malik, V.S.; Pan, A.; Hruby, A.; Manson, J.E.; Willett, W.C.; Hu, F.B. Glycemic index, glycemic load, and risk of type 2 diabetes: Results from 3 large US cohorts and an updated meta-analysis. Am. J. Clin. Nutr. 2014, 100, 218–232. [Google Scholar] [CrossRef] [PubMed]
- Turati, F.; Galeone, C.; Gandini, S.; Augustin, L.S.; Jenkins, D.J.; Pelucchi, C.; La Vecchia, C. High glycemic index and glycemic load are associated with moderately increased cancer risk. Mol. Nutr. Food Res. 2015, 59, 1384–1394. [Google Scholar] [CrossRef] [PubMed]
- Gopinath, B.; Flood, V.M.; Rochtchina, E.; Baur, L.A.; Smith, W.; Mitchell, P. Influence of High Glycemic Index and Glycemic Load Diets on Blood Pressure During Adolescence. Hypertension 2012, 59, 1272–1277. [Google Scholar] [CrossRef] [PubMed] [Green Version]
- Schwingshackl, L.; Hobl, L.P.; Hoffmann, G. Effects of low glycaemic index/low glycaemic load vs. high glycaemic index/high glycaemic load diets on overweight/obesity and associated risk factors in children and adolescents: A systematic review and meta-analysis. Nutr. J. 2015, 14, 87. [Google Scholar] [CrossRef] [PubMed]
- Jones, M.; Barclay, A.W.; Brand-Miller, J.C.; Louie, J.C.Y. Dietary glycaemic index and glycaemic load among Australian children and adolescents—Results from the 2011–2012 Australian Health Survey. Br. J. Nutr. 2016, 116, 178–187. [Google Scholar] [CrossRef] [PubMed]
- Louie, J.C.; Buyken, A.E.; Heyer, K.; Flood, V.M. Dietary glycaemic index and glycaemic load among Australian children and adolescents. Br. J. Nutr. 2011, 106, 1273–1282. [Google Scholar] [CrossRef] [PubMed]
- Rangan, A.M.; Kwan, J.S.L.; Louie, J.C.Y.; Flood, V.M.; Gill, T.P. Changes in core food intake among Australian children between 1995 and 2007. Eur. J. Clin. Nutr. 2011, 65, 1201–1210. [Google Scholar] [CrossRef] [PubMed]
- Australian Bureau of Statistics. National Nutrition Survey: Foods Eaten, Australia, 1995. Available online: http://www.abs.gov.au/AUSSTATS/[email protected]/0/9A125034802F94CECA2568A9001393CE (accessed on 22 August 2018).
- Australian Bureau of Statistics. National Nutrition Survey Users’ Guide 1995. Available online: http://www.abs.gov.au/ausstats/[email protected]/mf/4801.0 (accessed on 22 August 2018).
- Australian Bureau of Statistics. Australian Health Survey: Users’ Guide, 2011–13: Comparisons with Other Nutrition Surveys. 2014. Available online: http://www.abs.gov.au/ausstats/[email protected]/Lookup/4363.0.55.001Chapter651532011-13 (accessed on 22 August 2018).
- The Department of Health. National Monitoring in Public Health Nutrition. 2014. Available online: http://www.health.gov.au/nutritionmonitoring (accessed on 22 August 2018).
- Australian Government Department of Health. 2007 Australian National Children’s Nutrition and Physical Activity Survey Main Findings. Available online: https://www.health.gov.au/internet/main/publishing.nsf/Content/8F4516D5FAC0700ACA257BF0001E0109/$File/childrens-nut-phys-survey.pdf (accessed on 22 August 2018).
- Australian Bureau of Statistics. Nutrition Survey, (National). 2004. Available online: http://www.abs.gov.au/AUSSTATS/[email protected]/0/01F2086AD5CDBF65CA256BD000272375?OpenDocument (accessed on 22 August 2018).
- Australian Bureau of Statistics. Australian Health Survey: Nutrition First Results—Food and Nutrients, 2011-12. Available online: http://www.ausstats.abs.gov.au/Ausstats/subscriber.nsf/0/4683FD7315DFDFDBCA257D080014F9E0/$File/australian%20health%20survey%20nutrition%20first%20results%20-%20food%20and%20nutrients,%202011-12.pdf (accessed on 22 August 2018).
- Australian Department of Health and Ageing. User Guide 2007 Australian National Children’s Nutrition and Physical Activity Survey. Available online: https://www.health.gov.au/internet/main/publishing.nsf/Content/589EFDBF5E7B916FCA257BF000211E08/$File/user-guide-v2.pdf (accessed on 22 August 2018).
- Australian Bureau of Statistics. Australian Health Survey: Users’ Guide, 2011–13: COMPARISONS WITH 1995 NNS. 2014. Available online: http://www.abs.gov.au/ausstats/[email protected]/Lookup/4363.0.55.001Chapter651542011-13 (accessed on 22 August 2018).
- Australian Bureau of Statistics. Australian Health Survey: Nutrition—State and Territory Results, 2011–12. 2015. Available online: http://www.abs.gov.au/AUSSTATS/[email protected]/Lookup/4364.0.55.009Explanatory%20Notes12011-12?OpenDocument (accessed on 22 August 2018).
- Food Standards Australia New Zealand. Australian Food and Nutrient Database; FSANZ: Canberra, Australia, 1999.
- Food Standards Australia New Zealand. AUSNUT2007 Food Composition Database. 2008. Available online: http://www.foodstandards.gov.au/science/monitoringnutrients/ausnut/Pages/ausnut2007.aspx (accessed on 22 August 2018).
- Food Standards Australia New Zealand. AUSNUT 2011–13 Data Files. Available online: http://www.foodstandards.gov.au/science/monitoringnutrients/ausnut/ausnutdatafiles/Pages/default.aspx (accessed on 22 August 2018).
- Louie, J.C.Y.; Flood, V.M.; Atkinson, F.S.; Barclay, A.W.; Brand-Miller, J.C. Methodology for assigning appropriate glycaemic index values to an Australian food composition database. J. Food Compos. Anal. 2015, 38, 1–6. [Google Scholar] [CrossRef]
- Kusnadi, D.T.; Louie, J.C.; Barclay, A.W.; Brand-miller, J.C. Changes in dietary glycaemic index and glycaemic load in Australian adults from 1995 to 2012. Am. J. Clin.Nutr. 2017, 73, 46. [Google Scholar]
- Goldberg, G.R.; Black, A.E.; Jebb, S.A.; Cole, T.J.; Murgatroyd, P.R.; Coward, W.A.; Prentice, A.M. Critical evaluation of energy intake data using fundamental principles of energy physiology: 1. Derivation of cut-off limits to identify under-recording. Eur. J. Clin. Nutr. 1991, 45, 569–581. [Google Scholar]
- Black, A.E. Critical evaluation of energy intake using the Goldberg cut-off for energy intake:basal metabolic rate. A practical guide to its calculation, use and limitations. Int. J. Obes. Relat. Metab. Disord. 2000, 24, 1119–1130. [Google Scholar] [CrossRef] [PubMed] [Green Version]
- Australian Bureau of Statistics. Australian Health Survey: Users’ Guide, 2011–13: Data Quality. 2013. Available online: http://www.abs.gov.au/ausstats/[email protected]/Lookup/5209F2553DE3B084CA257BBB0014D160?opendocument (accessed on 22 August 2018).
- Streiner, D.L. Best (but oft-forgotten) practices: The multiple problems of multiplicity—Whether and how to correct for many statistical tests. Am. J. Clin. Nutr. 2015, 102, 721–728. [Google Scholar] [CrossRef] [PubMed]
- Buyken, A.E.; Dettmann, W.; Kersting, M.; Kroke, A. Glycaemic index and glycaemic load in the diet of healthy schoolchildren: Trends from 1990 to 2002, contribution of different carbohydrate sources and relationships to dietary quality. Br. J. Nutr. 2005, 94, 796–803. [Google Scholar] [CrossRef] [PubMed]
- Cheng, G.; Karaolis-Danckert, N.; Libuda, L.; Bolzenius, K.; Remer, T.; Buyken, A.E. Relation of dietary glycemic index, glycemic load, and fibre and whole-grain itnakes during puberty to the concurrent development of percent body fat and body mass index. Am. J. Epidemiol. 2009, 169, 667–677. [Google Scholar] [CrossRef] [PubMed]
- Sydney University Glycemic Index Research Service. GlycemicIndex.com. 2012. Available online: http://www.glycemicindex.com (accessed on 22 August 2018).
- Food Standards Australia New Zealand. Classification of Foods and Dietary Supplements. 2013. Available online: http://www.foodstandards.gov.au/science/monitoringnutrients/ausnut/classificationofsupps/Pages/default.aspx (accessed on 22 August 2018).
- Australian Bureau of Statistics. Australian Health Survey: Users’ Guide, 2011–13—Concordance. Available online: http://www.foodstandards.gov.au/science/monitoringnutrients/ausnut/classificationofsupps/Pages/comparisons.aspx (accessed on 22 August 2018).
- Lavelle, P. Low-carb food products. ABC Health & Wellbeing. 2004. Available online: http://www.abc.net.au/health/thepulse/stories/2004/11/11/1241127.htm (accessed on 22 August 2018).
- Burke, K. Iced Not So Nice: Some Bottled Tea Drinks Found to Be Sweeter Than Coke. Available online: https://www.smh.com.au/national/iced-not-so-nice-some-bottled-tea-drinks-found-to-be-sweeter-than-coke-20061031-gdopxc.html (accessed on 22 August 2018).
- Rumble, C. Fruit Juice Doubles Risk of Obesity. Available online: https://www.theage.com.au/national/fruit-juice-doubles-risk-of-obesity-20070320-ge4gsb.html (accessed on 22 August 2018).
- Hector, D.; Rangan, A.; Gill, T.; Louie, J.C.Y.; Flood, V.M. Soft Drinks, Weight Status and Health: A Review; University of Wollongong: Wollongong, Australia, 2009. [Google Scholar]
- Dennison, B.A. Fruit juice consumption by infants and children: A review. J. Am. Coll. Nutr. 1996, 15, 4S–11S. [Google Scholar] [CrossRef] [PubMed]
- Department of Agriculture. Australian Food Statistics 2012–13. Available online: http://www.agriculture.gov.au/SiteCollectionDocuments/ag-food/publications/food-stats/australian-food-statistics-2012-13.pdf (accessed on 22 August 2018).
- Department of Immigration and Border Protection. Australia’s Migration Trends 2013–14. Available online: https://www.homeaffairs.gov.au/ReportsandPublications/Documents/statistics/migration-trends13-14.pdf (accessed on 22 August 2018).
- Mirrahimi, A.; Chiavaroli, L.; Srichaikul, K.; Augustin, L.S.; Sievenpiper, J.L.; Kendall, C.W.; Jenkins, D.J. The role of glycemic index and glycemic load in cardiovascular disease and its risk factors: A review of the recent literature. Curr. Atheroscler. Rep. 2014, 16, 381. [Google Scholar] [CrossRef] [PubMed]
- Gemming, L.; Mhurchu, C.N. Dietary under-reporting: What foods and which meals are typically under-reported? Eur. J. Clin. Nutr. 2016, 70, 640–641. [Google Scholar] [CrossRef] [PubMed]
- Rutishauser, I.H. Getting it right: How to use the data from the 1995 National Nutrition Survey. In National Food and Nutrition Monitoring and Surveillance Project; Commonwealth Department of Health and Aged Care: Canberra, ACT, Australia, 2000. [Google Scholar]
| 1995NS | 2007NS | 2012NS | p Value 1 | |
|---|---|---|---|---|
| n 2 | 2475 | 4373 | 1691 | - |
| Male (%) | 51.6 | 51.7 | 51.5 | 0.984 |
| Age groups (%) 3 | ||||
| 2–3 years | 13.4 | 13.2 | 12.7 | 0.181 |
| 4–8 years | 34.3 | 34.4 | 32.6 | |
| 9–13 years | 33.7 | 33.4 | 37.3 | |
| 14–16 years | 18.6 | 19.1 | 17.4 | |
| Country of birth (%) | ||||
| Australia | 94.3 | 92.5 | 90.2 | <0.001 |
| Others | 5.7 | 7.5 | 9.8 |
| 1995NS | 2007NS | 2012NS | ptrend 1 | |
|---|---|---|---|---|
| BMI (kg/m2) 2 | 18.3 ± 3.4 | 18.5 ± 3.6 | 18.6 ± 3.5 | 0.033 |
| Dietary GI | 56.7 ± 5.1 | 54.2 ± 5.6 3 | 55.4 ± 5.3 3,4 | <0.001 |
| Dietary GL | 153.0 ± 58.6 | 141.0 ± 54.5 3 | 135.6 ± 50.0 3 | <0.001 |
| Dietary GL (g/MJ) | 17.9 ± 3.3 | 16.7 ± 3.3 3 | 16.8 ± 3.3 3 | <0.001 |
| Energy (kJ) | 8590 ± 2980 | 8500 ± 2890 | 8100 ± 2640 3,4 | <0.001 |
| Energy from fat (%) | 33.2 ± 6.6 | 30.6 ± 6.9 3 | 31.2 ± 6.9 3 | <0.001 |
| Energy from saturated fat (%) | 14.6 ± 4.0 | 13.7 ± 4.1 3 | 13.2 ± 4.0 3,4 | <0.001 |
| Energy from protein (%) | 14.4 ± 3.7 | 16.4 ± 4.5 3 | 15.9 ± 4.2 3,4 | <0.001 |
| Energy from carbohydrates (%) | 53.6 ± 8.2 | 52.2 ± 8.1 3 | 51.5 ± 7.9 3 | <0.001 |
| Energy from sugars (%) | 26.4 ± 8.9 | 25.6 ± 7.9 3 | 22.9 ± 7.6 3,4 | <0.001 |
| Energy from starch (%) | 25.3 ± 7.1 | 26.0 ± 7.4 3 | 26.9 ± 7.5 3,4 | <0.001 |
| Fibre density (g/MJ) | 2.2 ± 0.8 | 2.5 ± 0.9 3 | 2.6 ± 1.0 3 | <0.001 |
| Food Groups | 1995NS | 2007NS | 2012NS | β ± SE 4 | R2 | ptrend 1 | |||
|---|---|---|---|---|---|---|---|---|---|
| Rank | Mean ± SD | Rank | Mean ± SD | Rank | Mean ± SD | ||||
| Bread and bread rolls | 1 | 18.1 ± 13.6 | 1 | 15.6 ± 13.4 2 | 1 | 15.0 ± 12.9 | −0.197 ± 0.000 | 0.998 | <0.001 |
| Fruits and vegetables juices | 2 | 9.9 ± 10.5 | 3 | 6.5 ± 8.3 2 | 4 | 5.5 ± 8.1 2,3 | −0.279 ± 0.000 | 1.000 | <0.001 |
| Breakfast cereals (ready to eat) | 3 | 9.2 ± 10.5 | 2 | 9.2 ± 11.2 | 3 | 6.7 ± 9.6 2,3 | −0.086 ± 0.001 | 0.304 | <0.001 |
| Potatoes | 4 | 7.5 ± 10.5 | 4 | 5.7 ± 9.0 | 6 | 4.3 ± 8.5 | −0.178 ± 0.000 | 0.942 | <0.001 |
| Sweetened beverages | 5 | 5.9 ± 10.3 | 8 | 3.8 ± 7.6 2 | 7 | 3.9 ± 8.1 2 | −0.141 ± 0.000 | 0.942 | <0.001 |
| Cereal based dishes | 6 | 3.9 ± 9.1 | 9 | 3.4 ± 8.0 | 2 | 10.0 ± 15.0 2,3 | 0.201 ± 0.004 | 0.238 | <0.001 |
| Dairy milk | 7 | 3.2 ± 3.6 | 7 | 3.8 ± 4.1 2 | 11 | 3.0 ± 4.0 3 | 0.017 ± 0.001 | 0.108 | <0.001 |
| Cake-type dessert | 8 | 3.2 ± 7.7 | 10 | 3.1 ± 7.3 | 8 | 3.8 ± 9.3 | 0.016 ± 0.001 | 0.106 | <0.001 |
| Flours, cereals and starches | 9 | 3.2 ± 9.8 | 6 | 4.1 ± 10.9 | 5 | 4.6 ± 12.3 2 | 0.082 ± 0.000 | 0.959 | <0.001 |
| Sweet biscuits | 10 | 2.8 ± 5.3 | 11 | 2.7 ± 5.4 | 9 | 3.4 ± 6.3 3 | 0.011 ± 0.000 | 0.065 | <0.001 |
| Frozen milk products | 11 | 2.4 ± 4.6 | 21 | 1.6 ± 3.6 2 | 19 | 1.6 ± 3.7 2 | −0.057 ± 0.000 | 0.951 | <0.001 |
| Pastas | 12 | 2.2 ± 6.2 | 5 | 4.2 ± 8.5 2 | 16 | 1.9 ± 6.2 3 | 0.062 ± 0.002 | 0.125 | <0.001 |
| Sugar, honey and syrups | 13 | 2.1 ± 3.8 | 19 | 1.8 ± 3.7 | 18 | 1.6 ± 3.9 2 | −0.028 ± 0.000 | 0.929 | <0.001 |
| Pome fruit | 14 | 2.0 ± 3.6 | 15 | 2.3 ± 3.8 | 13 | 2.7 ± 4.3 2,3 | 0.033 ± 0.000 | 0.742 | <0.001 |
| Pastries | 15 | 2.0 ± 5.4 | 18 | 2.0 ± 5.6 | 15 | 1.9 ± 5.6 | −0.002 ± 0.000 | 0.097 | <0.001 |
| Other confectionery | 16 | 1.9 ± 5.6 | 14 | 2.6 ± 7.3 2 | 23 | 1.3 ± 3.8 3 | 0.003 ± 0.001 | 0.002 | <0.001 |
| Chocolates | 17 | 1.7 ± 4.3 | 16 | 2.1 ± 5.5 | 21 | 1.4 ± 4.5 3 | 0.004 ± 0.000 | 0.008 | <0.001 |
| Savory biscuits | 18 | 1.5 ± 4.1 | 12 | 2.7 ± 5.9 2 | 10 | 3.2 ± 7.3 2 | 0.101 ± 0.000 | 0.989 | <0.001 |
| Tropical and subtropical fruit | 19 | 1.4 ± 3.6 | 17 | 2.0 ± 4.3 2 | 14 | 2.0 ± 4.6 2 | 0.041 ± 0.000 | 0.945 | <0.001 |
| Fancy breads | 20 | 1.3 ± 4.5 | 13 | 2.7 ± 7.0 2 | 12 | 2.9 ± 7.7 2 | 0.110 ± 0.000 | 0.973 | <0.001 |
| Potato snacks | 21 | 1.1 ± 2.9 | 25 | 1.2 ± 3.6 | 22 | 1.3 ± 4.1 | 0.008 ± 0.000 | 0.588 | <0.001 |
| Confectionery based dishes | 22 | 1.0 ± 3.6 | 28 | 0.8 ± 3.1 | 28 | 0.9 ± 3.0 | 0.003 ± 0.001 | 0.002 | <0.001 |
| Batter-based product | 23 | 1.0 ± 4.5 | 20 | 1.7 ± 5.6 2 | 27 | 1.0 ± 4.0 3 | 0.022 ± 0.001 | 0.157 | <0.001 |
| Cereal-, fruit-, nut-,seed-bars | 24 | 1.0 ± 2.6 | 22 | 1.4 ± 4.0 | 17 | 1.8 ± 4.5 | 0.043 ± 0.000 | 0.878 | <0.001 |
| Extruded snacks | 25 | 0.8 ± 3.4 | 44 | 0.2 ± 1.7 2 | 33 | 0.6 ± 3.2 3 | −0.033 ± 0.000 | 0.523 | <0.001 |
| Milk and milk products based dishes | 26 | 0.8 ± 2.8 | 35 | 0.5 ± 2.3 2 | 39 | 0.3 ± 1.9 2 | −0.027 ± 0.000 | 0.980 | <0.001 |
| Poultry based dishes | 27 | 0.6 ± 2.3 | 33 | 0.6 ± 2.1 | 20 | 1.5 ± 4.6 2,3 | 0.031 ± 0.001 | 0.878 | <0.001 |
| Food Groups | 1995NS | 2007NS | 2012NS | β ± SE 5 | R2 | ptrend 2 | ||||||
|---|---|---|---|---|---|---|---|---|---|---|---|---|
| Rank | Mean ± SD | % 1 | Rank | Mean ± SD | % 1 | Rank | Mean ± SD | % 1 | ||||
| Flours, cereals and starches | 1 | 22.8 ± 15.6 | 13.8 | 1 | 22.2 ± 15.4 | 18.7 | 1 | 27.3 ± 16.8 | 16.9 | 0.085 ± 0.009 | 0.061 | <0.001 |
| Bread and bread rolls | 2 | 21.4 ± 12.1 | 84.5 | 2 | 20.2 ± 11.8 3 | 77.3 | 3 | 20.3 ± 10.9 | 73.9 | −0.071 ± 0.000 | 0.797 | <0.001 |
| Cereal based dishes | 3 | 16.6 ± 11.9 | 23.6 | 6 | 15.2 ± 10.4 | 22.6 | 2 | 23.7 ± 14.3 3,4 | 42.3 | 0.350 ± 0.010 | 0.348 | <0.001 |
| Breakfast cereals (hot porridge) | 4 | 16.4 ± 7.7 | 2.5 | 3 | 17.5 ± 12.8 | 3.3 | 7 | 15.5 ± 11.3 | 5.3 | −0.068 ± 0.006 | 0.295 | <0.001 |
| Breakfast cereals (ready to eat) | 5 | 15.8 ± 9.2 | 58.0 | 4 | 17.2 ± 9.9 3 | 53.4 | 8 | 15.3 ± 8.9 4 | 43.9 | 0.067 ± 0.002 | 0.246 | <0.001 |
| Sweetened beverages | 6 | 15.4 ± 11.5 | 38.2 | 11 | 12.2 ± 9.0 3 | 31.1 | 16 | 10.5 ± 10.4 3,4 | 37.2 | −0.235 ± 0.001 | 0.945 | <0.001 |
| Potatoes | 7 | 14.8 ± 10.5 | 50.7 | 9 | 13.3 ± 9.4 3 | 42.9 | 12 | 12.5 ± 10.4 3 | 34.3 | −0.158 ± 0.001 | 0.893 | <0.001 |
| Batter-based products | 8 | 14.4 ± 9.5 | 7.1 | 10 | 13.1 ± 10.1 | 12.6 | 11 | 12.6 ± 7.8 | 7.7 | −0.125 ± 0.000 | 0.988 | <0.001 |
| Pastas | 9 | 14.1 ± 8.9 | 15.4 | 5 | 15.7 ± 9.7 | 26.6 | 6 | 16.9 ± 9.9 | 10.9 | 0.097 ± 0.000 | 0.991 | <0.001 |
| Cake-type dessert | 10 | 14.0 ± 10.4 | 22.5 | 8 | 14.1 ± 9.6 | 21.7 | 4 | 18.5 ± 12.4 3,4 | 20.5 | 0.148 ± 0.006 | 0.245 | <0.001 |
| Fruits and vegetables juices | 11 | 13.9 ± 10.0 | 71.2 | 14 | 10.9 ± 8.2 3 | 59.3 | 14 | 11.2 ± 7.5 3 | 39.4 | −0.187 ± 0.001 | 0.896 | <0.001 |
| Fancy breads | 12 | 13.0 ± 7.5 | 9.9 | 7 | 14.8 ± 9.4 | 18.0 | 5 | 17.5 ± 10.0 3,4 | 16.6 | 0.193 ± 0.005 | 0.560 | <0.001 |
| Pastries | 13 | 11.0 ± 8.1 | 17.8 | 13 | 11.9 ± 8.4 | 16.6 | 10 | 12.9 ± 8.7 | 14.4 | 0.153 ± 0.001 | 0.918 | <0.001 |
| Extruded snacks | 14 | 9.8 ± 7.0 | 8.6 | 20 | 8.7 ± 6.5 | 2.5 | 15 | 10.8 ± 9.3 | 5.3 | −0.029 ± 0.003 | 0.183 | <0.001 |
| Dried fruit, preserved fruit | 15 | 8.7 ± 8.2 | 5.0 | 18 | 8.7 ± 7.8 | 6.9 | 19 | 9.2 ± 8.1 | 5.1 | 0.022 ± 0.001 | 0.518 | <0.001 |
| Other confectionery | 16 | 8.6 ± 9.4 | 21.7 | 12 | 11.9 ± 11.6 3 | 21.7 | 32 | 6.8 ± 6.4 4 | 18.6 | 0.127 ± 0.006 | 0.222 | <0.001 |
| Sweet biscuits | 17 | 8.2 ± 6.1 | 34.9 | 22 | 8.6 ± 6.5 | 31.6 | 18 | 9.5 ± 7.2 3 | 35.5 | 0.052 ± 0.001 | 0.628 | <0.001 |
| Confectionery based dishes | 18 | 8.0 ± 6.6 | 12.9 | 24 | 8.2 ± 6.4 | 9.3 | 24 | 7.7 ± 4.9 | 12.2 | 0.044 ± 0.001 | 0.511 | <0.001 |
| Savory biscuits | 19 | 7.6 ± 6.0 | 20.2 | 16 | 9.9 ± 7.5 3 | 27.1 | 13 | 12.1 ± 9.5 3,4 | 26.7 | 0.196 ± 0.001 | 0.914 | <0.001 |
| Frozen milk products | 20 | 7.4 ± 5.2 | 32.4 | 34 | 6.4 ± 4.8 3 | 24.9 | 29 | 6.9 ± 4.7 | 22.7 | −0.039 ± 0.001 | 0.497 | <0.001 |
| Tropical and subtropical fruit | 21 | 7.2 ± 4.9 | 19.5 | 25 | 8.1 ± 5.1 | 25.1 | 20 | 9.2 ± 5.6 3 | 21.6 | 0.088 ± 0.000 | 1.000 | <0.001 |
| Milk and milk products based dishes | 22 | 7.0 ± 4.7 | 11.7 | 26 | 8.0 ± 4.8 | 6.4 | 31 | 6.9 ± 5.4 | 5.1 | 0.057 ± 0.004 | 0.220 | <0.001 |
| Fruit dishes | 23 | 6.9 ± 3.7 | 0.5 | 15 | 10.9 ± 7.1 | 0.4 | 33 | 6.4 ± 7.5 | 0.7 | −0.071 ± 0.057 | 0.038 | 0.219 |
| Fruit combinations | 24 | 6.6 ± 6.7 | 2.4 | 31 | 7.6 ± 4.4 | 3.1 | 23 | 8.6 ± 6.3 | 3.1 | 0.142 ± 0.000 | 0.998 | <0.001 |
| Flavored milks | 25 | 6.6 ± 4.3 | 6.3 | 30 | 7.7 ± 4.3 | 8.2 | 9 | 13.1 ± 9.1 3,4 | 9.6 | 0.234 ± 0.007 | 0.607 | <0.001 |
| Infant foods | 26 | 6.4 ± 6.0 | 0.6 | 36 | 6.2 ± 4.8 | 0.4 | # | 9.3 ± 7.7 | 0.2 | 0.027 ± 0.007 | 0.326 | <0.001 |
| Chocolates | 27 | 6.4 ± 6.2 | 26.7 | 23 | 8.3 ± 8.2 | 25.3 | 25 | 7.5 ± 7.8 | 19.1 | 0.061 ± 0.000 | 0.906 | <0.001 |
| Potato snacks | 28 | 6.1 ± 4.1 | 18.4 | 33 | 6.9 ± 6.0 | 16.7 | 26 | 7.4 ± 7.2 | 17.5 | 0.022 ± 0.000 | 0.944 | <0.001 |
| Pretzels and other snacks | 29 | 6.0 ± 3.5 | 0.7 | 35 | 6.4 ± 5.8 | 5.4 | 39 | 5.8 ± 5.0 | 4.6 | −0.108 ± 0.001 | 0.980 | <0.001 |
| Cereal-, fruit-, nut-, seed-bars | 30 | 6.0 ± 3.5 | 16.4 | 17 | 9.4 ± 5.6 3 | 14.8 | 17 | 10.3 ± 5.2 3 | 17.4 | 0.236 ± 0.000 | 0.998 | <0.001 |
| Infant formulae/breast milk | # | 6.7 ± 15.8 | 0.04 | 21 | 8.7 ± 9.0 | 0.6 | # | 13.7 ± 17.3 | 0.4 | −0.042 ± 0.048 | 0.023 | 0.388 |
| Food Groups | dGI | dGL | ||||
|---|---|---|---|---|---|---|
| β ± SE | Partial R2 | P Value | β ± SE | Partial R2 | p Value | |
| Model R2 = 0.441 | Model R2 = 0.888 | |||||
| Bread and bread rolls | 2.14 ± 0.14 | 0.087 | <0.001 | 17.20 ± 0.72 | 0.188 | <0.001 |
| Fruits and vegetables juices | −0.13 ± 0.02 | 0.013 | <0.001 | 3.11 ± 0.12 | 0.208 | <0.001 |
| Breakfast cereals (ready to eat) | 3.15 ± 0.23 | 0.070 | <0.001 | 33.25 ± 1.20 | 0.237 | <0.001 |
| Potatoes | 1.64 ± 0.08 | 0.133 | <0.001 | 6.56 ± 0.44 | 0.084 | <0.001 |
| Sweetened beverages | 0.26 ± 0.03 | 0.031 | <0.001 | 4.18 ± 0.15 | 0.231 | <0.001 |
| Cereal based dishes | 0.35 ± 0.07 | 0.009 | <0.001 | 4.15 ± 0.37 | 0.049 | <0.001 |
| Dairy milk | −0.43 ± 0.03 | 0.077 | <0.001 | −0.91 ± 0.16 | 0.014 | <0.001 |
| Cake-type dessert | −0.34 ± 0.16 | 0.002 | 0.034 | 10.33 ± 0.83 | 0.060 | <0.001 |
| Flours, cereals and starches | 1.12 ± 0.09 | 0.056 | <0.001 | 10.60 ± 0.48 | 0.164 | <0.001 |
| Sweet biscuits | 0.28 ± 0.35 | <0.001 | 0.421 | 10.19 ± 1.80 | 0.013 | <0.001 |
| Frozen milk products | −0.68 ± 0.10 | 0.019 | <0.001 | 2.07 ± 0.51 | 0.007 | <0.001 |
| Pastas | −0.93 ± 0.10 | 0.038 | <0.001 | 2.68 ± 0.49 | 0.012 | <0.001 |
| Sugar, honey and syrups | 1.46 ± 0.49 | 0.004 | 0.003 | 27.34 ± 2.54 | 0.045 | <0.001 |
| Pome fruit | −0.92 ± 0.07 | 0.059 | <0.001 | 1.55 ± 0.39 | 0.007 | <0.001 |
| Pastries | −0.43 ± 0.11 | 0.007 | <0.001 | 0.22 ± 0.56 | <0.001 | 0.697 |
| Other confectionery | 4.37 ± 0.40 | 0.046 | <0.001 | 46.43 ± 2.09 | 0.167 | <0.001 |
| Chocolates | −1.33 ± 0.33 | 0.007 | <0.001 | 7.90 ± 1.70 | 0.009 | <0.001 |
| Savory biscuits | 2.22 ± 0.49 | 0.008 | <0.001 | 14.20 ± 2.53 | 0.013 | <0.001 |
| Tropical and subtropical fruit | −0.68 ± 0.16 | 0.008 | <0.001 | 4.55 ± 0.81 | 0.013 | <0.001 |
| Fancy breads | 1.48 ± 0.32 | 0.009 | <0.001 | 12.88 ± 1.65 | 0.024 | <0.001 |
| Food Groups | dGI | dGL | ||||
|---|---|---|---|---|---|---|
| Food Groups | β ± SE | Partial R2 | p Value | β ± SE | Partial R2 | p Value |
| Model R2 = 0.372 | Model R2 = 0.862 | |||||
| Breads, and bread rolls | 2.62 ± 0.13 | 0.091 | <0.001 | 15.45 ± 0.57 | 0.145 | <0.001 |
| Breakfast cereals (ready to eat) | 3.93 ± 0.19 | 0.086 | <0.001 | 33.54 ± 0.88 | 0.250 | <0.001 |
| Fruit and vegetables juices | 0.05 ± 0.03 | 0.001 | 0.118 | 3.08 ± 0.15 | 0.094 | <0.001 |
| Potatoes | 1.83 ± 0.08 | 0.102 | <0.001 | 7.49 ± 0.37 | 0.085 | <0.001 |
| Pastas | −0.54 ± 0.07 | 0.015 | <0.001 | 4.92 ± 0.30 | 0.059 | <0.001 |
| Flours, cereals and starches | 1.71 ± 0.08 | 0.097 | <0.001 | 13.60 ± 0.36 | 0.250 | <0.001 |
| Sweetened beverages | 0.23 ± 0.03 | 0.017 | <0.001 | 2.89 ± 0.12 | 0.114 | <0.001 |
| Dairy milk | −0.36 ± 0.03 | 0.035 | <0.001 | −0.58 ± 0.13 | 0.004 | <0.001 |
| Cereal based dishes | 0.01 ± 0.07 | <0.001 | 0.850 | 3.64 ± 0.30 | 0.033 | <0.001 |
| Cake-type dessert | 0.02 ± 0.16 | <0.001 | 0.900 | 8.16 ± 0.74 | 0.028 | <0.001 |
| Fancy breads | 1.40 ± 0.21 | 0.010 | <0.001 | 12.46 ± 0.94 | 0.039 | <0.001 |
| Savory biscuits | 3.89 ± 0.39 | 0.022 | <0.001 | 19.49 ± 1.78 | 0.027 | <0.001 |
| Sweet biscuits | 1.52 ± 0.32 | 0.005 | <0.001 | 16.71 ± 1.46 | 0.029 | <0.001 |
| Other confectionery | 5.68 ± 0.28 | 0.086 | <0.001 | 48.19 ± 1.28 | 0.247 | <0.001 |
| Pome fruit | −0.83 ± 0.07 | 0.036 | <0.001 | 2.19 ± 0.30 | 0.012 | <0.001 |
| Chocolates | −0.15 ± 0.28 | <0.001 | 0.595 | 10.68 ± 1.26 | 0.016 | <0.001 |
| Pastries | 0.10 ± 0.10 | <0.001 | 0.324 | 2.32 ± 0.45 | 0.006 | <0.001 |
| Tropical and subtropical fruit | −0.42 ± 0.10 | 0.004 | <0.001 | 3.40 ± 0.47 | 0.012 | <0.001 |
| Sugar, honey and syrups | 2.01 ± 0.48 | 0.004 | <0.001 | 29.61 ± 2.16 | 0.041 | <0.001 |
| Batter-based product | 2.66 ± 0.22 | 0.032 | <0.001 | 16.03 ± 1.01 | 0.055 | <0.001 |
| Food Groups | dGI | dL | ||||
|---|---|---|---|---|---|---|
| Food Groups | β ± SE | Partial R2 | p Value | β ± SE | Partial R2 | p Value |
| Model R2 = 0.351 | Model R2 = 0.846 | |||||
| Breads, and bread rolls | 1.94 ± 0.21 | 0.049 | <0.001 | 13.18 ± 0.97 | 0.101 | <0.001 |
| Cereal based dishes | 0.53 ± 0.07 | 0.034 | <0.001 | 3.83 ± 0.32 | 0.077 | <0.001 |
| Breakfast cereals (ready to eat) | 2.93 ± 0.37 | 0.036 | <0.001 | 24.95 ± 1.72 | 0.112 | <0.001 |
| Fruit and vegetables juices | −0.12 ± 0.05 | 0.003 | 0.030 | 2.82 ± 0.25 | 0.069 | <0.001 |
| Flours, cereals and starches | 2.06 ± 0.14 | 0.119 | <0.001 | 16.05 ± 0.63 | 0.278 | <0.001 |
| Potatoes | 1.54 ± 0.13 | 0.076 | <0.001 | 6.52 ± 0.61 | 0.064 | <0.001 |
| Sweetened beverages | 0.13 ± 0.04 | 0.008 | <0.001 | 3.22 ± 0.17 | 0.185 | <0.001 |
| Cake-type dessert | −0.79 ± 0.20 | 0.010 | <0.001 | 6.24 ± 0.90 | 0.028 | <0.001 |
| Sweet biscuits | −0.18 ± 0.42 | <0.001 | 0.660 | 13.67 ± 1.94 | 0.029 | <0.001 |
| Savory biscuits | 3.17 ± 0.43 | 0.032 | <0.001 | 18.26 ± 1.98 | 0.048 | <0.001 |
| Dairy milk | −0.56 ± 0.05 | 0.077 | <0.001 | −1.14 ± 0.22 | 0.016 | <0.001 |
| Fancy breads | 1.13 ± 0.30 | 0.008 | <0.001 | 10.56 ± 1.40 | 0.033 | <0.001 |
| Pome fruit | −0.81 ± 0.09 | 0.045 | <0.001 | 1.40 ± 0.42 | 0.007 | 0.001 |
| Tropical and subtropical fruit | −0.68 ± 0.18 | 0.009 | <0.001 | 3.44 ± 0.83 | 0.010 | <0.001 |
| Pastries | −0.64 ± 0.16 | 0.009 | <0.001 | 0.21 ± 0.76 | <0.001 | 0.786 |
| Pastas | 0.07 ± 0.14 | <0.001 | 0.601 | 3.16 ± 0.63 | 0.015 | <0.001 |
| Cereal-, fruit-, nut-, and seed-bars | 3.14 ± 0.73 | 0.011 | <0.001 | 21.13 ± 3.36 | 0.023 | <0.001 |
| Sugar, honey and syrups | 4.27 ± 0.82 | 0.016 | <0.001 | 43.35 ± 3.78 | 0.073 | <0.001 |
| Frozen milk products | −1.03 ± 0.19 | 0.017 | <0.001 | −0.41 ± 0.88 | <0.001 | 0.640 |
| Poultry based dishes | 0.44 ± 0.15 | 0.005 | 0.003 | 0.17 ± 0.68 | <0.001 | 0.804 |
© 2018 by the authors. Licensee MDPI, Basel, Switzerland. This article is an open access article distributed under the terms and conditions of the Creative Commons Attribution (CC BY) license (http://creativecommons.org/licenses/by/4.0/).
Share and Cite
Yeung, C.H.C.; Kusnadi, D.T.L.; Barclay, A.W.; Brand-Miller, J.C.; Louie, J.C.Y. The Decreasing Trend in Dietary Glycaemic Index and Glycaemic Load in Australian Children and Adolescents between 1995 and 2012. Nutrients 2018, 10, 1312. https://doi.org/10.3390/nu10091312
Yeung CHC, Kusnadi DTL, Barclay AW, Brand-Miller JC, Louie JCY. The Decreasing Trend in Dietary Glycaemic Index and Glycaemic Load in Australian Children and Adolescents between 1995 and 2012. Nutrients. 2018; 10(9):1312. https://doi.org/10.3390/nu10091312
Chicago/Turabian StyleYeung, Chris Ho Ching, Devina Tri Lestrai Kusnadi, Alan Winston Barclay, Jennie Cecile Brand-Miller, and Jimmy Chun Yu Louie. 2018. "The Decreasing Trend in Dietary Glycaemic Index and Glycaemic Load in Australian Children and Adolescents between 1995 and 2012" Nutrients 10, no. 9: 1312. https://doi.org/10.3390/nu10091312