Food Rating Scale in Food Services: From Development to Assessment of a Strategy for Consumer Healthier Choices

 , ,
, ,
Abstract
:1. Introduction
2. Materials and Methods
- (a)
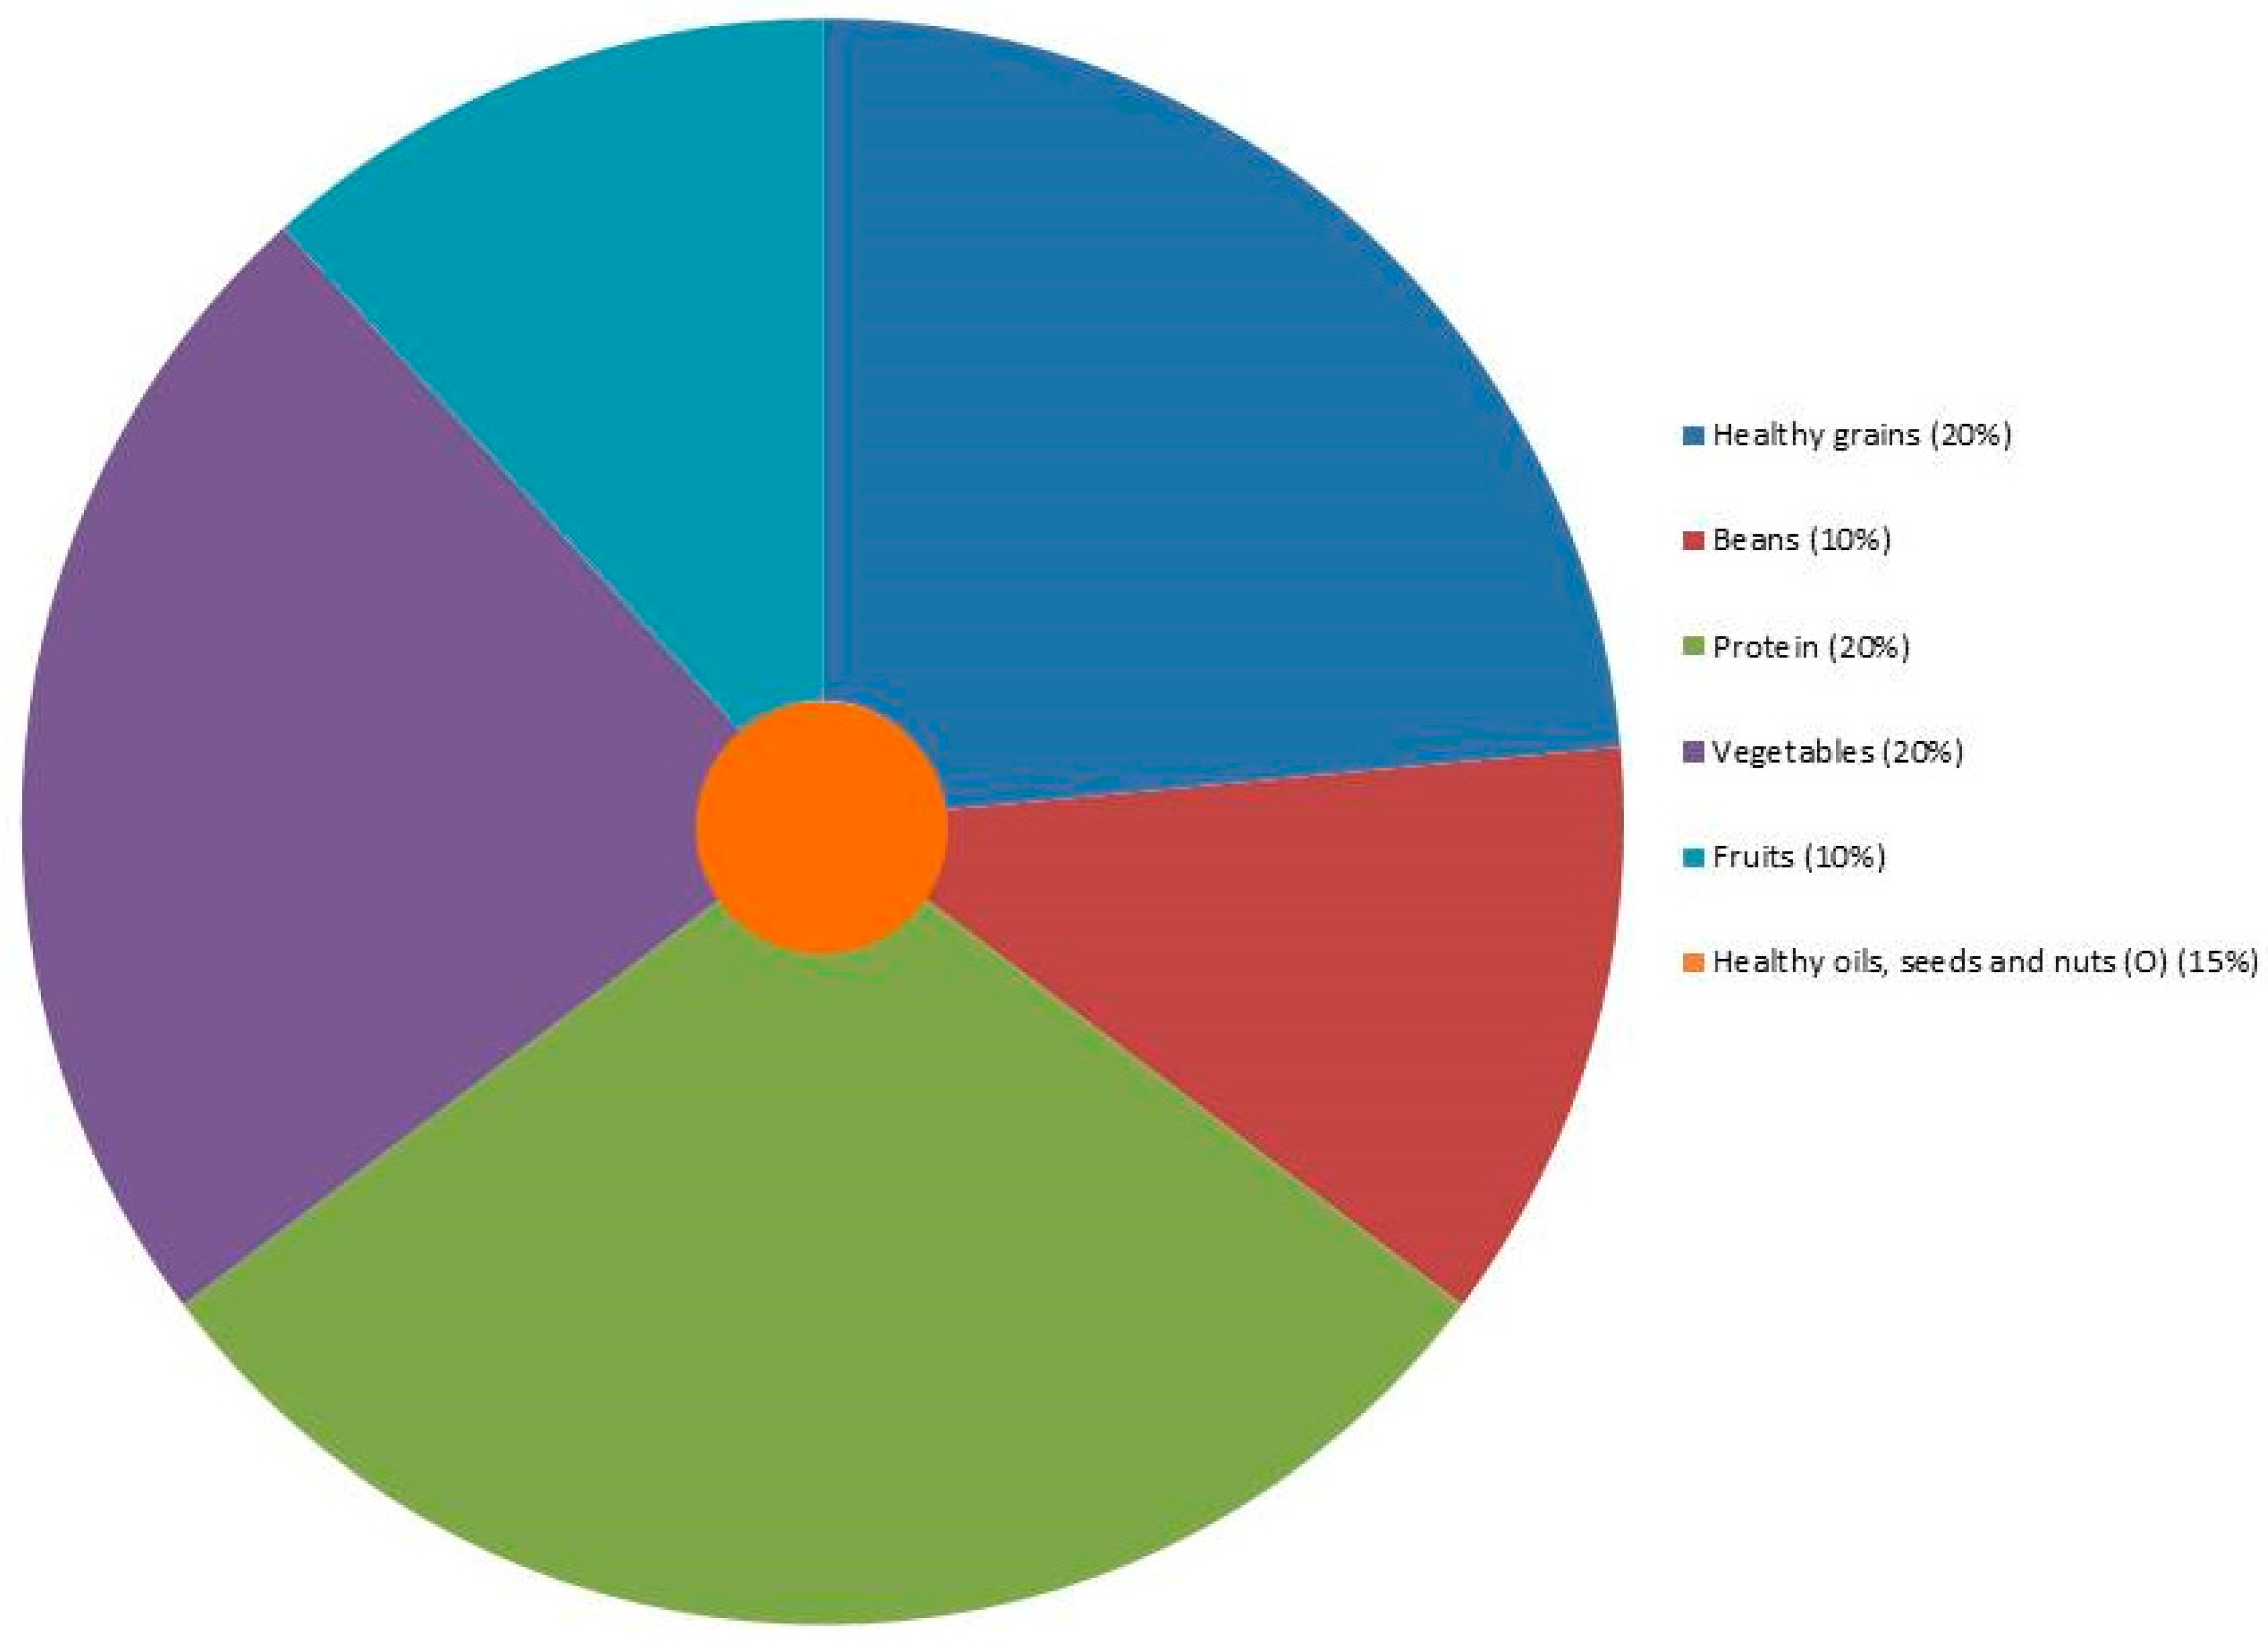
- We separated grains and beans of the big groups of BFG and “My plate” because, in Brazil, it is common to consume white rice and beans in stock at lunchtime [30,34]. The BFG recommends the use of two parts of rice and 1 part of beans in stock. Therefore, we suggest the maintenance of the Brazilian habit, using healthy grains such as brown rice with beans in stock.
- (b)
- Since “My plate” considers starchy vegetables on the group of vegetables differently from BFG (which includes in grains group), we classified starchy vegetables as in “My plate” classification. We increased the percentage of vegetables in the plate and preserved the Brazilian habit of rice consumption at lunch. In BFG, vegetables and fruits compose 15% of TEV, and we proposed 20% of TEV from vegetables and 10% from fruits since fruits could be consumed as desserts at lunch, as a Brazilian habit. Therefore, we doubled the percentage for these groups, which frequently presented high fiber content and low ED.
- (c)
- Dairy products are rich in protein. BFG recommends 25% of TEV from meats, eggs, and dairy products. “My plate” considers 20% of the plate from protein and recommends the intake of one portion of dairy products. Therefore, we chose to classify these products as a protein group and to apply 25% of TEV, in accordance with BFG recommendations. In Brazil, we consider protein dishes those with higher protein content, which can be composed of meat, dairy products or eggs. Therefore, we included dairy products in the protein group to compose the meal. It is also important to highlight that, although beans present a good source of protein, they are not in the protein group in BFG, and beans are in the grains group. Moreover, since beans are almost mandatory in a Brazilian’s lunch plate due to their habit, we opted to classify beans in a separate group.
- (d)
- In Brazil, it is a habit to consume healthy oils (like olive oil) and/or seeds at lunch. Since these products are healthy when consumed in little portions (because they have high ED) and BFG recommends their consumption, we included them on the “Brazilian healthier plate for lunch” classification to compose the plate. It is important to highlight that the BFG stated a maximum of 15% of TEV from oil, fats, seeds, and added sugar. However, in our recommendation, we did not recommend added sugar.
- (e)
- We maintained the guidance of 800 kcal at lunch, in accordance with BFG recommendations because, in Brazil, we have almost 40% of TEV consumed at lunch.
3. Results
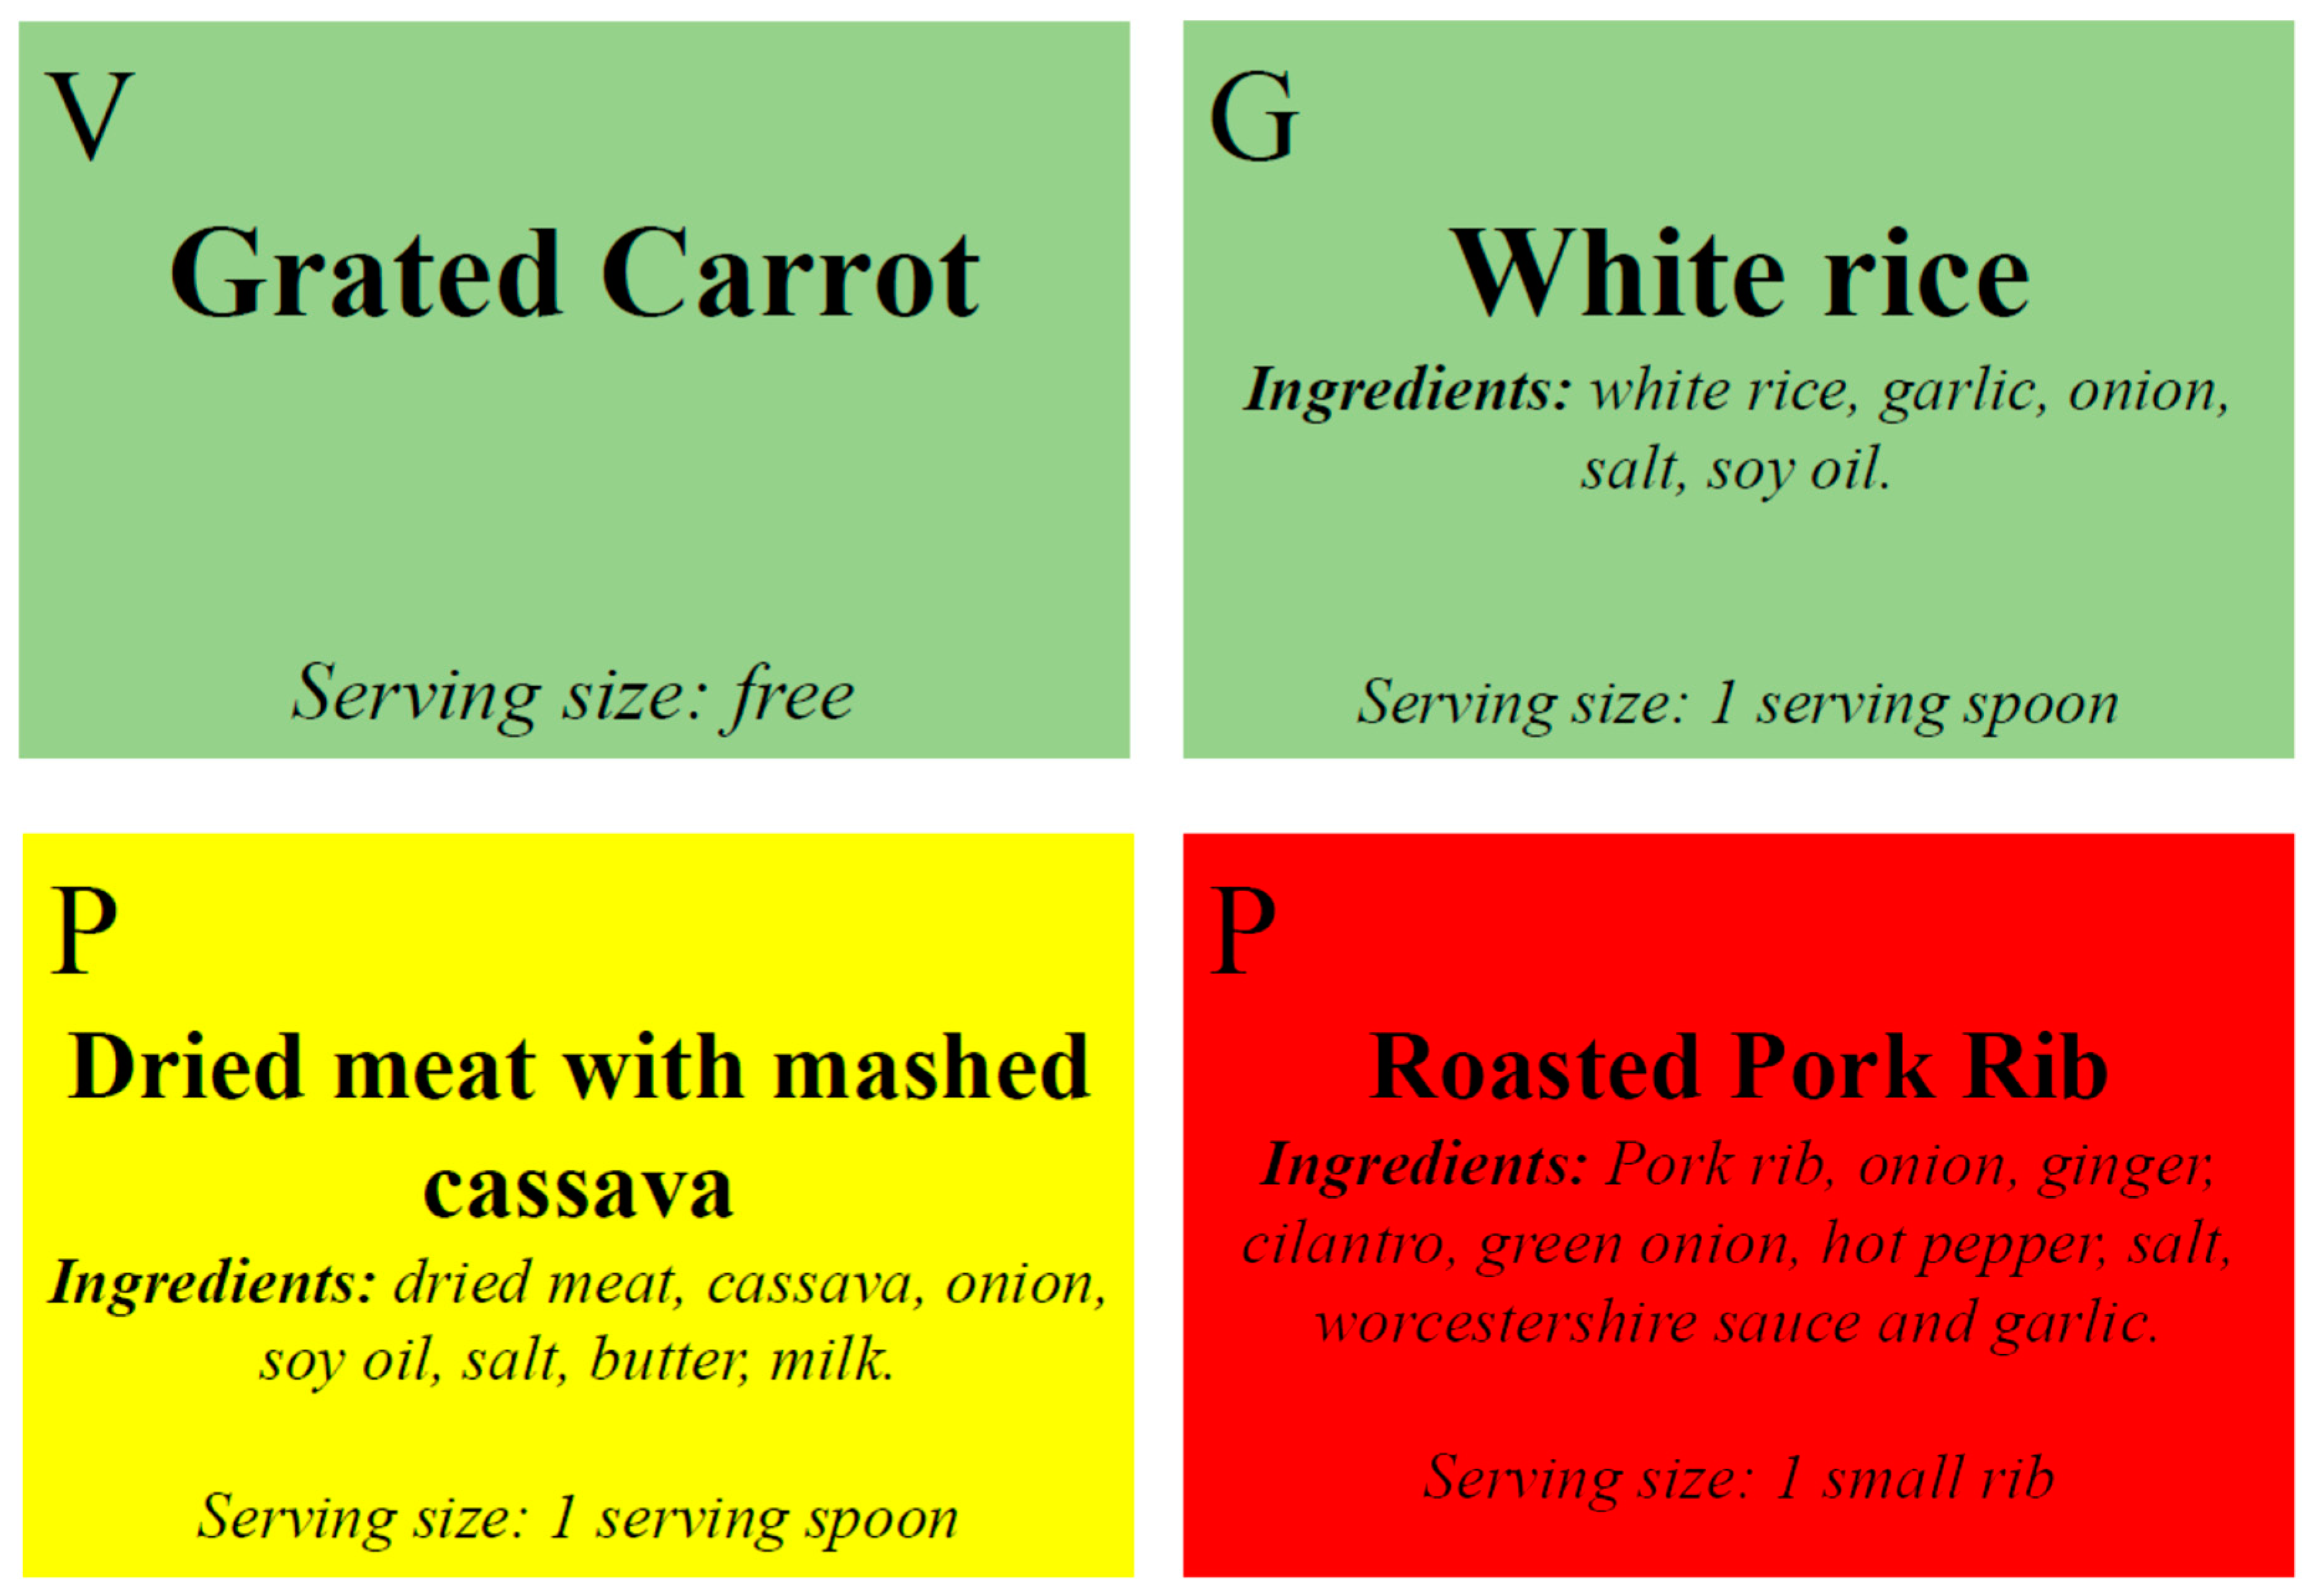
Food Service Application of the Food Rating Scale
4. Discussion
Food Service Application of the Food Rating Scale
5. Conclusions
Author Contributions
Funding
Conflicts of Interest
References
- Gallian, D.M.C. A desumanização do comer. Estud. Avançados 2007, 21, 179–184. [Google Scholar] [CrossRef]
- Naska, A.; Katsoulis, M.; Orfanos, P.; Lachat, C.; Gedrich, K.; Rodrigues, S.S.P.; Freisling, H.; Kolsteren, P.; Engeset, D.; Lopes, C.; et al. HECTOR Consortium Eating out is different from eating at home among individuals who occasionally eat out. A cross-sectional study among middle-aged adults from eleven European countries British Journal of Nutrition. Br. J. Nutr. 2015, 113, 1951–1964. [Google Scholar] [CrossRef] [PubMed]
- Wu, H.W. Unsavory choices: The high sodium density of U.S. chain restaurant foods. J. Food Compos. Anal. 2015, 40, 103–105. [Google Scholar] [CrossRef]
- Friis, R.; Skov, L.R.; Olsen, A.; Appleton, K.M.; Saulais, L.; Dinnella, C.; Hartwell, H.; Depezay, L.; Monteleone, E.; Giboreau, A.; et al. Comparison of three nudge interventions (priming, default option, and perceived variety) to promote vegetable consumption in a self-service buffet setting. PLoS ONE 2017, 12, e0176028. [Google Scholar] [CrossRef] [PubMed]
- Bezerra, I.N.; Sichieri, R. Características e gastos com alimentação fora do domicílio no Brasil. Rev. Saude Publica 2010, 44, 221–229. [Google Scholar] [CrossRef] [PubMed] [Green Version]
- Lachat, C.; Nago, E.; Verstraeten, R.; Roberfroid, D.; Van Camp, J.; Kolsteren, P. Eating out of home and its association with dietary intake: A systematic review of the evidence. Obes. Rev. 2012, 13, 329–346. [Google Scholar] [CrossRef] [PubMed]
- Popkin, B.M.; Adair, L.S.; Ng, S.W. Global nutrition transition and the pandemic of obesity in developing countries. Nutr. Rev. 2012, 70, 3–21. [Google Scholar] [CrossRef] [PubMed] [Green Version]
- Wu, H.W.; Sturm, R. What’s on the menu? A review of the energy and nutritional content of US chain restaurant menus. Public Health Nutr. 2013, 16, 87–96. [Google Scholar] [CrossRef] [PubMed]
- Hoefkens, C.; Pieniak, Z.; Van Camp, J.; Verbeke, W. Explaining the effects of a point-of-purchase nutrition-information intervention in university canteens: A structural equation modelling analysis. Int. J. Behav. Nutr. Phys. Act. 2012, 9, 111. [Google Scholar] [CrossRef] [PubMed] [Green Version]
- Cunha, D.B.; Verly Junior, E.; Paravidino, V.B.; Araújo, M.C.; Mediano, M.F.F.; Sgambato, M.R.; de Souza, B.D.S.N.; Marques, E.S.; Baltar, V.T.; de Oliveira, A.S.D.; et al. Design of a school randomized trial for nudging students towards healthy diet and physical activity to prevent obesity: PAAPAS Nudge study protocol. Medicine 2017, 96, e8898. [Google Scholar] [CrossRef] [PubMed]
- Levings, J.L.; Gunn, J.P. From Menu to Mouth: Opportunities for Sodium Reduction in Restaurants. Prev. Chronic Dis. 2014, 11, 130237. [Google Scholar] [CrossRef] [PubMed]
- Cranage, D.A.; Conklin, M.T.; Lambert, C.U. Effect of Nutrition Information in Perceptions of Food Quality, Consumption Behavior and Purchase Intentions. J. Foodserv. Bus. Res. 2004, 7, 43–61. [Google Scholar] [CrossRef]
- Deon, B.C.; Medeiros, L.B.; Lúcia de Freitas Saccol, A.; Hecktheuer, L.H.; Saccol, S.; Naissinger, M. Good food preparation practices in households: A review. Trends Food Sci. Technol. 2014, 39, 40–46. [Google Scholar] [CrossRef]
- De Carvalho, A.P.; De Oliveira, V.B.; Dos Santos, L.C. Hábitos alimentares e práticas de educação nutricional:atenção a crianças de uma escola municipal de BeloHorizonte, Minas Gerais Food habits and nutritional education practices: Warning for children of a municipal school of Belo Horizonte, Minas Gerais. Pediatria (Santiago) 2007, 32, 20–27. [Google Scholar]
- Botelho, R.B.A.; Avena, F.; Veras, M.; Zandonadi, R.P. Nutritional adequacy of meals offered and consumed by soldiers of the Brazilian Army. Rev. Nutr. 2014, 27, 229–239. [Google Scholar] [CrossRef] [Green Version]
- Sanin, V.; Pfetsch, V.; Koenig, W. Dyslipidemias and Cardiovascular Prevention: Tailoring Treatment According to Lipid Phenotype. Curr. Cardiol. Rep. 2017, 19, 61. [Google Scholar] [CrossRef] [PubMed]
- De Oliveira, C.; Marmot, M.G.; Demakakos, P.; Vaz de Melo Mambrini, J.; Peixoto, S.V.; Lima-Costa, M.F. Mortality risk attributable to smoking, hypertension and diabetes among English and Brazilian older adults (The ELSA and Bambui cohort ageing studies). Eur. J. Public Health 2016, 26, 831–835. [Google Scholar] [CrossRef] [PubMed]
- Fernandes, A.C.; Oliveira, R.C.; Proença, R.P.C.; Curioni, C.C.; Rodrigues, V.M.; Fiates, G.M.R. Influence of menu labeling on food choices in real-life settings: A systematic review. Nutr. Rev. 2016, 74, 534–548. [Google Scholar] [CrossRef] [PubMed]
- Sinclair, S.E.; Cooper, M.; Mansfield, E.D. The influence of menu labeling on calories selected or consumed: A systematic review and meta-analysis. J. Acad. Nutr. Diet. 2014, 114, 1375–1388.e15. [Google Scholar] [CrossRef] [PubMed]
- Scholderer, J.; Brunsø, K.; Bredahl, L.; Grunert, K.G. Cross-cultural validity of the food-related lifestyles instrument (FRL) within Western Europe. Appetite 2004, 42, 197–211. [Google Scholar] [CrossRef] [PubMed]
- Almiron-Roig, E.; Solis-Trapala, I.; Dodd, J.; Jebb, S.A. Estimating food portions. Influence of unit number, meal type and energy density. Appetite 2013, 71, 95–103. [Google Scholar] [CrossRef] [PubMed]
- Arno, A.; Thomas, S. The efficacy of nudge theory strategies in influencing adult dietary behaviour: A systematic review and meta-analysis. BMC Public Health 2016, 16, 676. [Google Scholar] [CrossRef] [PubMed]
- Borgmeier, I.; Westenhoefer, J. Impact of different food label formats on healthiness evaluation and food choice of consumers: A randomized-controlled study. BMC Public Health 2009, 9, 184. [Google Scholar] [CrossRef] [PubMed]
- Balcombe, K.; Fraser, I.; Di Falco, S. Traffic lights and food choice: A choice experiment examining the relationship between nutritional food labels and price. Food Policy 2010, 35, 211–220. [Google Scholar] [CrossRef] [Green Version]
- Dodds, P.; Wolfenden, L.; Chapman, K.; Wellard, L.; Hughes, C.; Wiggers, J. The effect of energy and traffic light labelling on parent and child fast food selection: A randomised controlled trial. Appetite 2014, 73, 23–30. [Google Scholar] [CrossRef] [PubMed]
- Pereira, M.G. Epidemiologia: Teoria e Pratica; Guanabara Koogan: Rio de Janeiro, Brazil, 1995; ISBN 9788527703567. [Google Scholar]
- Can Eating Fruits and Vegetables Help People to Manage Their Weight? Available online: https://www.cdc.gov/nccdphp/dnpa/nutrition/pdf/rtp_practitioner_10_07.pdf (accessed on 11 September 2018).
- Front of Pack Nutritional Signpost Labelling Technical Guidance. Available online: https://www.foodwatch.org/fileadmin/Themen/Ampelkennzeichnung/guidance_ampel_issue_1_januar_2007.pdf (accessed on 11 September 2018).
- De Akutsu, R.C.; Botelho, R.A.; Camargo, E.B.; Sávio, K.E.O.; Araújo, W.C. A ficha técnica de preparação como instrumento de qualidade na produção de refeições. Rev. Nutr. 2005, 18, 277–279. [Google Scholar] [CrossRef]
- GUIA ALIMENTAR PARA A POPULAÇÃO BRASILEIRA Promovendo a Alimentação Saudável. Available online: http://bvsms.saude.gov.br/bvs/publicacoes/guia_alimentar_populacao_brasileira_2008.pdf (accessed on 11 September 2018).
- Brasil Guia Alimentar Para a População Brasileira Promovendo a Alimentação Saudável. Available online: http://dab.saude.gov.br/portaldab/biblioteca.php?conteudo = publicacoes/guia_alimentar2014 (accessed on 28 July 2017).
- USDA My Plate. Available online: https://www.choosemyplate.gov/ (accessed on 22 February 2018).
- Barbosa, L. Feijão com arroz e arroz com feijão: OBrasil no prato dos Brasileiros. Horiz. Antropol. 2007, 13, 87–116. [Google Scholar] [CrossRef]
- Instituto Brasileiro de Geografia e Estatística. Pesquisa de Orçamentos Familiares: Análise do Consumo Alimentar Pessoal No Brasil; IBGE: Rio de Janeiro, Brazil, 2011; ISBN 978-85-240-41 98-3.
- Peyerl, F.F.; De Matos, K.H.O. Avaliação da legislação aplicada a rotulagem de alimentos embalados no Brasil e na Nova Zelândia. Rev. E-Tech Tecnol. Compet. Ind. 2012, 14–25. [Google Scholar]
- Araújo, H.M.C.; Araújo, W.M.C.; Botelho, R.B.A.; Zandonadi, R.P. Doença celíaca, hábitos e práticas alimentares e qualidade de vida. Rev. Nutr. 2010, 23, 467–474. [Google Scholar] [CrossRef] [Green Version]
- Eid da Rosa, A. Substitutos de Leite Condensado a Partir de Extratos Vegetais; University of Brasilia: Brasilia, Brazil, 2013. [Google Scholar]
- Zandonadi, R.P.; Botelho, R.B.A.; Ginani, V.C.; De Cássia, R.; Akutsu, C.A.; Eleonora De Oliveira Savio, K.; Araújo, W.M.C. Sodium and health: New proposal of distribution for major meals. Health 2014, 6, 195–201. [Google Scholar] [CrossRef]
- Mangabeira Júnior, A.S.; Sávio, K.E.O.; Pineli, L.D.L.D.O.; Akutsu, R.D.C.C.; Botelho, R.B.A. Acceptability of Reduced-Fat and Fried-Food-Free Menu in Self-Service Restaurant. J. Culin. Sci. Technol. 2017, 16, 165–177. [Google Scholar] [CrossRef]
- Tabela Brasileira de Composição de Alimentos. TACO; Núcleo de Estudos e Pesquisas em Alimentação, Ed.; Unicamp: Campinas, Brazil, 2011. [Google Scholar]
- Domene, S.M.Á. Técnica Dietética: Teoria e Aplicações; Guanabara Koogan: Rio de Janeiro, Brazil, 2011. [Google Scholar]
- Ginani, V.C.; Araújo, W.M.C.; Botelho, R.B.A.; Akutsu, R.C.C.A.; Zandonadi, R.P. What is Offered by Public Foodservices for Low Income Population in Brazil is Adequate to Health Promotion Regarding Energy Density. J. Culin. Sci. Technol. 2017, 1–13. [Google Scholar] [CrossRef]
- Andrade, G.; da Costa Louzada, M.; Azeredo, C.; Ricardo, C.; Martins, A.; Levy, R. Out-of-Home Food Consumers in Brazil: What do They Eat? Nutrients 2018, 10, 218. [Google Scholar] [CrossRef] [PubMed]
- De Menezes, E.W.; Lopes, T.D.V.C.; Mazzini, E.R.; Dan, M.C.T.; Godoy, C.; Giuntini, E.B. Application of Choices criteria in Brazil: Impact on nutrient intake and adequacy of food products in relation to compounds associated to the risk of non-transmissible chronic diseases. Food Chem. 2013, 140, 547–552. [Google Scholar] [CrossRef] [PubMed]
- Duarte, I.A.E.; Botelho, R.B.A.; Akutsu, R.D.C. Regional Food Consumption in the Northeast of Brazil by the Low-Income Population. J. Culin. Sci. Technol. 2017, 1–15. [Google Scholar] [CrossRef]
- Diliberti, N.; Bordi, P.L.; Conklin, M.T.; Roe, L.S.; Rolls, B.J. Increased Portion Size Leads to Increased Energy Intake in a Restaurant Meal. Obes. Res. 2004, 12, 562–568. [Google Scholar] [CrossRef] [PubMed] [Green Version]
- Ello-Martin, J.A.; Ledikwe, J.H.; Rolls, B.J. The influence of food portion size and energy density on energy intake: Implications for weight management. Am. J. Clin. Nutr. 2005, 82, 236S–241S. [Google Scholar] [CrossRef] [PubMed]
- Centers for Disease Control and Prevention (CDC). Vital signs: Food categories contributing the most to sodium consumption–United States, 2007–2008. MMWR. Morb. Mortal. Wkly. Rep. 2012, 61, 92–98. [Google Scholar]
- Sodium in Your Diet Use the Nutrition Facts Label and Reduce Your Intake. Available online: https://www.fda.gov/downloads/Food/IngredientsPackagingLabeling/UCM315471.pdf (accessed on 11 September 2018).
- WCRF; AICR. Food, Nutrition, Physical Activity, and the Prevention of Cancer: A Global Perspective; American Institute for Cancer Research: Washington, DC, USA, 2007; ISBN 978-0-9722522-2-5. [Google Scholar]
- Canella, D.S.; Bandoni, D.H.; Jaime, P.C. Densidade energética de refeições oferecidas em empresas inscritas no programa de alimentação do Trabalhador no município de São Paulo. Rev. Nutr. 2011, 24, 715–724. [Google Scholar] [CrossRef] [Green Version]
- Lipi, M. Densidade Energética da Dieta de Trabalhadores de uma Indústria da Região Metropolitana de São Paulo. Master’s Thesis, Faculdade de Saúde Pública da Universidade de São Paulo, São Paulo, Brazil, 2008. [Google Scholar]
- Stella, R.H. Densidade Energética: Relação com Variáveis Demográficas, de Estilo De vida, Nutricionais e Socioeconômicas em Amostra Representativa Da População Adulta do Município de São Paulo. Bachelor’s Thesis, Universidade de São Paulo, São Paulo, Brazil, 2008. [Google Scholar]
- Kant, A.K.; Graubard, B.I. Energy density of diets reported by American adults: Association with food group intake, nutrient intake and body weight. Int. J. Obes. 2005, 29, 950–956. [Google Scholar] [CrossRef] [PubMed]
- Hanks, A.S.; Just, D.R.; Wansink, B. Smarter lunchrooms can address new school lunchroom guidelines and childhood obesity. J. Pediatr. 2013, 162, 867–869. [Google Scholar] [CrossRef] [PubMed]
- Bucher, T.; Collins, C.; Rollo, M.E.; Mccaffrey, T.A.; De Vlieger, N.; Van Der Bend, D.; Truby, H.; Perez-Cueto, F.J.A. Nudging consumers towards healthier choices: A systematic review of positional influences on food choice. Br. J. Nutr. 2016, 115, 2252–2263. [Google Scholar] [CrossRef] [PubMed]
- Cotta, R.M.M.; de Mendonça, É.T.; Costa, G.D. Da Portfólios reflexivos: Construindo competências para o trabalho no Sistema Único de Saúde. Rev. Panam. Salud Pública 2011, 30, 415–421. [Google Scholar] [CrossRef] [PubMed]
- Cotta, R.M.M.; da Costa, G.D.; Mendonça, É.T. Portfólio reflexivo: Uma proposta de ensino e aprendizagem orientada por competências. Cien. Saude Colet. 2013, 18, 1847–1856. [Google Scholar] [CrossRef] [PubMed]
- Mitre, S.M.; Siqueira-Batista, R.; Girardi-de-Mendonça, J.M.; de Morais-Pinto, N.M.; Meirelles, C.D.A.B.; Pinto-Porto, C.; Moreira, T.; Hoffmann, L.M.A. Metodologias ativas de ensino-aprendizagem na formação profissional em saúde: Debates atuais. Cien. Saude Colet. 2008, 13, 2133–2144. [Google Scholar] [CrossRef] [PubMed]
- Escolha Alimentar do Comensal de um Restaurante por Peso. Available online: https://repositorio.ufsc.br/xmlui/handle/123456789/88477 (accessed on 11 September 2018).
- Hwang, J.; Lorenzen, C.L. Effective nutrition labeling of restaurant menu and pricing of healthy menu. J. Foodserv. 2008, 19, 270–276. [Google Scholar] [CrossRef] [Green Version]
- Ozdemir, B.; Caliskan, O. Menu Design: A Review of Literature. J. Foodserv. Bus. Res. 2015, 18, 189–206. [Google Scholar] [CrossRef]
- Roseman, M.G.; Mathe-Soulek, K.; Higgins, J.A. Relationships among grocery nutrition label users and consumers’ attitudes and behavior toward restaurant menu labeling. Appetite 2013, 71, 274–278. [Google Scholar] [CrossRef] [PubMed]


| Menu Types of Preparations | Energy Density (kcal/g) | Sodium Content (mg/100 g) | Portion (g) |
|---|---|---|---|
| Mean ± SD | Mean ± SD | Mean | |
| Salad sauces * | 1.8 ± 0.45 | 876 ± 806 | 22 |
| Fruits | 0.4 ± 0.09 | 4 ± 4 | 75 |
| Proteins | 1.6 ± 0.56 | 440 ± 261 | 69 |
| Grains | 1.6 ± 0.34 | 308 ± 272 | 103 |
| Beans | 2.0 ± 1.22 | 331 ± 287 | 69 |
| Cooked vegetables | 1.4 ± 0.89 | 282 ± 264 | 63 |
| Raw vegetables | 0.8 ± 0.55 | 37 ± 45 | 102 |
| Consumers Changed the Food Choice | OR # | CI (OR) ## | p-Value | |||||
|---|---|---|---|---|---|---|---|---|
| Yes | No | |||||||
| N | % | N | % | |||||
| Sex | Female | 139 | 53 | 113 | 52% | 1.06 | 0.73–1.54 | 0.783 |
| Male | 121 | 47% | 104 | 48% | ||||
| Total | 260 | 217 | ||||||
| Age range | up to 35 years | 118 | 55% | 93 | 50% | 1.2 | 0.79–1.82 | 0.369 |
| 36 years and over | 98 | 45% | 93 | 50% | ||||
| Total | 216 | 186 | ||||||
| Education | Graduate | 131 | 51% | 91 | 43% | 1.37 | 0.94–2.01 | 0.096 |
| Postgraduate | 128 | 49% | 122 | 57% | ||||
| Total | 259 | 213 | ||||||
| Marital status | Married/with mate-partner | 154 | 61% | 143 | 67% | 0.77 | 0.51–1.15 | 0.175 |
| Single | 97 | 39% | 69 | 33% | ||||
| Total | 251 | 212 | ||||||
| Children | Has children | 120 | 48% | 108 | 52% | 0.86 | 0.59–1.27 | 0.454 |
| Does not have children | 130 | 52% | 101 | 48% | ||||
| Total | 250 | 209 | ||||||
| Weekly frequency that have lunch on food service | Up to 2 times a week | 45 | 18% | 23 | 11% | 1.76 | 1.00–3.13 | 0.051 |
| 3 to 5 times a week | 212 | 82% | 191 | 89% | ||||
| Total | 257 | 214 | ||||||
| Number of items that called the attention | 3 items or more | 58 | 22% | 31 | 14% | 1.70 | 1.05-2.75 | 0.033 * |
| Up to 2 items | 202 | 78% | 184 | 86% | ||||
| Total | 260 | 215 | ||||||
| Clarity of methodology | I did not understand anything | 3 | 1.2% | 2 | 0.9% | 1.26 | 0.21–7.61 | 0.582 |
| I understand | 256 | 98.8% | 215 | 99.1% | ||||
| Total | 259 | 217 | ||||||
| What has changed in the meal after the methodology? | 1 item | 188 | 75% | 9 | 100% | 0 | 0–1.82 | 0.119 |
| 2 items or more | 63 | 25% | 0 | 0% | ||||
| Total | 251 | 9 | ||||||
© 2018 by the authors. Licensee MDPI, Basel, Switzerland. This article is an open access article distributed under the terms and conditions of the Creative Commons Attribution (CC BY) license (http://creativecommons.org/licenses/by/4.0/).
Share and Cite
Mazocco, L.; Akutsu, R.D.C.C.A.; Botelho, R.B.A.; Da Silva, I.C.R.; Adjafre, R.; Zandonadi, R.P. Food Rating Scale in Food Services: From Development to Assessment of a Strategy for Consumer Healthier Choices. Nutrients 2018, 10, 1303. https://doi.org/10.3390/nu10091303
Mazocco L, Akutsu RDCCA, Botelho RBA, Da Silva ICR, Adjafre R, Zandonadi RP. Food Rating Scale in Food Services: From Development to Assessment of a Strategy for Consumer Healthier Choices. Nutrients. 2018; 10(9):1303. https://doi.org/10.3390/nu10091303
Chicago/Turabian StyleMazocco, Larissa, Rita De Cássia Coelho Almeida Akutsu, Raquel Braz Assunção Botelho, Izabel Cristina Rodrigues Da Silva, Raquel Adjafre, and Renata Puppin Zandonadi. 2018. "Food Rating Scale in Food Services: From Development to Assessment of a Strategy for Consumer Healthier Choices" Nutrients 10, no. 9: 1303. https://doi.org/10.3390/nu10091303