Body Mass Index, Vitamin D, and Type 2 Diabetes: A Systematic Review and Meta-Analysis


Department of Clinical Medicine Aarhus University, 8200 Aarhus, Denmark
*
Author to whom correspondence should be addressed.
Nutrients 2018, 10(9), 1182; https://doi.org/10.3390/nu10091182
Submission received: 12 August 2018
/
Revised: 22 August 2018
/
Accepted: 24 August 2018
/
Published: 28 August 2018
Abstract
:The deficiency of vitamin D is prevalent all over the world. Studies have shown that vitamin D may play an important role in the development of obesity. The current study was conducted to quantitatively evaluate the association between serum 25-(OH) vitamin D levels and the risk of obesity in both diabetic and non-diabetic subjects. A systematic review and meta-analysis of observational studies was carried out for that purpose. We searched the Medline, PubMed, and Embase databases throughout all of March 2018. A total of fifty five observational studies for both diabetic and non-diabetic subjects were finally included in the meta-analysis. The data were analyzed by comprehensive meta-analysis software version 3 and the random effects model was used to analyze the data. The meta-analysis showed an overall inverse relationship between serum vitamin D status and body mass index (BMI) in studies of both diabetic (r = −0.173, 95% = −0.241 to −0.103, p = 0.000) and non-diabetic (r = −0.152, 95% = −0.187 to −0.116, p = 0.000) subjects. The evidence of publication bias was not found in this meta-analysis. In conclusion, the deficiency of vitamin D is associated with an increased level of BMI in the studies of both diabetic and non-diabetic subjects. Reliable evidence from well-designed future randomized controlled trials is required to confirm the findings from observational studies and to find out the potential regulatory effects of vitamin D supplementation to lower BMI.
1. Introduction
Obesity has been prevalent all over the world in association with a rise in type 2 diabetes and hypovitaminosis D over the last three decades [1]. If current trends continue, over one billion adults will be affected by obesity, and 2.7 billion will be overweight by 2025, as estimated by the World Obesity Federation. Due to the relationship of obesity to chronic diseases like some cancers, cardiovascular diseases, and type 2 diabetes (T2D), the disease is gaining in much importance [2]. Recently, vitamin D deficiency has attracted attention in the development of obesity. It is evident that circulating vitamin D deficiency is related with obesity and type 2 diabetes [1], and both hypovitaminosis D and obesity ends up in common diseases like T2D, cardiovascular disease, and some cancers [3].
The high vitamin D deficiency worldwide is usually a result of reduced cutaneous production due to decreased sun exposure and a reduced intake of vitamin D, which is related to increased mortality rates [4]. In the areas where the sun does not shine so often, vitamin D is not photosynthesized properly [5], therefore the population of European countries are usually deficient in vitamin D [6]. The deficiency of vitamin D is seen even in parts of the world that are considered as deserts and have long day lengths. It is well known that vitamin D is involved in bone mineralization, however, recent studies have shown that hypovitaminosis D is responsible for more pathologic conditions than previously thought. For example, Metabolic Syndrome (MS), Insulin Resistance, and Diabetes Mellitus could potentially develop as a result of a deficiency in vitamin D [7,8,9].
After binding to the vitamin D responsive elements in the promoter region, the vitamin D receptor (VDR), a nuclear transcriptional regulator, up or down regulates the gene transcription [10]. The biologically active form of vitamin D (1, 25-hydroxy vitamin D) plays a central role in a large variety of metabolic pathways by binding to the vitamin D receptor (VDR). The vitamin D receptor is expressed in a variety of cells, e.g., pancreatic beta cells of Langerhans, liver, adipose tissues, and muscle cells [11,12,13]. The 25 hydroxy vitamin D is usually considered as the biomarker for vitamin D status, however, well-defined cutoff values have not yet been established that parallel the optimal physiological vitamin D requirements. Therefore, there is a need to evaluate the vitamin D recommendations.
Consistent with our hypothesis that vitamin D deficiency and obesity are related, areas where there is a deficiency of vitamin D are also prevalent with obesity [14]. Whether it is the deficiency of vitamin D which leads to obesity or the obesity that leads to the deficiency of vitamin D is debatable. Scientists have suggested that a higher body mass index BMI can lead to lower vitamin D, as vitamin D, being a fat soluble hormone, is sequestered in the adipose tissues and only small quantities are consequently available for circulation [15]. Moreover, the production of enzymes (25-Hydroxylase and 1-hydroxylase) catalyzing the hydroxylation of vitamin D to its active form, is very low in obese individuals when compared to their lean counterparts [16], therefore the active metabolites of vitamin D (25-hydroxy vitamin D and 1, 25-hydroxy vitamin D) are formed in relatively less quantities in obese individuals.
We examined the prospective association between the levels of vitamin D and BMI. Sun exposure also affects the vitamin D status, therefore this association may be affected by the latitude of residency. In addition, different cultures and customs, method of determining vitamin D, developmental status of the country, and gender may have an effect on this correlation. We performed meta-regression to find out if these parameters had an influence on the association between vitamin D status and obesity.
2. Materials and Methods
We searched three databases, PubMed, Cochrane, and Embase, for the collection of the observational studies. The articles were collected from inception until March 2018. The following key words were used “25 (OH) D”, “25 (OH) vitamin D”, “vitamin D”, “Cholecalciferol”, “vitamin D3”, in combination with “BMI”, “Body mass index”, “obesity”, “waist circumference”, “abdominal obesity”, “overweight”, “adiposity”, “body size”, and “type 2 diabetes”, “T2D”, “fasting plasma glucose”, “HBA1C”, “Homeostasis model assessment of insulin resistance”, and “fasting plasma insulin”. The keywords were searched both as free terms and in combination with MeSH (medical subject headings) in PubMed and EMTREE in EMBASE. Observational studies were selected that showed the association of body mass index and 25-hydroxy vitamin D levels in the blood. We specified that every study must have been conducted on human beings, and the age of the individuals should be more than 18 years. We only included studies that were written in English. If the studies were commentaries, editorials, or case reports, they were excluded. We also hand searched the related articles for more references. The authors of the identified articles were contacted if the articles lacked essential information on the estimates and the moderators.
Statistical Analysis and Outcome Measures
The correlation coefficient was used as a summary measure for the outcome studies. We gathered the results from all over the world, from different ethnicities and regions, and we assumed that the biological effect of vitamin D was different in different populations. Therefore, we followed the random effects model to compute the meta-analysis results. We used I2 as a test of consistency, which describes the total heterogeneity between the studies in the form of percentage, and τ2 was used as an estimate of reliability. The quality of the evidence was assessed by GRADE (Grades of Recommendation Assessment Development and Evaluation). Evidence derived from observational studies obtained a low initial GRADE score when compared to the randomized control trials which achieved a high initial GRADE score. A number of factors can upgrade or low grade these scores, e.g., inconsistency (unexplained heterogeneity between the studies), indirectness (compromised generalizability of results), imprecision (too long confidence intervals), and publication bias (small number of participants). The software used was comprehensive meta-analysis version 3 (Biostat, Inc., Englewood, NJ, USA), tools were used to perform the meta-analysis and the risk of bias assessment was done using Review Manager 5.3. Forest plot graphs were used to present the results and meta-regression was performed to evaluate the potential sources of bias.
3. Results
A total of 1876 observational studies were retrieved electronically from Embase, PubMed, and Medline, and 23 observational studies were identified by other sources. Endnote software was used to screen the references for duplication and 721 references were deleted. Three hundred and twenty nine articles were selected for abstract assessment on the basis of titles. After abstract assessment, we selected 105 studies for further evaluation by full text assessment. Fifty five studies that reported the association between BMI and vitamin D status both in healthy adults and type 2 diabetes patient populations all over the world were finally selected for meta-analysis (Figure 1).
3.1. Included Studies
Participants from all of the 55 included studies were at least 18 years of age and belonged to diverse backgrounds from all over the word. Forty one studies were from Asia, thirteen from Europe, nine from America, and one from Australia. For the determination of vitamin D, twenty two studies used the chemiluminescence (CLIA) method, fifteen studies used the radioimmunoassay (RIA), nine studies used the enzyme linked immunosorbent assay (ELISA), eight studies used the electrochemiluminescence (ECLIA) method, five studies used the enzyme immunoassay (EIA), three studies used liquid chromatography-mass spectrometry (LC-MS), and two studies used high pressure liquid chromatography (HPLC). We performed random effects meta-analysis due to the huge diversity in the study population and the method of determination of vitamin D. We additionally estimated meta-regression to determine the effect of different parameters, e.g., the method of vitamin D determination, latitude, and different BMI groups, which were likely to confound the correlation between vitamin D status and BMI, ultimately affecting the overall effect size.
3.1.1. Meta-Analysis of the Association of Vitamin D and BMI in Non-Diabetics
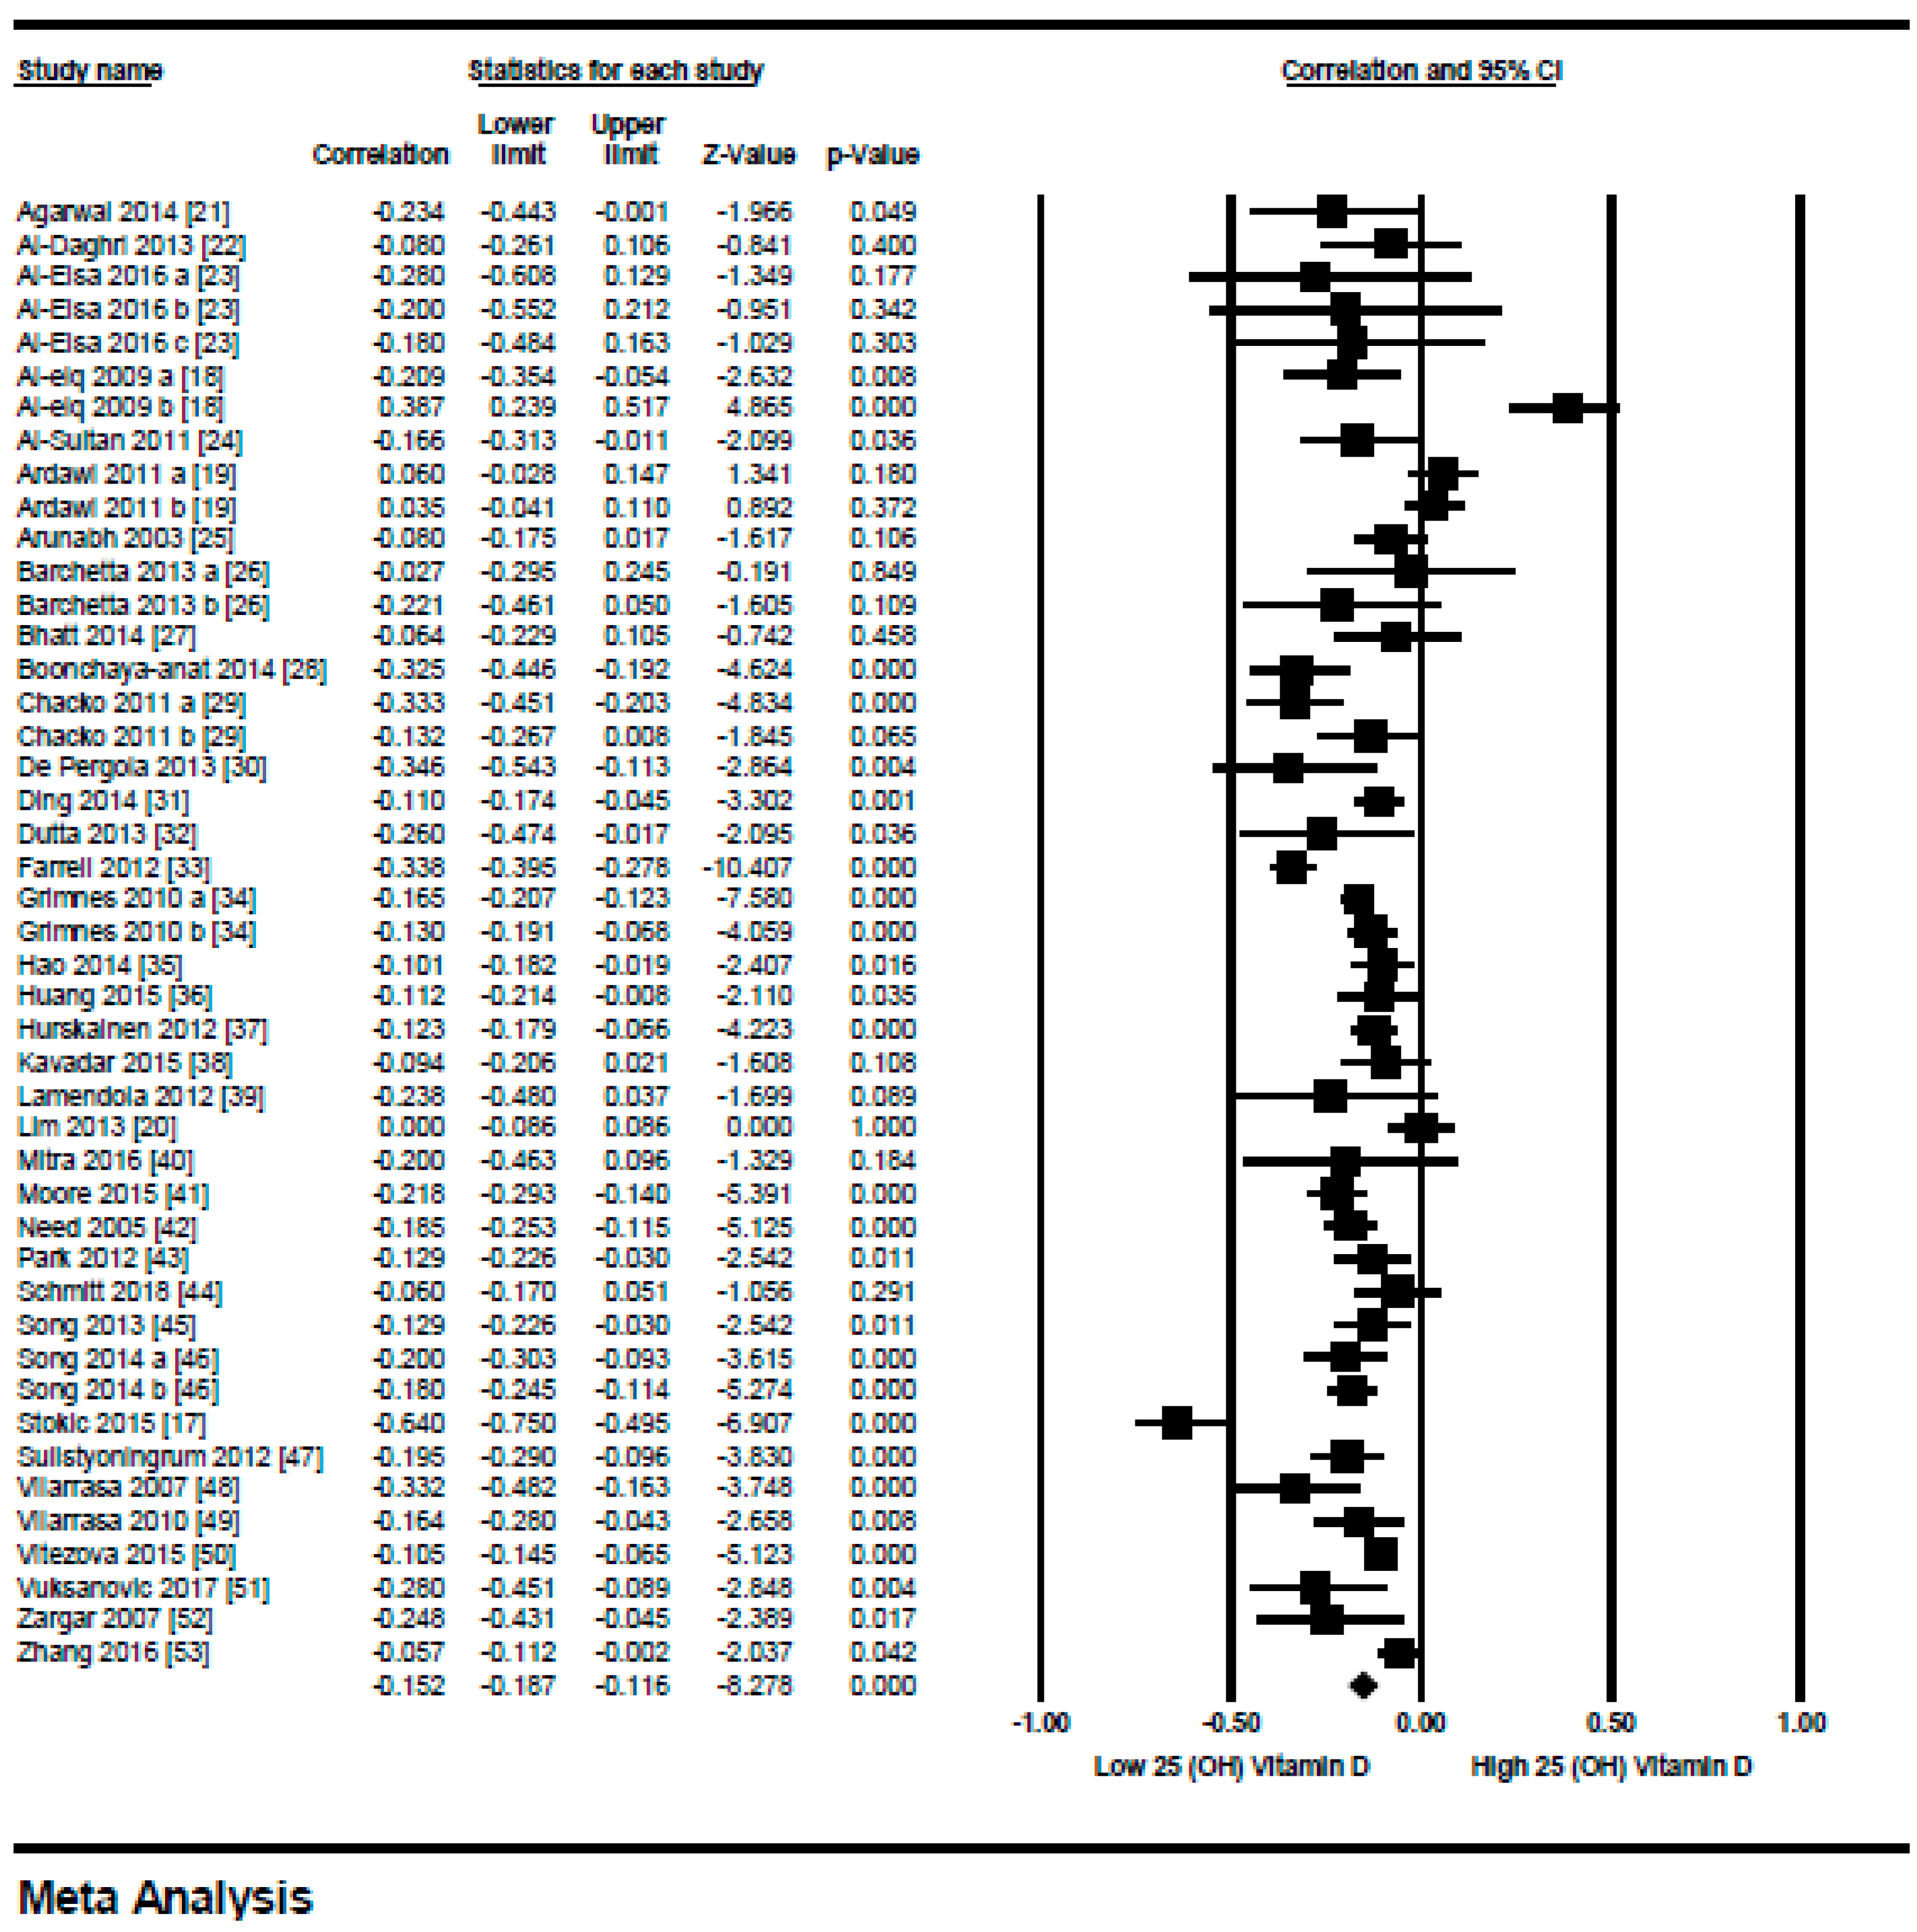
We included 45 studies in this meta-analysis. The relationship between serum vitamin D status and BMI in non-diabetic subjects all over the world is shown in Figure 2. An overall inverse relationship (r = −0.152, 95% = −0.187 to −0.116, p = 0.000) (Figure 2) was seen between vitamin D status and BMI in this meta-analysis. All of the studies had a correlation coefficient between 0 to −0.5, except for one study from Novi Sad, Serbia [17], which showed a relatively stronger correlation (r = −0.64), other studies from Saudi Arabia [18,19] that showed a positive correlation, and a study from Korea [20] showed no relationship at all. Interestingly, all the studies that showed a positive correlation were from Saudi Arabia and the study population was female.
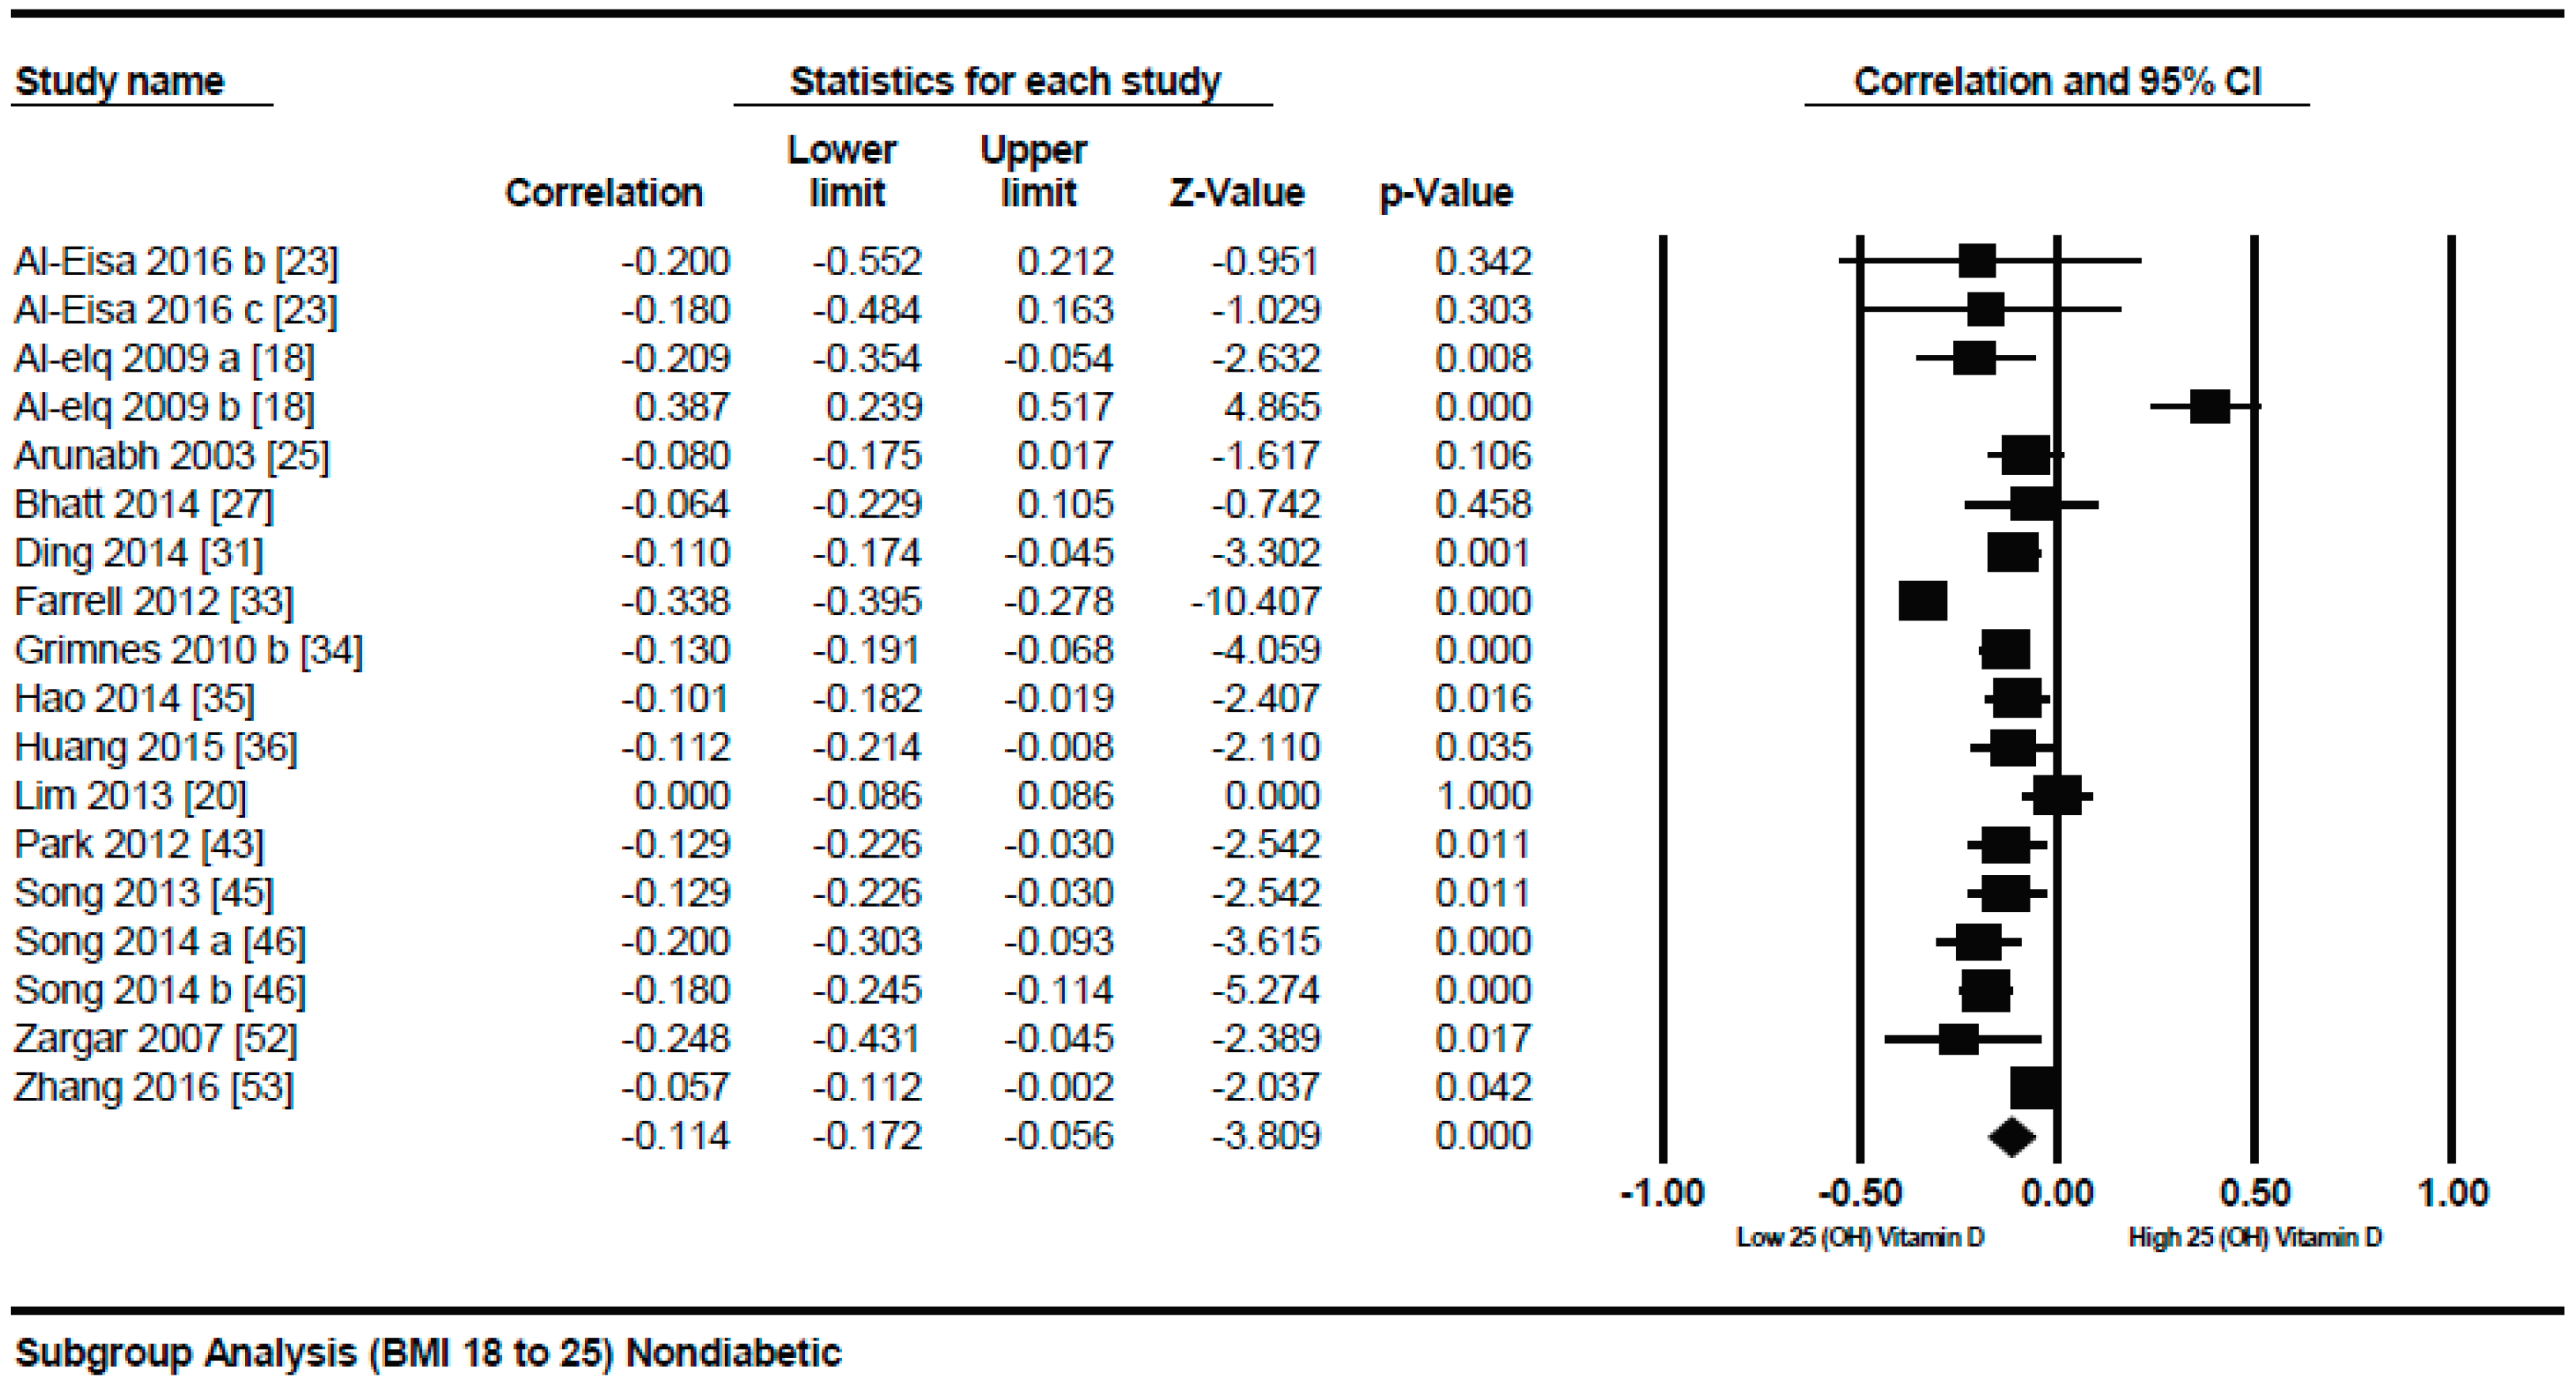
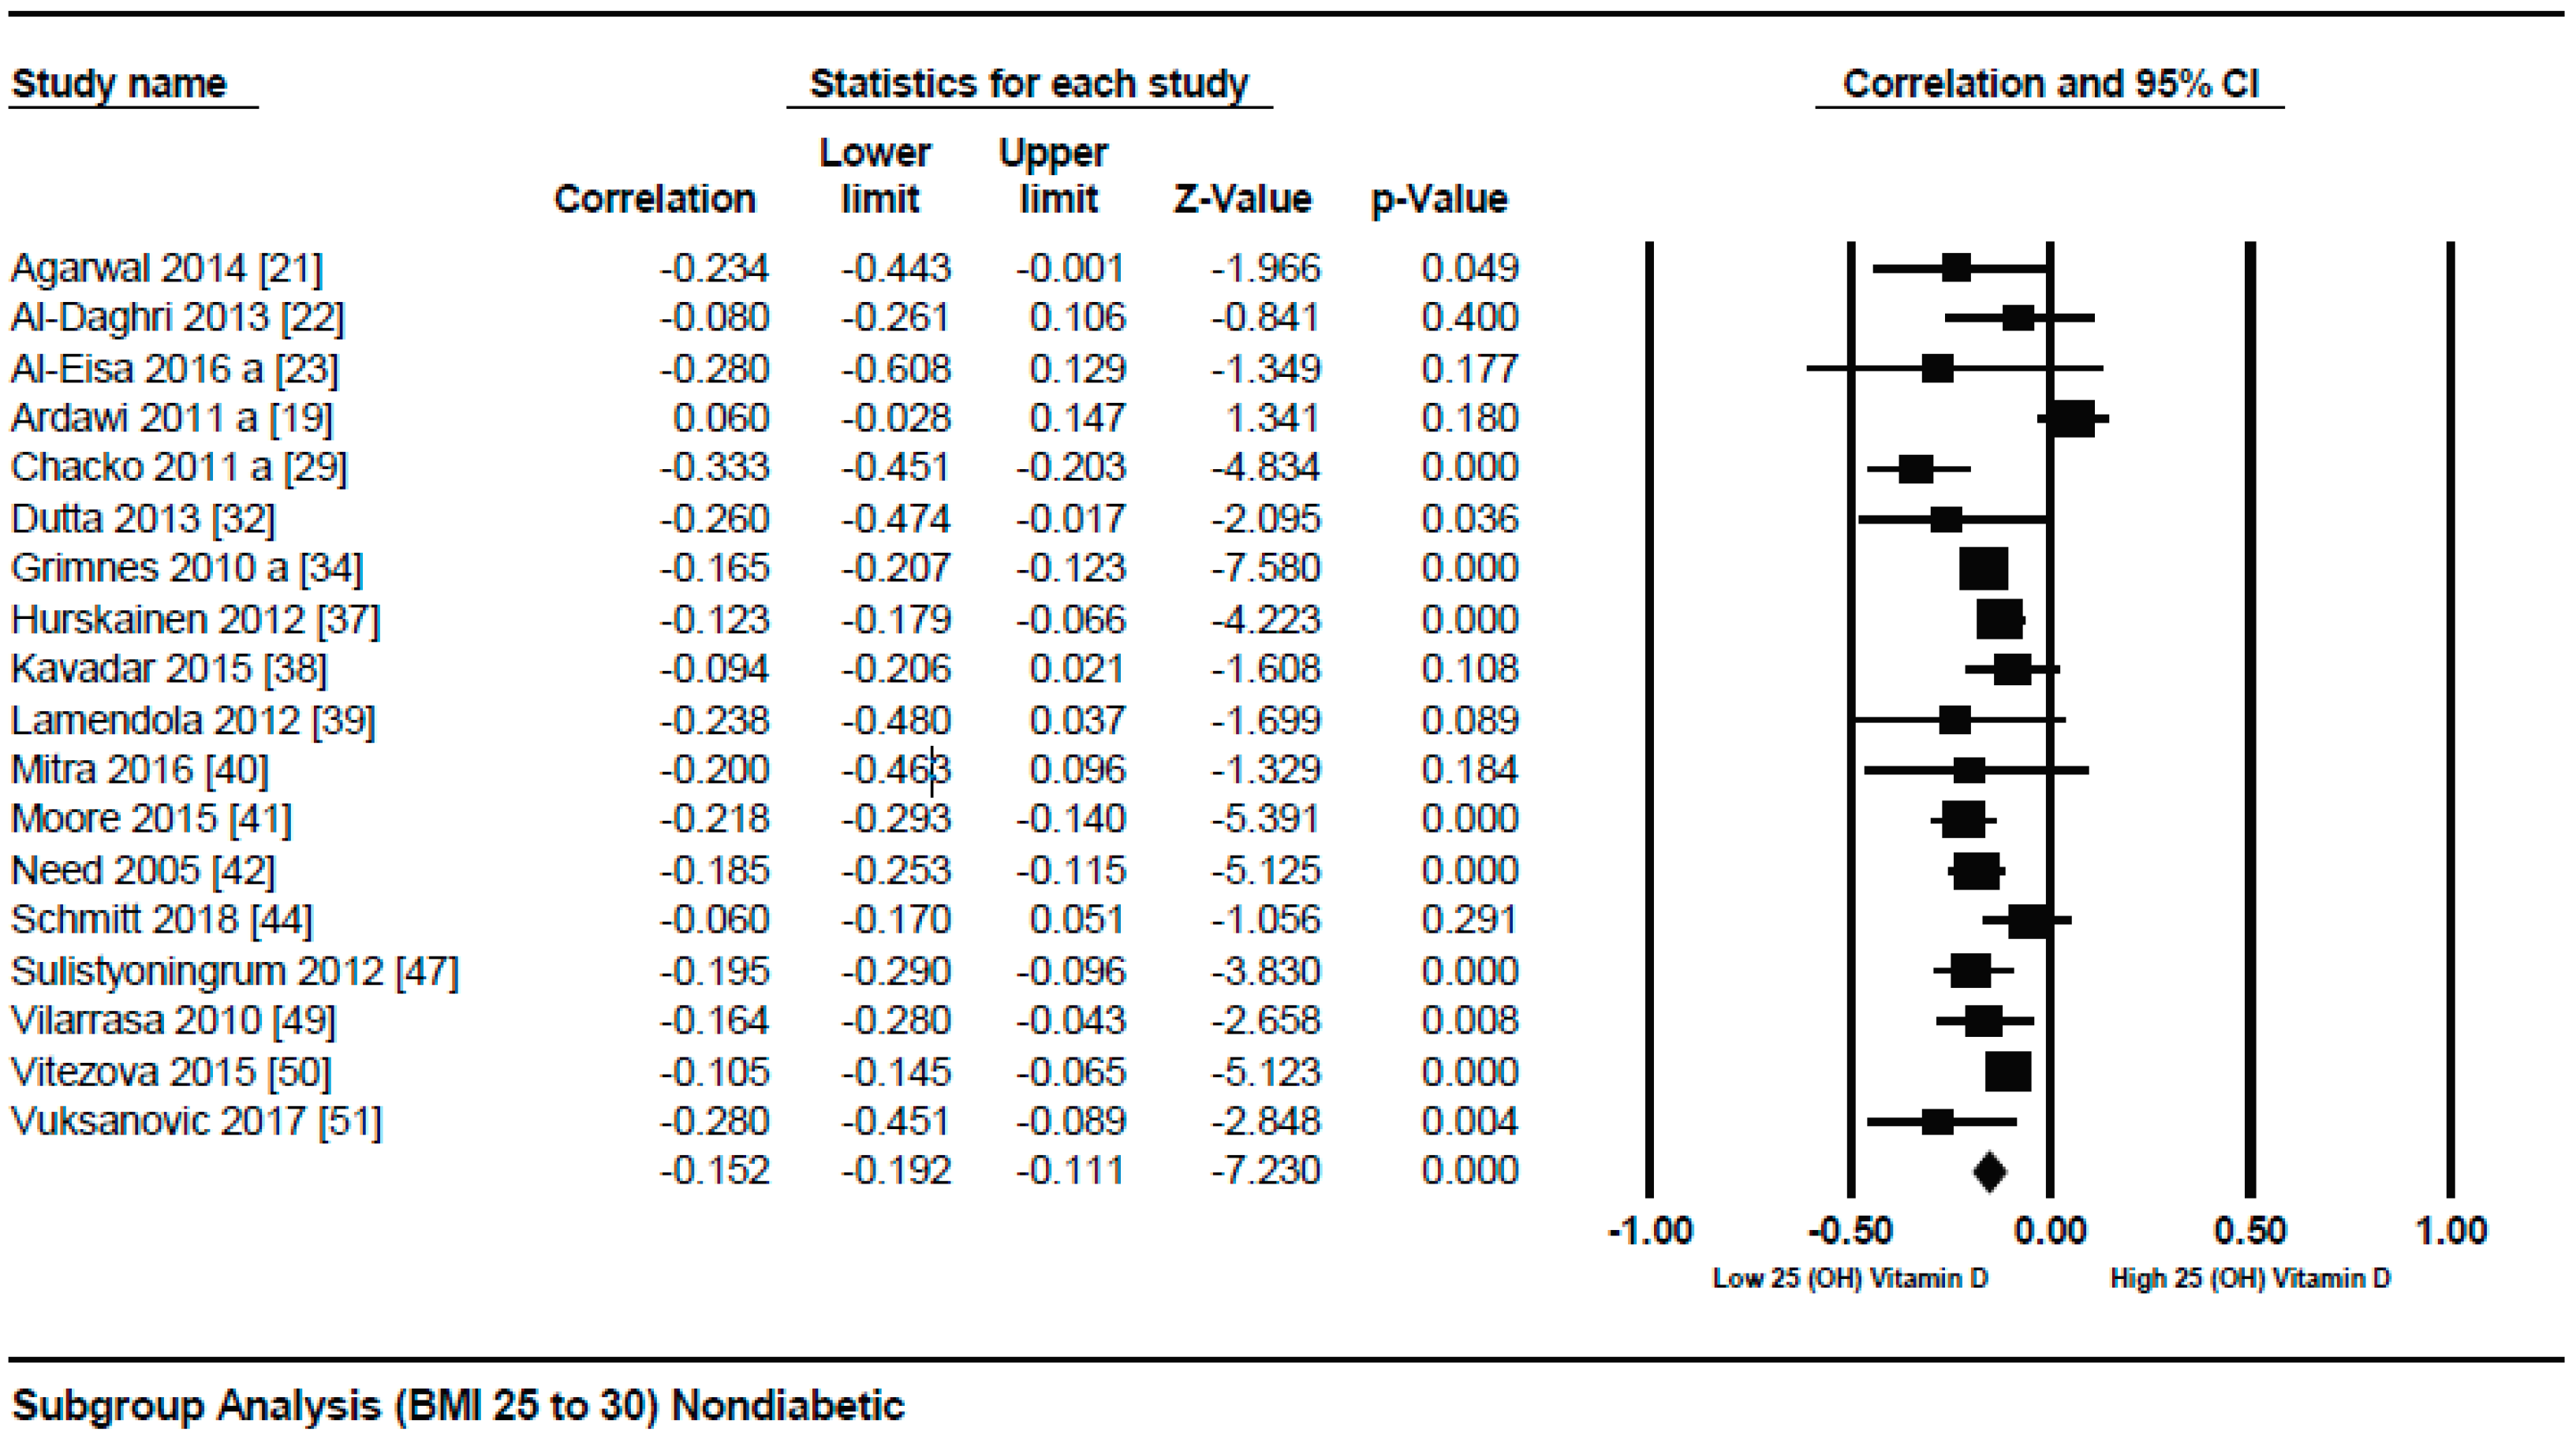
A subgroup analysis according to the different quartiles of BMI showed a gradual strong correlation from the lowest to highest quartile. The correlation (r = −0.114, 95% = −0.172 to −0.056, p = 0.000) (Figure 3) was more attenuative in the lowest quartile of BMI (BMI = 18–25), however, it became stronger (r = −0.152, 95% = −0.192 to −0.111, p = 0.000) (Figure 4) in the second quartile of BMI (BMI = 25–30), and was strongest (r = −0.259, 95% = −0.421 to −0.081, p = 0.000) (Figure 5) in the third quartile of BMI (BMI ≥ 30).
3.1.2. Meta Regression Analysis
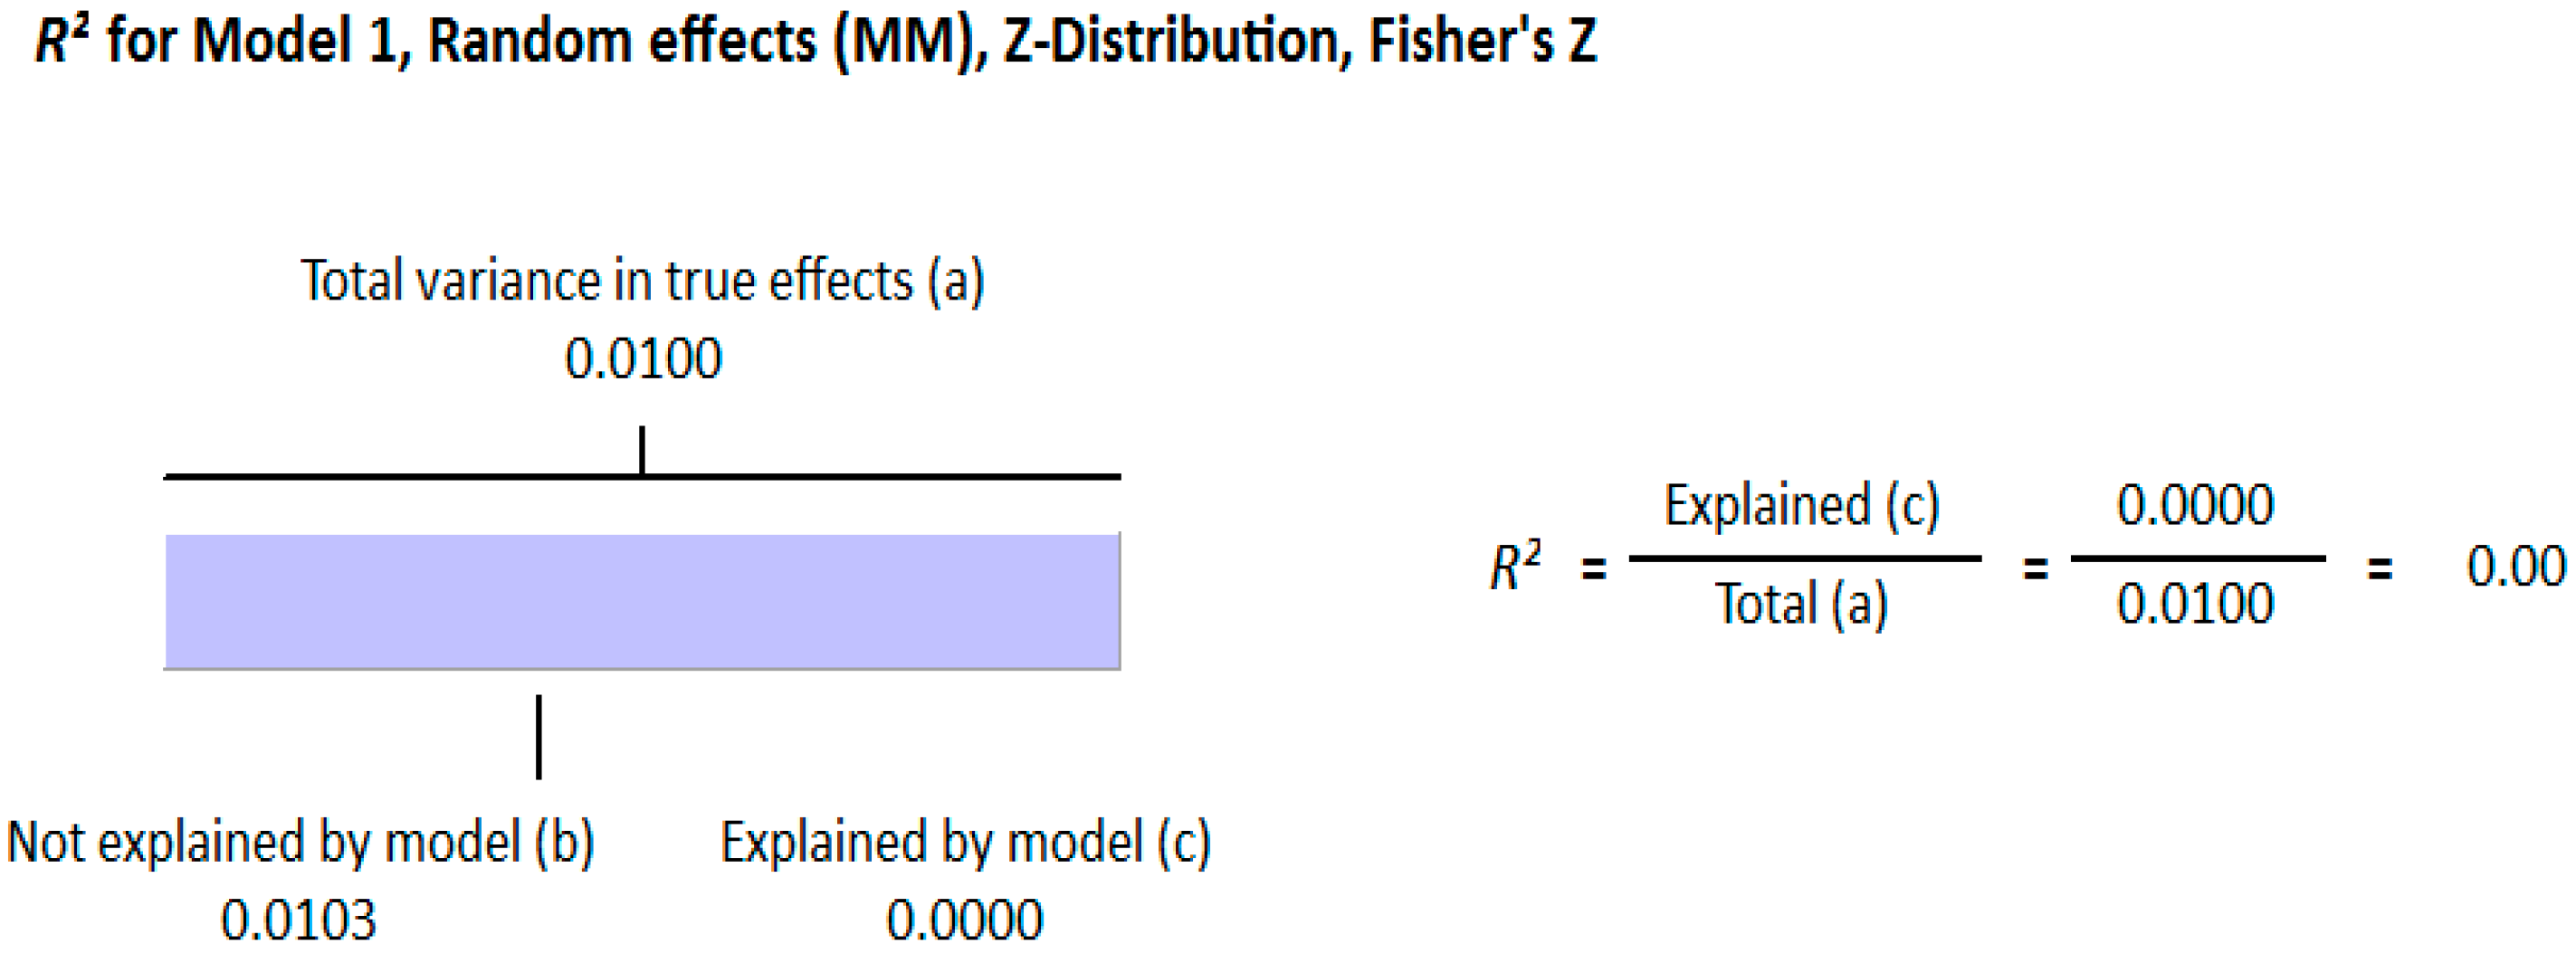
The meta-regression analysis of the effect of moderators on this correlation was also observed. The selected moderators were latitude, method of vitamin D determination, and different quartiles of BMI (18–25, 25–30, and >30). We did not find any effect of the moderator’s latitude (R2 = 0.000%, p = 0.000) (Figure 6) and method of vitamin D determination (R2 = 0.000%, p = 0.000) (Figure 7) on the relationship between vitamin D status and BMI (Figure 6 and Figure 7). However, 4% of heterogeneity between the relationship was due to the moderator “different quartiles of BMI” (R2 = 0.04%, p = 0.000) (Figure 8). The GRADE assessment for this meta-analysis is shown in Figure 9 and Figure 10.
Meta-Analysis of the Association of Vitamin D and BMI in Diabetics
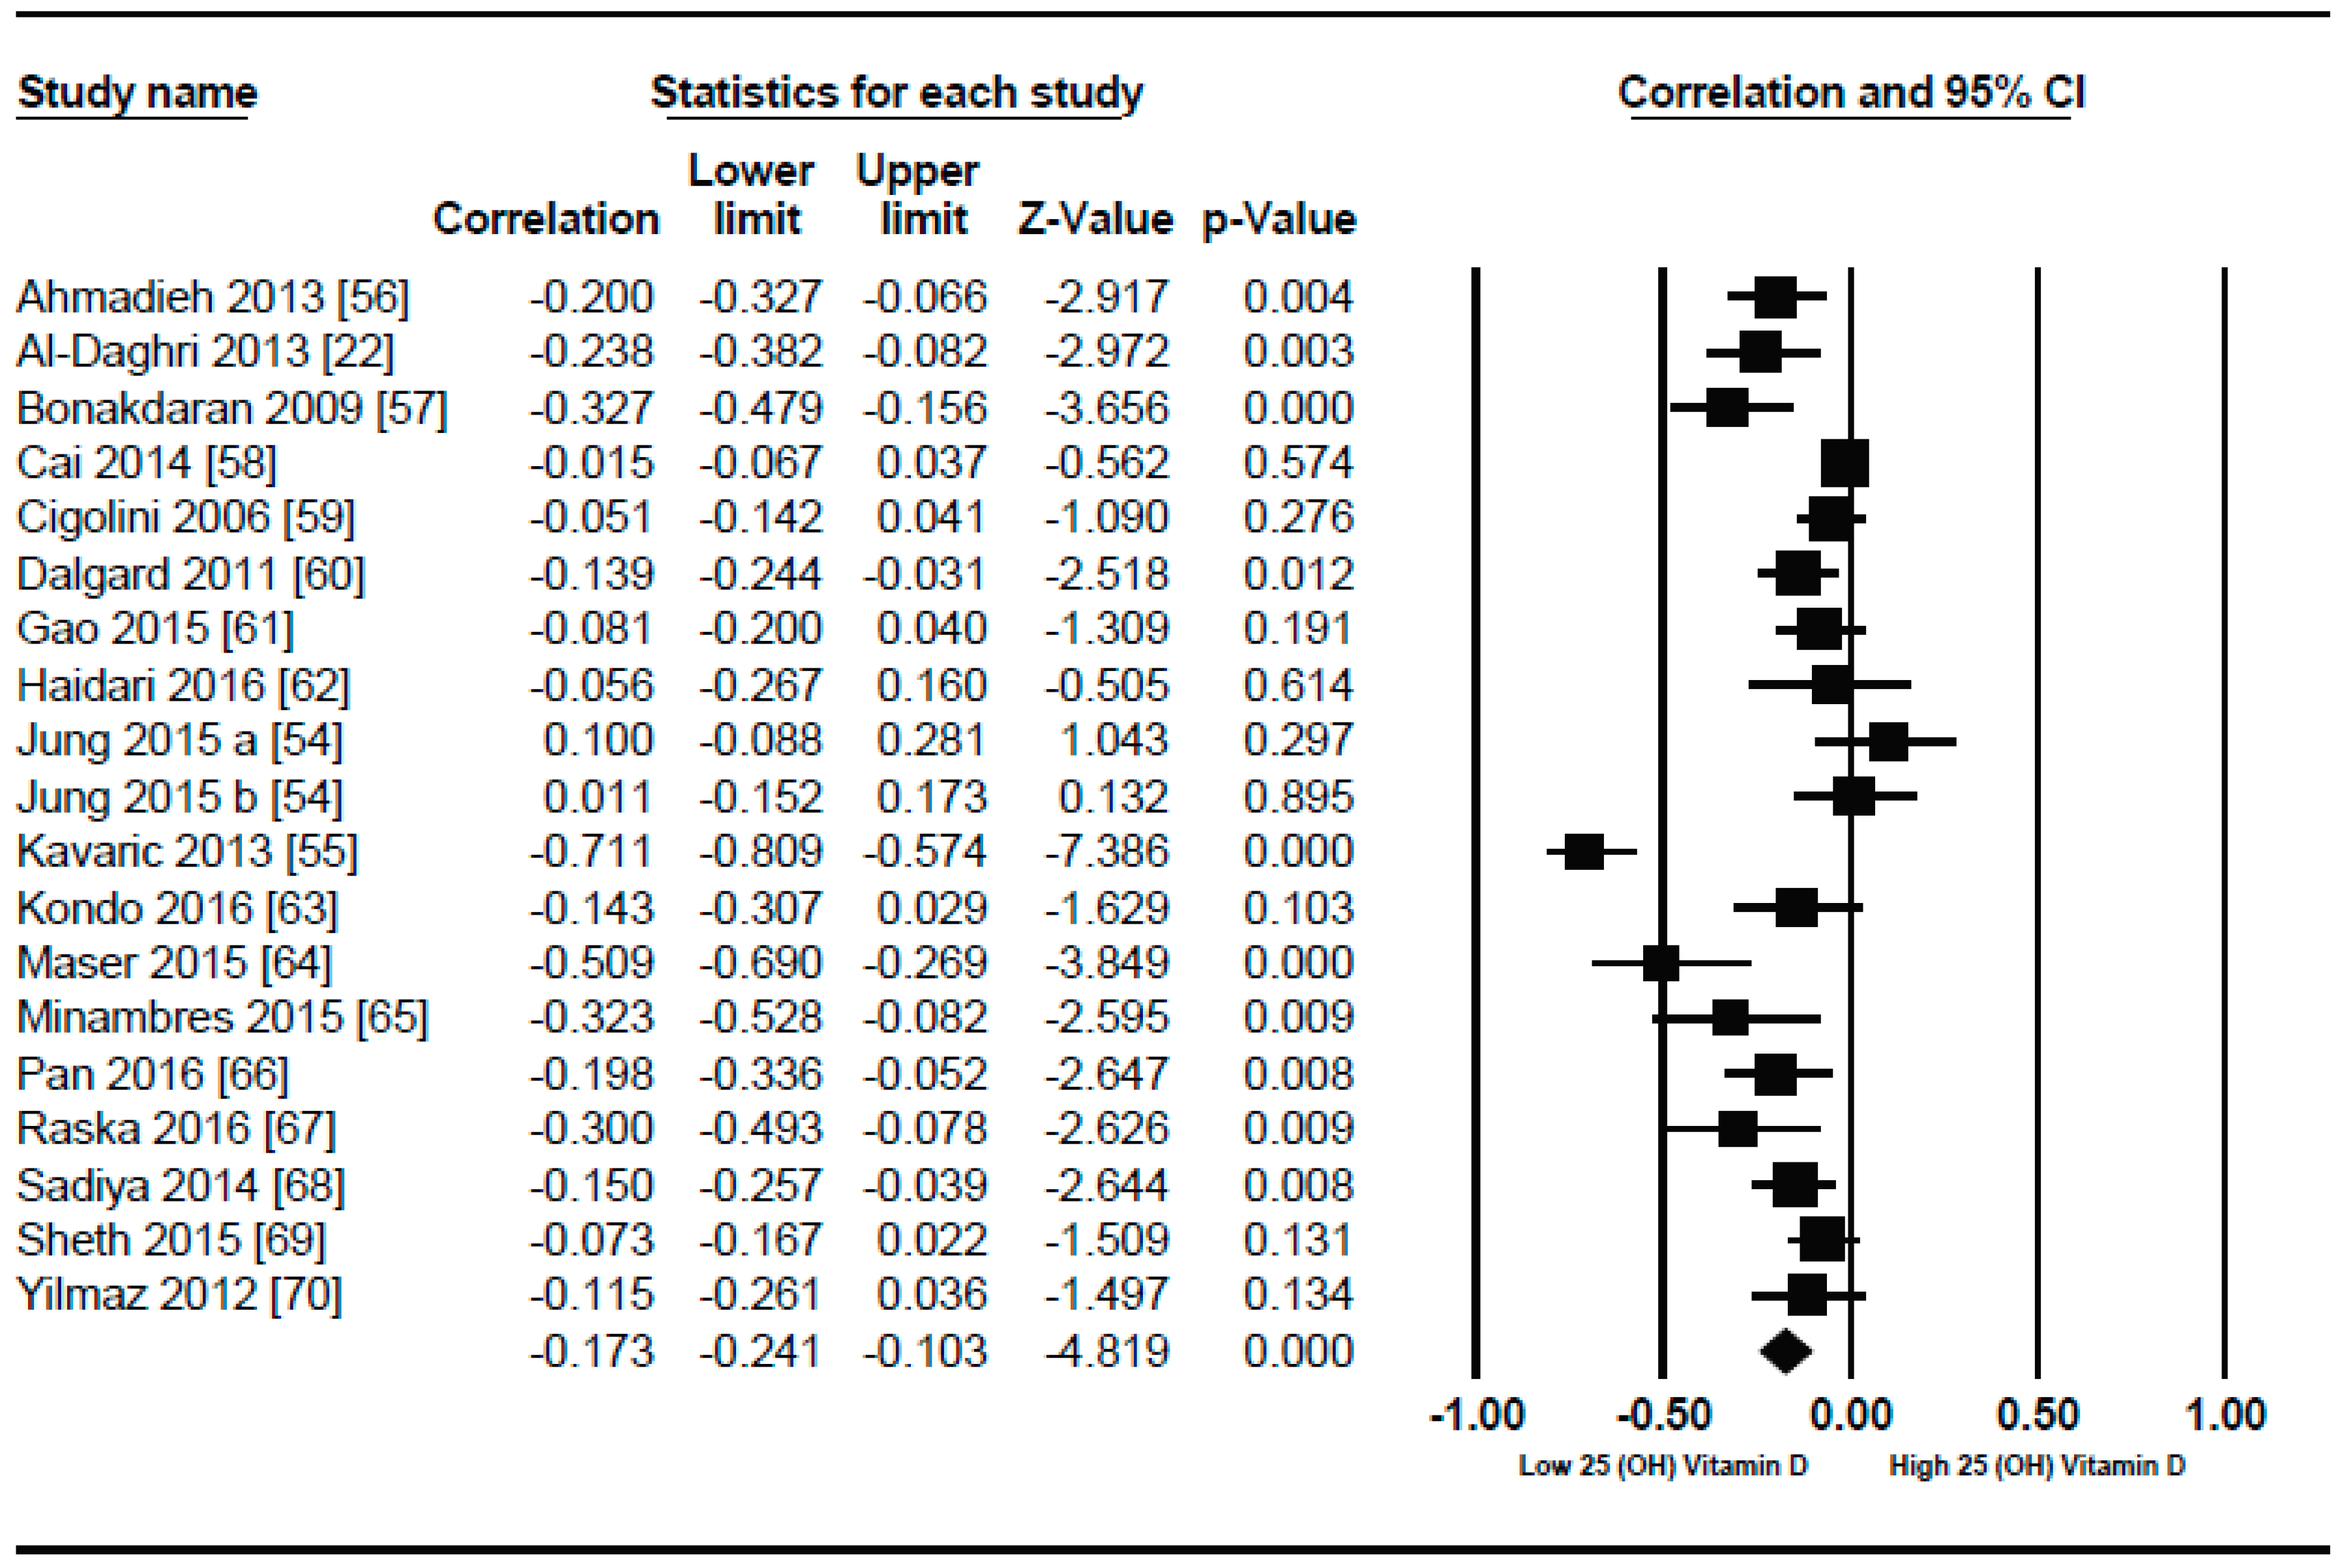
Nineteen studies were selected in this meta-analysis. In similar non-diabetic subject studies, the vitamin D status also had an inverse correlation (r = −0.173, 95% = −0.241 to −0.103, p = 0.000) (Figure 11) with BMI in diabetic subjects, showing a more pronounced relationship comparably. Some unusual relationships from this meta-analysis included a positive correlation between serum vitamin D levels and BMI.
In both genders from Korea [54] and a study from Serbia [55] showed strong inverse correlation (r = −0.711). As described by τ2 (τ2 = 0.01), the between study variability was low. In diabetic patients, the p = 0.000) (Figure 12) with serum vitamin D levels when compared to the lower BMI quartile (BMI ≤ 30) (r = −0.083, 95% = −0.138 to −0.028, p = 0.000) (Figure 13) when a subgroup-analysis was performed.
Meta Regression Analysis
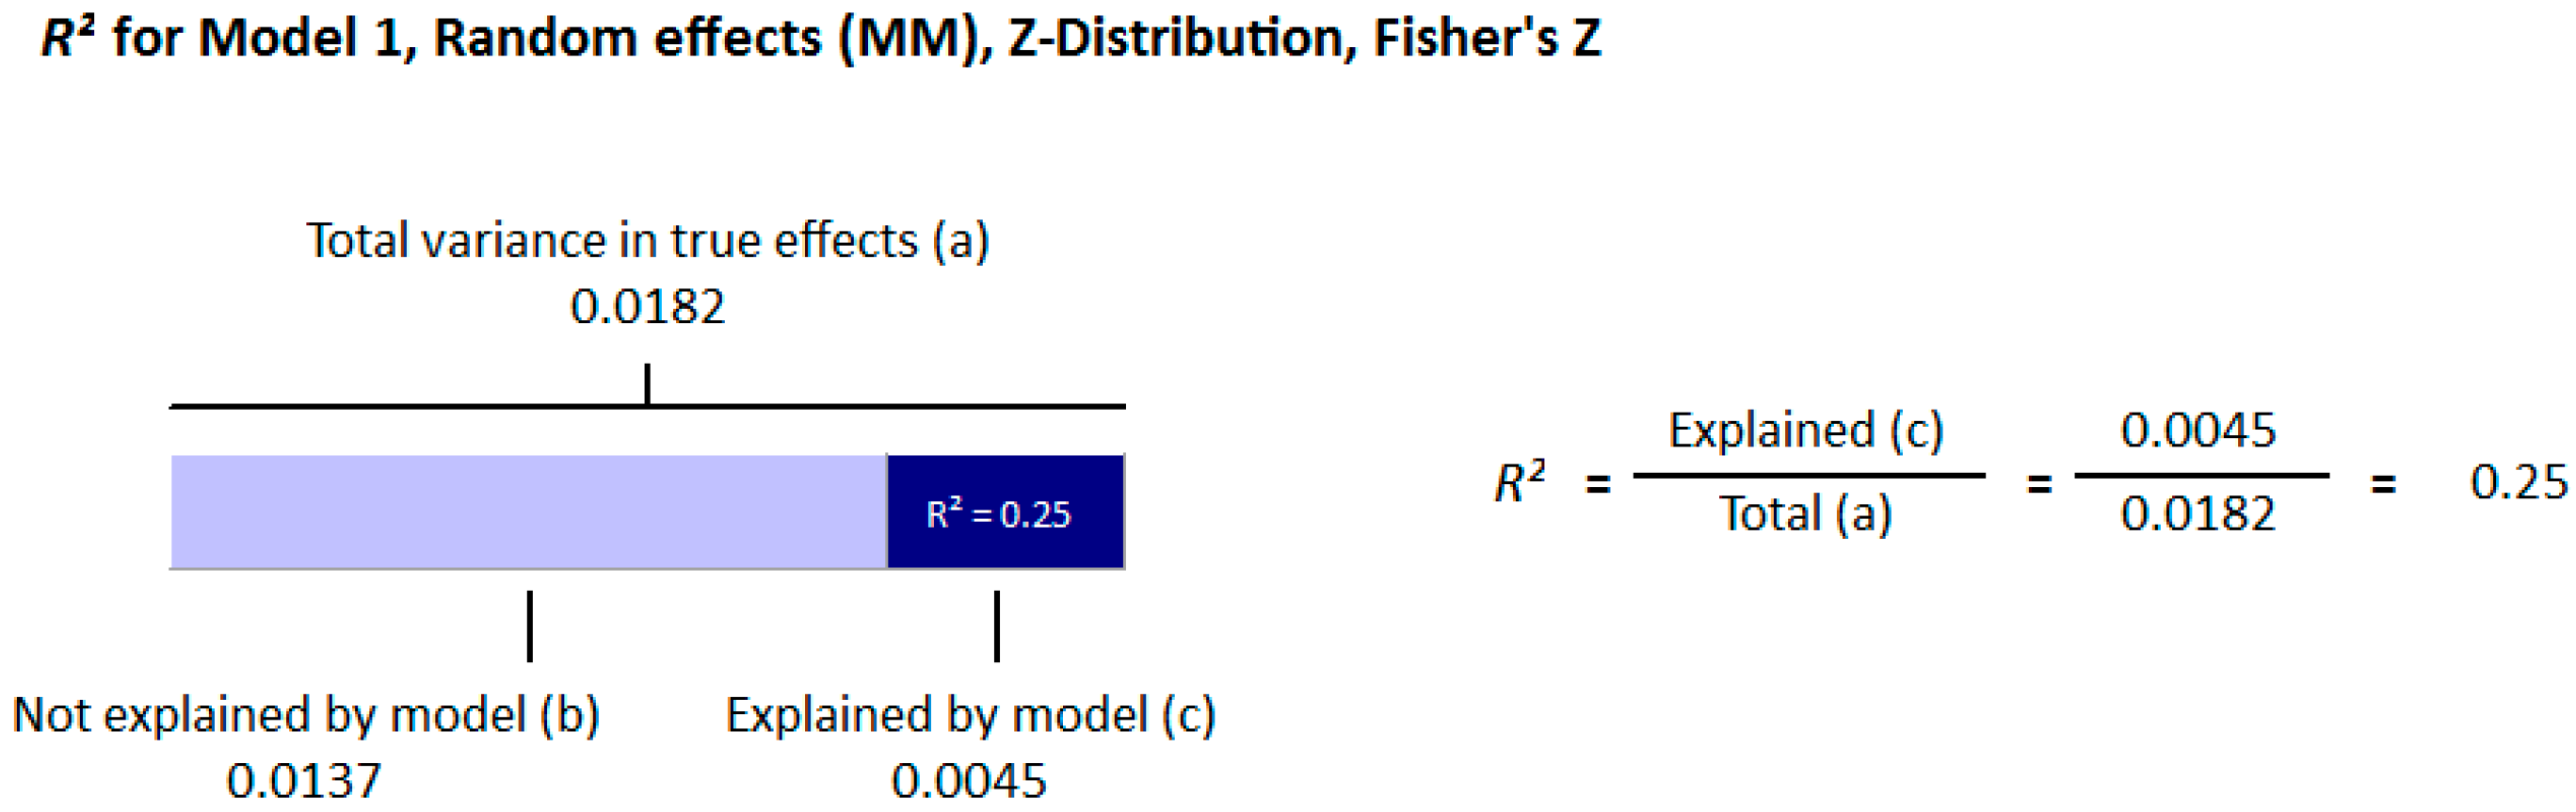
The moderators selected for the meta-regression analysis were latitude, method of vitamin D determination and various categories of BMI. The R2 Graphics showed that 25% of heterogeneity was because of the different quartiles of BMI (R2 = 0.25, p = 0.00) (Figure 14), however latitude (R2 = 0.000%, p = 0.000) (Figure 15) and method of vitamin D determination (R2 = 0.000%, p = 0.000) (Figure 16) did not have an effect on the correlation of serum vitamin D levels and BMI. The GRADE assessment is shown in the Figure 17 and Figure 18 for this meta-analysis.
3.2. Excluded Studies
Sixteen studies [71,72,73,74,75,76,77,78,79,80,81,82,83,84,85,86] were excluded as the data were not harmonious to calculate the effect size in the form of correlation. Five studies [87,88,89,90,91] were disqualified because of their study design, which was not well-suited with the study in progress. Twelve studies [92,93,94,95,96,97,98,99,100,101,102,103] were omitted since they considered a mixed population (Diabetic and non-diabetic) for the determination of effect size.
4. Discussion
This review provides evidence that serum vitamin D status has an inverse relationship with BMI in diabetic and non-diabetic subjects. An overall weak correlation was seen in the non-diabetic subject population (r = −0.152, 95% = −0.187 to −0.116, p = 0.000) (Figure 2) when compared to the diabetic ones (r = −0.173, 95% = −0.241 to −0.103, p = 0.000) (Figure 11). When we performed the subgroup analysis according to different quartiles of BMI in non-diabetic subject studies, a gradual increase in the strength of correlation was seen with increasing BMI quartiles. However, an abrupt rise in the correlation was seen in the higher quartile of BMI when compared to the lower one in the diabetic subject studies.
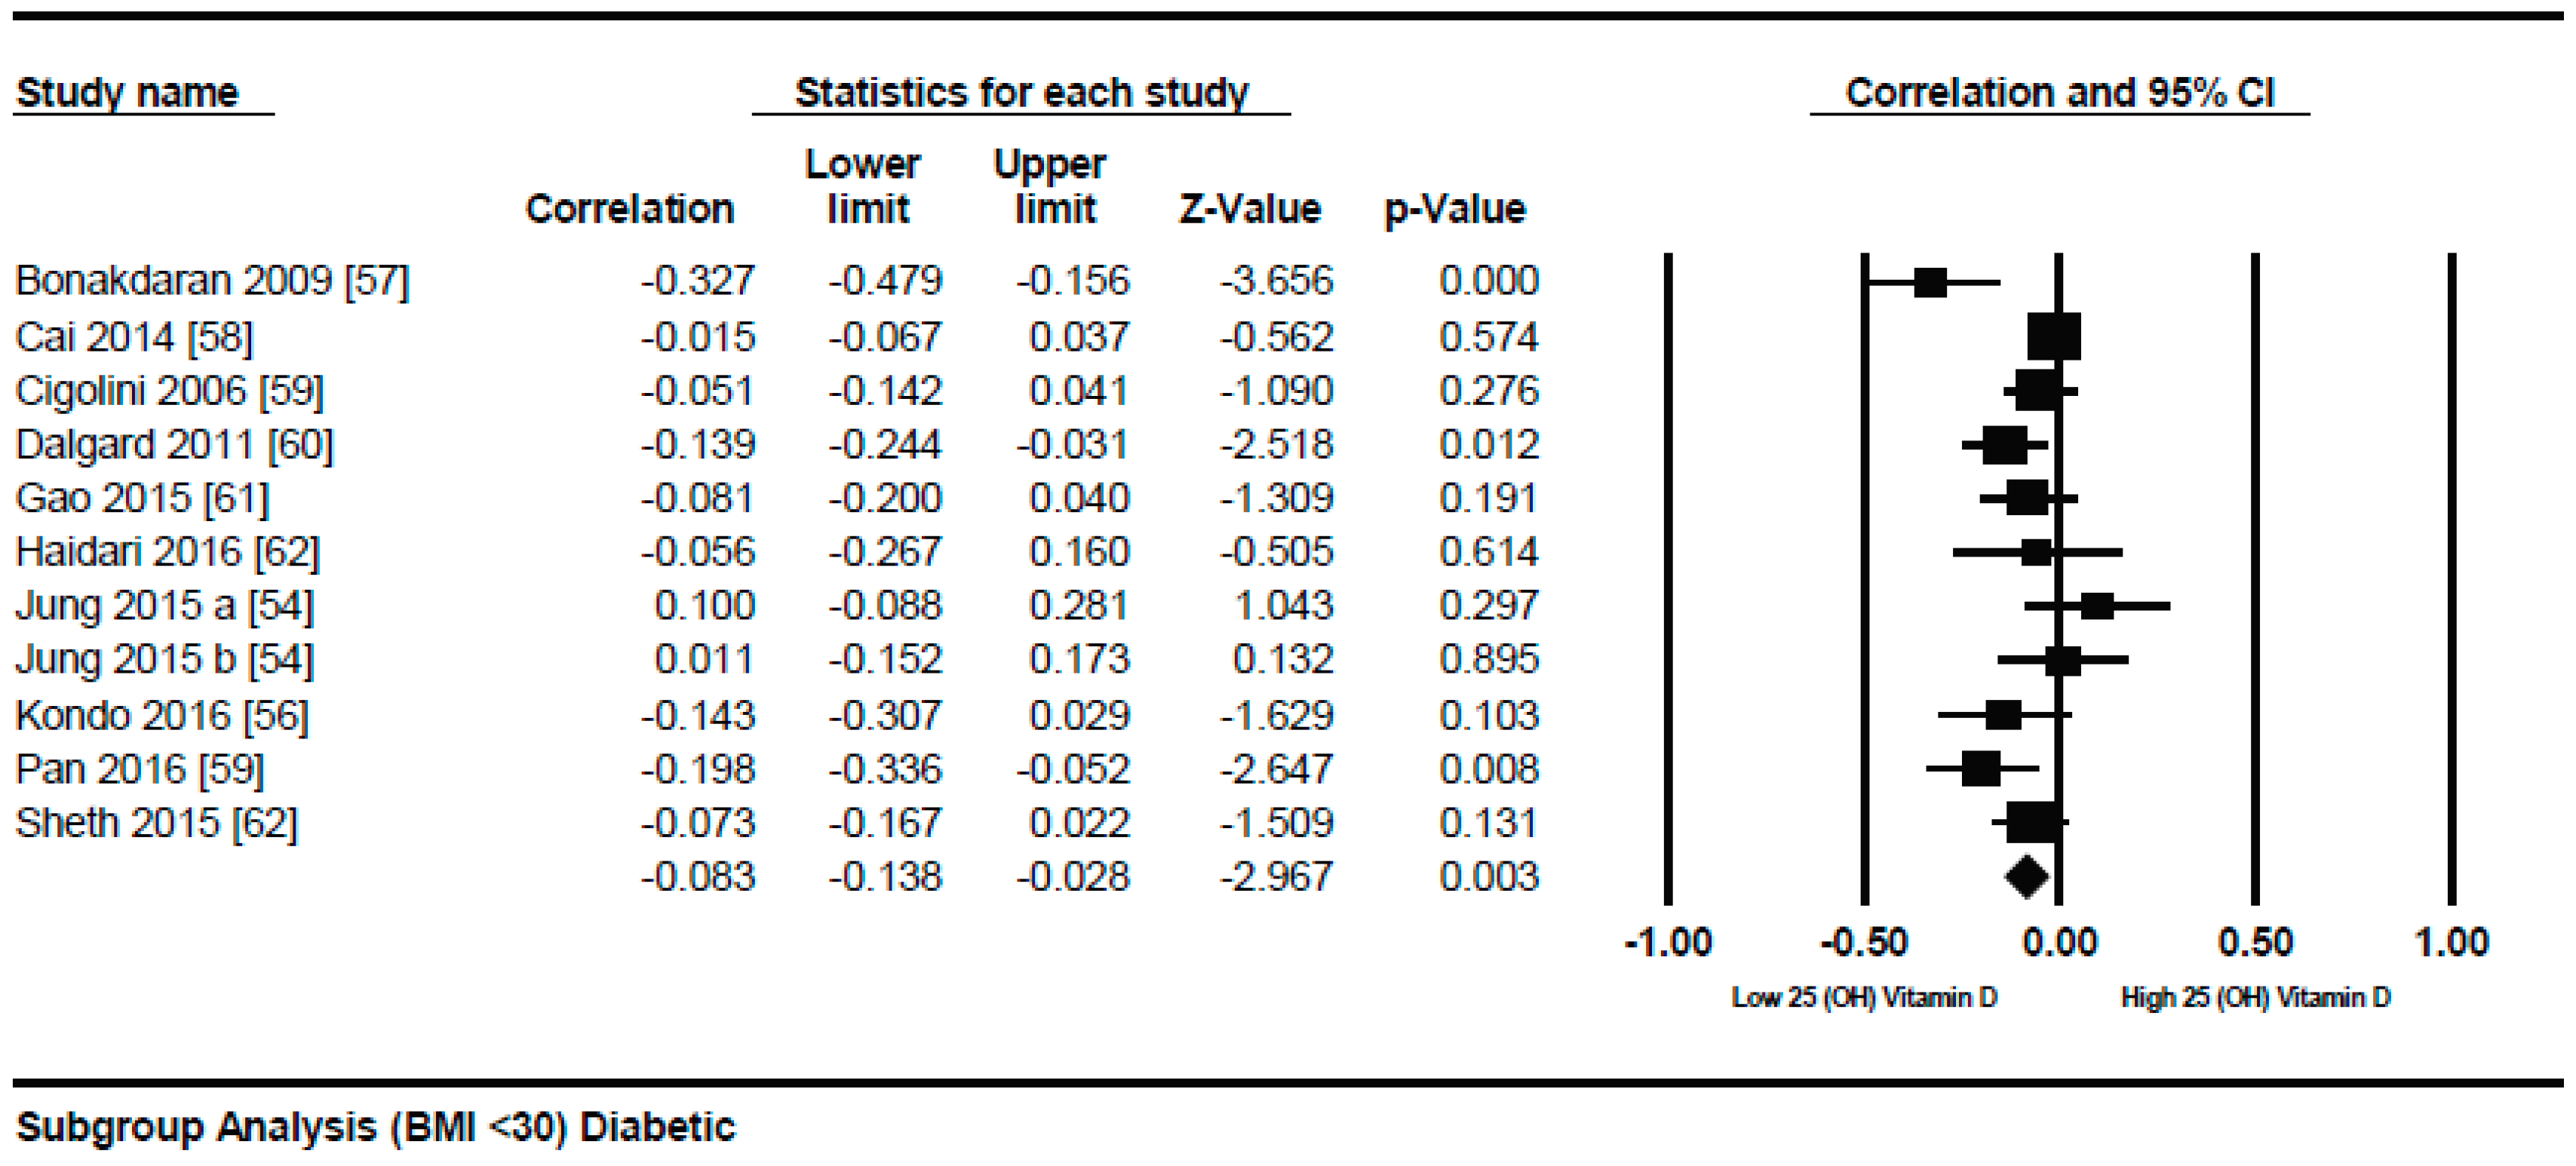
In the lower quartile of BMI for the diabetic patient studies, a weak correlation (r = −0.083, 95% = −0.138 to −0.028, p = 0.000) (Figure 12) was seen, nearly one fourth of the higher BMI quartile of the diabetic subject studies (r = −0.319, 95% = −0.477 to −0.178, p = 0.000) (Figure 13).
The strong inverse correlation between vitamin D deficiency and BMI might be due to the relationship of hypovitaminosis D and obesity to a number of diseases [104]. The coexistence of these two factors may have relevance to the development of some disease conditions, for example, type 2 diabetes is strongly related with obesity and vitamin D deficiency [1,15]. It has been observed previously that the synergistic effect of obesity and vitamin D deficiency can develop insulin resistance [1]. A study on animals also supports the hypothesis that vitamin D receptors and vitamin D can have a role in type 2 diabetes and obesity [105], and vitamin D receptors induced by 1, 25-(OH) vitamin D are more expressed in the adipose tissues in the obese when compared to lean subjects. The body mass index relates independently with hypovitaminosis D, and a decrease of 1.3 nM/L of vitamin D can add 1 kg/m2 of BMI [106].
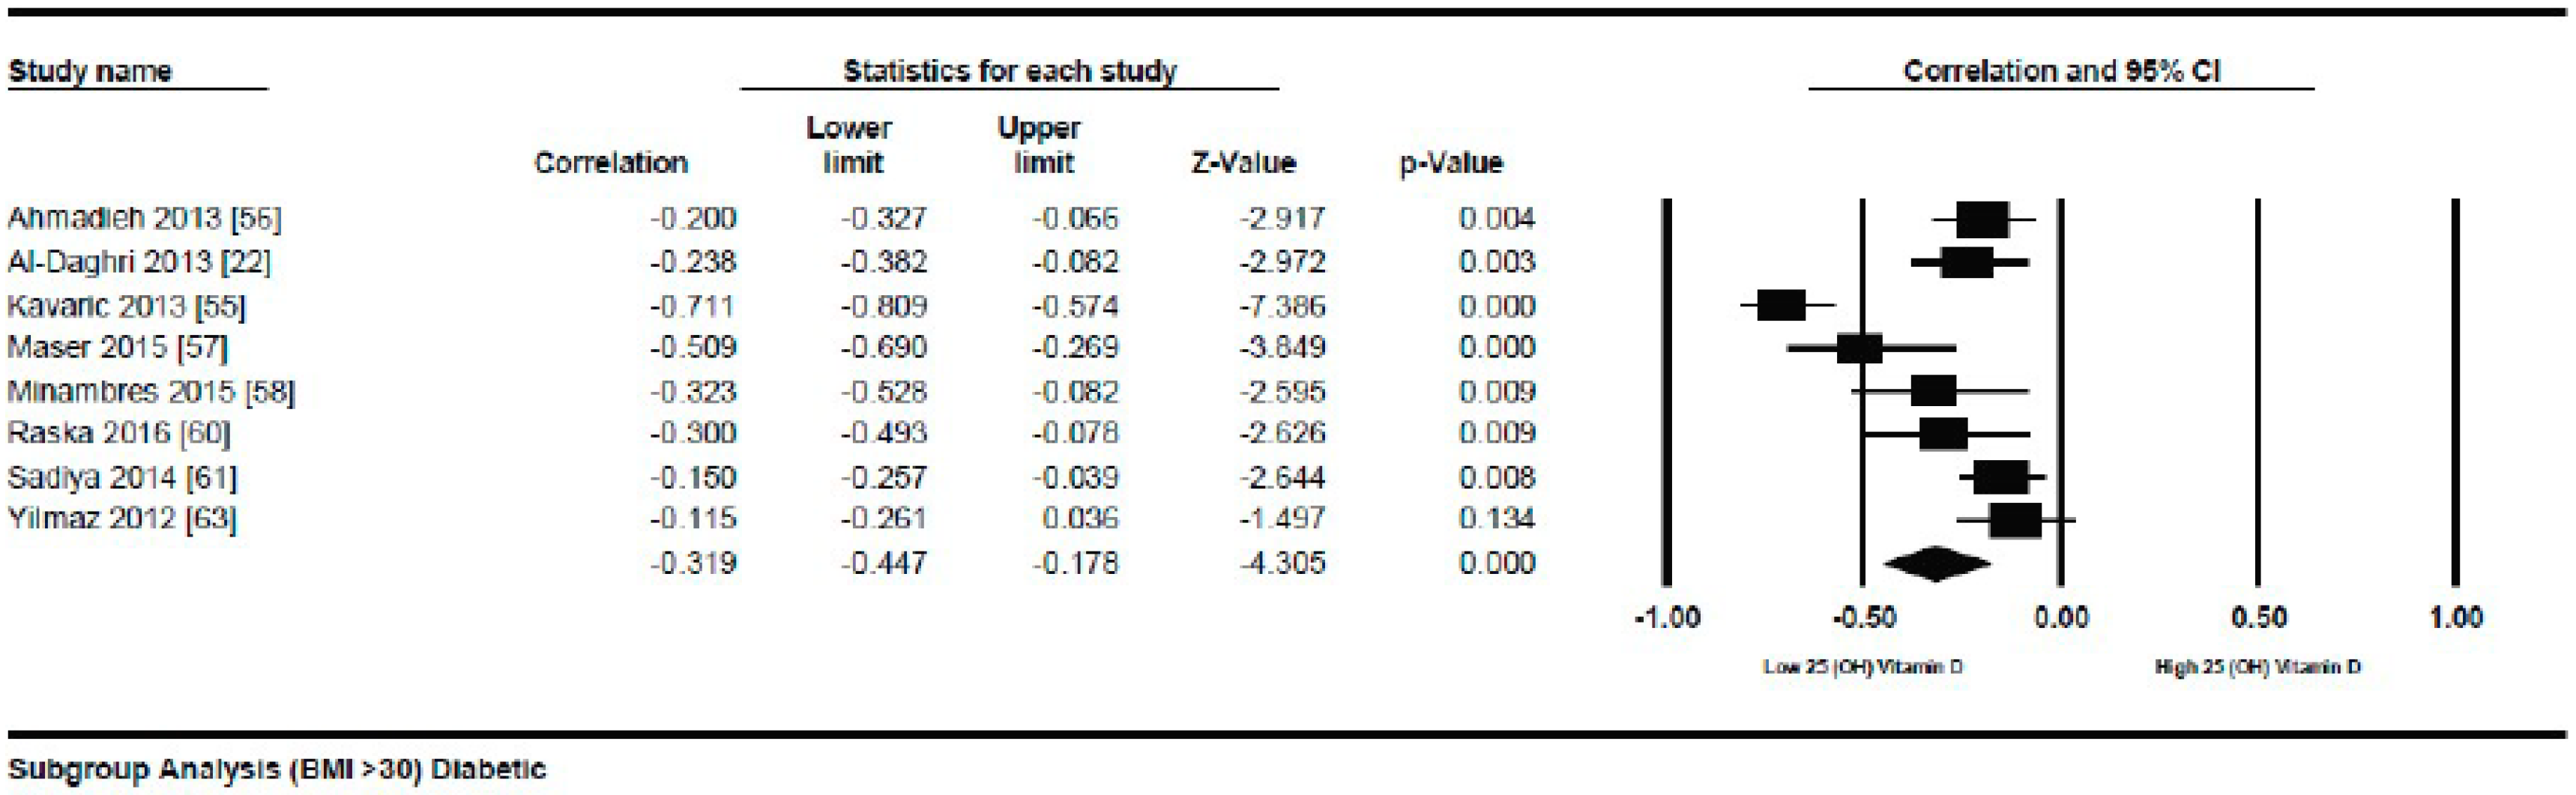
The strong correlation (r = −0.319, 95% = −0.477 to −0.178, p = 0.000) (Figure 13) in the current study between BMI and serum vitamin D status in the higher BMI quartile is an indication that hypovitaminosis D could be the reason behind obesity and type 2 diabetes. However, the weak correlation (r = −0.083, 95% = −0.138 to −0.028, p = 0.000) (Figure 12) in the lower BMI quartile of type 2 diabetes patients indicated the existence of type 2 diabetes due to reasons other than hypovitaminosis D. The meta-regression studies in the current project also confirmed these results as we found that 25% (R2 = 0.25, p = 0.00) (Figure 14) of the variability in the correlation was due to BMI in diabetic subject studies and that 4% (R2 = 0.04%, p = 0.000) (Figure 6) of the variability in the correlation was because of BMI in the non-diabetic subject studies.
There was a parallel increase in vitamin D deficiency and BMI over time. Exposure to sunlight is a huge natural source of vitamin D. The UV-B radiations from sunlight are responsible for the synthesis of vitamin D in the body. With industrialization, these radiations have been reduced in many ways, e.g., they are absorbed and scattered by the concrete ground and buildings [107], the gases produced by vehicles and industry like NO2, SO2, and O3 from ozone are absorbed in the UV-B region of the spectrum, while carbon pollution also affects the irradiance of UV-B [108]. The new trends of the consumption of low fat milk instead of whole milk may also be a culprit in the critical reduction in vitamin D status. The biologically active metabolite of vitamin D is 1, 25-(OH) vitamin D, which is produced by the hydroxylation of 25-(OH) vitamin D. This biologically active form of vitamin D has the ability to interact with vitamin D receptors.
Although latitude can explain the spread of hypovitaminosis D geographically, as most of the vitamin D needed is prepared photosynthetically, many geographical trends can overrule these effects. The diet of the population, their clothing style, their occupation, means of leisure and travel, time of sun exposure, urbanization, and skin pigmentation can have an impact on the photo production of vitamin D, therefore people may have vitamin D deficiency even at very low latitudes [109,110]. Populations even from sunny climates are deficient in vitamin D, thus, living in sunny areas does not assure protection against vitamin D deficiency. There existed a general inverse relationship between vitamin D deficiency and obesity in both studies on diabetic and non-diabetic subjects in the current meta-analysis, except for some studies on the female population from the KSA (Kingdom of Saudi Arabia), showed positive relationships in non-diabetic subject studies [18,19]. The female population in the KSA is usually entirely covered with black gowns; we assumed that after years of being covered, the female population in KSA might adapted some mechanisms that compensate for the adverse effect of vitamin D deficiency against obesity. This was in line with our previous observations where people of African origin with darker skin shades showed an unusually positive relationship between serum vitamin D levels and plasma glucose status [15]. These observations strengthen the idea of the development of a recovery mechanism after stress is imposed.
The relationship of adiposity and hypovitaminosis D is debatable. The inverse relationship could be due to the restoration of vitamin D in the adipose tissues, being a fat soluble vitamin, or it may be due to the reason that vitamin D may regulate the adipose tissue so that it can contribute to more fat mass and obesity related complications [111]. Some scientists have suggested that there may be a dilution effect due to the large body volumes for reduced circulating vitamin D [112]. Others have found an association with season and a three month exposure to sunlight before sampling was found to have strong correlation. The existence of a dilution factor typically explains the presence of low vitamin D levels in obese individuals. It is therefore suggested that individuals with a BMI higher than 30 should take vitamin D more frequently and at higher doses [113]. There may be a possibility that the skin of the obese person is not able to prepare vitamin D properly, like the skin of older individuals. The inverse correlation between vitamin D and circulating lipids has also been seen in children and adolescents, however, the extent of this correlation depends on the exposure to UV radiation [114].
These studies have shown that vitamin D may regulate the immune cell derived and adipose tissue related inflammations.
A recent study carried out on 9649 adults reported that the inverse correlation between CRP’s (C-reactive proteins) and serum vitamin D status may relate to obesity related complications. The reason behind this relationship is still unknown, however, the supplementation of 25-(OH) vitamin D can alleviate obesity related metabolic complications and inflammations [115,116,117,118]. Further studies are required to find out the mechanism underlying vitamin D related obesity and its complications.
The non-alcoholic fatty liver disease related factors such as diabetes are associated with vitamin D deficiency, therefore, it is considered that vitamin D may have a role in the development of steatosis [119]. Numerous signals and pathways are responsible for energy homeostasis and consequently, body weight. These circulating signals may include insulin and pancreatic polypeptides from the pancreas and may include leptin and resistin from adipose tissue. Vitamin D could be the part of the central control mechanism that regulates the body mass index through homeostatic pathways [13,120]. The expression of many genes related to vitamin D metabolism is also involved in the alteration of body mass index (BMI). BMI related genome wide association studies have identified more than two hundred and fifty variants [121].
One of the strengths of our study was that we used a systematic search strategy for the collection of observational studies. The quality of the studies was determined by using the “Grading of Recommendations Assessment, Development, and Evaluation (GRADE)”. The 95% confidence intervals were not too wide in both the diabetic and non-diabetic subject studies, which relates to the clinical importance of vitamin D to BMI. Although the number of participants in the observational studies was high, there are chances of residual confounding, which is the limitation of this study. The confounding could be due to differences in the population like different age groups. Subjects with different age groups have different exposure times to the sun and different rates of vitamin D synthesis due to differences in the capacity of the skin to synthesize vitamin D. In contrast to randomized control trials (RCTs), the observational studies had the disadvantage of not being randomized and blinded, which can lead to heterogeneity. Furthermore, we did not obtain the exact information related to the exposure to sunlight and vitamin D intake which can confound the results. The evidence was considered to be of moderate quality depending on all the strengths and weaknesses of the study.
5. Conclusions
The current meta-analysis demonstrated an inverse relationship between vitamin D status and BMI in both the diabetic and non-diabetic subjects, however, this association was more pronounced in the diabetic patients. The correlation was directly related to the BMI quartiles and the highest BMI quartile had the strongest correlations in both the diabetic and non-diabetic populations. In the subgroup analysis of the diabetic subject studies, an abrupt increase in the correlation in the higher quartile showed the positive relationship of hypovitaminosis D, obesity, and type 2 diabetes. The meta regression analysis also confirmed this positive relationship (R2 = 0.25, p = 0.00) (Figure 14).
Author Contributions
S.R. designed the research, undertook the data collection, performed the statistical analysis, and wrote the manuscript. P.B.J. read the manuscript, took part in the discussions about the statistical parts, and the text. Both authors revised and approved the manuscript.
Funding
This research received no external funding.
Acknowledgments
We are thankful to Naila Rafiq, Govt. college Women University Faisalabad, Pakistan, for providing support in the statistical and mathematical inter-conversions of the raw data.
Conflicts of Interest
The authors declare no conflict of interest.
References
- Kabadi, S.M.; Liu, L.; Auchincloss, A.H.; Zakeri, I.F. Multivariate path analysis of serum 25-hydroxyvitamin D concentration, inflammation, and risk of type 2 diabetes mellitus. Dis. Mark. 2013, 35, 187–193. [Google Scholar] [CrossRef] [PubMed]
- Hebebrand, J.; Hinney, A. Environmental and genetic risk factors in obesity. Child Adolesc. Psychiatr. Clin. N. Am. 2009, 18, 83–94. [Google Scholar] [CrossRef] [PubMed]
- Parker, J.; Hashmi, O.; Dutton, D.; Mavrodaris, A.; Stranges, S.; Kandala, S.B.; Clarke, A.; Franco, O.H. Levels of vitamin D and cardiometabolic disorders: Systematic review and meta-analysis. Maturitas 2010, 65, 225–236. [Google Scholar] [CrossRef] [PubMed]
- Braun, A.B.; Gibbons, F.K.; Litonjua, A.A.; Giovannucci, E.; Christopher, K.B. Low serum 25-hydroxyvitamin D at critical care initiation is associated with increased mortality. Crit. Care Med. 2012, 40, 63–72. [Google Scholar] [CrossRef] [PubMed]
- Roomi, M.A.; Farooq, A.; Ullah, E.; Lone, K.P. Hypovitaminosis D and its association with life style factors. Pak. J. Med. Sci. 2015, 31, 1236–1240. [Google Scholar] [CrossRef] [PubMed]
- Cashman, K.D.; Dowling, K.G.; Skrabakova, Z.; Gross, M.G.; Valtuena, J.; Henauw, S.D.; Moreno, L.; Daamsgaard, C.T.; Michaelsen, K.F.; Molgaard, C.; et al. Vitamin D Deficiency in Europe: Pandemic? Am. J. Clin. Nutr. 2016, 103, 1033–1044. [Google Scholar] [CrossRef] [PubMed]
- Ford, E.S.; Ajani, U.A.; McGuire, L.C.; Liu, S. Concentrations of serum vitamin D and metabolic syndrome among US adults. Diabetes Care 2005, 28, 1228–1230. [Google Scholar] [CrossRef] [PubMed]
- Chiu, K.C.; Chu, A.; Go, V.L.; Saad, M.F. Hypovitaminosis D is associated with insulin resistance and beta cell dysfunction. Am. J. Clin. Nutr. 2004, 79, 820–825. [Google Scholar] [CrossRef] [PubMed]
- Lim, L.L.; Ng, Y.M.; Kang, P.S.; Lim, S.K. Association between serum 25-hydroxyvitamin D and glycated hemoglobin levels in type 2 diabetes patients with chronic kidney disease. J. Diabetes Investig. 2017, 9, 375–382. [Google Scholar] [CrossRef] [PubMed] [Green Version]
- Chen, K.; DeLuca, H.F. Cloning of the human 1α, 25dihydroxyvitamin D-3 24-hydroxylase gene promoter and identification of two vitamin D-responsive elements. Biochim. Biophys. Acta 1995, 1263, 1–9. [Google Scholar] [CrossRef]
- Clark, S.A.; Stumpf, W.E.; Sar, M.; DeLuca, H.F.; Tanaka, Y. Target cells for 1,25 dihydroxyvitamin D3 in the pancreas. Cell Tissue Res. 1980, 209, 515–520. [Google Scholar]
- Simpson, R.U.; Thomas, G.A.; Arnold, A.J. Identification of 1,25-dihydroxyvitamin D3 receptors and activities in muscle. J. Biol. Chem. 1985, 260, 8882–8891. [Google Scholar] [PubMed]
- Nimitphong, H.; Holick, M.F.; Fried, S.K.; Lee, M.J. 25-Hydroxyvitamin D3 and 1,25-dihydroxyvitamin D3 promote the differentiation of human subcutaneous preadipocytes. PLoS ONE 2012, 7, e52171. [Google Scholar] [CrossRef] [PubMed]
- Blum, M.; Dolnikowski, G.; Seyoum, E.; Harris, S.S.; Booth, S.L.; Peterson, J.; Saltzman, E.; Dawson-Hughes, B. Vitamin D (3) in fat tissue. Endocrine 2008, 33, 90–94. [Google Scholar] [CrossRef] [PubMed]
- Rafiq, S.; Jeppesen, P.B. Is hypovitaminosis d related to incidence of type 2 diabetes and high fasting glucose level in healthy subjects: A systematic review and meta-analysis of observational studies. Nutrients 2018, 10, 59. [Google Scholar] [CrossRef] [PubMed]
- Wamberg, L.; Christiansen, T.; Paulsen, S.K.; Fisker, S.; Rask, P.; Rejnmark, L.; Richelsen, B.; Pedersen, S.B. Expression of vitamin D metabolizing enzymes in human adipose tissue: The effect of obesity and diet induced weight loss. Int. J. Obes. 2013, 37, 651–657. [Google Scholar] [CrossRef] [PubMed]
- Stokic, E.; Kupusinac, A.; Dragana, T.; Branka, K.Z.; Milena, M.; Dragana, S.; Soskic, S.; Isenovic, E. Obesity and vitamin D deficiency: Trends to promote a more proatherogenic cardiometabolic risk profile. Angiology 2015, 66, 237–243. [Google Scholar] [CrossRef] [PubMed]
- Al-Elq, A.H.; Sadat-Ali, M.; Al-Turki, H.A.; Al-Mulhim, F.A.; Al-Ali, A.K. Is there a relationship between body mass index and serum vitamin D levels? Saudi Med. J. 2009, 30, 1542–1546. [Google Scholar] [PubMed]
- Ardawi, M.S.M.; Qari, M.H.; Rouzi, A.A.; Maimani, A.A.; Raddadi, R.M. Vitamin D status in relation to obesity, bone mineral density, bone turnover markers and vitamin D receptor genotypes in healthy Saudi pre- and postmenopausal women. Osteoporos. Int. 2011, 22, 463–475. [Google Scholar] [CrossRef] [PubMed]
- Lim, S.; Kim, M.J.; Choi, S.H.; Shin, C.S.; Park, K.S.; Jang, H.C.; Billings, L.K.; Meigs, J.B. Association of vitamin D deficiency with incidence of type 2 diabetes in high-risk Asian subjects. Am. J. Clin. Nutr. 2013, 97, 524–530. [Google Scholar] [CrossRef] [PubMed] [Green Version]
- Agarwal, N.; Mithal, A.; Kaur, P.; Dhingra, V.; Godbole, M.M.; Shukla, M. Vitamin D and insulin resistance in postmenopausal Indian women. Indian. J. Endocr. Metab. 2014, 18, 89–93. [Google Scholar] [CrossRef] [PubMed]
- Al-Daghri, N.M.; Al-Attas, O.S.; Alokail, M.S.; Alkharfy, K.M.; Al-Othman, A.; Draz, H.M.; Yakout, S.M.; Al-Saleh, Y.; Al-Yousef, M.; Sabico, S.; et al. Hypovitaminosis D associations with adverse metabolic parameters are accentuated in patients with Type 2 diabetes mellitus: A body mass index-independent role of adiponectin? J. Endocrinol. Investig. 2013, 36, 1–6. [Google Scholar]
- Al-Eisa, E.S.; Alghadir, A.H.; Gabr, S.A. Correlation between vitamin D levels and muscle fatigue risk factors based on physical activity in healthy older adults. Clin. Interv. Aging 2016, 11, 513. [Google Scholar] [PubMed] [Green Version]
- Al-Sultan, A.I.; Amin, T.T.; Abou-Seif, M.A.; Al Naboli, M.R. Vitamin D, parathyroid hormone levels and insulin sensitivity among obese young adult Saudis. Eur. Rev. Med. Pharmacol. Sci. 2011, 15, 135–147. [Google Scholar] [PubMed]
- Arunabh, S.; Pollack, S.; Yeh, J.; Aloia, J.F. Body Fat Content and 25-Hydroxyvitamin D Levels in Healthy Women. J. Clin. Endocrinol. Metab. 2003, 88, 157–161. [Google Scholar] [CrossRef] [PubMed] [Green Version]
- Barchetta, I.; de Bernardinis, M.; Capoccia, D.; Baroni, M.G.; Fontana, M.; Fraioli, A.; Morini, S.; Leonetti, F.; Cavallo, G. Hypovitaminosis d is independently associated with metabolic syndrome in obese patients. PLoS ONE 2013, 8, e68689. [Google Scholar] [CrossRef] [PubMed]
- Bhatt, S.P.; Misra, A.; Sharma, M.; Guleria, R.; Pandey, R.M.; Luthra, K.; Vikram, N.K. Vitamin D insufficiency is associated with abdominal obesity in urban asian indians without diabetes in north india. Diabetes Technol. Ther. 2014, 16, 392–396. [Google Scholar] [CrossRef] [PubMed]
- Boonchaya-anant, P.; Holick, F.M.; Caroline, M. ApovianSerum 25-Hydroxyvitamin D Levels and Metabolic Health Status in Extremely Obese Individuals. Obesity 2014, 22, 2539–2543. [Google Scholar] [CrossRef] [PubMed]
- Chacko, S.A.; Song, Y.; Manson, J.E.; Horn, L.V.; Eaton, C.; Martin, L.W.; McTiernan, A.; Curb, J.D.; Wylie-Rosett, J.; Phillips, L.S.; et al. Serum 25-hydroxyvitamin D concentrations in relation to cardiometabolic risk factors and metabolic syndrome in postmenopausal women. Am. J. Clin. Nutr. 2011, 94, 209–217. [Google Scholar] [CrossRef] [PubMed] [Green Version]
- De Pergola, G.; Nitti, A.; Bartolomeo, N.; Gesuita, A.; Giagulli, V.A.; Triggiani, V.; Guastamacchia, E.; Silvestris, F. Possible role of hyperinsulinemia and insulin resistance in lower vitamin D levels in overweight and obese patients. Biomed. Res. Int. 2013, 2013, 921348. [Google Scholar] [CrossRef] [PubMed]
- Ding, L.; Wang, C.; Ma, H.; Tian, Y.; Lu, Y.; Pang, S. The Study of Serum Vitamin D and Insulin Resistance in Chinese Populations with Normal Glucose Tolerance. Int. J. Endocrinol. 2014, 2014, 870235. [Google Scholar] [CrossRef] [PubMed]
- Dutta, D.; Maisnam, I.; Shrivastava, A.; Sinha, A.; Ghosh, S.; Mukhopadhyay, P.; Mukhopadhyay, S.; Chowdhury, S. Serum vitamin-D predicts insulin resistance in individuals with prediabetes. Indian J. Med. Res. 2013, 138, 853–860. [Google Scholar] [PubMed]
- Farrell, S.W.; Willis, B.L. Cardiorespiratory Fitness, Adiposity, and Serum 25-Dihydroxyvitamin D Levels in Women: The cooper center longitudinal study. J. Womens Health 2012, 21, 1. [Google Scholar] [CrossRef] [PubMed]
- Grimnes, G.; Emaus, N.; Joakimsen, R.M.; Figenschau, Y.; Jenssen, T.; Njølstad, I.; Schirmer, H.; Jorde, R. Baseline serum 25-hydroxyvitamin D concentrations in the Tromsø Study 1994–95 and risk of developing type 2 diabetes mellitus during 11 years of follow-up. Diabet. Med. 2010, 27, 1107–1115. [Google Scholar] [CrossRef] [PubMed]
- Hao, Y.; Ma, X.; Shen, Y.; Ni, J.; Luo, Y.; Xiao, Y.; Bao, Y.; Jia, W. Associations of Serum 25-Hydroxyvitamin D3 Levels with Visceral Adipose Tissue in Chinese Men with Normal Glucose Tolerance. PLoS ONE 2014, 9, e86773. [Google Scholar] [CrossRef] [PubMed]
- Huang, C.; Chang, H.; Lu, C.; Tseng, F.; Lee, L.; Huang, K. Vitamin D status and risk of metabolic syndrome among non-diabetic young adults. Clin. Nutr. 2015, 34, 484–489. [Google Scholar] [CrossRef] [PubMed]
- Hurskainen, A.R.; Virtanen, J.K.; Tuomainen, T.P.; Nurmi, T.; Voutilainen, S. Association of serum 25-hydroxyvitamin D with type 2 diabetes and markers of insulin resistance in a general older population in Finland. Diabetes Metab. Res. Rev. 2012, 28, 418–423. [Google Scholar] [CrossRef] [PubMed]
- Kavadar, G.; Demircioglu, D.T.; Ozgonenel, L.; Emre, T.Y. The relationship between vitamin D status, physical activity and insulin resistance in overweight and obese subjects. Bosn. J. Basic Med. Sci. 2015, 15, 62–66. [Google Scholar] [CrossRef] [PubMed]
- Lamendola, C.A.; Ariel, D.; Feldman, D.; Reaven, G.M. Relations between obesity, insulin resistance, and 25-hydroxyvitamin D. Am. J. Clin. Nutr. 2012, 95, 1055–1059. [Google Scholar] [CrossRef] [PubMed] [Green Version]
- Mitra, S.; Nayak, P.K.; Agrawal, S.; Sahoo, J.P.; Kamalanathan, S.K.; Nanda, R. Vitamin D Status and Cardio-Metabolic Risk in Indian Postmenopausal Women. J. Clin. Diagn. Res. 2016, 10, 17–20. [Google Scholar] [CrossRef] [PubMed]
- Moore, A.; Hochner, H.; Sitlani, C.M.; Williams, M.A.; Hoofnagle, A.N.; de Boer, I.H.; Kestenbaum, B.; Siscovic, D.S.; Friedlander, Y.; Enquobahrie, D.A. Plasma vitamin D is associated with fasting insulin and homeostatic model assessment of insulin resistance in young adult males, but not females, of the Jerusalem Perinatal Study. Public Health Nutr. 2015, 18, 1324–1331. [Google Scholar] [CrossRef] [PubMed]
- Need, A.G.; O’Loughlin, P.D.; Horowitz, M.; Nordin, B.E.C. Relationship between fasting serum glucose, age, body mass index and serum 25 hydroxyvitamin D in postmenopausal women. Clin. Endocrinol. 2005, 62, 738–741. [Google Scholar] [CrossRef] [PubMed]
- Park, H.Y.; Lim, Y.; Kim, J.H.; Bae, S.; Oh, S.; Hong, Y. Association of serum 25-hydroxyvitamin d levels with markers for metabolic syndrome in the elderly: A repeated measure analysis. J. Korean Med. Sci. 2012, 27, 653–660. [Google Scholar] [CrossRef] [PubMed]
- Schmitt, E.B.; Nahas-Neto, J.; Bueloni-Dias, F.; Poloni, P.F.; Orsatti, C.L.; Nahas, E.A.P. Vitamin D deficiency is associated with metabolic syndrome in postmenopausal women. Maturitas 2018, 107, 97–102. [Google Scholar] [CrossRef] [PubMed]
- Song, H.R.; Park, C.H. Low serum vitamin D level is associated with high risk of metabolic syndrome in post-menopausal women. J. Endocrinol. Investig. 2013, 36, 791–796. [Google Scholar] [CrossRef] [PubMed]
- Song, B.M.; Rhee, Y.; Kim, C.O.; Youm, Y.; Kim, K.M.; Lee, E.Y.; Lee, J.M.; Yoon, Y.M.; Kim, H.C. Urban-rural differences explain the association between serum 25-hydroxyvitamin D level and insulin resistance in Korea. Nutrients 2014, 6, 5806–5818. [Google Scholar] [CrossRef] [PubMed]
- Sulistyoningrum, D.C.; Green, T.J.; Lear, S.A.; Devlin, A.M. Ethnic-specific differences in vitamin d status is associated with adiposity. PLoS ONE 2012, 7, e43159. [Google Scholar] [CrossRef] [PubMed]
- Vilarrasa, N.; Maravall, J.; Estepa, A.; Sanchez, R.; Masdevall, C.; Navarro, M.A.; Alia, P.; Soler, J.; Gomez, J.M. Low 25-hydroxyvitamin D concentrations in obese women: Their clinical significance and relationship with anthropometric and body composition variables. J. Endocrinol. Investig. 2007, 30, 653–658. [Google Scholar] [CrossRef] [PubMed]
- Vilarrasa, N.; Vendrell, J.; Maravall, J.; Elio, I.; Solano, E.; Jose, P.S.; Garcia, I.; Virgili, N.; Soler, J.; Gomez, J.M. Is plasma 25(OH) D related to adipokines, inflammatory cytokines and insulin resistance in both a healthy and morbidly obese population? Endocrine 2010, 38, 235–242. [Google Scholar] [CrossRef] [PubMed]
- Vitezova, A.; Zillikens, M.C.; Herpt, T.T.W.V.; Sijbrands, E.J.G.; Hofman, A.; Uitterlinden, A.G.; Franco, O.H.; Jong, J.C.K. Vitamin D status and metabolic syndrome in the elderly: The Rotterdam Study. European J. Endocrinol. 2015, 172, 327–335. [Google Scholar] [CrossRef] [PubMed]
- Vuksanovic, M.; Mihajlovic, G.; Zivkovic, T.B.; Gavrilovic, A.; Arsenovic, B.; Svorcan, J.Z.; Petkovic, M.M.; Vujovic, S. Cross-talk between muscle and bone in postmenopausal women with hypovitaminosis D. Climacteric 2017, 20, 31–36. [Google Scholar] [CrossRef] [PubMed]
- Zargar, A.H.; Ahmad, S.; Masoodi, S.R.; Wani, A.I.; Bashir, M.I.; Laway, B.A.; Shah, Z.A. Vitamin D status in apparently healthy adults in Kashmir Valley of Indian subcontinent. Postgrad. Med. J. 2007, 83, 713–716. [Google Scholar] [CrossRef] [PubMed] [Green Version]
- Zhang, F.F.; Al Hooti, S.; Al Zenki, S.; Alomirah, H.; Jamil, K.M.; Rao, A.; Al Jahmah, N.; Saltzman, E.; Ausman, L.M. Vitamin D deficiency is associated with high prevalence of diabetes in Kuwaiti adults: Results from a national survey. BMC Public Health 2016, 16, 100. [Google Scholar] [CrossRef] [PubMed]
- Jung, C.; Kim, K.; Kim, B.; Kim, C.; Kang, S.K.; Mok, J. Relationship between vitamin D status and vascular complications in patients with type 2 diabetes mellitus. Nutr. Res. 2015, 36, 117–124. [Google Scholar] [CrossRef] [PubMed]
- Kavaric, S.; Vuksanovic, M.; Bozovic, D.; Jovanovic, M.; Jeremic, V.; Radojici, Z.; Peki, S.; Popovic, V. Body weight and waist circumference as predictors of vitamin D deficiency in patients with type 2 diabetes and cardiovascular disease. Vojnosanit. Pregl. 2013, 70, 163–169. [Google Scholar] [CrossRef] [PubMed] [Green Version]
- Ahmadieh, H.; Azar, S.T.; Lakkis, N.; Arabi, A. Hypovitaminosis d in patients with type 2 diabetes mellitus: A relation to disease control and complications. ISRN Endocrinol. 2013, 2013, 641098. [Google Scholar] [CrossRef] [PubMed]
- Bonakdaran, S.; Varasteh, A. Correlation between serum 25 (OH) vitamin D3 and laboratory risk markers of cardiovascular disease in type 2 diabetic patients. Saudi Med. J. 2009, 30, 509–514. [Google Scholar] [PubMed]
- Cai, X.; Hu, Z.; Chen, L.; Han, X.; Ji, L. Analysis of the associations between Vitamin D and albuminuria or beta-Cell function in Chinese type 2 Diabetes. Biomed. Res. Int. 2014, 2014, 640909. [Google Scholar] [CrossRef] [PubMed]
- Cigolini, M.; Iagulli, M.; Miconi, V.; Galiotto, M.; Lombardi, S.; Targher, G. Serum 25-hydroxyvitamin D3 concentrations and prevalence of cardiovascular disease among type 2 diabetic patients. Diabetes Care 2006, 29, 722–724. [Google Scholar] [CrossRef] [PubMed]
- Dalgard, C.; Petersen, M.S.; Weihe, P.; Grandjean, P. Vitamin D status in relation to glucose metabolism and type 2 diabetes in septuagenarians. Diabetes Care 2011, 34, 1284–1288. [Google Scholar] [CrossRef] [PubMed] [Green Version]
- Gao, Y.; Wu, X.; Fu, Q.; Li, Y.; Yang, T.; Tang, W. The relationship between serum 25-hydroxyvitamin D and insulin sensitivity and beta cell function in newly diagnosed Type 2 Diabetes. J. Diabetes Res. 2015, 2015. [Google Scholar] [CrossRef] [PubMed]
- Haidari, F.; Zakerkish, M.; Karandish, M.; Saki, A.; Pooraziz, S. Association between serum vitamin d level and glycemic and inflammatory markers in non-obese patients with type 2 Diabetes. Iran. J. Med. Sci. 2016, 41, 367–373. [Google Scholar]
- Kondo, M.; Toyoda, M.; Miyatake, H.; Tanaka, E.; Koizumi, M.; Komaba, H.; Kimura, M.; Umezono, T.; Fukagawa, M. The Prevalence of 25-hydroxyvitamin D Deficiency in Japanese patients with diabetic nephropathy. Intern. Med. 2016, 55, 2555–2562. [Google Scholar] [CrossRef] [PubMed]
- Maser, R.E.; Lenhard, M.J.; Pohlig, R.T. Vitamin D insufficiency is associated with reduced parasymthetic nerve function in type 2 diabetes. Endocr. Pract. 2015, 21, 174–181. [Google Scholar] [CrossRef] [PubMed]
- Minambres, I.; Sánchez-Quesada, J.L.; Vinagre, I.; Sánchez-Hernández, J.; Urgell, E.; de Leiva, A.; Pérez, A. Hypovitaminosis D in type 2 diabetes: Relation with features of the metabolic syndrome and glycemic control. Endocr. Res. 2015, 40, 160–165. [Google Scholar] [CrossRef] [PubMed]
- Pan, G.T.; Guo, J.F.; Mei, S.; Zhan, M.; Hu, Z.; Zhong, C.; Zeng, C.; Liu, X.; Ma, Q.; Li, B.; et al. Vitamin D deficiency in relation to risk of metabolic syndrome in middle aged and elderly patients with type 2 diabetes Mellitus. J. Nutr. Sci. Vitaminol. 2016, 62, 213–219. [Google Scholar] [CrossRef] [PubMed]
- Raskajr, I.; Raskova, M.; Zikan, V.; Skrha, J. High Prevalence of Hypovitaminosis D in postmenopausal women with type 2 diabetes mellitus. Prague Med. Rep. 2016, 117, 5–17. [Google Scholar] [CrossRef] [PubMed]
- Sadiya, A.; Ahmed, S.M.; Skaria, S.; Abusnana, S. Vitamin D status and its relationship with metabolic markers in persons with obesity and type 2 diabetes in the UAE: A cross-sectional study. J. Diabetes Res. 2014, 2014, 869307. [Google Scholar] [CrossRef] [PubMed]
- Sheth, J.J.; Shah, A.; Sheth, F.J.; Trivedi, S.; Lele, M.; Shah, N.; Thakor, P.; Vaidya, R. Does vitamin D play a significant role in type 2diabetes? BMC Endocr. Disord. 2015, 2015, 15. [Google Scholar]
- Yilmaz, H.; Kaya, M.; Sahin, M.; Delibasi, T. Is vitamin D status a predictor glycaemic regulation and cardiac complication in type 2 diabetes mellitus patients? Diabetes Metab. Syndr. Clin. Res. Rev. 2012, 6, 28–31. [Google Scholar] [CrossRef] [PubMed]
- Bischof, M.G.; Heinze, G.; Vierhapper, H. Vitamin D status and its relation to age and body mass index. Horm. Res. 2006, 66, 211–215. [Google Scholar] [CrossRef] [PubMed]
- Coney, P.; Demers, L.M.; Dodson, W.C.; Kunselman, A.R.; Ladson, G.; Legro, R.S. Determination of vitamin D in relation to body mass index and race in a defined population of black and white women. Int. J. Gynaecol. Obstet. 2012, 119, 21–25. [Google Scholar] [CrossRef] [PubMed] [Green Version]
- Xiao, X.; Wang, Y.; Hou, Y.; Han, F.; Ren, J.; Hu, Z. Vitamin D deficiency and related risk factors in patients with diabetic nephropathy. J. Int. Med. Res. 2016, 44, 673–684. [Google Scholar] [CrossRef] [PubMed] [Green Version]
- Didriksen, A.; Grimnes, G.; Hutchinson, K.M.; Svartberg, J.; Ragnar, M.; Joakimsen, R.; Rolf, J. The serum 25-hydroxyvitamin D response to vitamin D supplementation is related to genetic factors, BMI, and baseline levels. Eur. J. Endocrinol. 2013, 169, 559–567. [Google Scholar] [CrossRef] [PubMed] [Green Version]
- Guasch, A.; Bullo, M.; Rabassa, A.; Bonada, A.; Castillo, D.D.; Sabench, F.; Salas-Salvado, J. Plasma vitamin D and parathormone are associated with obesity and atherogenic dyslipidemia: A cross-sectional study. Cardiovasc. Diabetol. 2012, 11, 149. [Google Scholar] [CrossRef] [PubMed]
- Konradsen, S.; Ag, H.; Lindberg, F.; Hexeberg, S.; Jorde, R. Serum 1,25-dihydroxy vitamin D is inversely associated with body mass index. Eur. J. Nutr. 2008, 47, 87–91. [Google Scholar] [CrossRef] [PubMed]
- Lagunov, A.; Porojnicu, A.C.; Lindberg, F.; Hexeberg, S.; Moan, J. The dependency of vitamin D status on body mass index, gender, age and season. Anticancer Res. 2009, 29, 3713–3720. [Google Scholar] [CrossRef]
- LeBlanc, E.S.; Rizzo, J.H.; Pedula, K.L.; Ensrud, K.E.; Cauley, J.; Hochberg, M.; Hillier, T.A. Associations between 25-hydroxyvitamin D and weight gain in elderly women. J. Womens Health 2012, 21, 10. [Google Scholar] [CrossRef] [PubMed]
- Mai, X.; Chen, Y.; Camargo, C.A.; Langhammer, A. Cross-sectional and prospective cohort study of serum 25-hydroxyvitamin D level and obesity in adults. Am. J. Epidemiol. 2012, 175, 10. [Google Scholar] [CrossRef] [PubMed]
- Araghi, S.O.; Dijk, S.C.V.; Ham, A.C.; Brouwer-brolsma, E.M.; Enneman, A.W.; Sohl, E.; Swart, K.M.A.; Zwaluw, N.L.V.D.; Wijngaarden, J.P.V.; Dhonukshe-rutten, R.A.M.; et al. Bmi and body fat mass is inversely associated with vitamin d levels in older individuals. J. Nutr. Health Aging 2015, 19, 980–985. [Google Scholar] [CrossRef]
- Ou, H.; Karnchanasorn, R.; Leen, L.Z.; Chiu, K.C. 2011 interaction of BMI with vitamin D and insulin Sensitivity. Eur. J. Clin. Investig. 2011, 41, 1195–1201. [Google Scholar] [CrossRef] [PubMed]
- Palacios, C.; Cynthia, K.G.; Perez, M.; Joshipura, K. Determinants of vitamin D status among overweight and obese puerto rican adults. Ann. Nutr. Metab. 2012, 60, 35–43. [Google Scholar] [CrossRef] [PubMed]
- Peng, Y.; Li, L. Serum 25-hydroxyvitamin D level and diabetic nephropathy in patients with type 2 diabetes mellitus. Int. Urol. Nephrol. 2015, 47, 983–989. [Google Scholar] [CrossRef] [PubMed]
- Perez-Diaz, I.; Sebastian-Barajas, G.; Hernandez-Flores, Z.G.; Rivera-Moscoso, R.; Osorio-Landa, H.K.; Flores-Rebollar, A. The impact of vitamin D levels on glycemic control and bone mineral density in postmenopausal women with type 2 diabetes. J. Endocrinol. Investig. 2015, 38, 1365–1372. [Google Scholar] [CrossRef] [PubMed]
- Shinkov, A.; Borissova, A.M.; Dakovska, L.; Vlahov, J.; Kassabova, L.; Svinarov, D. Winter 25-hydroxyvitamin D levels in young urban adults are affected by smoking, body mass index and educational level. Eur. J. Clin. Nutr. 2015, 69, 355–360. [Google Scholar] [CrossRef] [PubMed]
- Wright, C.S.; Weinheimer-Haus, E.M.; Fleet, J.C.; Peacock, M.; Campbell, W.W. The apparent relation between plasma 25-hydroxyvitamin D and insulin resistance is largely attributable to central adiposity in overweight and obese adults. J. Nutr. 2015, 145, 2683–2689. [Google Scholar] [CrossRef] [PubMed]
- Godala, M.; Materek-Kusmierkiewicz, I.; Moczulski, D.; Rutkowski, M.; Szatko, F.; Gaszynska, E.; Tokarski, S.; Kowalski, J. Metabolic Syndrome Increases the Risk of Plasma Vitamin A, C, E and D Deficiency. Endocrinol. Metab. Syndr. 2016, 5, 5. [Google Scholar]
- Forouhi, N.G.; Luan, J.; Cooper, A.; Boucher, B.J.; Wareham, N.J. Baseline serum 25-hydroxy vitamin D is predictive of future glycemic status and insulin resistance. Diabetes 2008, 57, 2619–2625. [Google Scholar] [CrossRef] [PubMed]
- Han, S.S.; Kim, M.H.; Lee, S.M.; Lee, J.P.; Kim, S.; Joo, K.W.; Lim, C.S.; Kim, Y.S.; Kim, D.K. Association between body fat and vitamin D status in Korean adults. Asia Pac. J. Clin. Nutr. 2014, 23, 65–75. [Google Scholar] [PubMed]
- Looker, A.C. Body fat and vitamin D status in black versus white women. J. Clin. Endocrinol. Metab. 2005, 90, 635–640. [Google Scholar] [CrossRef] [PubMed]
- Mason, C.; Xiao, L.; Imayama, I.; Duggan, C.R.; Bain, C.; Foster-Schubert, K.E.; Kong, A.; Campbell, K.L.; Wang, C.; Neuhouser, M.L.; et al. Effects of weight loss on serum vitamin D in postmenopausal women. Am. J. Clin. Nutr. 2011, 94, 95–103. [Google Scholar] [CrossRef] [PubMed] [Green Version]
- Pilz, S.; Hurk, K.V.D.; Nijpels, G.; Stehouwer, C.D.A.; Riet, E.V.; Kienreich, K.; Tomaschitz, A.; Dekker, J.M. Vitamin D status, incident diabetes and prospective changes in glucose metabolism in older subjects: The Hoorn study. Nutr. Metab. Cardiovasc. Dis. 2012, 22, 883–889. [Google Scholar] [CrossRef] [PubMed]
- Veronese, N.; Sergi, G.; Rui, M.D.; Bolzetta, F.; Toffanello, E.D.; Zambon, S.; Corti, M.; Sartori, L.; Musacchio, E.; Baggio, G.; et al. Serum 25-Hydroxyvitamin D and incidence of diabetes in elderly people: The PRO.V.A. study. J. Clin. Endocrinol. Metab. 2014, 99, 2351–2358. [Google Scholar] [CrossRef] [PubMed]
- Macdonald, H.M.; Mavroeidi, A.; Barr, R.J.; Black, A.J.; Fraser, W.; Reid, D.M. Vitamin D status in postmenopausal women living at higher latitudes in the UK in relation to bone health, overweight, sunlight exposure and dietary vitamin D. Bone 2008, 42, 996–1003. [Google Scholar] [CrossRef] [PubMed]
- Mansuri, S.; Badawi, A.; Kayaniyil, S.; Cole, D.; Harris, S.B.; Mamakeesick, M.; Maguire, J.; Zinman, B.; Connelly, P.W.; Hanley, A.J. Associations of circulating 25(OH)D with cardiometabolic disorders underlying type 2 diabetes mellitus in an Aboriginal Canadian community. Diabetes Res. Clin. Pract. 2015, 109, 440–449. [Google Scholar] [CrossRef] [PubMed]
- McGill, A.; Stewart, J.M.; Lithander, F.E.; Strik, C.M.; Poppitt, S.D. Relationships of low serum vitamin D3 with anthropometry and markers of the metabolic syndrome and diabetes in overweight and obesity. Nutr. J. 2008, 7, 4. [Google Scholar] [CrossRef] [PubMed]
- Moy, F.; Bulgiba, A. High prevalence of vitamin D insufficiency and its association with obesity and metabolic syndrome among Malay adults in Kuala Lumpur, Malaysia. Moy and Bulgiba. BMC Public Health 2011, 11, 735. [Google Scholar] [CrossRef] [PubMed] [Green Version]
- Bellan, M.; Guzzaloni, G.; Rinaldi, M.; Merlotti, E.; Ferrari, C.; Tagliaferri, A.; Pirisi, M.; Aimaretti, G.; Scacchi, M.; Marzullo, P. Altered glucose metabolism rather than naïve type 2 diabetes mellitus (T2DM) is related to vitamin D status in severe obesity. Cardiovasc. Diabetol. 2014, 13, 57. [Google Scholar] [CrossRef] [PubMed]
- Chung, J.; Hong, S. Vitamin D status and its association with cardiometabolic risk factors in Korean adults based on a 2008-2010 Korean national health and nutrition examination survey nutrition research and practice. Nutr. Res. Pract. 2013, 7, 495–502. [Google Scholar] [CrossRef] [PubMed]
- Botella-Carretero, J.I.; Alvarez-Blasco, F.; Villafruela, J.J.; Balsa, J.A.; Vazquez, C.; Escobar-Morreale, H.F. Vitamin D deficiency is associated with the metabolic syndrome in morbid obesity. Clin. Nutr. 2007, 26, 573–580. [Google Scholar] [CrossRef] [PubMed]
- Lee, D.M.; Rutter, M.K.; Neill, T.W.O.; Boonen, S.; vanderschueren, D.; Bouillon, R.; Bartfai, G.; Casanueva, F.F.; Finn, J.D.; Forti, G.; et al. The European male ageing study group. Vitamin D, parathyroid hormone and the metabolic syndrome in middle-aged and older European men. Eur. J. Endocrinol. 2009, 161, 947–954. [Google Scholar] [CrossRef] [PubMed]
- Lu, L.; Yu, Z.; Pan, A.; Hu, F.B.; Franco, O.H.; Li, H.; Li, X.; Yang, X.; Chen, Y.; Lin, X. Plasma 25-hydroxyvitamin D concentration and metabolic syndrome among middle-aged and elderly Chinese individuals. Diabetes Care 2009, 32, 1278–1283. [Google Scholar] [CrossRef] [PubMed] [Green Version]
- Andreozzi, P.; Verrusio, W.; Viscogliosi, G.; Summa, M.L.; Gueli, N.O.; Cacciafesta, M.; Albanese, C.V. Relationship between vitamin D and body fat distribution evaluated by DXA in postmenopausal women. Nutrition 2016, 32, 687–692. [Google Scholar] [CrossRef] [PubMed]
- Holick, M.F. Vitamin D: Important for prevention of osteoporosis, cardiovascular heart disease, type 1 diabetes, autoimmune diseases, and some cancers. South Med. J. 2005, 98, 1024–1027. [Google Scholar] [CrossRef] [PubMed]
- Wong, K.E.; Kong, J.; Zhang, W.; Szeto, F.L.; Ye, H.; Deb, D.K.; Brady, M.J.; Li, Y.C. Targeted expression of human vitamin D receptor in adipocytes decreases energy expenditure and induces obesity in mice. J. Biol. Chem. 2011, 286, 33804–33810. [Google Scholar] [CrossRef] [PubMed]
- Stein, E.M.; Strain, G.; Sinha, N.; Ortiz, D.; Pomp, A.; Dakin, G.; McMahon, D.J.; Bockman, R.; Silverberg, S.J. Vitamin D insufficiency prior to bariatric surgery: Risk factors and a pilot treatment study. Clin. Endocrinol. 2009, 71, 176–183. [Google Scholar] [CrossRef] [PubMed]
- Barnard, W.F.; Saxena, V.K.; Wenny, B.N.; DeLuisi, J.J. Daily surface UV exposure and its relationship to surface pollutant measurements. J. Air Waste Manag. Assoc. 2003, 53, 237–245. [Google Scholar] [CrossRef] [PubMed]
- Elminir, H.K. Sensitivity of ultraviolet solar radiation to anthropogenic air pollutants and weather conditions. Atmos. Res. 2007, 84, 250–264. [Google Scholar] [CrossRef]
- Dahifar, H.; Faraji, A.; Ghorbani, A.; Yassobi, S. Impact of dietary and lifestyle on vitamin D in healthy student girls aged 11–15 years. J. Med. Investig. 2006, 53, 204–208. [Google Scholar] [CrossRef]
- Wang, Y.; Beydoun, M.A. The obesity epidemic in the United States–gender, age, socioeconomic, racial/ethnic, and geographic characteristics: A systematic review and meta-regression analysis. Epidemiol. Rev. 2007, 29, 26–28. [Google Scholar] [CrossRef] [PubMed]
- Eartman, C.P.; Beckman, L.M.; Masdkark, K.; Sibley, S.D. The link between obesity and low circulating 25 hydroxy vitamin D concentrations: Considerations and implications. Int. J. Obes. 2012, 36, 387–396. [Google Scholar] [CrossRef] [PubMed]
- Drincic, A.T.; Armas, L.A.; Diest, E.E.V.; Heaney, R.P. Volumetric dilution, rather than sequestration best explains the low vitamin D status of obesity. Obesity 2012, 20, 1444–1448. [Google Scholar] [CrossRef] [PubMed]
- Pathak, K.; Soares, M.J.; Calton, E.K.; Hallet, J. Vitamin D supplementation and body weight status: A systematic review and meta-analysis of randomized controlled trials. Obes. Rev. 2014, 15, 528–537. [Google Scholar] [CrossRef] [PubMed]
- Prodam, F.; Zanetta, S.; Ricotti, R.; Marolda, A.; Giglione, E.; Monzan, A.; Walker, G.E.; Rampone, S.; Castagno, M.; Bellone, S.; et al. Influence of Ultraviolet Radiation on the Association between 25-Hydroxy Vitamin D Levels and Cardiovascular Risk Factors in Obesity. J. Pediatr. 2016, 171, 83–89. [Google Scholar] [CrossRef] [PubMed]
- Welty, F.K.; Alfaddagh, A.; Elajami, T.K. Targeting inflammation in metabolic syndrome. Transl. Res. 2015, 167, 257–280. [Google Scholar] [CrossRef] [PubMed]
- Ghashut, R.A.; Talwar, D.; Kinsella, J.; Duncan, A.; McMillan, D.C. The effect of the systematic inflammatory response on plasma vitamin 25 (OH) D concentrations adjusted for albumen. PLoS ONE 2014, 9, e92614. [Google Scholar] [CrossRef] [PubMed]
- Liefaard, M.C.; Ligtharts, S.; Vitezova, A.; Hofman, A.; Uitterlinden, A.G.; de Jong, J.C.K.; Franco, O.H.; Zillikens, M.C.; Dehghan, A. Vitamin D and C-reactive protein: A Mendelian randomization study. PLoS ONE 2015, 10, e0131740. [Google Scholar] [CrossRef] [PubMed] [Green Version]
- Slusher, A.L.; McAllister, M.J.; Huang, C.J. A therapeutic role of vitamin D on obesity associated inflammation and weight loss intervention. Inflamm. Res. 2015, 64, 565–575. [Google Scholar] [CrossRef] [PubMed]
- Maki, K.C.; Fulgoni, V.L.; Keast, D.R.; Rains, T.M.; Park, K.M.; Rubin, M.R. Vitamin D intake and status are associated with lower prevalence of metabolic syndrome in U.S. adults: National health and nutrition examination surveys 2003–2006. Metab. Syndr. Relat. Disord. 2012, 10, 363–372. [Google Scholar] [CrossRef] [PubMed]
- Wynne, K.S.; McGowan, S.B.; Bloom, S. Appetite control. J. Endocrinol. 2005, 184, 291–318. [Google Scholar] [CrossRef] [PubMed] [Green Version]
- Akiyama, M.; Okada, Y.; Kanai, M.; Takahashi, A.; Momozawa, Y.; Ikeda, M.; Iwata, N.; Ikegawa, S.; Hirata, M.; Matsuda, K.; et al. Genome-wide association study identifies 112 new loci for body mass index in the Japanese population. Nat. Genet. 2017, 49, 1458–1467. [Google Scholar] [CrossRef] [PubMed]
Figure 1.
Flow sheet diagram for the study selection process.

Figure 2.
Non-diabetic subject studies: Forest plot shows the correlation between vitamin D status and BMI [18,19,20,21,22,23,24,25,26,27,28,29,30,31,32,33,34,35,36,37,38,39,40,41,42,43,44,45,46,47,48,49,50,51,52,53]. A random effects model was used to calculate the correlations and 95% confidence interval (CI) (I2 = 80.524%, p = 0.000).

Figure 3.
Non-diabetic subject studies for the lowest BMI quartile (18–25): Forest plot shows the correlation between vitamin D status and body mass index (BMI) [18,20,23,25,27,31,33,34,35,36,43,45,46,52,53]. A random effect model was used to calculate the correlations and 95% CI (I2 = 84.372%, p = 0.000).

Figure 4.
Non-diabetic subject studies for the medium BMI quartile (25–30): Forest plot shows the correlation between vitamin D status and BMI [19,21,22,23,29,32,34,37,38,39,40,41,42,44,47,49,50,51]. A random effect model was used to calculate the correlations and 95% CI (I2 = 64.411%, p = 0.000).

Figure 5.
Non-diabetic subject studies for the highest BMI quartile (>30): Forest plot shows the correlation between vitamin D status and BMI [17,19,26,28,29,30,48]. A random effect model was used to calculate the correlations and 95% CI (I2 = 89.764%, p = 0.000).
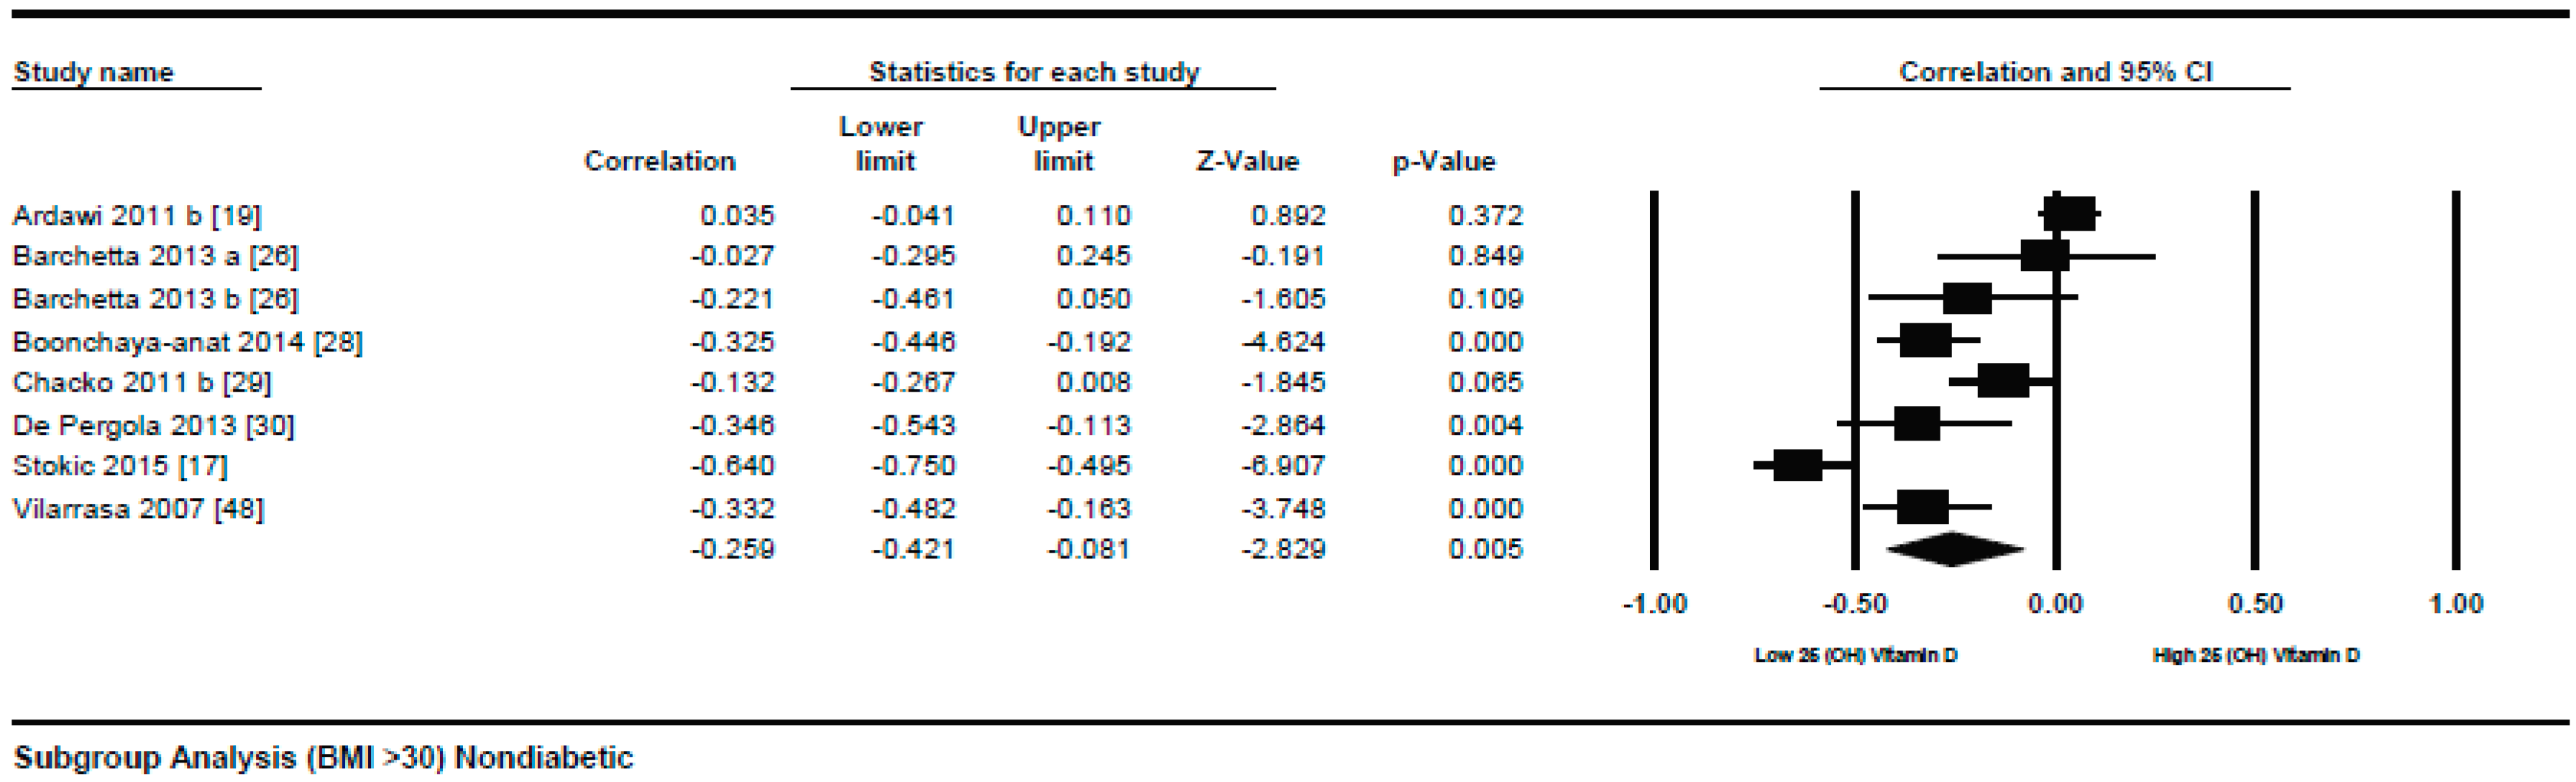
Figure 6.
Non-diabetic subject studies. Regression analysis for the moderator “latitude”: R-squared representation shows the contribution of latitude on the heterogeneity of the results.
Figure 6.
Non-diabetic subject studies. Regression analysis for the moderator “latitude”: R-squared representation shows the contribution of latitude on the heterogeneity of the results.

Figure 7.
Non-diabetic subject studies. Regression analysis for the moderator “Method of vitamin D determination”: R-squared representation shows the contribution of method of determination of vitamin D on the heterogeneity of the results.
Figure 7.
Non-diabetic subject studies. Regression analysis for the moderator “Method of vitamin D determination”: R-squared representation shows the contribution of method of determination of vitamin D on the heterogeneity of the results.
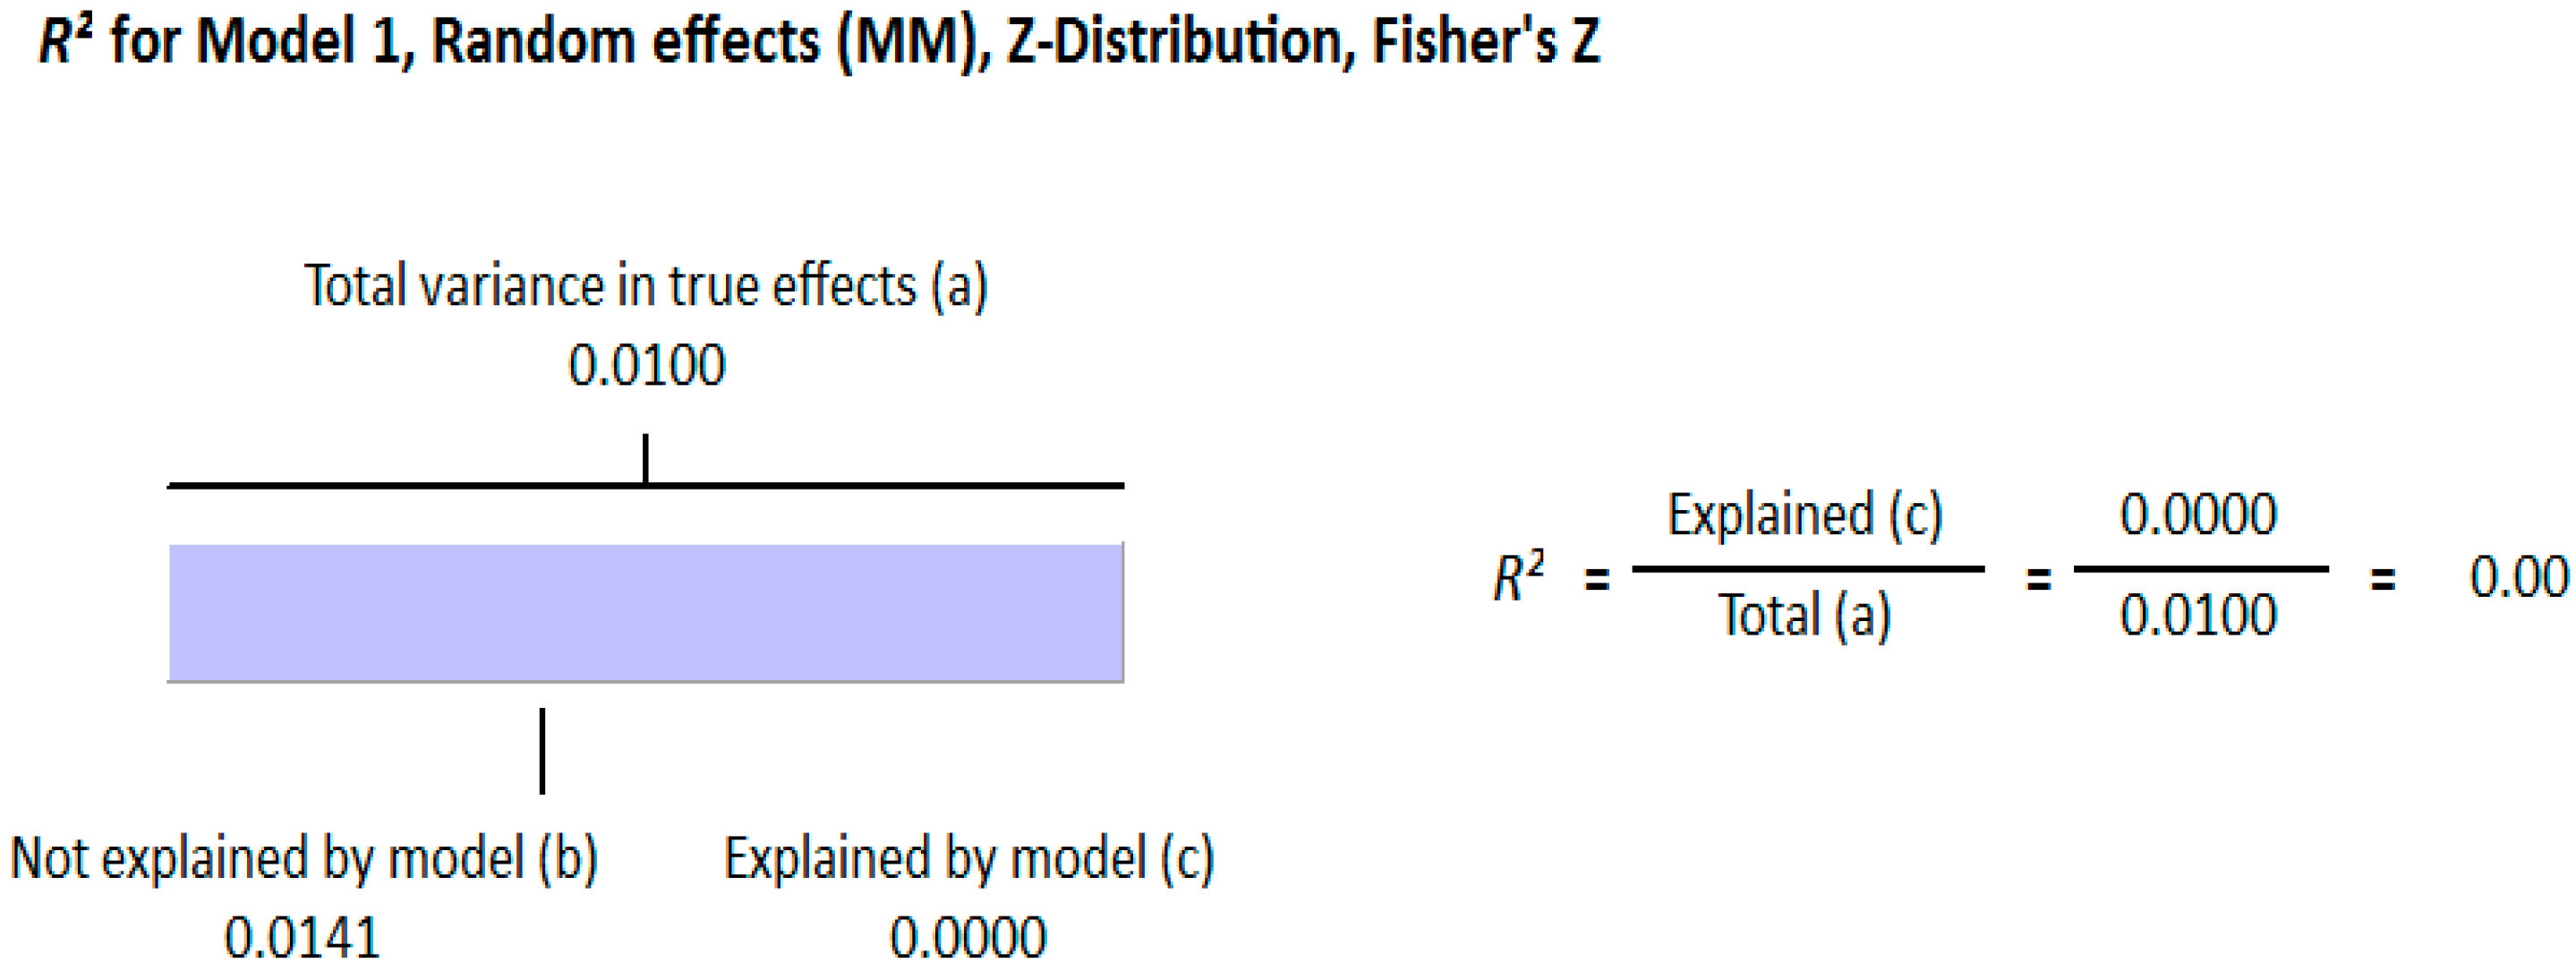
Figure 8.
Non-diabetic subject studies. Regression analysis for the moderator “Different quartiles of BMI”: R-squared representation shows the contribution of different quartiles of BMI on the heterogeneity of the results.
Figure 8.
Non-diabetic subject studies. Regression analysis for the moderator “Different quartiles of BMI”: R-squared representation shows the contribution of different quartiles of BMI on the heterogeneity of the results.
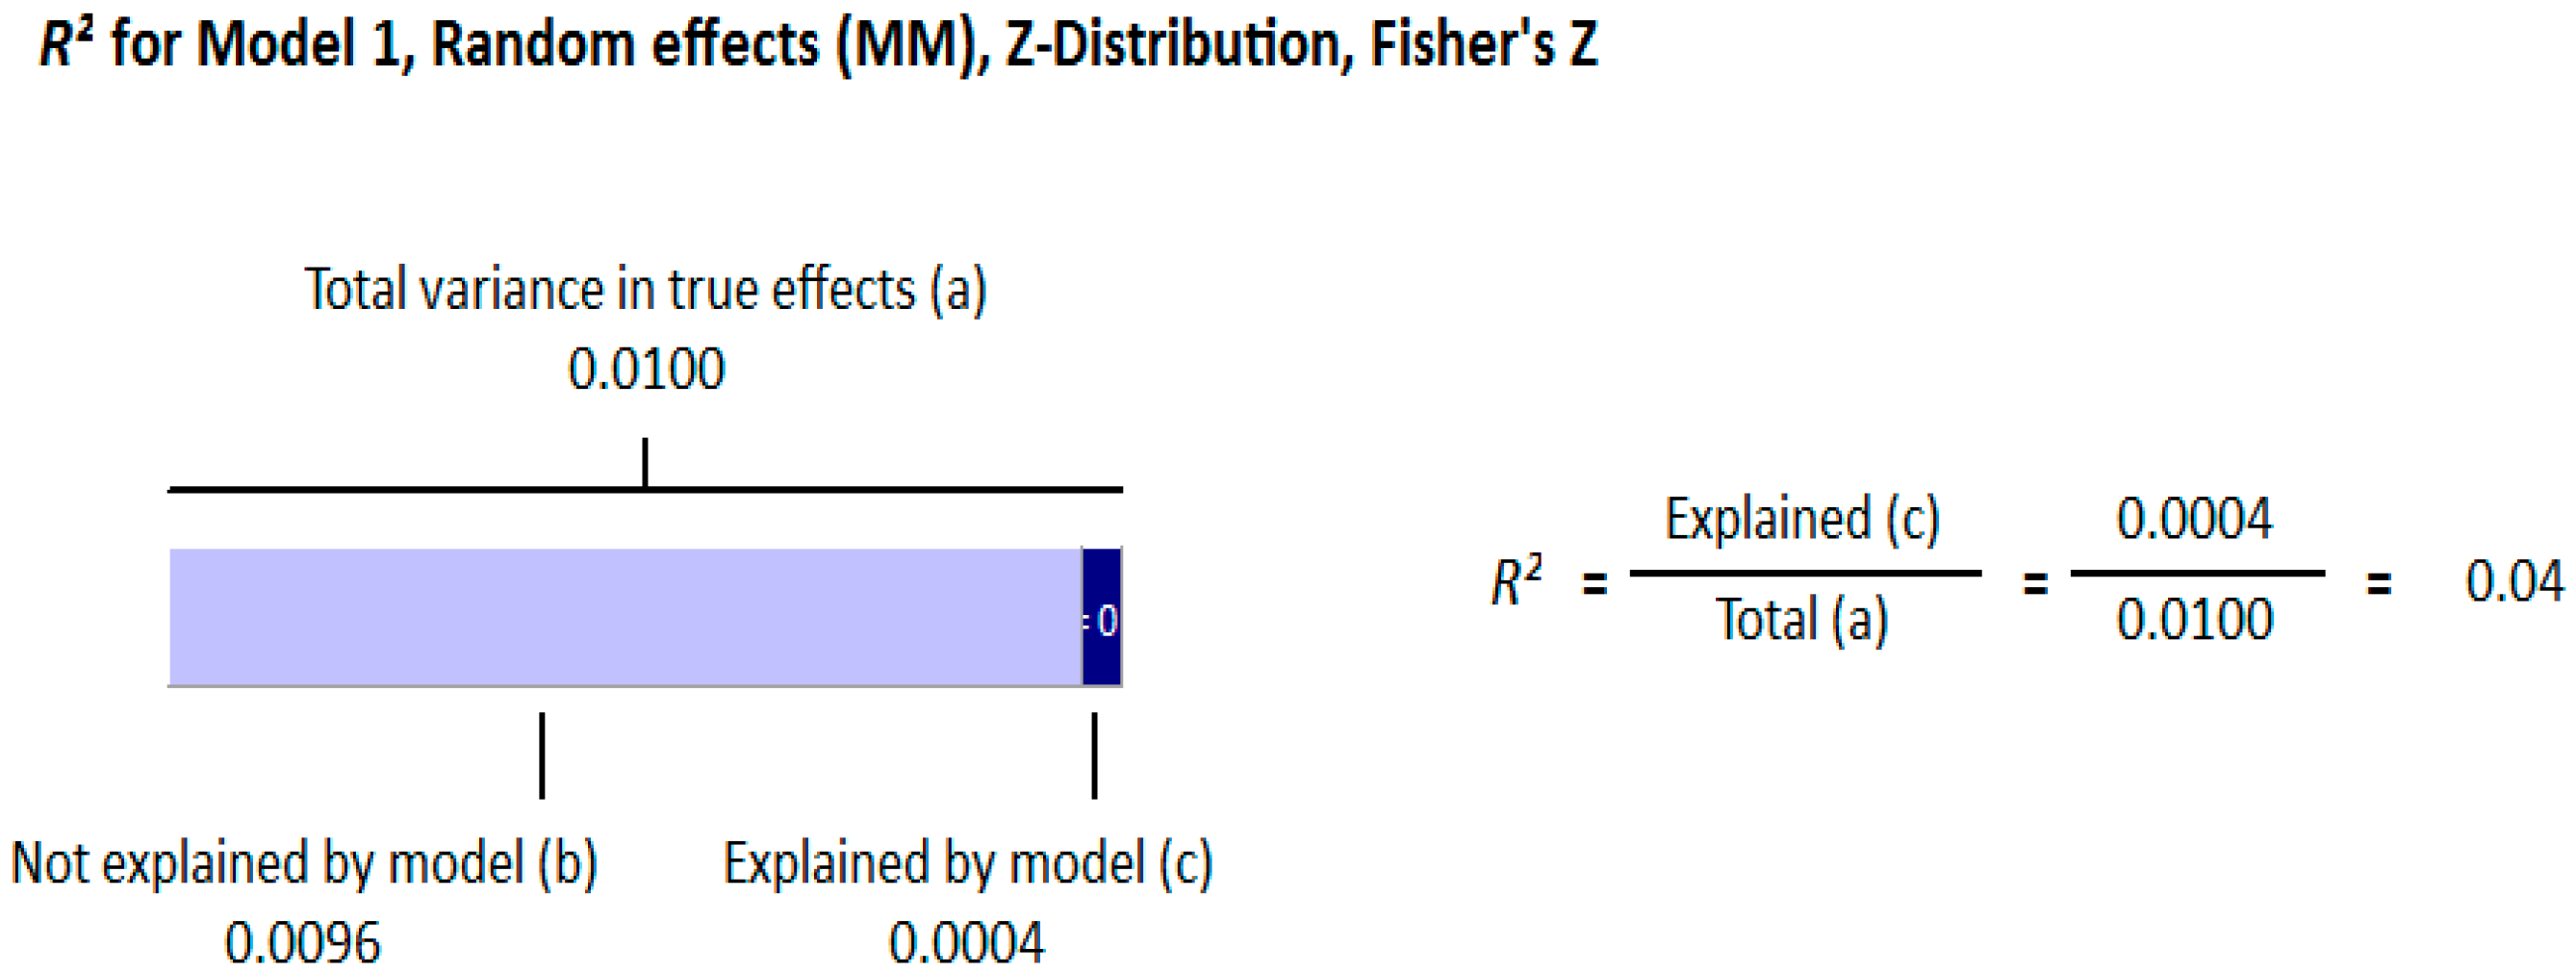
Figure 9.
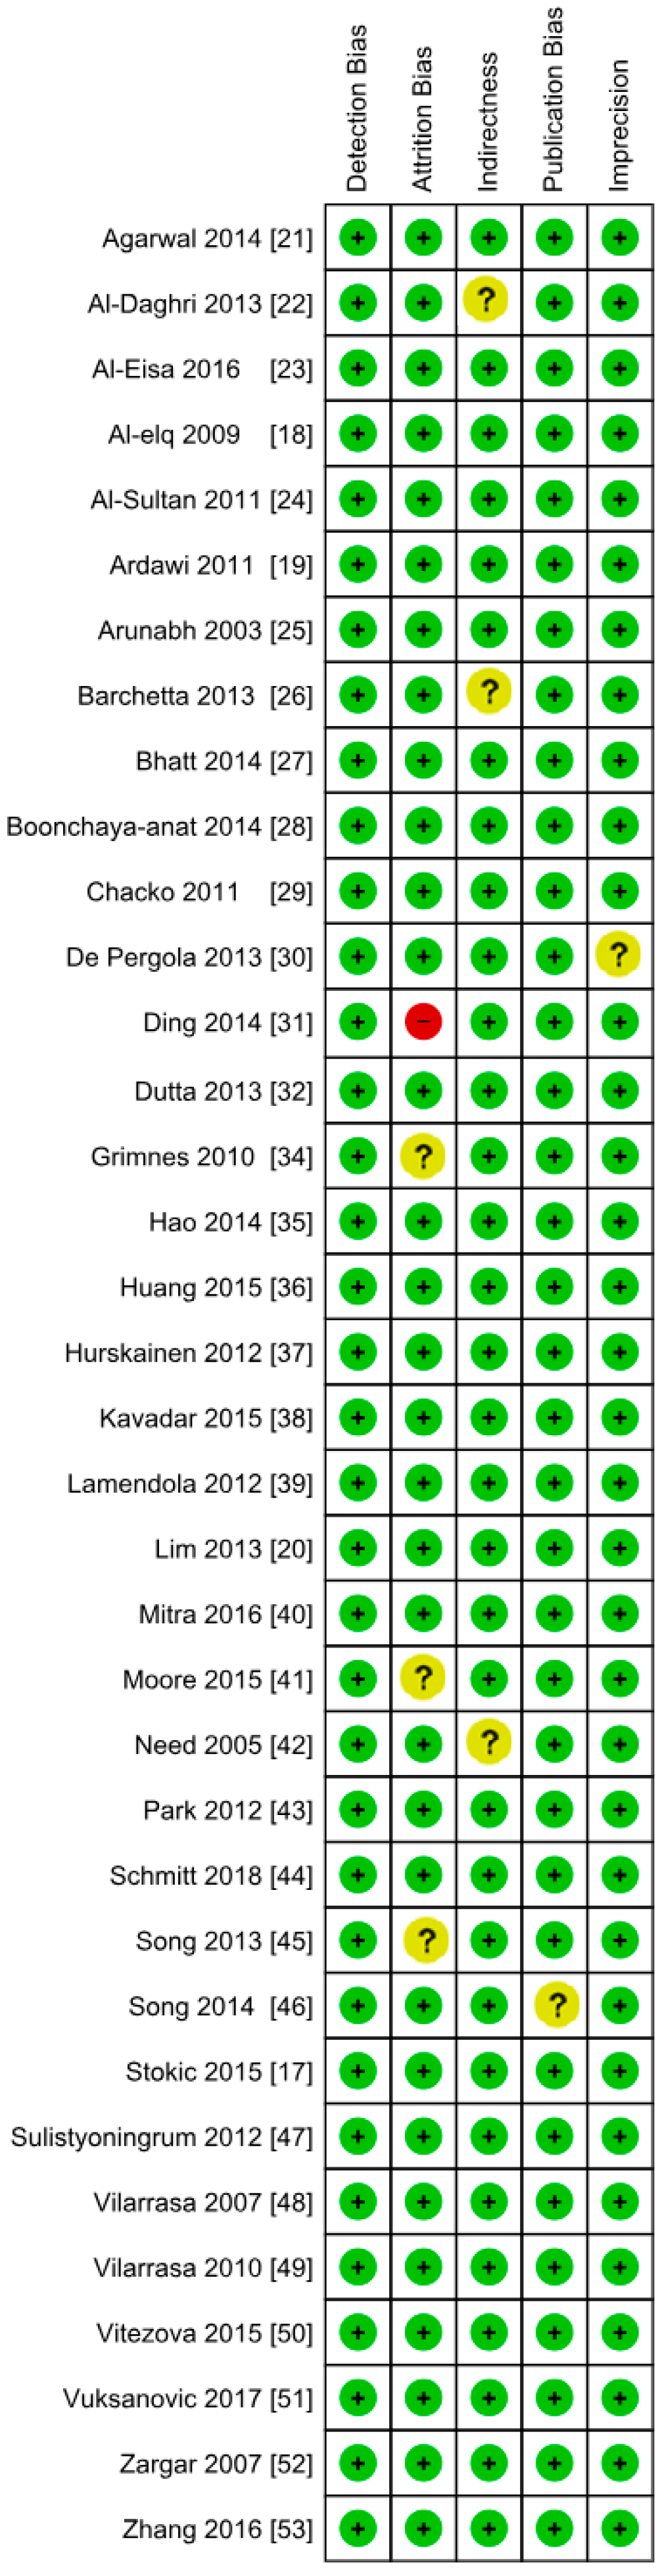
Authors’ assessment of the risk of bias in non-diabetic subject studies: Data shown for each individual study (the plus sign indicates a low risk of bias, the minus sign shows a high risk of bias, and the question mark indicates that the risk of bias is unknown) [17,18,19,20,21,22,23,24,25,26,27,28,29,30,31,32,34,35,36,37,38,39,40,41,42,43,44,45,46,47,48,49,50,51,52,53].
Figure 9.
Authors’ assessment of the risk of bias in non-diabetic subject studies: Data shown for each individual study (the plus sign indicates a low risk of bias, the minus sign shows a high risk of bias, and the question mark indicates that the risk of bias is unknown) [17,18,19,20,21,22,23,24,25,26,27,28,29,30,31,32,34,35,36,37,38,39,40,41,42,43,44,45,46,47,48,49,50,51,52,53].

Figure 10.
Author’s assessment of the risk of bias in non-diabetic subject studies: Data shown in percentages for all studies.
Figure 10.
Author’s assessment of the risk of bias in non-diabetic subject studies: Data shown in percentages for all studies.
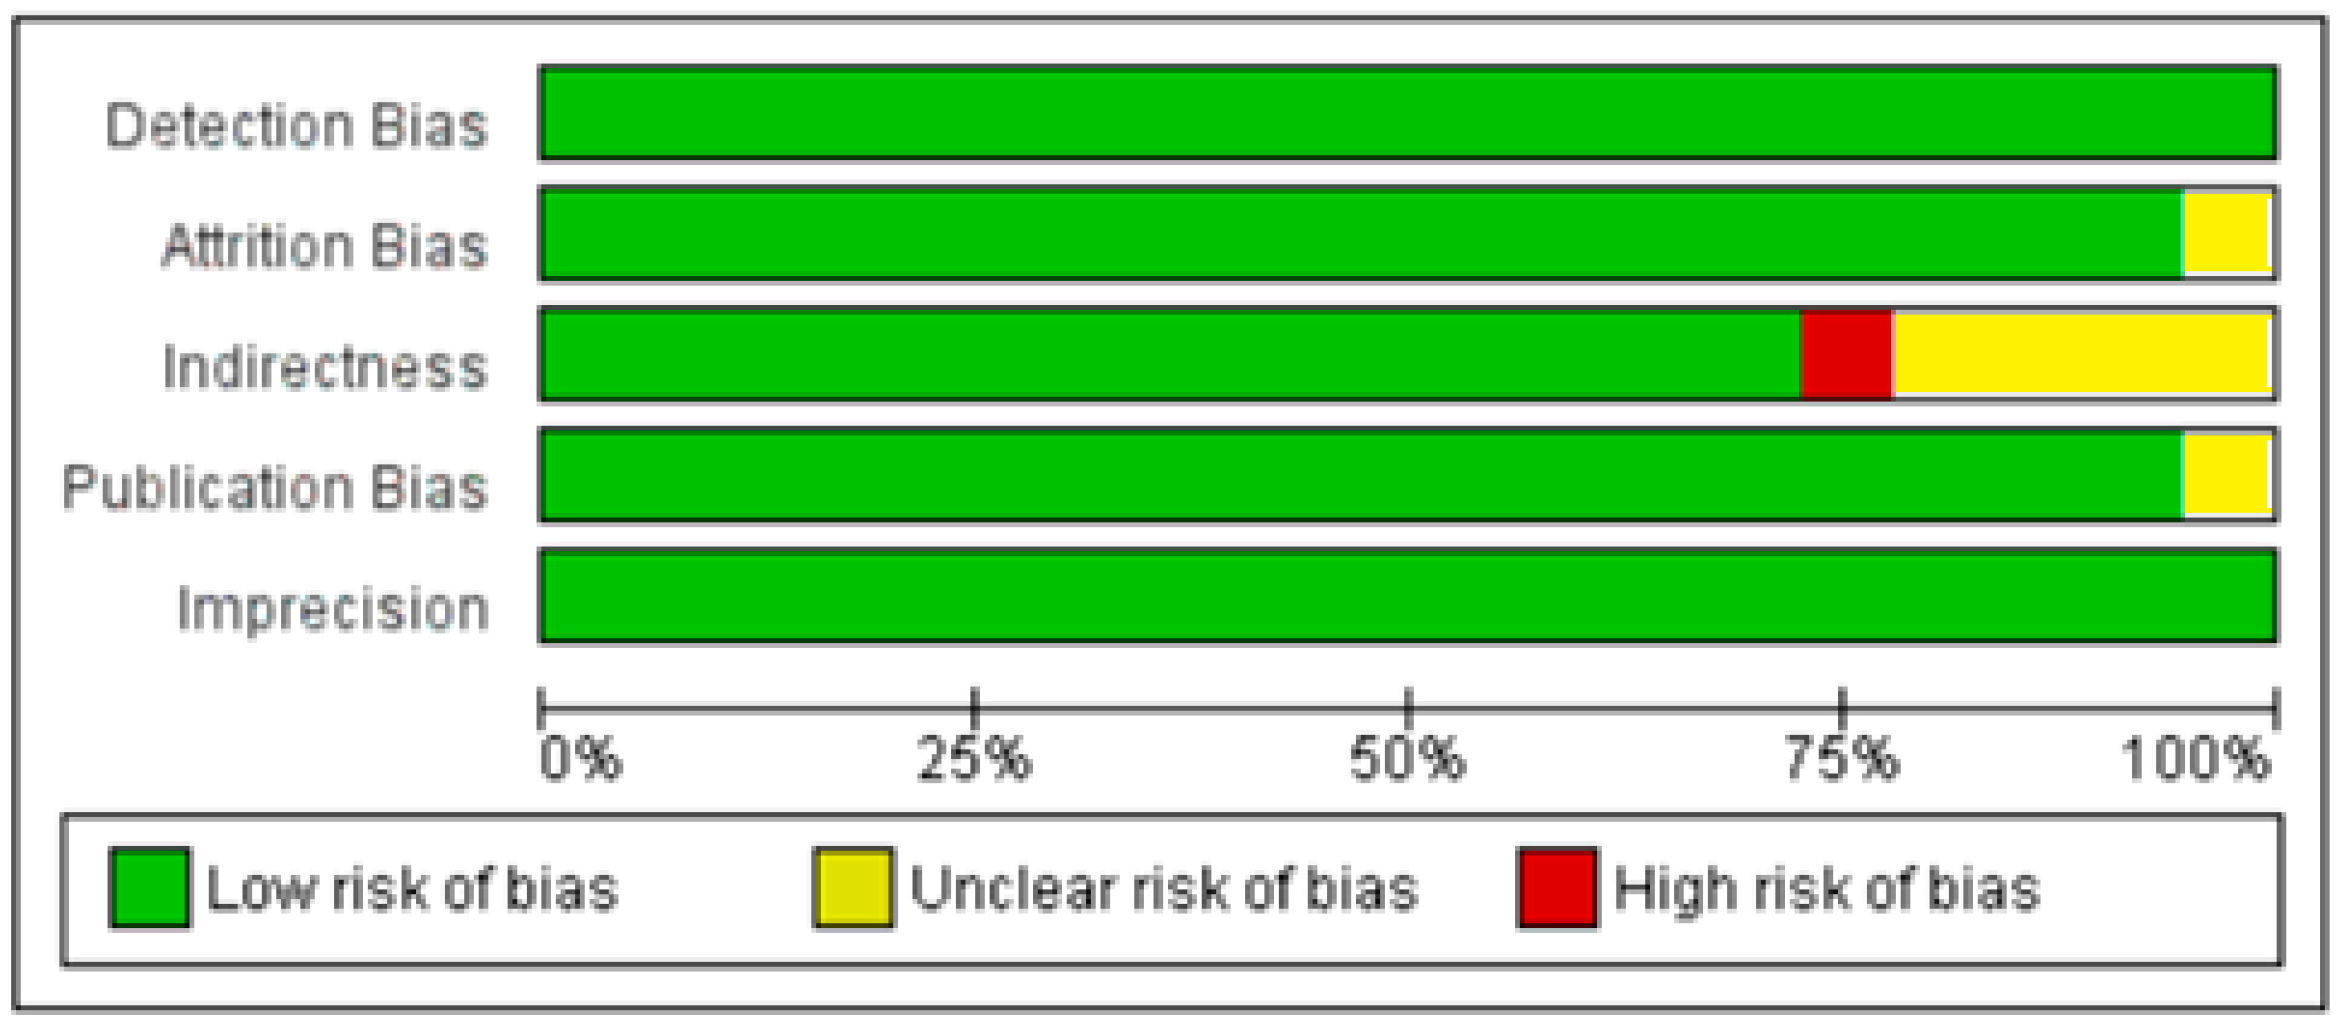
Figure 11.
Diabetic subject studies: Forest plot shows the correlation between vitamin D status and BMI [22,54,55,56,57,58,59,60,61,62,63,64,65,66,67,68,69,70]. A random effect model was used to calculate the correlations and 95% CI (I2 = 80.520%, p = 0.000).

Figure 12.
Diabetic subject studies for the lower BMI quartile (<30): Forest plot shows the correlation between vitamin D status and BMI [54,56,57,58,59,60,61,62]. A random effect model was used to calculate the correlations and 95% CI (I2 = 54.584%, p = 0.00).

Figure 13.
Diabetic subject studies for higher BMI quartile (>30): Forest plot shows the correlation between vitamin D status and BMI [22,56,57,58,60,61,63]. Random effect model was used to calculate the correlations and 95% CI (I2 = 82.465%, p = 0.00).

Figure 14.
Diabetic subject studies. Regression analysis for the moderator “Different quartiles of BMI”: R-squared representation shows the contribution of different quartiles of BMI on the heterogeneity of the results.
Figure 14.
Diabetic subject studies. Regression analysis for the moderator “Different quartiles of BMI”: R-squared representation shows the contribution of different quartiles of BMI on the heterogeneity of the results.

Figure 15.
Diabetic subject studies. Regression analysis for the moderator “Latitude”: R-squared representation shows the contribution of latitude on the heterogeneity of the results.
Figure 15.
Diabetic subject studies. Regression analysis for the moderator “Latitude”: R-squared representation shows the contribution of latitude on the heterogeneity of the results.

Figure 16.
Diabetic subject studies. Regression analysis for the moderator “Method of vitamin D determination”: R-squared representation shows the contribution of the method of vitamin D determination on the heterogeneity of the results.
Figure 16.
Diabetic subject studies. Regression analysis for the moderator “Method of vitamin D determination”: R-squared representation shows the contribution of the method of vitamin D determination on the heterogeneity of the results.

Figure 17.
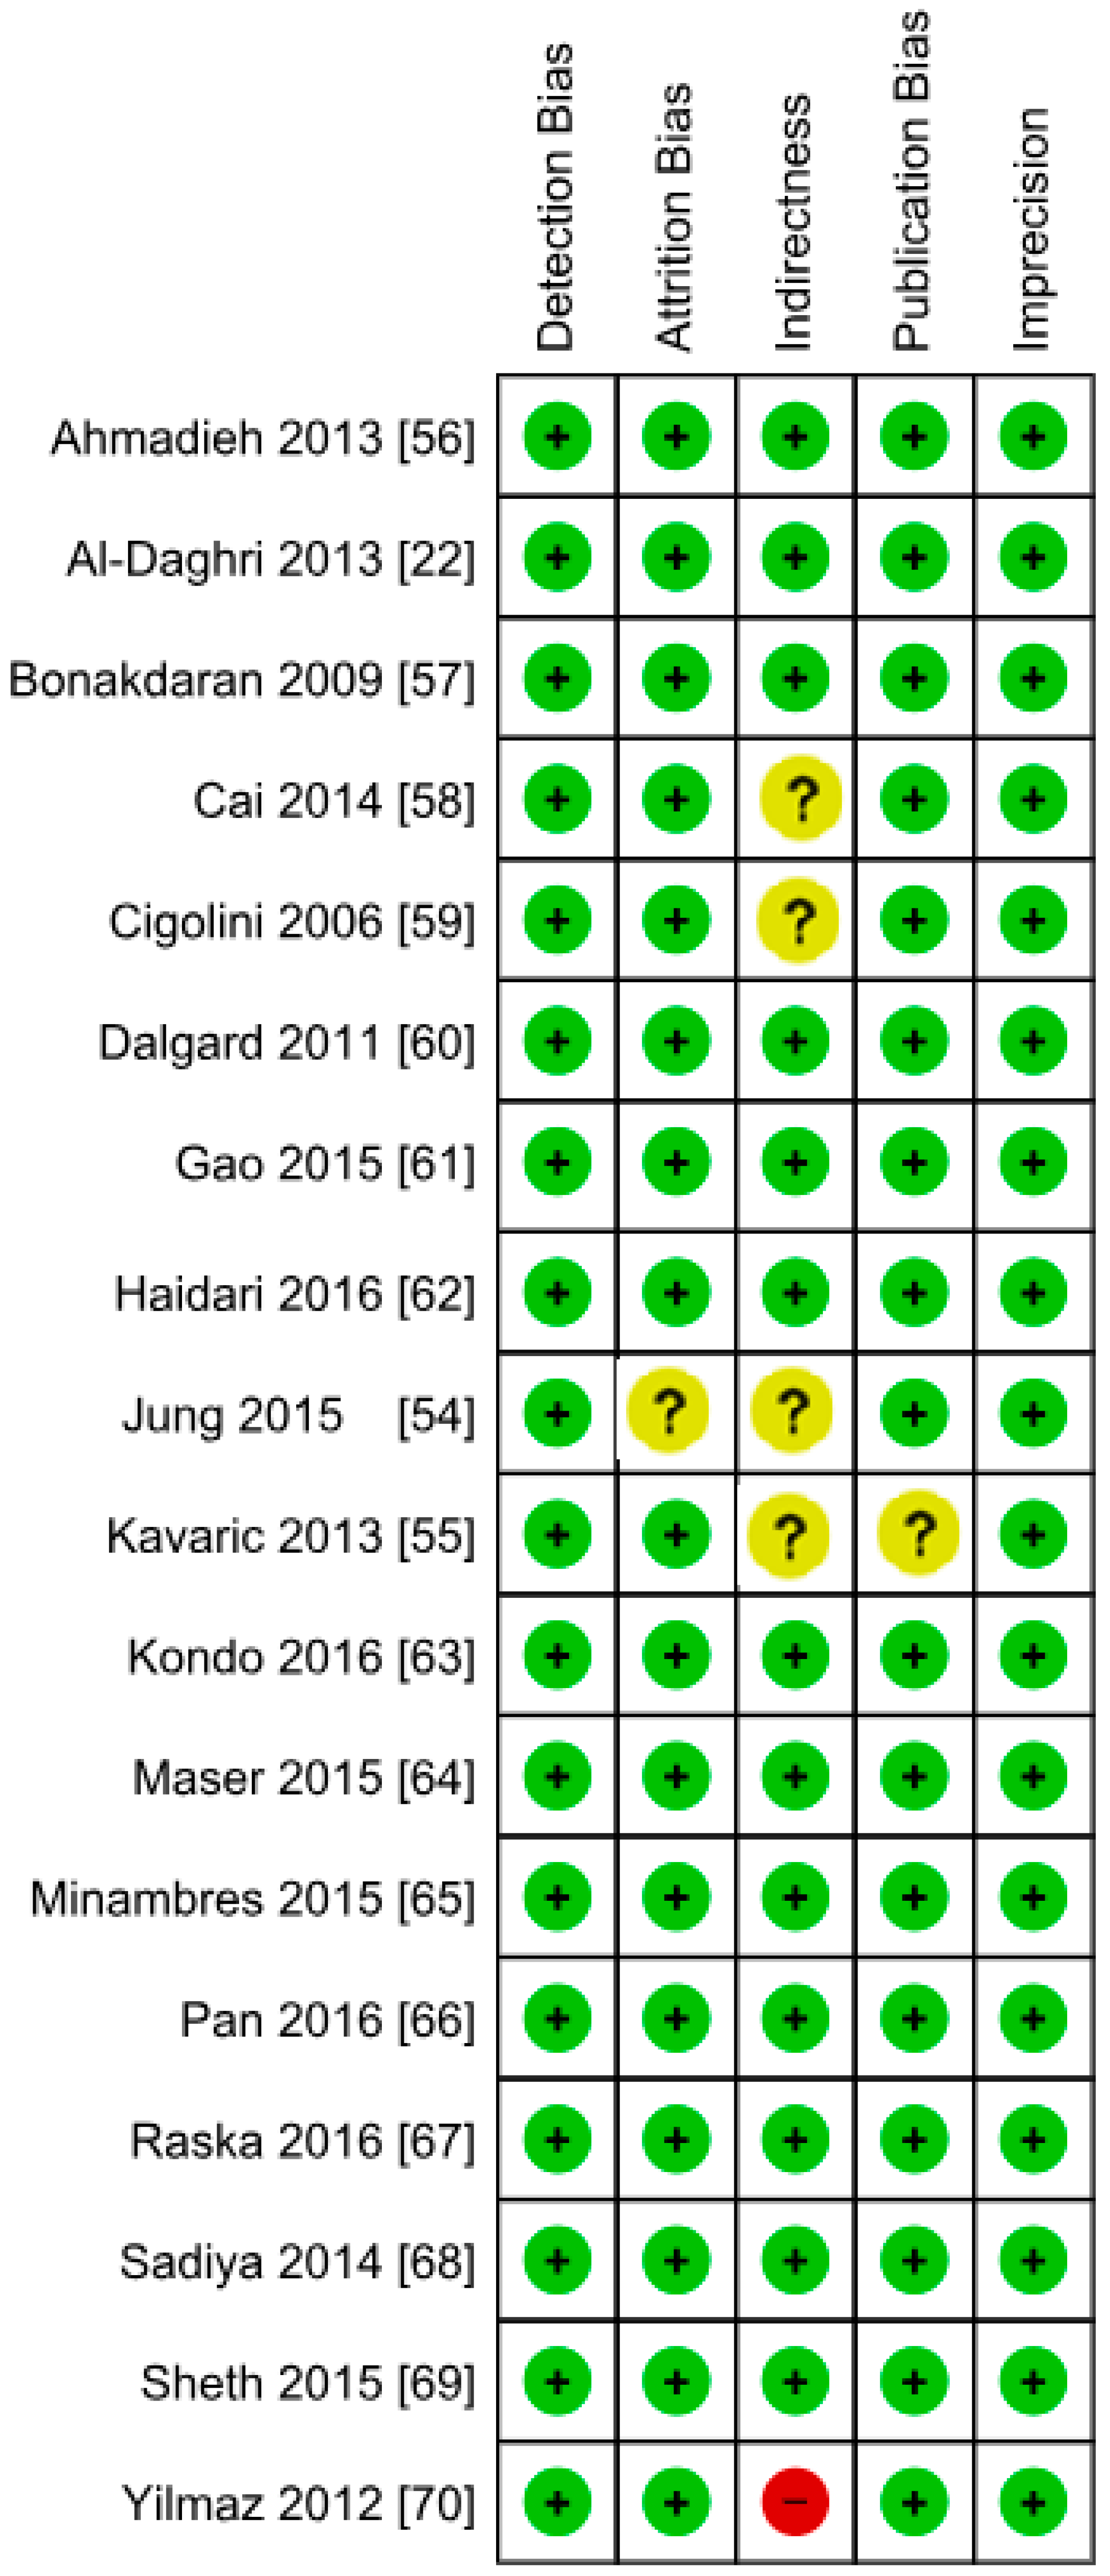
Authors’ assessment of the risk of bias in the diabetic subject studies: Data shown for each individual study (the plus sign shows a low risk of bias, the minus sign shows a high risk of bias, and the question mark indicates that the risk of bias is unknown) [22,54,55,56,57,58,59,60,61,62,63,64,65,66,67,68,69,70].
Figure 17.
Authors’ assessment of the risk of bias in the diabetic subject studies: Data shown for each individual study (the plus sign shows a low risk of bias, the minus sign shows a high risk of bias, and the question mark indicates that the risk of bias is unknown) [22,54,55,56,57,58,59,60,61,62,63,64,65,66,67,68,69,70].

Figure 18.
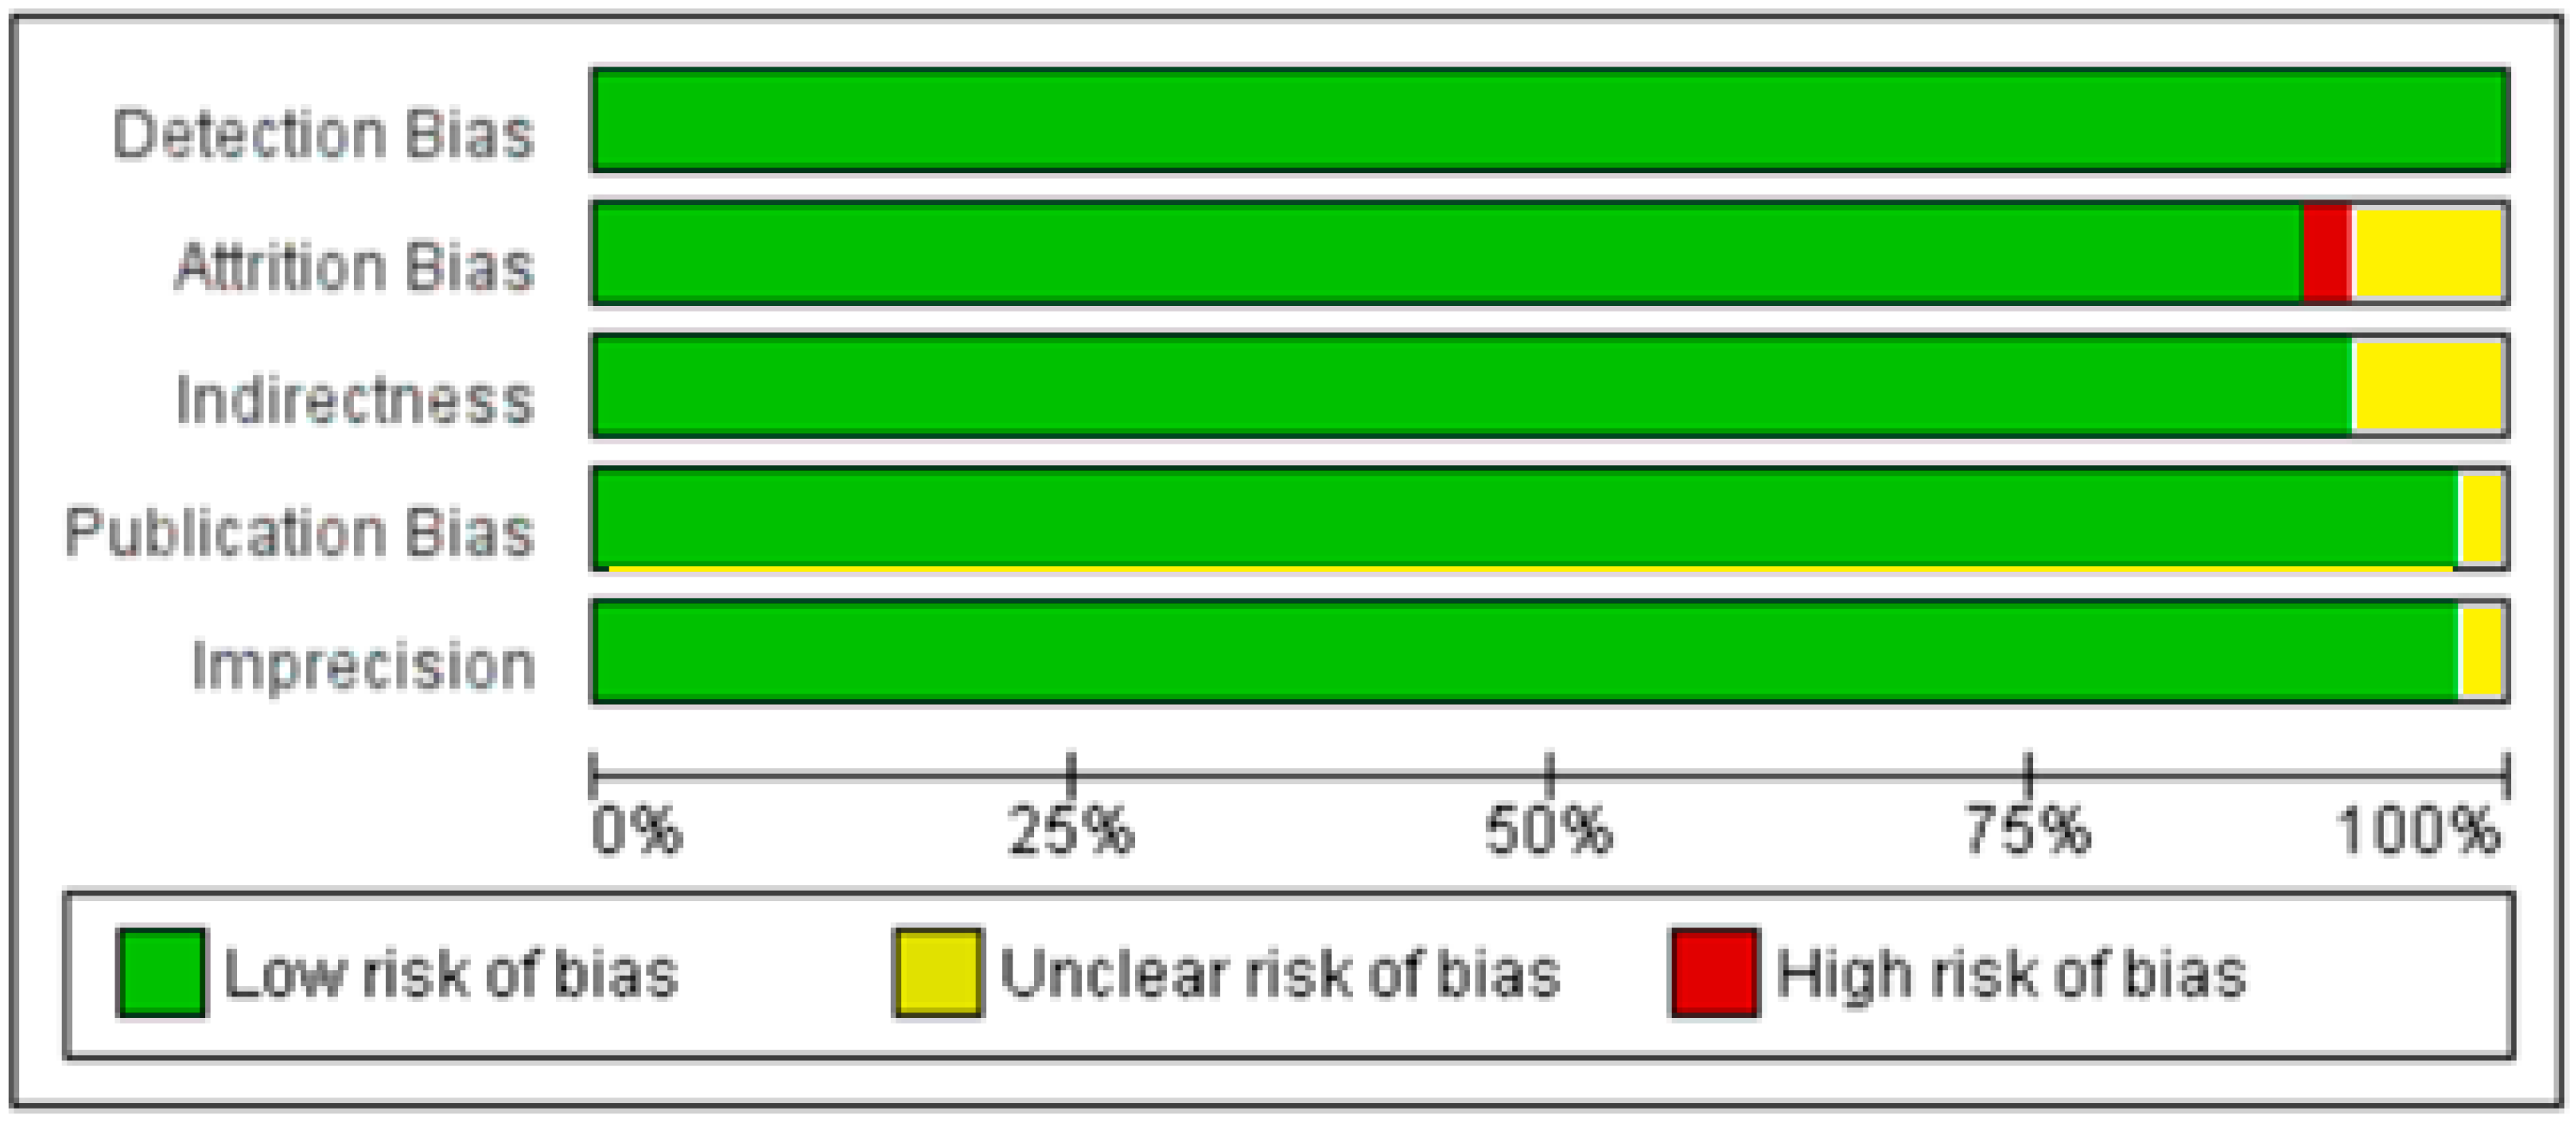
Authors’ assessment of the risk of bias in diabetic subject studies: Data shown in percentages for all studies.
Figure 18.
Authors’ assessment of the risk of bias in diabetic subject studies: Data shown in percentages for all studies.

© 2018 by the authors. Licensee MDPI, Basel, Switzerland. This article is an open access article distributed under the terms and conditions of the Creative Commons Attribution (CC BY) license (http://creativecommons.org/licenses/by/4.0/).
Share and Cite
MDPI and ACS Style
Rafiq, S.; Jeppesen, P.B. Body Mass Index, Vitamin D, and Type 2 Diabetes: A Systematic Review and Meta-Analysis. Nutrients 2018, 10, 1182. https://doi.org/10.3390/nu10091182
AMA Style
Rafiq S, Jeppesen PB. Body Mass Index, Vitamin D, and Type 2 Diabetes: A Systematic Review and Meta-Analysis. Nutrients. 2018; 10(9):1182. https://doi.org/10.3390/nu10091182
Chicago/Turabian StyleRafiq, Shamaila, and Per Bendix Jeppesen. 2018. "Body Mass Index, Vitamin D, and Type 2 Diabetes: A Systematic Review and Meta-Analysis" Nutrients 10, no. 9: 1182. https://doi.org/10.3390/nu10091182
Note that from the first issue of 2016, this journal uses article numbers instead of page numbers. See further details here.