Vitamin D Fortification of Fluid Milk Products and Their Contribution to Vitamin D Intake and Vitamin D Status in Observational Studies—A Review


Abstract
:1. Introduction
2. Materials and Methods
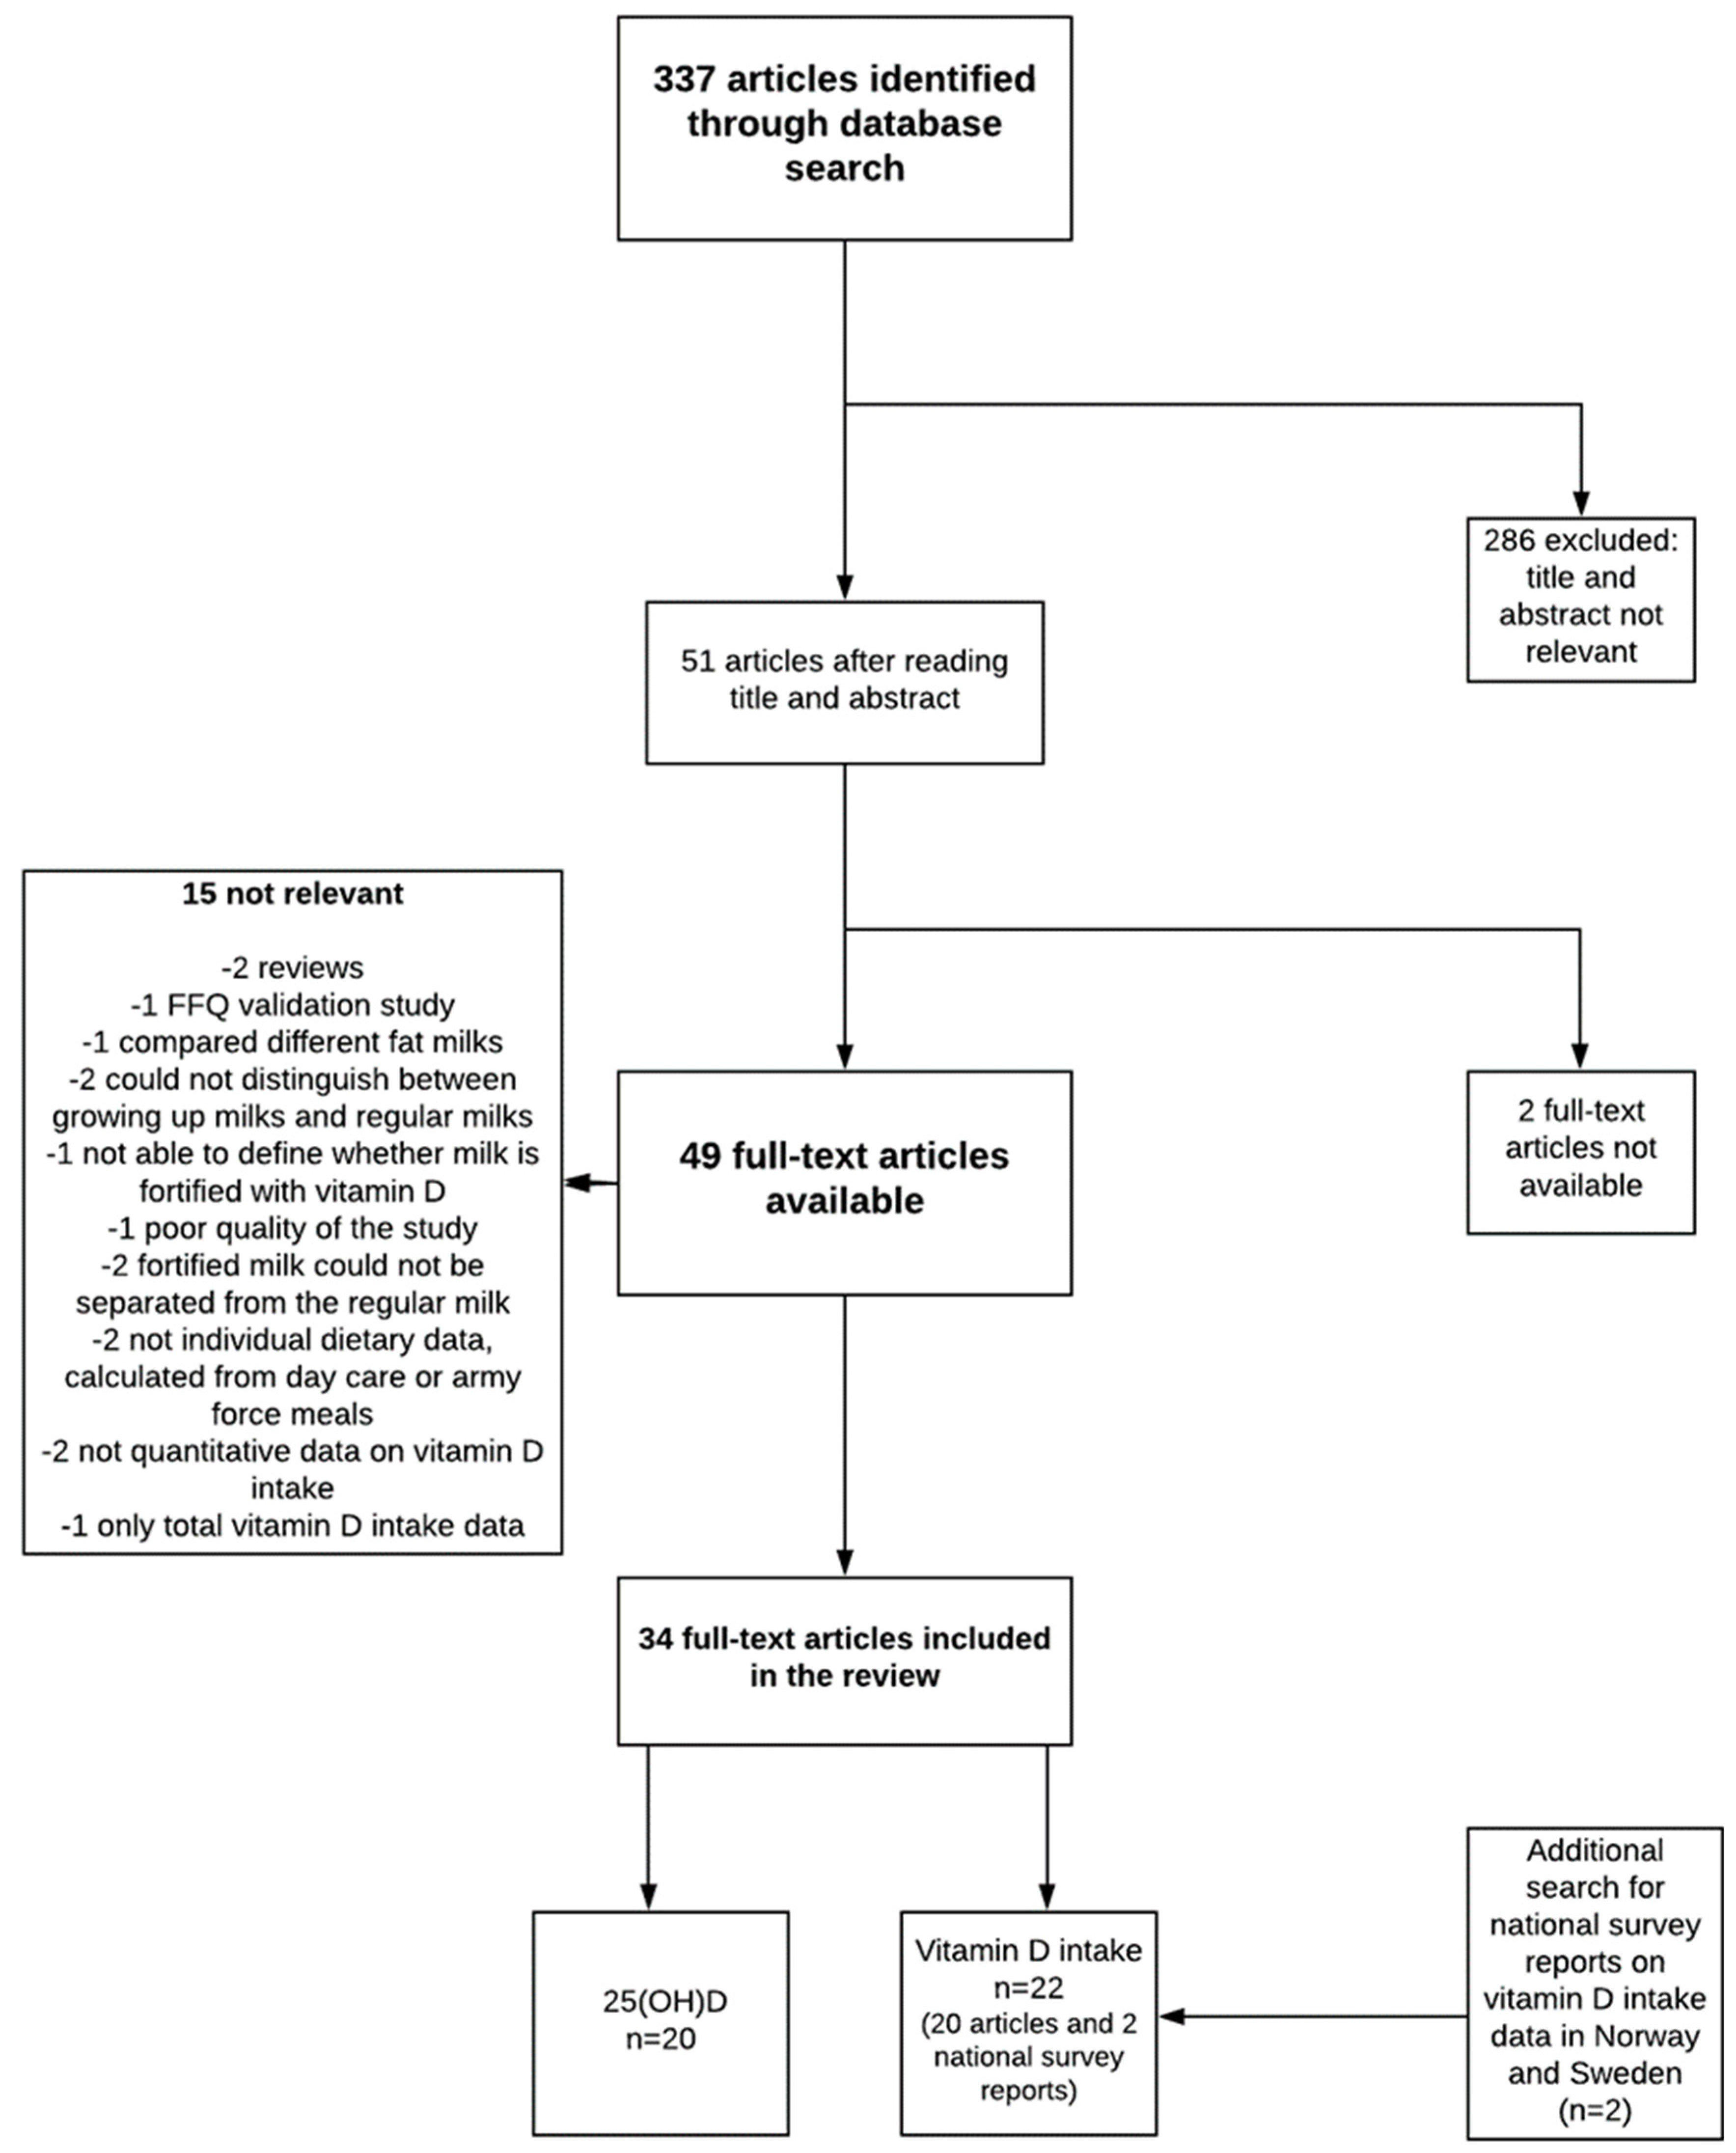
2.1. Data Sources and Search Strategy
2.2. Eligibility and Study Selection
2.3. Data Extraction
3. Results
3.1. Contribution of Vitamin D-Fortified Milk to Vitamin D Intakes
3.1.1. Children and Adolescents
3.1.2. Adults and the Elderly, and Studies Including All Age Groups
3.2. Associations Between Consumption of Vitamin D-Fortified Milk and 25(OH)D Status
3.2.1. Children and Adolescents
3.2.2. Pregnant Women and Mother-Child Pairs
3.2.3. Adults, the Elderly, and All Age Groups
4. Discussion
4.1. Limitations of the Study
4.2. Future Perspectives in Vitamin D Fortification
5. Conclusions
Author Contributions
Funding
Conflicts of Interest
References
- Lamberg-Allardt, C.; Brustad, M.; Meyer, H.E.; Steingrimsdottir, L. Vitamin D—A systematic literature review for the 5th edition of the Nordic Nutrition Recommendations. Food Nutr. Res. 2013, 57, 22671. [Google Scholar] [CrossRef] [PubMed] [Green Version]
- Theodoratou, E.; Tzoulaki, I.; Zgaga, L.; Ioannidis, J.P. Vitamin D and multiple health outcomes: Umbrella review of systematic reviews and meta-analyses of observational studies and randomized trials. BMJ 2014, 348, 2035. [Google Scholar] [CrossRef] [PubMed]
- O’Neill, C.M.; Kazantzidis, A.; Ryan, M.J.; Barber, N.; Sempos, C.T.; Durazo-Arvizu, R.A.; Jorde, R.; Grimnes, G.; Eiriksdottir, G.; Gudnason, V.; et al. Seasonal changes in vitamin D-effective UVB-availability in Europe and associations with population serum 25-hydroxyvitamin D. Nutrients 2016, 8, 533–538. [Google Scholar] [CrossRef] [PubMed]
- European Union. Commission Directive 2006/141/EC on infant formulae and follow-on formulae and amending Directive 1999/21/EC. Off. J. Eur Union 2006, 401, 15. [Google Scholar]
- Cashman, K.D.; Kiely, M. Tackling inadequate vitamin D intakes within the population: Fortification of dairy products with vitamin D may not be enough. Endocrine 2016, 251, 38–46. [Google Scholar] [CrossRef] [PubMed]
- National Nutrition Council. Report of vitamin D Working Group (Valtion Ravitsemusneuvottelukunta D-Vitamiinityöryhmän Raportti In Finnish). 2010. Available online: https://www.evira.fi/globalassets/vrn/pdf/d-vitamiiniraportti2010.pdf (accessed on 1 January 2018).
- Ministry of Agriculture and Forestry of Finland. Maa-ja metsätalousministeriön asetus rasvattoman homogenoidun maidon D-vitaminoinnista. Available online: http://www.finlex.fi/fi/laki/alkup/2016/20160754 (accessed on 1 March 2018).
- Nasjonalt råd for ernaering. Tiltak for å Sikre en God Vitamin D-Status I Befolkningen. 2006. Available online: https://helsedirektoratet.no/Documents/Om%20oss/R%C3%A5d%20og%20utvalg/Nasjonalt%20r%C3%A5d%20for%20ern%C3%A6ring/Tiltak%20for%20%C3%A5%20sikre%20en%20god%20vitamin%20D-status%20i%20befolkningen%20IS-1408.pdf (accessed on 1 January 2018).
- Livsmedelsverket. Livsmedelverkets Föreskrifter (SLVFS 1983:2) om Berikning av Vissa Livsmedel (Food Agency’s Order about Fortification of Foodstuffs). Available online: https://www.livsmedelsverket.se/globalassets/om-oss/lagstiftning/berikn—kosttillsk—livsm-spec-gr-fsmp/slvfs-1983-02-kons.pdf (accessed on 1 January 2018).
- Livsmedelsverket. Livsmedelverkets föreskrifter (LIVSFS 2018:5) om berikning av vissa livsmedel (Food Agency’s order about fortification of foodstuffs). Available online: https://www.livsmedelsverket.se/globalassets/om-oss/lagstiftning/berikn—kosttillsk—livsm-spec-gr-fsmp/livsfs-2018-5_web.pdf (accessed on 1 June 2018).
- Department of Health. Regulations Amending Certain Regulations Made Under the Food and Drugs Act (Nutrition Symbols, Other Labelling Provisions Partially Hydrogenated Oils and Vitamin D.). Can. Gazette. 2018, 152, 6. Available online: http://gazette.gc.ca/rp-pr/p1/2018/2018-02-10/pdf/g1-15206.pdf (accessed on 1 June 2018).
- Calvo, M.S.; Whiting, S.J. Vitamin D Fortification in North America: Current Status and Future Considerations. In The Handbook of Food Fortification from Concepts to Public Health Applications; Preedy, R.V., Srirajaskanthan, R., Patel, V., Eds.; Springer Science + Business Media: New York, NY, USA, 2013; Volume 2, pp. 259–271. [Google Scholar]
- Black, L.J.; Walton, J.; Flynn, A.; Kiely, M. Adequacy of vitamin D intakes in children and teenagers from the base diet, fortified foods and supplements. Public Health Nutr. 2014, 17, 721–731. [Google Scholar] [CrossRef] [PubMed]
- Cribb, V.L.; Northstone, K.; Hopkins, D.; Emmett, P.M. Sources of vitamin D and calcium in the diets of preschool children in the UK and the theoretical effect of food fortification. J. Hum. Nutr. Diet. 2015, 28, 583–592. [Google Scholar] [CrossRef] [PubMed]
- Hennessy, Á.; Browne, F.; Kiely, M.; Walton, J.; Flynn, A. The role of fortified foods and nutritional supplements in increasing vitamin D intake in Irish preschool children. Eur. J. Nutr. 2017, 56, 1219–1231. [Google Scholar] [CrossRef] [PubMed]
- González-Rodríguez, L.G.; Estaire, P.; Peñas-Ruiz, C.; Ortega, R.M.; UCM Research Group VALORNUT (920030). Vitamin D intake and dietary sources in a representative sample of Spanish adults. J. Hum. Nutr. Diet. 2013, 26, 64–72. [Google Scholar] [CrossRef] [Green Version]
- Jayaratne, N.; Hughes, M.C.; Ibiebele, T.I.; Van den Akker, S.; Van der Pols, J.C. Vitamin D intake in Australian adults and the modeled effects of milk and breakfast cereal fortification. Nutrition 2013, 29, 1048–1053. [Google Scholar] [CrossRef] [PubMed] [Green Version]
- Black, L.J.; Seamans, K.M.; Cashman, K.D.; Kiely, M. An updated systematic review and meta-analysis of the efficacy of vitamin D food fortification. J. Nutr. 2012, 142, 1102–1108. [Google Scholar] [CrossRef] [PubMed]
- McKenna, M.J.; Freaney, R.; Byrne, P.; McBrinn, Y.; Murray, B.; Kelly, M.; Donne, B.; O’Brien, M. Safety and efficacy of increasing wintertime vitamin D and calcium intake by milk fortification. QJM 1995, 88, 895–898. [Google Scholar] [PubMed]
- Keane, E.M.; Healy, M.; O’Moore, R.; Coakley, D.; Walsh, J.B. Vitamin D-fortified liquid milk: Benefits for the elderly community-based population. Calcif. Tissue Int. 1998, 62, 300–302. [Google Scholar] [CrossRef] [PubMed]
- Daly, R.M.; Brown, M.; Bass, S.; Kukuljan, S.; Nowson, C. Calcium- and vitamin D3-fortified milk reduces bone loss at clinically relevant skeletal sites in older men: A 2-year randomized controlled trial. J. Bone Miner. Res. 2006, 21, 397–405. [Google Scholar] [CrossRef] [PubMed]
- Kukuljan, S.; Nowson, C.; Bass, S.; Sanders, K.; Nicholson, G.C.; Seibel, M.J.; Salmon, J.; Daly, R.M. Effects of a multi-component exercise program and calcium-vitamin-D3-fortified milk on bone mineral density in older men: A randomised controlled trial. Osteoporos. Int. 2009, 20, 1241–1251. [Google Scholar] [CrossRef] [PubMed]
- Nikooyeh, B.; Neyestani, T.R.; Farvid, M.; Alavi-Majd, H.; Houshiarrad, A.; Kalayi, A.; Shariatzadeh, N.; Gharavi, A.; Heravifard, S.; Tayebinejad, N.; et al. Daily consumption of vitamin D− or vitamin D + calcium-fortified yogurt drink improved glycemic control in patients with type 2 diabetes: A randomized clinical trial. Am. J. Clin. Nutr. 2011, 93, 764–771. [Google Scholar] [CrossRef] [PubMed]
- Shab-Bidar, S.; Neyestani, T.R.; Djazayery, A.; Eshraghian, M.R.; Houshiarrad, A.; Gharavi, A.; Kalayi, A.; Shariatzadeh, N.; Zahedirad, M.; Khalaji, N.; et al. Regular consumption of vitamin D-fortified yogurt drink (Doogh) improved endothelial biomarkers in subjects with type 2 diabetes: A randomized double-blind clinical trial. BMC Med. 2011, 9, 125. [Google Scholar] [CrossRef] [PubMed]
- Jääskeläinen, T.; Itkonen, S.T.; Lundqvist, A.; Erkkola, M.; Koskela, T.; Lakkala, K.; Dowling, K.G.; Hull, G.; Kröger, H.; Karppinen, J.; et al. The positive impact of general food fortification policy on vitamin D status in a representative adult Finnish population: Evidence from an 11-year follow-up based on standardized 25-hydroxyvitamin D. data. Am. J. Clin. Nutr. 2017, 105, 1512–1520. [Google Scholar] [CrossRef] [PubMed]
- Institute of Medicine Food and Nutrition Board. Dietary Reference Intakes for Adequacy: Calcium and Vitamin D; The National Academies Press: Washington, DC, USA, 2011. [Google Scholar]
- Holm Totland, T.; Kjerpeseth Melnaes, B.; Lundberg-Hallén, N.; Helland-Kigen, K.M.; Lund-Blix, N.A.; Borch Myhre, J.; Wetting Johansen, A.M.; Bjørge Løken, E.; Frost Andersen, L. A representative Study on Nutrient Intakes among 18–70 Year-Old Men and Women in Norway). Available online: https://helsedirektoratet.no/Lists/Publikasjoner/Attachments/301/Norkost-3-en-landsomfattende-kostholdsundersokelse-blant-menn-og-kvinner-i-norge-i-alderen-18-70-ar-2010-11-IS-2000.pdf (accessed on 1 June 2018).
- Amcoff, E.; Edberg, A.; Enghardt Barbieri, H.; Lindroos, A.K.; Nälsén, C.; Pearson, M.; Warensjö Lemming, E. Livsmedels-och näringsintag bland vuxna i Sverige. Available online: https://www.livsmedelsverket.se/globalassets/publikationsdatabas/rapporter/2011/riksmaten_2010_20111.pdf?id=3588 (accessed on 1 June 2018).
- Cole, C.R.; Grant, F.K.; Tangpricha, V.; Swaby-Ellis, E.D.; Smith, J.L.; Jacques, A.; Chen, H.; Schleicher, R.L.; Ziegler, T.R. 25-hydroxyvitamin D status of healthy, low-income, minority children in Atlanta, Georgia. Pediatrics 2010, 125, 633–639. [Google Scholar] [CrossRef] [PubMed]
- Mark, S.; Lambert, M.; Delvin, E.E.; O’Loughlin, J.; Tremblay, A.; Gray-Donald, K. Higher vitamin D intake is needed to achieve serum 25(OH)D levels greater than 50 nmol/L in Québec youth at high risk of obesity. Eur J. Clin Nutr 2011, 65, 486–492. [Google Scholar] [CrossRef] [PubMed]
- Soininen, S.; Eloranta, A.M.; Lindi, V.; Venäläinen, T.; Zaproudina, N.; Mahonen, A.; Lakka, T.A. Determinants of serum 25-hydroxyvitamin D concentration in Finnish children: The Physical Activity and Nutrition in Children (PANIC) study. Br. J. Nutr. 2016, 115, 1080–1091. [Google Scholar] [CrossRef] [PubMed]
- Piirainen, T.; Laitinen, K.; Isolauri, E. Impact of national fortification of fluid milks and margarines with vitamin D on dietary intake and serum 25-hydroxyvitamin D concentration in 4-year-old children. Eur. J. Clin. Nutr. 2007, 61, 123–128. [Google Scholar] [CrossRef] [PubMed]
- Poliquin, S.; Joseph, L.; Gray-Donald, K. Calcium and vitamin D intakes in an adult Canadian population. Can. J. Diet. Pract. Res. 2009, 70, 21–27. [Google Scholar] [CrossRef] [PubMed]
- Moore, C.; Murphy, M.M.; Keast, D.R.; Holick, M.F. Vitamin D intake in the United States. J. Am. Diet. Assoc. 2004, 104, 980–983. [Google Scholar] [CrossRef] [PubMed]
- Vatanparast, H.; Calvo, M.S.; Green, T.J.; Whiting, S.J. Despite mandatory fortification of staple foods, vitamin D intakes of Canadian children and adults are inadequate. J. Steroid. Biochem. Mol. Biol. 2010, 121, 301–303. [Google Scholar] [CrossRef] [PubMed]
- Hill, K.M.; Jonnalagadda, S.S.; Albertson, A.M.; Joshi, N.A.; Weaver, C.M. Top food sources contributing to vitamin D intake and the association of ready-to-eat cereal and breakfast consumption habits to vitamin D intake in Canadians and United States Americans. J. Food. Sci. 2012, 77, H170–175. [Google Scholar] [CrossRef] [PubMed]
- Moore, C.E.; Radcliffe, J.D.; Liu, Y. Vitamin D intakes of adults differ by income, gender and race/ethnicity in the USA, 2007 to 2010. Public Health Nutr. 2014, 17, 756–763. [Google Scholar] [CrossRef] [PubMed]
- Kolahdooz, F.; Barr, A.; Roache, C.; Sheehy, T.; Corriveau, A.; Sharma, S. Dietary adequacy of vitamin D and calcium among Inuit and Inuvialuit women of child-bearing age in Arctic Canada: A growing concern. PLoS ONE 2013, 8, e78987. [Google Scholar] [CrossRef] [PubMed]
- Levy, M.A.; McKinnon, T.; Barker, T.; Dern, A.; Helland, T.; Robertson, J.; Cuomo, J.; Wood, T.; Dixon, B.M. Predictors of vitamin D status in subjects that consume a vitamin D supplement. Eur. J. Clin. Nutr. 2015, 69, 84–89. [Google Scholar] [CrossRef] [PubMed]
- O’Dowd, K.J.; Clemens, T.L.; Kelsey, J.L.; Lindsay, R. Exogenous calciferol (vitamin D) and vitamin D endocrine status among elderly nursing home residents in the New York City area. J. Am. Geriatr. Soc. 1993, 41, 414–421. [Google Scholar] [CrossRef] [PubMed]
- Kinyamu, H.K.; Gallagher, J.C.; Rafferty, K.A.; Balhorn, K.E. Dietary calcium and vitamin D intake in elderly women: Effect on serum parathyroid hormone and vitamin D. metabolites. Am. J. Clin. Nutr. 1998, 67, 342–348. [Google Scholar] [CrossRef] [PubMed]
- Raulio, S.; Erlund, I.; Männistö, S.; Sarlio-Lähteenkorva, S.; Sundvall, J.; Tapanainen, H.; Vartiainen, E.; Virtanen, S.M. Successful nutrition policy: Improvement of vitamin D intake and status in Finnish adults over the last decade. Eur. J. Public Health 2017, 27, 268–273. [Google Scholar] [CrossRef] [PubMed]
- Abu Shady, M.M.; Youssef, M.M.; Salah El-Din, E.M.; Abdel Samie, O.M.; Megahed, H.S.; Salem, S.M.; Mohsen, M.A.; Abdel Aziz, A.; El-Toukhy, S. Predictors of serum 25-hydroxyvitamin D concentrations among a sample of Egyptian schoolchildren. Sci. World J. 2016, 2016, 8175768. [Google Scholar] [CrossRef] [PubMed]
- Gharaibeh, M.A.; Stoecker, B.J. Assessment of serum 25(OH)D concentration in women of childbearing age and their preschool children in Northern Jordan during summer. Eur. J. Clin. Nutr. 2009, 63, 1320–1326. [Google Scholar] [CrossRef] [PubMed] [Green Version]
- Rosendahl, J.; Fogelholm, M.; Pelkonen, A.; Mäkelä, M.J.; Mäkitie, O.; Erkkola, M. A history of cow’s milk allergy is associated with lower vitamin D status in schoolchildren. Horm. Res. Paediatr. 2017, 88, 244–250. [Google Scholar] [CrossRef] [PubMed]
- Lee, G.J.; Birken, C.S.; Parkin, P.C.; Lebovic, G.; Chen, Y.; L’Abbé, M.R.; Maguire, J.L. TARGet Kids! Collaboration. Consumption of non-cow’s milk beverages and serum vitamin D levels in early childhood. CMAJ 2014, 186, 1287–1293. [Google Scholar] [CrossRef] [PubMed]
- Munasinghe, L.L.; Yuan, Y.; Willows, N.D.; Faught, E.L.; Ekwaru, J.P.; Veugelers, P.J. Vitamin D deficiency and sufficiency among Canadian children residing at high latitude following the revision of the RDA of vitamin D intake in 2010. Br. J. Nutr. 2017, 117, 457–465. [Google Scholar] [CrossRef] [PubMed]
- Munasinghe, L.L.; Yuan, Y.; Willows, N.D.; Faught, E.L.; Ekwaru, J.P.; Veugelers, P.J. Vitamin D deficiency and sufficiency among Canadian children residing at high latitude following the revision of the RDA of vitamin D intake in 2010—CORRIGENDUM. Br. J. Nutr. 2017, 117, 1052–1054. [Google Scholar] [CrossRef] [PubMed]
- Rodríguez-Rodríguez, E.; Aparicio, A.; López-Sobaler, A.M.; Ortega, R.M. Vitamin D status in a group of Spanish schoolchildren. Minerva Pediatr. 2011, 63, 11–18. [Google Scholar] [PubMed]
- Barman, M.; Jonsson, K.; Hesselmar, B.; Sandin, A.; Sandberg, A.S.; Wold, A.E. No association between allergy and current 25-hydroxy vitamin D in serum or vitamin D intake. Acta Paediatr. 2015, 104, 405–413. [Google Scholar] [CrossRef] [PubMed]
- Öberg, J.; Jorde, R.; Almås, B.; Emaus, N.; Grimnes, G. Vitamin D deficiency and lifestyle risk factors in a Norwegian adolescent population. Scand. J. Public Health 2014, 42, 593–602. [Google Scholar] [CrossRef] [PubMed]
- Charatcharoenwitthaya, N.; Nanthakomon, T.; Somprasit, C.; Chanthasenanont, A.; Chailurkit, L.O.; Pattaraarchachai, J.; Ongphiphadhanakul, B. Maternal vitamin D status, its associated factors and the course of pregnancy in Thai women. Clin. Endocrinol. (Oxf.) 2013, 78, 126–133. [Google Scholar] [CrossRef] [PubMed]
- Hauta-Alus, H.H.; Holmlund-Suila, E.M.; Rita, H.J.; Enlund-Cerullo, M.; Rosendahl, J.; Valkama, S.M.; Helve, O.M.; Hytinantti, T.K.; Surcel, H.M.; Mäkitie, O.M.; et al. Season, dietary factors, and physical activity modify 25-hydroxyvitamin D concentration during pregnancy. Eur. J. Nutr. 2018, 57, 1369–1379. [Google Scholar] [CrossRef] [PubMed]
- Hobbs, R.D.; Habib, Z.; Alromaihi, D.; Idi, L.; Parikh, N.; Blocki, F.; Rao, D.S. Severe vitamin D deficiency in Arab-American women living in Dearborn, Michigan. Endocr. Pract. 2009, 15, 35–40. [Google Scholar] [CrossRef] [PubMed]
- Langlois, K.; Greene-Finestone, L.; Little, J.; Hidiroglou, N.; Whiting, S. Vitamin D status of Canadians as measured in the 2007 to 2009 Canadian Health Measures Survey. Health Rep. 2010, 21, 47–55. [Google Scholar] [PubMed]
- Burgaz, A.; Akesson, A.; Oster, A.; Michaëlsson, K.; Wolk, A. Associations of diet, supplement use, and ultraviolet B radiation exposure with vitamin D status in Swedish women during winter. Am. J. Clin. Nutr. 2007, 86, 1399–1404. [Google Scholar] [CrossRef] [PubMed] [Green Version]
- McCarroll, K.; Beirne, A.; Casey, M.; McNulty, H.; Ward, M.; Hoey, L.; Molloy, A.; Laird, E.; Healy, M.; Strain, J.J.; et al. Determinants of 25-hydroxyvitamin D in older Irish adults. Age Ageing 2015, 44, 847–853. [Google Scholar] [CrossRef] [PubMed] [Green Version]
- Carter, G.D. 25-hydroxyvitamin D: A difficult analyte. Clin. Chem. 2012, 58, 486–488. [Google Scholar] [CrossRef] [PubMed]
- Binkley, N.; Carter, G.D. Toward clarity in clinical vitamin D status assessment: 25(OH)D assay standardization. Endocrinol. Metab. Clin. N. Am. 2017, 46, 885–899. [Google Scholar] [CrossRef] [PubMed]
- Harika, R.K.; Dötsch-Klerk, M.; Zock, P.L.; Eilander, A. Compliance with Dietary Guidelines and Increased Fortification Can Double Vitamin D Intake: A. Simulation Study. Ann. Nutr. Metab. 2016, 69, 246–255. [Google Scholar] [CrossRef] [PubMed]
- Allen, R.E.; Dangour, A.D.; Tedstone, A.E.; Chalabi, Z. Does fortification of staple foods improve vitamin D intakes and status of groups at risk of deficiency? A United Kingdom modeling study. Am. J. Clin. Nutr. 2015, 102, 338–344. [Google Scholar] [CrossRef] [PubMed] [Green Version]
- Brown, J.; Sandmann, A.; Ignatius, A.; Amling, M.; Barvencik, F. New perspectives on vitamin D food fortification based on a modeling of 25(OH)D concentrations. Nutr. J. 2013, 12, 151. [Google Scholar] [CrossRef] [PubMed] [Green Version]
- Kehoe, L.; Walton, J.; McNulty, B.A.; Nugent, A.P.; Flynn, A. Dietary strategies for achieving adequate vitamin D and iron intakes in young children in Ireland. J. Hum. Nutr. Diet. 2017, 30, 405–416. [Google Scholar] [CrossRef] [PubMed]


| Country | Vitamin D-Fortified Milk Products | Type of Fortification | Added Amount of Vitamin D | New Proposed Amounts of Vitamin D |
|---|---|---|---|---|
| Finland [6,7] | fluid milk products (milk, yoghurt, sourmilk) * | voluntary | 1 µg/100 g | na |
| Norway [8] | extra low-fat milk (also lactose free) | voluntary | 0.4 µg/100 g | na |
| Sweden [9,10] | low-fat milk (max 1.5% fat) | mandatory | 0.38–0.50 µg/100 g | 0.95–1.10 µg/100 g for milk <3% fat 0.75–1.10 µg/100 g for fermented milk <3% fat |
| Canada [11] | milk | mandatory | 0.825–1.125 µg/100 g | 2 µg/100 g |
| United States [12] | fluid milk (also acidified milk and cultured milk), yoghurt | voluntary ‡ | 1.05 µg/100 g for milk 2.225 µg/100 g for yoghurt § | na |
| Reference | Country | Study Population | Dietary Assessment Method | Total/Dietary Vitamin D Intake (µg/day) | SD(or SEM *) | Vitamin D Intake from (fortified) Fluid Milk or Related Products (µg/day) | SD | Contribution of (Fortified) Milk to Total or Dietary Vitamin D Intake (%) |
|---|---|---|---|---|---|---|---|---|
| Children and adolescents | ||||||||
| Black et al. (2014) [13] | Ireland | 594 children, 5–12 years and 441 teenagers, 13–17 years | 7-day (semi-) weighted food record | Total/dietary intake 5–8 years: 2.8/1.9 9–12 years: 2.8/2.2 13–17 years: 3.2/2.6 | 2.4/1.1 2.1/1.3 2.5/1.8 | Fortified milk: 0.1 Milk and yoghurt: 0.3–0.4 | na | Total intake Fortified milk: 2–3% Milk and yoghurt: 10–13% |
| Cole et al. (2010) [29] | United States | 290 children, 1–5 years | 3-day food record | Dietary intake: 4.4 | 3.0 | Fortified milk: 2.7 † | na | Dietary intake Fortified milk: 62% |
| Cribb et al. (2015) [14] | United Kingdom | 755 children, 1.5 years and 3.5 years | 3-day food diary | Dietary intake 1.5 years: 1.6 3.5 years: 1.8 | 1.5 1.4 | Yoghurt, cheese and milk 1.5 years: 0.035 µg/MJ/day 3.5 years: 0.023 µg/MJ/day | 0.02 µg/MJ/day 0.02 µg/MJ/day | Dietary intake Yoghurt, cheese and milk 1.5 years: 9% 3.5 years: 6% |
| Hennessy et al. (2016) [15] | Ireland | 500 children, 1–4 years | 4-day weighted food diary | Total intake All subjects: 3.5 Fortified food consumers: 3.2 | 3.7 2.7 | Fortified milk All subjects: 0.1 Fortified food consumers: 0.1 | na | Total intake All subjects: 2% Fortified food consumers, supplement non-users: 13% |
| Mark et al. (2011) [30] | Canada | 159 children, 8–11 years | 3 × 24 h recalls | Total/dietary intake: 6.6/5.6 | 4.3/3.5 | Milk: 3.3 † | na | Total/dietary intake Milk: 49/58% |
| Piirainen et al. (2007) [32] | Finland | 36 children, 4 years | 4-day food record | Total/dietary intake: 7.9/4.5 | 6.3–9.6/3.8–5.1 § | 2.3 | 2.0–2.6 § | Total intake Milk: 54% |
| Soininen et al. (2016) [31] | Finland | 374 children, 6–8 years | 4-day food record | Total/dietary intake: 7.7/5.9 | na/2.1 | Fluid milk: 2.9 All milk products: 3.1 | 1.5 1.4 | Total/dietary intake Fluid milk: 38/49% All milk products: 40/52% |
| Adults and the elderly | ||||||||
| Amcoff et al. (2012) [28] | Sweden | 1797 adults, 18–80 years | 4-day food diary | Dietary intake Women: 6.4 Men: 7.6 | 4.2/5.4 | na | na | Dietary intake Milk products: 12% |
| Gonzalez-Rodriguez et al. (2013) [16] | Spain | 418 adults, 18–60 years | 24 h recall | Total/dietary intake: 3.5/3.2 | 4.0/3.8 | Dairy products: 0.5 † | na | Total/dietary intake Dairy products: 15/17% |
| Holm Totland et al. (2012) [27] | Norway | 1787 adults, 18–70 years | 24 h recall | Total/dietary intake Women: 10/4.9 Men: 12/6.7 | na/4.3 na/5.7 | na | na | Dietary intake Vitamin D fortified extra-skimmed milk: 4% |
| Jayaratne et al. (2013) [17] | Australia | 785 adults, ≥31 years | FFQ | Total intake: 4.4 | 4.0 | Dairy and related products including margarine: 1.9 † Milk: 0.8 † Yoghurt: 0.3 † | na na na | Total intake Dairy and related products including margarine: 43% Milk: 18% Yoghurt: 6% |
| Jääskeläinen et al. (2017) [25] | Finland | 3635 adults, ≥30 years | FFQ | Dietary intake Men: 14 Women: 12 | 14–15 § 11–12 § | na | na | Dietary intake Fluid milk products: 34% |
| Kinyamu et al. (1998) [41] | United States | 376 elderly women, 65–77 years | 7-day food record | Total intake Supplement non-users: 3.5 Supplement users: 13.4 | 2.2 2.0 | Milk Supplement non-users: 2.0 Supplement users: 1.8 | 1.6 1.5 | Total intake Milk: 51% |
| Kolahdooz et al. (2013) [38] | Canada | 203 Inuit and Inuvialuit women, 19–44 years | FFQ | All subjects: 6.0 ‡ Traditional food eaters: 7.1 ‡ Non-traditional food eaters: 4.9 ‡ | 6.3 5.3 3.2 | Dairy group (milk, yoghurt, cheese and eggs) Traditional food eaters: 2.2 Non-traditional food eaters: 1.9 | na na | Dairy group (milk, yoghurt, cheese and eggs) Traditional food eaters: 31% ‡ Non-traditional food eaters: 39% ‡ |
| Levy et al. (2015) [39] | United States | 743 adults, 20–65 years | one week diet history | Total intake Winter season: 4.5 Summer season: 4.3 | 4.0 3.2 | Dairy products Winter season: 1.9 Summer season: 1.9 | 2.5 3.8 | Dietary intake Winter season: 43% Summer season: 41% |
| Moore et al. (2014) [37] | United States | 9719 adults, ≥19 years | 24 h recall | Total/dietary intake 8.6/4.4 | 0.3/0.1 * | Milk and milk drinks: 1.7 † Fortified milk and milk products: 1.9 † | na na | Total/dietary intake Milk and milk drinks: 20/39% Fortified milk and milk products: 22/44% |
| O’Dowd et al. (1993) [41] | United States | 109 elderly, >60 years | FFQ or 3-day dietary record | Total/dietary intake All subjects: 9.5/ Supplement non-users: 7.3 | 5.1/2.5 | Fortified milk All subjects: 4.7 | 1.9 | Total intake Fortified milk: 50% |
| Poliquin et al. (2009) [33] | Canada | 9425 adults, ≥25 years | interview-administered semi-quantitative FFQ | Total intake from milk and supplements Women: 5.6 Men: 4.8 | 5.9 5.5 | Milk Women: 2.7 Men: 3.0 | 2.9 3.5 | Total intake from milk and supplements Women: 48% Men: 63% |
| Raulio et al. (2017) [42] | Finland | 1295 adults, 25–64 years | 24 h recall | Total intake Women: all women: 17.5 Supplement non-users: 8.6 Supplement users: 24.7 Men: all men: 17.3 Supplement non-users: 11.2 Supplement users: 29.5 | 15.4 6.2 16.8 17.0 7.5 23.1 | na | na | Dietary intake Milk: 28–39%, depending on age and sex |
| All ages | ||||||||
| Hill et al. (2012) [36] | United States and Canada | 7837 US and 4025 Canadian citizens, ≥2 years | 7- to 14-day household food diary | Total intake United States: 4.4 Canada: 4.2 | 0.03 * 0.5 * | Milk United States: 2.0 Canada: 1.9 | na na | Total intake Milk: 44% in both countries |
| Moore et al. (2004) [34] | United States | 18931 subjects, >1 years | 24 h recall | Total/dietary intake: 5.3–9.8/3.9–7.0 depending on age and sex | na | na | na | Dietary intake Dairy products: 45–47% |
| Vatanparast et al. (2010) [35] | Canada | 34789 subjects, >1 years | 24 h recall | Dietary intake: 6.2 | 0.1 * | Milk products: 2.9 | na | Dietary intake Milk products: 49% |
| Reference | Country (Latitude) | Season Blood Drawn | Study Population | 25(OH)D Assay Method (Quality Control of Assay: Certificate; CV% <15%) | Dietary Assessment Method | Serum or Plasma 25(OH)D nmol/L Mean (or Median *) | SD (or IQR † or 95% CI ‡ or SE §) |
|---|---|---|---|---|---|---|---|
| Children and adolescents | |||||||
| Abu Shady et al. (2016) [43] | Egypt (31° N) | April, May | 200 children, 9–11 years | Quantitative enzyme immunoassay (na; na) | Questionnaire | 41 | 14 |
| Barman et al. (2015) [50] | Sweden (63° N) | All | 165 children, 13 years | LC-MS/MS (na; na) | FFQ | 51 | 14 |
| Cole et al. (2010) [29] | United States (33° N) | All | 290 children, 1–5 years | LC-MS/MS (na; na) | 3-day food record | 65 | 19 |
| Lee et al. (2014) [46] | Canada (43° N) | All | 2468 children, 1–6 years | Diasorin LIAISON (na; yes except inter CV% 17.4% at high concentrations) | Questionnaire | 80 * | 66–99 † |
| Mark et al. (2011) [30] | Canada (45° N) | All | 159 children, 8–11 years | IDS radioimmunoassay (na; yes) | 3 × 24 h recalls | Winter/spring: 50 Summer/autumn: 58 | 10 15 |
| Munasinghe et al. (2017) [47,48] | Canada (various latitudes) | All | 2270 children, 3–18 years | Diasorin LIAISON (na; yes) | FFQ | 62 | 56–69 ‡ |
| Rodríguez–Rodríguez et al. (2011) [49] | Spain (40° N) | February | 102 children, 9–13 years | Chemiluminescence (na; na) | 3-day weighted food diary | 50 | 16 |
| Rosendahl et al. (2017) [45] | Finland (60° N) | January–June | 171 children, 10 years | Roche Diagnostics immunocheminuminescence (na; na) | FFQ | 73 | 22 |
| Soininen et al. (2016) [31] | Finland (62° N) | All but July | 374 children, 6–8 years | Diasorin LIAISON (na; yes) | 4-day food record | 69 | 24 |
| Öberg et al. (2014) [51] | Norway (69° N) | September–April | 890 children, 15–18 years | LC–MS/MS (DEQAS; yes) | Questionnaire | Boys: 41 Girls: 54 | 21 23 |
| Pregnant women and mother-child pairs | |||||||
| Charatcharoenwitthaya et al. (2013) [52] | Thailand (14° N) | Winter season: 72%, rainy season: 28% | 120 pregnant women, 18–40 years | LC–MS/MS MassCrom (na; yes) | Interviewed questionnaire | 1st trimester: 61 2nd trimester: 84 3rd trimester: 90 | 17 20 22 |
| Gharaibeh et al. (2009) [44] | Jordan (31° N) | June and July | 93 children (4–5 years) and mothers (mean age 34 years) dyads | IDS ELISA (na; na) | Questionnaire | Mothers: 26 Children: 56 | 10 20 |
| Hauta–alus et al. (2017) [53] | Finland (60° N) | All | 584 newborns and mothers (18–43 years) | IDS–iSYS (DEQAS; yes) | FFQ | Mothers: 89 Cord blood: 88 | 19 22 |
| Adults and the elderly | |||||||
| Burgaz et al. (2007) [56] | Sweden (60° N) | January–March | 116 elderly women, 61–86 years | IDS EIA (na; yes) | FFQ | 69 | 23 |
| Hobbs et al. (2009) [54] | United States (42° N) | April | 87 women, ≥18 years | Diasorin LIAISON (na; na) | Questionnaire | Unveiled subjects: 21 * Veiled supplement users: 17 * Veiled supplement non-users: 10 * | 14–34 † 10–29 † 5–17 † |
| Kinyamu et al. (1998) [41] | United States (41° N) | All | 376 elderly women, 65–77 years | Competitive binding assay (na; yes) | 7-day food record | Supplement non-users: 74 Supplement users: 88 | 23 28 |
| Levy et al. (2015) [39] | United States (various latitudes) | February–April and August–October | 743 adults, 20–65 years | Diasorin LIAISON (College of American Pathology; na) | One week diet history | Summer: 101 Winter: 93 | 42 39 |
| McCarroll et al. (2015) [57] | Ireland (52° N) | All | 3 cohorts (1233, 1895, 1316) of elderly subjects, >60 years | LC–MS (DEQAS; yes) | Questionnaire | Supplement non-users: 46/61/68 Supplement users: 67/83/74 | 24/32/23 27/27/30 |
| O’Dowd et al. (1993) [40] | United States (41° N) | January–May | 109 elderly, >60 years | Competitive binding assay (na; yes) | FFQ or 3-day dietary record | All subjects: 45 Supplement non-users: 40 Supplement users: 65 | 2 § 2 § 3 § |
| All ages | |||||||
| Langlois et al. (2010) [55] | Canada (various latitudes) | All | 5306 subjects, 6–79 years | Diasorin Liaison (DEQAS; yes) | Interviewed questionnaire | All subjects 68 April–October 70 November–March 64 | 65–70 ‡ 66–74 ‡ 60–68 ‡ |
© 2018 by the authors. Licensee MDPI, Basel, Switzerland. This article is an open access article distributed under the terms and conditions of the Creative Commons Attribution (CC BY) license (http://creativecommons.org/licenses/by/4.0/).
Share and Cite
Itkonen, S.T.; Erkkola, M.; Lamberg-Allardt, C.J.E. Vitamin D Fortification of Fluid Milk Products and Their Contribution to Vitamin D Intake and Vitamin D Status in Observational Studies—A Review. Nutrients 2018, 10, 1054. https://doi.org/10.3390/nu10081054
Itkonen ST, Erkkola M, Lamberg-Allardt CJE. Vitamin D Fortification of Fluid Milk Products and Their Contribution to Vitamin D Intake and Vitamin D Status in Observational Studies—A Review. Nutrients. 2018; 10(8):1054. https://doi.org/10.3390/nu10081054
Chicago/Turabian StyleItkonen, Suvi T., Maijaliisa Erkkola, and Christel J. E. Lamberg-Allardt. 2018. "Vitamin D Fortification of Fluid Milk Products and Their Contribution to Vitamin D Intake and Vitamin D Status in Observational Studies—A Review" Nutrients 10, no. 8: 1054. https://doi.org/10.3390/nu10081054