Dietary Pattern and Plasma BCAA-Variations in Healthy Men and Women—Results from the KarMeN Study
by
 , , and
Benedikt Merz
1,* ,
,
Lara Frommherz
2,
Manuela J. Rist
1,
Sabine E. Kulling
2,
Achim Bub
1 and
Bernhard Watzl
1 1
Department of Physiology and Biochemistry of Nutrition, Max Rubner-Institut, 76131 Karlsruhe, Germany
2
Department of Safety and Quality of Fruit and Vegetables, Max Rubner-Institut, 76131 Karlsruhe, Germany
*
Author to whom correspondence should be addressed.
Nutrients 2018, 10(5), 623; https://doi.org/10.3390/nu10050623
Submission received: 3 April 2018
/
Revised: 8 May 2018
/
Accepted: 11 May 2018
/
Published: 15 May 2018
Abstract
:Branched-chain amino acids (BCAA) in plasma are discussed as risk factors for the onset of several diseases. Information about the contribution of the overall diet to plasma BCAA concentrations is controversial. Our objective was to investigate which dietary pattern is associated with plasma BCAA concentrations and whether other additional nutrients besides BCAA further characterize this dietary pattern. Based on the cross-sectional KarMeN study, fasting plasma amino acid (AA) concentrations, as well as current and habitual dietary intake were assessed in 298 healthy individuals. Using reduced rank regression, we derived a habitual dietary pattern that explained 32.5% of plasma BCAA variation. This pattern was high in meat, sausages, sauces, eggs, and ice cream but low in nuts, cereals, mushrooms, and pulses. The age, sex, and energy intake adjusted dietary pattern score was associated with an increase in animal-based protein together with a decrease in plant-based protein, dietary fiber, and an unfavorable fatty acid composition. Besides BCAA, alanine, lysine and the aromatic AA were positively associated with the dietary pattern score as well. All of these factors were reported to be associated with risk of type 2 diabetes and cardiovascular diseases before. Our data suggest that rather than the dietary intake of BCAA, the overall dietary pattern that contributes to high BCAA plasma concentrations may modulate chronic diseases risk.
1. Introduction
Diet is the only source of the essential branched-chain amino acids (BCAA) isoleucine, leucine, and valine in humans. Dietary sources of these proteinogenic amino acids (AA) are protein-containing foods, with meat and dairy being the main sources in omnivores [1,2]. Plasma BCAA concentrations are furthermore influenced via catabolism of muscle protein. Due to their higher muscle mass, men are reported to have higher BCAA levels compared to women. Further, obese compared to lean individuals, as well as individuals consuming a high-protein and/or high-energy diet show higher plasma BCAA concentrations [3].
There is insufficient and contradictory data on the contribution of diet to human plasma BCAA concentrations. Rietman et al. recently concluded that about 80% of ingested dietary BCAA reach the blood circulation [4], whereas studies investigating the kinetics of BCAA report less than 40% absorption rate [5,6,7]. In contrast, observational studies reported only weak correlations between dietary and plasma BCAA concentrations [1,8,9]. Furthermore, it is unclear whether plasma BCAA concentrations may reflect short-term or long-term dietary intake [4].
Several observational studies suggest that high plasma concentrations of BCAA are associated with an increased risk of insulin resistance, type 2 diabetes (T2D) or cardiovascular diseases (CVD) [1,3,10,11]. In contrast, some intervention studies reported independent positive associations of BCAA with risk of future diabetes, but information on the composition of the overall diet as the source of these essential AA is scarce. Other studies suggested that the observed associations between BCAA and insulin resistance or T2D are only of correlative but not causal nature [12,13,14]. Nonetheless, many questions remain as to whether these BCAA are causally related with the onset of these diseases, and if causal, what the underlying mechanisms may be. It is as well currently unclear whether specific BCAA-providing foods or dietary patterns determine circulating BCAA concentrations, or whether host metabolism is the primary driver [15,16]. In particular, information on dietary patterns that contribute to BCAA levels is lacking, although especially this information is highly relevant, because BCAA are usually consumed within a dietary pattern and not as isolated nutrients. Zheng et al. [1] reported a markedly attenuated association between BCAA intake and the observed risk of future diabetes when adjusting for total protein intake—hinting for a role of the overall diet instead of an isolated BCAA effect. Furthermore, Fontana et al. [17] stated that the AA composition of the diet rather than the total protein intake affects metabolic health.
The aim of this study was therefore to identify a dietary pattern that determines plasma BCAA concentrations, and to analyze whether further nutrients, such as other AA, are associated with this dietary pattern. We hypothesized that nutrients beyond BCAA may contribute to the observed increased disease risk of Western diets.
2. Materials and Methods
2.1. Study Design
The Karlsruhe Metabolomics and Nutrition (KarMeN) Study is a cross-sectional study conducted at the Max Rubner-Institut in Karlsruhe, Germany, between 2011 and 2013, aiming to determine the impact of a number of factors on the human metabolome in healthy men and women. Study design and examination procedures are described in detail elsewhere [18]. In brief, a total of 312 voluntary individuals aged 18 to 80 years were recruited. Exclusion criteria were smoking, acute or regular medication including hormonal contraceptives for women, illness requiring treatment, supplement use, and additionally for women pregnancy or breast-feeding. Each individual visited the study center three times for a detailed characterization [18]. The study was conducted after approval of the local ethics committee (State Medical Council of Baden-Württemberg) and according to the guidelines of the Declaration of Helsinki. All participants gave written informed consent prior to study participation.
Participants were examined by trained study personnel according to standard operating procedures, and anthropometric, clinical and functional parameters were assessed [18]. On the second study center visit, participants provided a peripheral venous blood sample after an overnight fast of at least 10 h using 9 mL EDTA plasma tubes (S-Monovette, Sarstedt, Nümbrecht, Germany). Blood was centrifuged at 1850× g at 4 °C and aliquoted into small portions. In addition, serum samples (S-Monovette Z-gel, Sarstedt, Nümbrecht, Germany) were collected for standard clinical biochemistry analyses.
2.2. BCAA Measurement
A total of 21 AA (19 proteinogenic) were determined by an API 5500 Q-Trap mass spectrometer (AB Sciex Germany GmbH, Darmstadt, Germany) coupled to a Shimadzu Nexera UHPLC-system in fasting plasma samples using the Absolute IDQ™ p180 kit (Biocrates AG, Innsbruck, Austria). A 20 µL plasma aliquot was used for each extraction. Protein precipitation and subsequent derivatization with phenyl isothiocyanate was performed according to the manufacturer’s protocol prior to MS-detection. For chromatographic separation of AA a Zorbax Eclipse XDB-C18 column (3 × 100 mm, 3.5 μm; Agilent, Waldbronn, Germany) equipped with a SecurityGuard™ column (C18, 4.0 × 3.0 mm; Phenomenex, Aschaffenburg, Germany) was used. A detailed description of the preparation and quantification process can be found in Römisch-Margl et al. [19]. The Absolute IDQ™ kit provides optimized MS instrument settings and compound parameters. System control and data acquisition was carried out with Analyst 1.5.2 software. Quantification and data evaluation was done with the MetIDQ software (version 4.5.2).
The p180 kit is validated by the manufacturer according to U.S. Food and Drug Administration guidelines [20]. However, to ensure reliability of our results, quality control (QC)-samples included in the kit were injected ten times distributed between the study samples. Additionally, in order to obtain QC samples closely related to study samples (similar matrix and concentration), we also used pooled study plasma. Six replicates of this study-specific QC sample were extracted per plate and evenly distributed amongst the study samples. AA with a coefficient of variation (CV) of >20% in the QC samples (pooled study plasma) were excluded from further analysis (glutamate and glycine), CVs for the remaining AA ranged between 6.2% and 17.3% (see Table S1). Plasma BCAA refers to the single concentrations of isoleucine, leucine, and valine plasma concentrations and not the sum of BCAA. In subsequent tables and figures, AA are presented according to three-letter codes.
2.3. Dietary Assessment
Trained study personnel assessed the food intake of each individual (in g/day) on two non-consecutive days at least 4 weeks apart in a personal and a telephone interview using 24 h dietary recalls with the software EPIC-Soft [21,22]. Participants used standard units (such as slice of bread, soup bowl), household measurements (such as tablespoon) and a picture booklet providing photographs of portion sizes for various foods to indicate the consumed amount per meal. Additionally participants were requested to fill in a food frequency questionnaire (FFQ). All reported foods were then summarized into 35 food groups for further analysis (Table S2). Total energy intake (kcal/day) and intake of nutrients were estimated based on data of the German food composition database “Bundeslebensmittelschlüssel” (BLS, version 3.02) [23]. The BLS database includes data for total protein, animal-based and plant-based protein; thus, daily intake of each protein source was the sum from all food sources as well as from recipes of mixed dishes. Individual habitual intake of food groups and nutrients was estimated using the NCI method [24,25]. Within this method, habitual intake was estimated based on data of two 24 h recalls and FFQ information considering covariates age, sex, body mass index (BMI), and weekend information (Monday–Thursday = weekday, Friday–Sunday = weekend).
2.4. Statistical Analysis
Food groups and BCAA were not normally distributed and were therefore univariate Box—Cox transformed to approach normality [26] and z-standardized to ensure comparability prior to dietary pattern analysis. We used an optimization step to find the best transformation parameter (exponent lambda) between 0 and 2 for appropriate transformation of each variable; respective lambda values are available in Table S3. Reduced Rank Regression (RRR) was used to extract dietary patterns. RRR identifies linear functions of predictors (food groups) that explain as much response (BCAA) variation as possible [27], where the number of derived linear functions depends on the number of response variables (3 BCAA). The extracted RRR factor scores represent dietary patterns. We extracted current dietary patterns based on data of the first 24 h recall covering the past 24 h of the participants’ diet. Habitual dietary patterns were based on the calculated usual intakes representing an average of a period of more than 4 weeks of the participants’ diet. For the adjusted dietary patterns, we calculated univariate linear regression models with the RRR factor scores as dependent and age, sex, and total energy intake as independent variables. The residuals of these models represent age, sex, and energy intake adjusted dietary patterns, which were further investigated in subsequent analyses. We used partial Spearman rank correlations adjusted for age, sex, and total energy intake to investigate associations between the identified dietary pattern and the plasma AA profile. For descriptive statistics, we built quartiles of the adjusted RRR factor scores. For macronutrients we calculated their percentage of total energy intake (E%). All statistical analyses were performed using software SAS Version 9.4 (SAS Institute, Cary, NC, USA) with p-values < 0.05 considered as statistically significant.
3. Results
3.1. Study Population
We excluded 11 individuals due to acute medication or illness requiring treatment. Individuals with missing information for plasma BCAA (n = 1) or only one available 24 h recall (n = 2) were also excluded from the analysis. The analytical study population includes 298 individuals, 171 men (57.4%) and 127 women (42.6%) with a mean age of 44.5 and 51.6 years, respectively. Clinical parameters were within the reference ranges. General characteristics of the study population separated by sex are shown in Table 1.
3.2. Dietary Pattern Analysis
With the RRR method we derived by default a total of 6 dietary patterns (3 current and 3 habitual patterns, Table S4) that were positively correlated with the plasma BCAA concentrations. The first derived current dietary pattern covering the diet of the past 24 h, showed 19.2% of explained variance for BCAA plasma concentrations, whereas the first habitual dietary pattern, covering a period of more than 4 weeks, explained 32.5%. The remaining 4 patterns from the RRR analysis explained only a minor variation (<3.6%). Thus, we focused on the first pattern from the RRR of the habitual dietary data for all further analyses because it explains the largest amount of variation among the BCAA.
This habitual dietary pattern correlated positively with food groups including meat, sausages, sauces, eggs, and ice cream but inversely with nuts, cereals, mushrooms, and pulses (Table 2). The first current dietary pattern was comparable with the first habitual dietary pattern showing consistent positive correlations with meat, sausages, and sauces, and inverse correlations with nuts and seeds. An overview of the average consumption of each investigated food group for the adjusted first habitual dietary pattern is shown in Table S5.
Dividing our study group in four subgroups by the use of quartiles of the adjusted first habitual dietary pattern score, we observed slight differences with regard to the macronutrient composition. Between the lowest and highest quartile, we observed a mean difference of −2.7 E% for carbohydrates, 1.4 E% for fat and 0.8 E% for protein in the diet of the study participants (Table 3).
At the nutrient level, we observed a statistically significant decrease of mono- and polysaccharides, of PUFAs, and of dietary fiber intakes, whereas the intake of SFAs and MUFAs was higher with an increasing adjusted habitual dietary pattern score. Over all quartiles, study participants consumed on average a higher amount of animal-based protein compared to plant-based protein. However, the percentage of animal-based protein on total protein intake increased significantly, whereas the percentage of plant-based protein intake decreased significantly with an increasing habitual dietary pattern score (Table 3).
3.3. Associations of Plasma Amino Acid Concentrations with Dietary Pattern Score
Of the 17 investigated proteinogenic AA, we observed eight AA to be significantly correlated with the age, sex, and energy intake adjusted habitual dietary pattern score. These included alanine, lysine, phenylalanine, tryptophan, tyrosine, and the BCAA leucine, isoleucine, and valine. The strongest correlation besides the BCAA was observed for lysine followed by the three aromatic amino acids (AAA) phenylalanine, tyrosine, and tryptophan, and alanine (Table 4). The sum of the AAA correlated as well significantly with the habitual dietary pattern score.
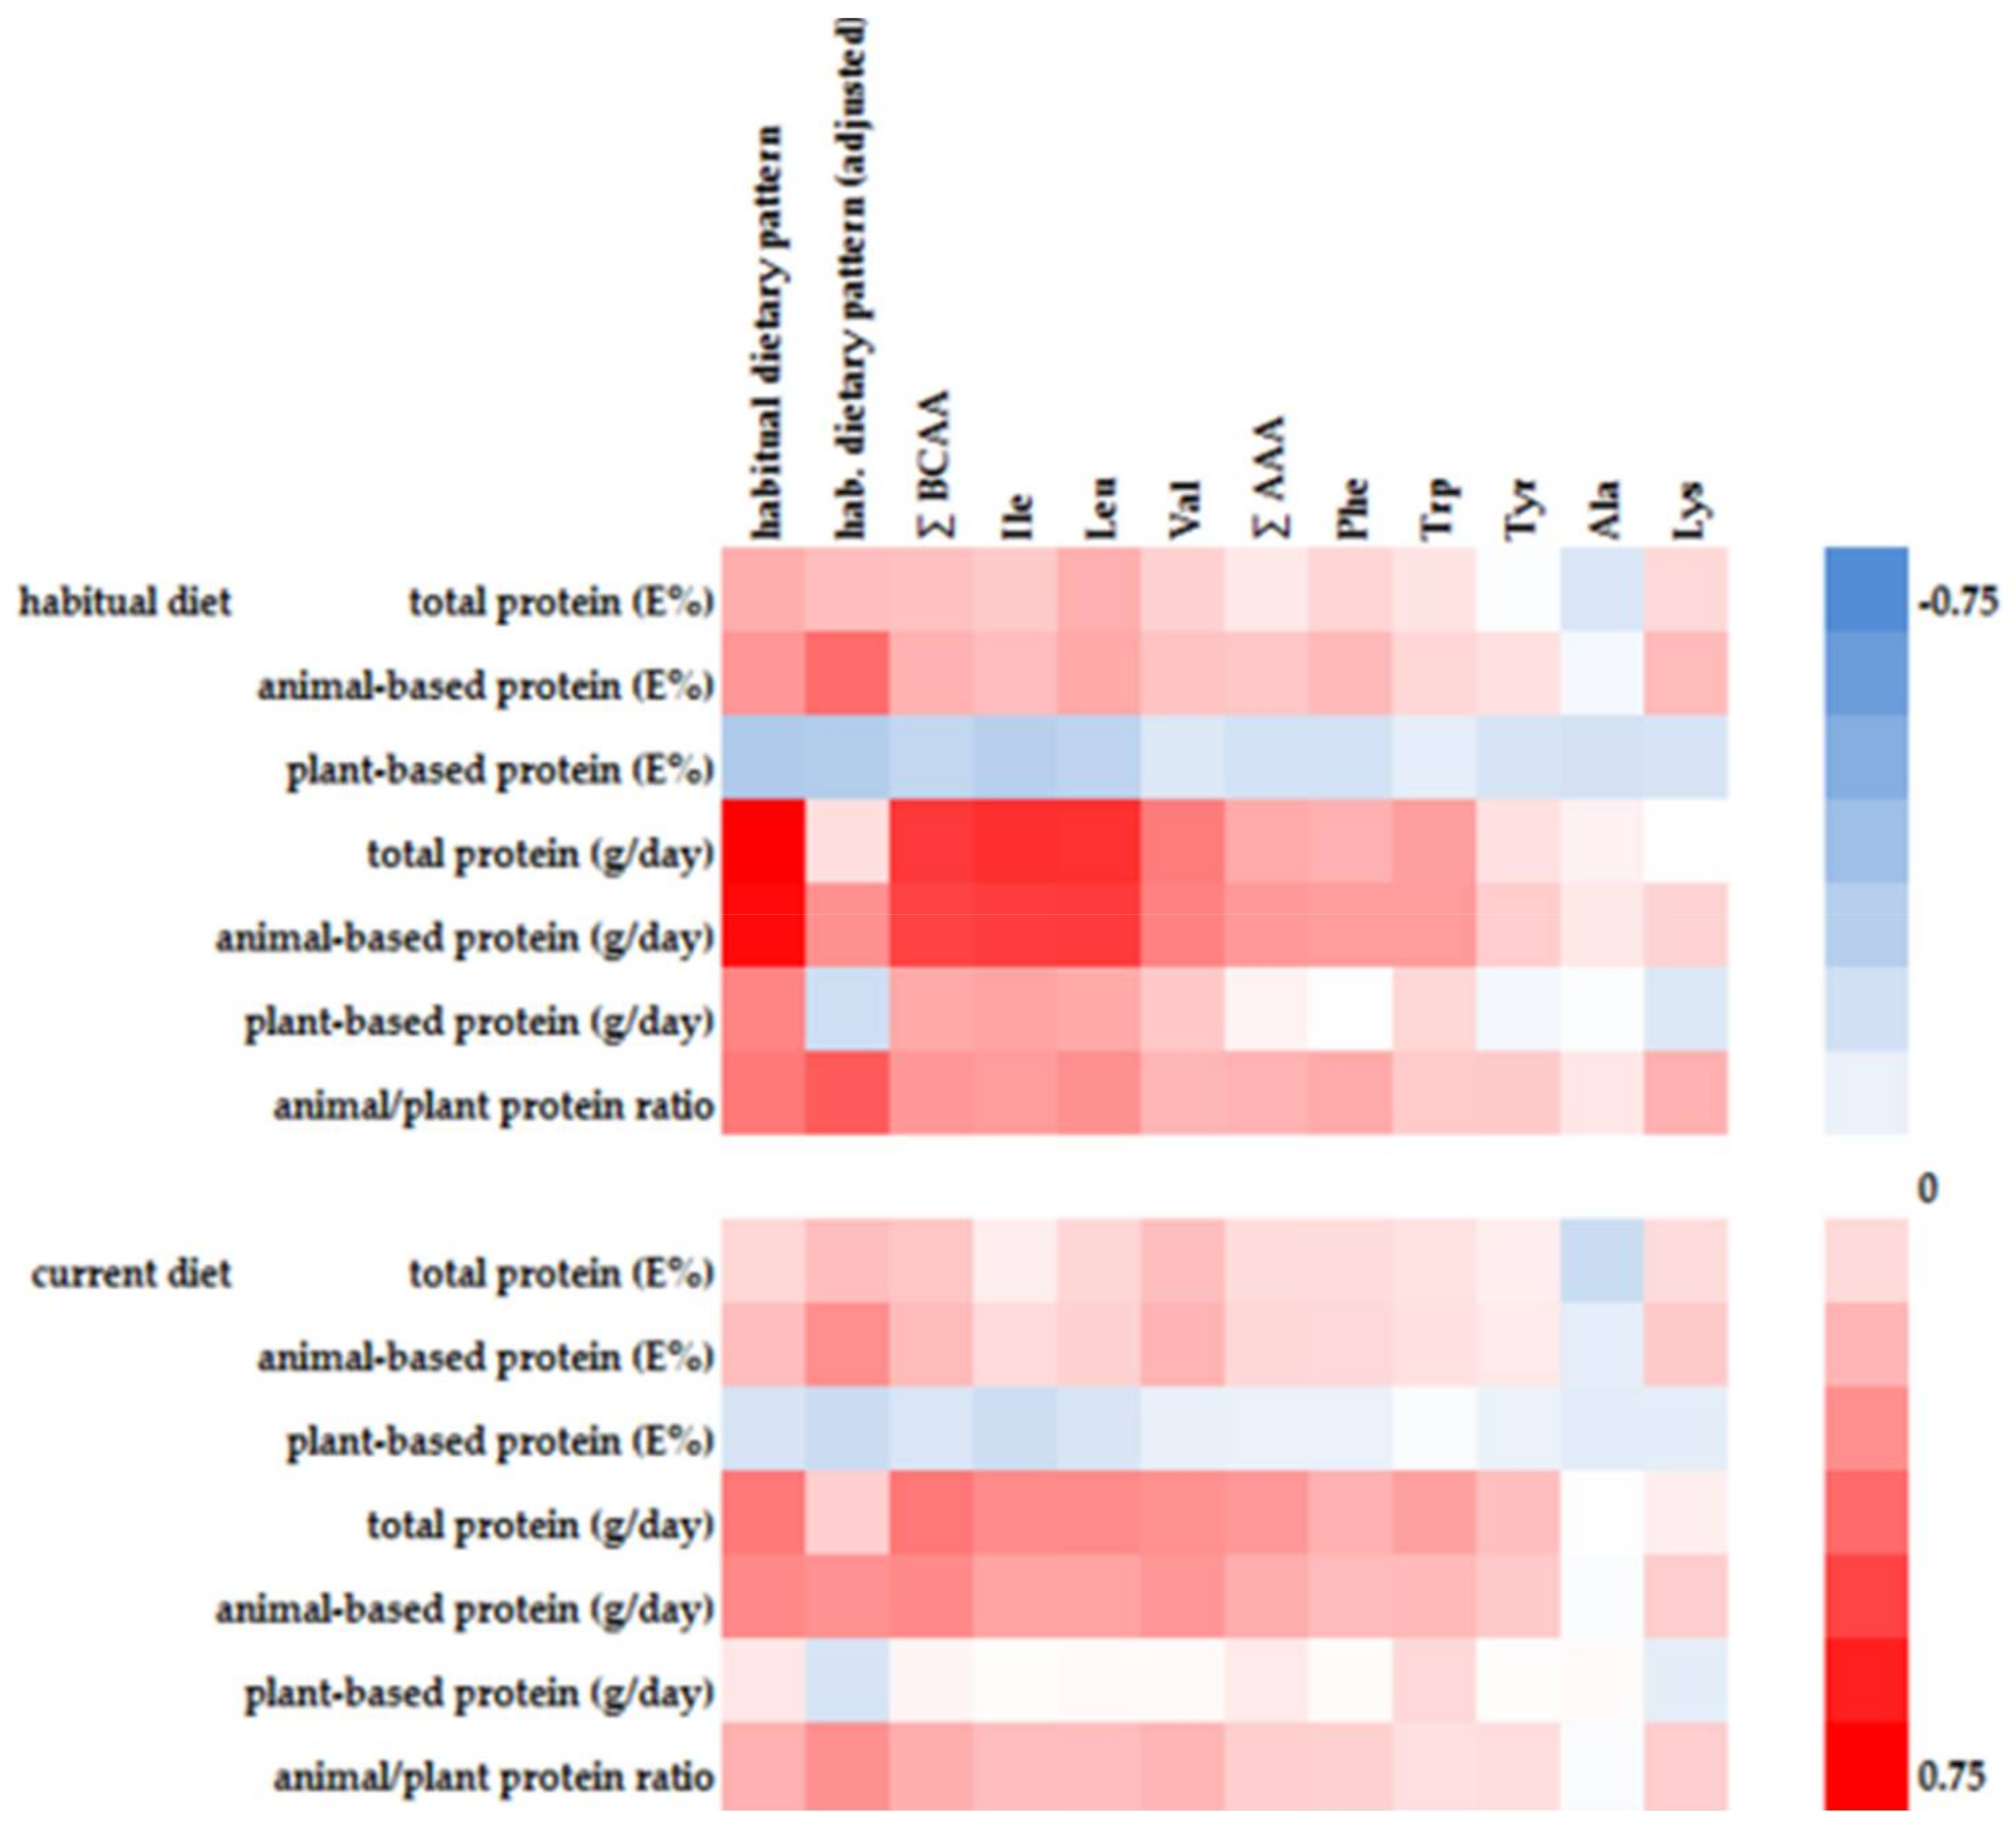
Five of the first habitual dietary pattern associated AA showed significant positive correlations with animal-based protein intake and at the same time significant inverse correlations with plant-based protein intake (Figure 1). Alanine and tyrosine were inversely associated with plant-based protein intake, whereas tryptophan was positively associated with animal-based protein intake.
4. Discussion
We have used RRR to identify dietary patterns that are correlated with plasma BCAA concentrations. Furthermore, we investigated the macronutrient and overall AA composition of the dietary pattern that explained the largest variation of plasma BCAA concentrations to identify other nutrients associated with a BCAA-rich diet. To our knowledge, we are the first group to derive an explicitly BCAA-associated dietary pattern and analyzed its composition.
4.1. Current vs. Habitual Diet
There is insufficient evidence whether plasma BCAA concentrations reflect short-term or long-term dietary intake and protein intake, respectively [4,28]. Some studies observed a correlation between dietary protein intake and plasma BCAA concentrations, whereas other studies did not [16,28]. In our study the identified first habitual dietary pattern explained more than 1.5 fold percentage variation of plasma BCAA concentrations than a comparable current dietary pattern (see Table S4). Furthermore, correlations between current protein intake and plasma BCAA concentrations were consistently weaker compared to habitual protein intake (Figure 1). Consequently, circulating BCAA are likely reflecting a long-term diet or a long-term BCAA intake, respectively, which is in line with the literature, where in particular plasma concentrations of essential AA were more closely related to habitual diet [29].
4.2. Plasma AA Concentrations and Dietary AA Composition
Compared to other healthy study populations, our study participants showed comparable plasma concentrations for valine, but higher concentrations for leucine and isoleucine [3,30]. With regard to populations with T2D or at high risk for CVD, plasma concentrations were comparable [3] or higher [25] for leucine and isoleucine and at the same time lower for valine [3,30].
Plasma concentrations of the AAA were associated with the adjusted first habitual dietary pattern score in our study. Other studies reported AAA (like the BCAA) to be associated with an increased risk for T2D [31] and CVD [32]. Both, AAA and BCAA, were shown to be part of a metabolic profile that discriminates between individuals with and without metabolic syndrome. However, the total AA concentrations had only little discriminant power [33]. Clearly, a dietary pattern contributing to high BCAA and AAA levels represents more than just the sum of its single components, enclosing as well interactive effects of nutrients and other food constituents.
Besides BCAA and AAA, two other AA were correlated with the first habitual dietary pattern score. Where BCAA have a key function in the skeletal muscle to provide nitrogen needed to maintain pools of AA such as alanine [10,34], lysine is part of the dipeptide carnitine (a nutrient high in red meat). With a carnitine and protein-rich diet, intake of lysine is increased and lysine-dependent biosynthesis of carnitine is inhibited [35]. This may further explain the positive correlation with the habitual dietary pattern in our study. As a consequence, a high intake of lysine may add to the increased risk for CVD attributed to BCAA because a carnitine-rich diet has been associated with atherosclerosis and thus CVD risk [36].
4.3. Dietary Protein Source of a BCAA-Rich Diet
Zheng et al. [1] observed markedly attenuated associations between BCAA levels and the risk of T2D when adjusting for total protein intake—indicating that the total quantity of dietary protein has a significant effect. We observed a positive correlation of the identified habitual dietary pattern with both animal-based protein intake and the animal/plant protein ratio. Furthermore, the observed associations between the dietary pattern and AA levels were robust and independent from total protein intake (data not shown). Thus, not a high protein intake in general but the protein quality may play a crucial role for modulating disease risk [16,17]. This is in line with other studies showing that not the total protein intake itself but the protein composition or the AA pattern is important with regard to risk of T2D and CVD [37,38,39]. These results strengthen our hypothesis that the dietary pattern beyond the intake of BCAA rather than the effect of BCAA intake itself contribute to the increased risk for chronic diseases.
Dietary protein in Western diets has been reported to consist of >20% BCAA [34,40]. In our study, in particular animal-based rather than plant-based protein was correlated with the BCAA-explaining dietary pattern. This is in line with the literature, reporting BCAA levels to be highly dependent on the protein source [1]. As a consequence, plasma BCAA levels may be a surrogate marker of a long-term Western diet that is high in animal-based protein. The increased habitual intake of BCAA-rich foods may further induce a higher steady-state of BCAA (e.g., deposition in muscle tissue and higher turn-over rate) and subsequent increased plasma concentrations.
4.4. Additional Nutrients of a BCAA-Rich Diet
The identified habitual dietary pattern in our study is comparable to a Western diet [41,42] that is typically high in processed foods such as meat, sausages, and foods with added sugar, and at the same time low in vegetables and fruits. There is convincing evidence that a Western dietary pattern as a whole is associated with an increased risk for chronic diseases such as T2D and CVD [43,44]. We observed small but statistically significant trends regarding the intake of some nutrients with an increasing habitual dietary pattern score. This included a higher intake of fat and in particular SFAs, accompanied by a lower intake of dietary fiber. As this pattern represents a long-term dietary intake, metabolic consequences may appear when consuming such diets over a long period. Thus, the identified BCAA-explaining habitual dietary pattern comes along with an unfavorable nutrient composition.
4.5. Indirect Dietary Contributions
We observed a significant trend for a decreased intake in dietary fiber and plant-based protein paralleled by a higher intake of animal-based protein with an increasing habitual dietary pattern score. Dietary protein sources modulate risk factors for T2D and CVD [45,46]. There is convincing evidence that among others dietary fiber intake and the dietary protein source modulate gut microbiome composition [47,48,49], which additionally affects the risk for T2D and CVD [50]. Furthermore, some gut bacteria are a possible source of BCAA via microbiota dependent intestinal biosynthesis [51]. Thus, the habitual diet affects the composition and the metabolic capabilities of the intestinal microbiota, which may in turn contribute to the metabolite pattern observed in plasma.
Unfortunately, we did not assess the participants’ microbiome composition. Nonetheless, it is likely, that the observed dietary differences affect the microbiota composition and thus additionally contribute to a long-term effect regarding T2D and CVD risk. This needs to be addressed in further studies.
4.6. Limitations and Strengths
Our study has some limitations. Due to the cross-sectional design, we were not able to investigate any causal or temporal relationship between diet and AA profiles. We included healthy and mostly normal weight individuals. Therefore, dietary and lifestyle practices of our study participants may differ from those of the general population. Generalizing our results should be limited to groups with similar habits. As mentioned afore, we did not assess the gut microbiome composition of our study participants.
On the other hand, this study has a number of strengths. All measures were highly standardized according to standard operating procedures. Through the use of the NCI-method, we combined information of 24 h recalls, a FFQ and diet-related covariates to investigate habitual dietary intake instead of using solely FFQ data. Due to the strict inclusion criteria, we have a very health-conscious and with regard to their diet and lifestyle very homogeneous study group without any disease or medication. Therefore, we can exclude any interference of underlying diseases/medication. We observed minor differences in the macronutrient composition which enables us to investigate differences in protein quality and origin. Within this nutritionally homogenous group, we could observe small but significant differences in the dietary composition pointing at a potentially long-term increase in disease risk. This needs to be addressed in further studies with a more heterogeneous study group.
5. Conclusions
A high intake of BCAA is part of an unhealthy dietary pattern. This dietary pattern includes other risk-associated factors such as higher intake of AAA as well as saturated fatty acids, and a decreased intake of dietary fiber, all of which may contribute to the increased risk for T2D or CVD originally attributed to the BCAA.
Supplementary Materials
The following are available online at https://www.mdpi.com/2072-6643/10/5/623/s1, Table S1: List of assessed amino acids with corresponding coefficient of variation of their respective quality control samples, Table S2: Description of food groups, Table S3: Optimized lambda-values for Box—Cox transformation of BCAA and habitual diet food groups, Table S4: RRR-derived current and habitual dietary patterns with respective factor loadings of food groups and their explained variance for plasma BCAA concentrations, Table S5: Average consumption of food groups with corresponding 95% confidence intervals by quartiles of age, sex and energy intake adjusted dietary pattern score.
Author Contributions
B.W., S.E.K. and A.B. conceived and designed the KarMeN study; L.F. performed the experiments; B.M. analyzed and interpreted the data; L.F. and A.B. contributed reagents/materials/analysis tools; B.M. wrote the paper; B.W., A.B., S.E.K., M.J.R. and A.B. reviewed and edited the manuscript. All authors contributed to the final version of the manuscript.
Acknowledgments
The KarMeN study was registered at the German Clinical Study Register (DRKS00004890). WHO universal trial number: U1111-1141-7051. The study was funded by the German Federal Ministry of Food and Agriculture (BMEL). We would like to thank the Department of Nutritional Behaviour (Ingrid Hoffmann, Eva Hummel, Kimberly Hoffmann, Yvonne Martiniak, and Friederike Wittig) for the dietary assessment, Maik Döring for statistical advice, Sven Knüppel (German Institute of Human Nutrition Potsdam-Rehbrücke (DIfE)) for assistance with the NCI-method, and all participants of the KarMeN study for their valuable contribution.
Conflicts of Interest
The authors declare no conflict of interest. The funding sponsors had no role in the design of the study; in the collection, analyses, or interpretation of data; in the writing of the manuscript, and in the decision to publish the results.
References
- Zheng, Y.; Li, Y.; Qi, Q.; Hruby, A.; Manson, J.E.; Willett, W.C.; Wolpin, B.M.; Hu, F.B.; Qi, L. Cumulative consumption of branched-chain amino acids and incidence of type 2 diabetes. Int. J. Epidemiol. 2016, 45, 1482–1492. [Google Scholar] [CrossRef] [PubMed]
- Jennings, A.; MacGregor, A.; Pallister, T.; Spector, T.; Cassidy, A. Associations between branched chain amino acid intake and biomarkers of adiposity and cardiometabolic health independent of genetic factors: A twin study. Int. J. Cardiol. 2016, 223, 992–998. [Google Scholar] [CrossRef] [PubMed]
- Mangge, H.; Zelzer, S.; Prüller, F.; Schnedl, W.J.; Weghuber, D.; Enko, D.; Bergsten, P.; Haybaeck, J.; Meinitzer, A. Branched-chain amino acids are associated with cardiometabolic risk profiles found already in lean, overweight and obese young. J. Nutr. Biochem. 2016, 32, 123–127. [Google Scholar] [CrossRef] [PubMed]
- Rietman, A.; Schwarz, J.; Tome, D.; Kok, F.J.; Mensink, M. High dietary protein intake, reducing or eliciting insulin resistance? Eur. J. Clin. Nutr. 2014, 68, 973–979. [Google Scholar] [CrossRef] [PubMed]
- Cortiella, J.; Matthews, D.E.; Hoerr, R.A.; Bier, D.M.; Young, V.R. Leucine kinetics at graded intakes in young men: Quantitative fate of dietary leucine. Am. J. Clin. Nutr. 1988, 48, 998–1009. [Google Scholar] [CrossRef] [PubMed]
- Biolo, G.; Tessari, P.; Inchiostro, S.; Bruttomesso, D.; Fongher, C.; Sabadin, L.; Fratton, M.G.; Valerio, A.; Tiengo, A. Leucine and phenylalanine kinetics during mixed meal ingestion: A multiple tracer approach. Am. J. Physiol. 1992, 262, E455–E463. [Google Scholar] [CrossRef] [PubMed]
- Meguid, M.M.; Matthews, D.E.; Bier, D.M.; Meredith, C.N.; Young, V.R. Valine kinetics at graded valine intakes in young men. Am. J. Clin. Nutr. 1986, 43, 781–786. [Google Scholar] [CrossRef] [PubMed]
- Shah, S.H.; Crosslin, D.R.; Haynes, C.S.; Nelson, S.; Turer, C.B.; Stevens, R.D.; Muehlbauer, M.J.; Wenner, B.R.; Bain, J.R.; Laferrère, B.; et al. Branched-chain amino acid levels are associated with improvement in insulin resistance with weight loss. Diabetologia 2012, 55, 321–330. [Google Scholar] [CrossRef] [PubMed]
- Schmidt, J.A.; Rinaldi, S.; Scalbert, A.; Ferrari, P.; Achaintre, D.; Gunter, M.J.; Appleby, P.N.; Key, T.J.; Travis, R.C. Plasma concentrations and intakes of amino acids in male meat-eaters, fish-eaters, vegetarians and vegans: A cross-sectional analysis in the EPIC-Oxford cohort. Eur. J. Clin. Nutr. 2016, 70, 306–312. [Google Scholar] [CrossRef] [PubMed]
- Zhao, X.; Han, Q.; Liu, Y.; Sun, C.; Gang, X.; Wang, G. The Relationship between Branched-Chain Amino Acid Related Metabolomic Signature and Insulin Resistance: A Systematic Review. J. Diabetes Res. 2016, 2016, 2794591. [Google Scholar] [CrossRef] [PubMed]
- Batch, B.C.; Hyland, K.; Svetkey, L.P. Branch chain amino acids: Biomarkers of health and disease. Curr. Opin. Clin. Nutr. Metab. Care 2014, 17, 86–89. [Google Scholar] [CrossRef] [PubMed]
- Fiehn, O.; Garvey, W.T.; Newman, J.W.; Lok, K.H.; Hoppel, C.L.; Adams, S.H. Plasma Metabolomic Profiles Reflective of Glucose Homeostasis in Non-Diabetic and Type 2 Diabetic Obese African-American Women. PLoS ONE 2010, 5, e15234. [Google Scholar] [CrossRef] [PubMed]
- Lackey, D.E.; Lynch, C.J.; Olson, K.C.; Mostaedi, R.; Ali, M.; Smith, W.H.; Karpe, F.; Humphreys, S.; Bedinger, D.H.; Dunn, T.N.; et al. Regulation of adipose branched-chain amino acid catabolism enzyme expression and cross-adipose amino acid flux in human obesity. Am. J. Physiol. Endocrinol. Metab. 2013, 304, E1175–E1187. [Google Scholar] [CrossRef] [PubMed]
- Giesbertz, P.; Daniel, H. Branched-chain amino acids as biomarkers in diabetes. Curr. Opin. Clin. Nutr. Metab. Care 2016, 19, 48–54. [Google Scholar] [CrossRef] [PubMed]
- Ferguson, J.F.; Wang, T.J. Branched-Chain Amino Acids and Cardiovascular Disease: Does Diet Matter? Clin. Chem. 2016, 62, 545–547. [Google Scholar] [CrossRef] [PubMed]
- Tai, E.S.; Tan, M.L.S.; Stevens, R.D.; Low, Y.L.; Muehlbauer, M.J.; Goh, D.L.M.; Ilkayeva, O.R.; Wenner, B.R.; Bain, J.R.; Lee, J.J.; et al. Insulin resistance is associated with a metabolic profile of altered protein metabolism in Chinese and Asian-Indian men. Diabetologia 2010, 53, 757–767. [Google Scholar] [CrossRef] [PubMed]
- Fontana, L.; Cummings, N.E.; Arriola Apelo, S.I.; Neuman, J.C.; Kasza, I.; Schmidt, B.A.; Cava, E.; Spelta, F.; Tosti, V.; Syed, F.A.; et al. Decreased Consumption of Branched-Chain Amino Acids Improves Metabolic Health. Cell Rep. 2016, 16, 520–530. [Google Scholar] [CrossRef] [PubMed]
- Bub, A.; Kriebel, A.; Dörr, C.; Bandt, S.; Rist, M.; Roth, A.; Hummel, E.; Kulling, S.; Hoffmann, I.; Watzl, B. The Karlsruhe Metabolomics and Nutrition (KarMeN) Study: Protocol and Methods of a Cross-Sectional Study to Characterize the Metabolome of Healthy Men and Women. JMIR Res. Protoc. 2016, 5, e146. [Google Scholar] [CrossRef] [PubMed]
- Römisch-Margl, W.; Prehn, C.; Bogumil, R.; Röhring, C.; Suhre, K.; Adamski, J. Procedure for tissue sample preparation and metabolite extraction for high-throughput targeted metabolomics. Metabolomics 2012, 8, 133–142. [Google Scholar] [CrossRef]
- Biocrates Life Sciences AG. AbsoluteIDQ Kit—User Manual UM-P180-ABSCIEX-5; Biocrates Life Sciences AG: Innsbruck, Austria, 2012. [Google Scholar]
- Slimani, N.; Deharveng, G.; Charrondiere, R.U.; van Kappel, A.L.; Ocke, M.C.; Welch, A.; Lagiou, A.; van Liere, M.; Agudo, A.; Pala, V.; et al. Structure of the standardized computerized 24-h diet recall interview used as reference method in the 22 centers participating in the EPIC project. European Prospective Investigation into Cancer and Nutrition. Comput. Methods Programs Biomed. 1999, 58, 251–266. [Google Scholar] [CrossRef]
- Slimani, N.; Ferrari, P.; Ocke, M.; Welch, A.; Boeing, H.; Liere, M.; Pala, V.; Amiano, P.; Lagiou, A.; Mattisson, I.; et al. Standardization of the 24-hour diet recall calibration method used in the European prospective investigation into cancer and nutrition (EPIC): General concepts and preliminary results. Eur. J. Clin. Nutr. 2000, 54, 900–917. [Google Scholar] [CrossRef] [PubMed]
- Hartmann, B.M.; Heuer, T.; Hoffmann, I. The German Nutrient Database: Effect of different versions on the calculated energy and nutrient intake of the German population. J. Food Compos. Anal. 2015, 42, 26–29. [Google Scholar] [CrossRef]
- Kipnis, V.; Midthune, D.; Buckman, D.W.; Dodd, K.W.; Guenther, P.M.; Krebs-Smith, S.M.; Subar, A.F.; Tooze, J.A.; Carroll, R.J.; Freedman, L.S. Modeling Data with Excess Zeros and Measurement Error: Application to Evaluating Relationships between Episodically Consumed Foods and Health Outcomes. Biometrics 2009, 65, 1003–1010. [Google Scholar] [CrossRef] [PubMed]
- Tooze, J.A.; Midthune, D.; Dodd, K.W.; Freedman, L.S.; Krebs-Smith, S.M.; Subar, A.F.; Guenther, P.M.; Carroll, R.J.; Kipnis, V. A New Statistical Method for Estimating the Usual Intake of Episodically Consumed Foods with Application to Their Distribution. J. Am. Diet. Assoc. 2006, 106, 1575–1587. [Google Scholar] [CrossRef] [PubMed]
- Box, G.E.P.; Cox, D.R. An Analysis of Transformations. J. R. Stat. Soc. Ser. B (Methodol.) 1964, 26, 211–252. [Google Scholar]
- Hoffmann, K.; Schulze, M.B.; Schienkiewitz, A.; Nothlings, U.; Boeing, H. Application of a new statistical method to derive dietary patterns in nutritional epidemiology. Am. J. Epidemiol. 2004, 159, 935–944. [Google Scholar] [CrossRef] [PubMed]
- Rietman, A.; Stanley, T.L.; Clish, C.; Mootha, V.; Mensink, M.; Grinspoon, S.K.; Makimura, H. Associations between plasma branched-chain amino acids, β-aminoisobutyric acid and body composition. J. Nutr. Sci. 2016, 5, e6. [Google Scholar] [CrossRef] [PubMed]
- Floegel, A.; von Ruesten, A.; Drogan, D.; Schulze, M.B.; Prehn, C.; Adamski, J.; Pischon, T.; Boeing, H. Variation of serum metabolites related to habitual diet: A targeted metabolomic approach in EPIC-Potsdam. Eur. J. Clin. Nutr. 2013, 67, 1100–1108. [Google Scholar] [CrossRef] [PubMed]
- Yamaguchi, N.; Mahbub, M.H.; Takahashi, H.; Hase, R.; Ishimaru, Y.; Sunagawa, H.; Amano, H.; Kobayashi-Miura, M.; Kanda, H.; Fujita, Y.; et al. Plasma free amino acid profiles evaluate risk of metabolic syndrome, diabetes, dyslipidemia, and hypertension in a large Asian population. Environ. Health Prev. Med. 2017, 22, 35. [Google Scholar] [CrossRef] [PubMed]
- Guasch-Ferre, M.; Hruby, A.; Toledo, E.; Clish, C.B.; Martinez-Gonzalez, M.A.; Salas-Salvado, J.; Hu, F.B. Metabolomics in Prediabetes and Diabetes: A Systematic Review and Meta-analysis. Diabetes Care 2016, 39, 833–846. [Google Scholar] [CrossRef] [PubMed]
- Magnusson, M.; Lewis, G.D.; Ericson, U.; Orho-Melander, M.; Hedblad, B.; Engstrom, G.; Ostling, G.; Clish, C.; Wang, T.J.; Gerszten, R.E.; et al. A diabetes-predictive amino acid score and future cardiovascular disease. Eur. Heart J. 2013, 34, 1982–1989. [Google Scholar] [CrossRef] [PubMed]
- Siomkajło, M.; Rybka, J.; Mierzchała-Pasierb, M.; Gamian, A.; Stankiewicz-Olczyk, J.; Bolanowski, M.; Daroszewski, J. Specific plasma amino acid disturbances associated with metabolic syndrome. Endocrine 2017, 58, 553–562. [Google Scholar] [CrossRef] [PubMed]
- Cole, J.T. Metabolism of BCAAs. In Branched Chain Amino Acids in Clinical Nutrition: Volume 1; Rajendram, R., Preedy, V.R., Eds.; Springer: New York, NY, USA, 2015; pp. 13–24. [Google Scholar]
- Vaz, F.M.; Wanders, R.J. Carnitine biosynthesis in mammals. Biochem. J. 2002, 361, 417–429. [Google Scholar] [CrossRef] [PubMed]
- Koeth, R.A.; Wang, Z.; Levison, B.S.; Buffa, J.A.; Org, E.; Sheehy, B.T.; Britt, E.B.; Fu, X.; Wu, Y.; Li, L.; et al. Intestinal microbiota metabolism of l-carnitine, a nutrient in red meat, promotes atherosclerosis. Nat. Med. 2013, 19, 576–585. [Google Scholar] [CrossRef] [PubMed]
- Azemati, B.; Rajaram, S.; Jaceldo-Siegl, K.; Sabate, J.; Shavlik, D.; Fraser, G.E.; Haddad, E.H. Animal-Protein Intake Is Associated with Insulin Resistance in Adventist Health Study 2 (AHS-2) Calibration Substudy Participants: A Cross-Sectional Analysis. Curr. Dev. Nutr. 2017, 1, e000299. [Google Scholar] [CrossRef]
- Mirmiran, P.; Bahadoran, Z.; Esfandyari, S.; Azizi, F. Dietary Protein and Amino Acid Profiles in Relation to Risk of Dysglycemia: Findings from a Prospective Population-Based Study. Nutrients 2017, 9, 971. [Google Scholar] [CrossRef] [PubMed]
- Malik, V.S.; Li, Y.; Tobias, D.K.; Pan, A.; Hu, F.B. Dietary Protein Intake and Risk of Type 2 Diabetes in US Men and Women. Am. J. Epidemiol. 2016, 183, 715–728. [Google Scholar] [CrossRef] [PubMed]
- Layman, D.K.; Walker, D.A. Potential importance of leucine in treatment of obesity and the metabolic syndrome. J. Nutr. 2006, 136, 319S–323S. [Google Scholar] [CrossRef] [PubMed]
- Bouchard-Mercier, A.; Rudkowska, I.; Lemieux, S.; Couture, P.; Vohl, M.C. The metabolic signature associated with the Western dietary pattern: A cross-sectional study. J. Nutr. 2013, 12, 158. [Google Scholar] [CrossRef] [PubMed]
- Bhupathiraju, S.N.; Tucker, K.L. Coronary heart disease prevention: Nutrients, foods, and dietary patterns. Clin. Chim. Acta 2011, 412, 1493–1514. [Google Scholar] [CrossRef] [PubMed]
- Hu, F.B.; Rimm, E.B.; Stampfer, M.J.; Ascherio, A.; Spiegelman, D.; Willett, W.C. Prospective study of major dietary patterns and risk of coronary heart disease in men. Am. J. Clin. Nutr. 2000, 72, 912–921. [Google Scholar] [CrossRef] [PubMed]
- Fung, T.T.; Schulze, M.; Manson, J.E.; Willett, W.C.; Hu, F.B. Dietary patterns, meat intake, and the risk of type 2 diabetes in women. Arch. Intern. Med. 2004, 164, 2235–2240. [Google Scholar] [CrossRef] [PubMed]
- Aadland, E.K.; Graff, I.E.; Lavigne, C.; Eng, Ø.; Paquette, M.; Holthe, A.; Mellgren, G.; Madsen, L.; Jacques, H.; Liaset, B. Lean Seafood Intake Reduces Postprandial C-peptide and Lactate Concentrations in Healthy Adults in a Randomized Controlled Trial with a Crossover Design. J. Nutr. 2016, 146, 1027–1034. [Google Scholar] [CrossRef] [PubMed]
- Aadland, E.K.; Lavigne, C.; Graff, I.E.; Eng, O.; Paquette, M.; Holthe, A.; Mellgren, G.; Jacques, H.; Liaset, B. Lean-seafood intake reduces cardiovascular lipid risk factors in healthy subjects: Results from a randomized controlled trial with a crossover design. Am. J. Clin. Nutr. 2015, 102, 582–592. [Google Scholar] [CrossRef] [PubMed]
- Beaumont, M.; Portune, K.J.; Steuer, N.; Lan, A.; Cerrudo, V.; Audebert, M.; Dumont, F.; Mancano, G.; Khodorova, N.; Andriamihaja, M.; et al. Quantity and source of dietary protein influence metabolite production by gut microbiota and rectal mucosa gene expression: A randomized, parallel, double-blind trial in overweight humans. Am. J. Clin. Nutr. 2017, 106, 1005–1019. [Google Scholar] [CrossRef] [PubMed]
- Sawicki, C.M.; Livingston, K.A.; Obin, M.; Roberts, S.B.; Chung, M.; McKeown, N.M. Dietary Fiber and the Human Gut Microbiota: Application of Evidence Mapping Methodology. Nutrients 2017, 9, 125. [Google Scholar] [CrossRef] [PubMed]
- Graf, D.; Di Cagno, R.; Fak, F.; Flint, H.J.; Nyman, M.; Saarela, M.; Watzl, B. Contribution of diet to the composition of the human gut microbiota. Microb. Ecol. Health Dis. 2015, 26, 26164. [Google Scholar] [CrossRef] [PubMed]
- Tang, W.H.; Kitai, T.; Hazen, S.L. Gut Microbiota in Cardiovascular Health and Disease. Circ. Res. 2017, 120, 1183–1196. [Google Scholar] [CrossRef] [PubMed]
- Pedersen, H.K.; Gudmundsdottir, V.; Nielsen, H.B.; Hyotylainen, T.; Nielsen, T.; Jensen, B.A.H.; Forslund, K.; Hildebrand, F.; Prifti, E.; Falony, G.; et al. Human gut microbes impact host serum metabolome and insulin sensitivity. Nature 2016, 535, 376. [Google Scholar] [CrossRef] [PubMed]
Figure 1.
Heat map of Spearman correlations between variables of dietary protein intake and RRR-derived first habitual dietary pattern (crude and age, sex, energy intake adjusted) or selected AA, respectively.
Figure 1.
Heat map of Spearman correlations between variables of dietary protein intake and RRR-derived first habitual dietary pattern (crude and age, sex, energy intake adjusted) or selected AA, respectively.

Table 1.
General characteristics of the KarMeN study population.
| Men (n = 171) | Women (n = 127) | |||
|---|---|---|---|---|
| Age (years) | 44.5 | ±17.9 | 51.6 | ±15 |
| Body weight (kg) | 79.2 | ±10.2 | 64.3 | ±8.2 |
| BMI (kg/m2) | 24.4 | ±2.7 | 23.1 | ±2.9 |
| Body fat (%) | 23.0 | ±6.4 | 33.4 | ±6.6 |
| Blood pressure (mmHg) | ||||
| Systolic | 128.3 | ±14.2 | 120.3 | ±17.7 |
| Diastolic | 84.8 | ±10.6 | 83.4 | ±12.0 |
| Cholesterol (mg/dL) | ||||
| HDL | 62 | ±14 | 77 | ±16 |
| LDL | 123 | ±41 | 129 | ±35 |
Values are presented as arithmetic mean ± SD. Abbreviations: BMI, body mass index; HDL, high-density lipoproteins; LDL, low-density lipoproteins; SD, standard deviation.
Table 2.
Partial Spearman correlation coefficients * of the RRR-derived first habitual dietary pattern score with food groups adjusted for age, sex, and total energy intake.
Table 2.
Partial Spearman correlation coefficients * of the RRR-derived first habitual dietary pattern score with food groups adjusted for age, sex, and total energy intake.
| Food Group (g/day) | Spearmans’ rho | p |
|---|---|---|
| Sauces | 0.59 | <0.0001 |
| Sausages and meat products smoked | 0.58 | <0.0001 |
| Meat and meat products unsmoked | 0.56 | <0.0001 |
| Ice cream | 0.29 | <0.0001 |
| Eggs | 0.25 | <0.0001 |
| Cereals and cereal products | −0.22 | 0.0001 |
| Nuts and seeds | −0.25 | <0.0001 |
| Mushrooms | −0.26 | <0.0001 |
| Pulses | −0.29 | <0.0001 |
* Only correlations >|0.2| are shown.
Table 3.
AA concentrations (µmol/L) and dietary nutrient composition by quartiles of adjusted habitual dietary pattern score.
Table 3.
AA concentrations (µmol/L) and dietary nutrient composition by quartiles of adjusted habitual dietary pattern score.
| Variable | Q1 (n = 74) | Q2 (n = 75) | Q3 (n = 75) | Q4 (n = 74) | |||||
|---|---|---|---|---|---|---|---|---|---|
| Min | Max | Min | Max | Min | Max | Min | Max | p | |
| Adjusted first habitual dietary pattern score | −2.5 | −0.43 | −0.42 | 0.06 | 0.07 | 0.50 | 0.51 | 1.93 | <0.0001 |
| Mean | ±SD | Mean | SD | Mean | SD | Mean | SD | ||
| Val | 196.7 | ±51.7 | 198.4 | ±43.9 | 204.0 | ±43.4 | 210.2 | ±44.7 | <0.0001 |
| Leu | 140.6 | ±28.5 | 141.3 | ±28.0 | 153.3 | ±32.5 | 161.3 | ±27.8 | 0.03 |
| Ile | 73.2 | ±15.3 | 73.8 | ±16.0 | 78.8 | ±18.1 | 83.8 | ±15.3 | <0.0001 |
| ∑ BCAA | 410.5 | ±86.2 | 413.5 | ±76.5 | 436.2 | ±81.3 | 455.3 | ±69.8 | 0.0002 |
| Phe | 55.9 | ±8.2 | 56.7 | ±6.7 | 59.0 | ±8.1 | 60.1 | ±8.9 | 0.0001 |
| Trp | 63.4 | ±12.8 | 62.8 | ±9.9 | 68.1 | ±13.4 | 67.7 | ±12.4 | 0.0010 |
| Tyr | 66.2 | ±13.5 | 67.9 | ±11.0 | 72.4 | ±16.1 | 70.3 | ±11.1 | 0.0003 |
| ∑ AAA | 185.5 | ±28.3 | 187.4 | ±20.6 | 199.5 | ±30.3 | 198.2 | ±25.7 | <0.0001 |
| Energy intake (kcal/day) | 2432 | ±460 | 2350 | ±464 | 2334 | ±457 | 2474 | ±497 | 0.90 |
| Macronutrient intake (E%) | |||||||||
| CHO | 45.4 | ±4.4 | 45.4 | ±4.5 | 43.9 | ±4.1 | 42.7 | ±4.7 | <0.0001 |
| Monosaccharides | 8.1 | ±2.4 | 8.2 | ±2.5 | 7.6 | ±2.2 | 7.3 | ±1.9 | 0.02 |
| Disaccharides | 11.7 | ±2.2 | 12.4 | ±2.4 | 11.9 | ±2.3 | 11.6 | ±2.3 | 0.75 |
| Polysaccharides | 23.1 | ±3.1 | 22.5 | ±3.7 | 22.1 | ±3.5 | 21.7 | ±4.1 | 0.003 |
| Fat | 36.7 | ±4.1 | 36.7 | ±3.9 | 37.4 | ±3.7 | 38.1 | ±3.8 | 0.001 |
| SFA | 15.7 | ±2.5 | 15.9 | ±2.2 | 16.6 | ±2.3 | 16.5 | ±2.0 | 0.0001 |
| MUFA | 12.2 | ±1.5 | 12.2 | ±1.7 | 12.5 | ±1.4 | 13.1 | ±1.8 | <0.0001 |
| PUFA | 5.9 | ±1.1 | 5.7 | ±1.0 | 5.6 | ±0.6 | 5.7 | ±0.8 | 0.047 |
| Protein | 14.3 | ±1.3 | 14.4 | ±1.2 | 14.6 | ±1.2 | 15.1 | ±1.5 | 0.0015 |
| Animal-based protein | 6.5 | ±1.6 | 7.2 | ±1.3 | 7.6 | ±1.4 | 8.4 | ±1.5 | <0.0001 |
| Plant-based protein | 5.2 | ±1.0 | 4.9 | ±0.8 | 4.7 | ±0.7 | 4.5 | ±0.7 | <0.0001 |
| Animal/plant protein ratio | 1.3 | ±0.5 | 1.5 | ±0.5 | 1.7 | ±0.5 | 1.9 | ±0.4 | <0.0001 |
| Alcohol | 2.41 | ±1.92 | 2.09 | ±2.07 | 3.43 | ±2.96 | 2.95 | ±2.71 | 0.05 |
| Dietary fiber (g/MJ) | 2.8 | ±0.6 | 2.7 | ±0.5 | 2.6 | ±0.5 | 2.4 | ±0.5 | <0.0001 |
p-Values based on Spearman correlation analysis of each variable with the adjusted first dietary pattern score. Abbreviations: AAA, aromatic amino acids; BCAA, branched-chain amino acids; CHO, carbohydrates; MUFA, monounsaturated fatty acids; SFA, saturated fatty acids; PUFA, polyunsaturated fatty acids.
Table 4.
Spearman correlation coefficients of the RRR-derived first habitual dietary pattern with plasma AA concentrations.
Table 4.
Spearman correlation coefficients of the RRR-derived first habitual dietary pattern with plasma AA concentrations.
| Spearmans’ rho | p | |
|---|---|---|
| Ala | 0.15 | 0.01 |
| Arg | 0.01 | 0.89 |
| Asn | −0.10 | 0.09 |
| Asp | 0.01 | 0.82 |
| Gln | −0.02 | 0.70 |
| His | 0.01 | 0.82 |
| Lys | 0.23 | <0.0001 |
| Met | 0.08 | 0.18 |
| Orn | 0.04 | 0.47 |
| Phe | 0.22 | 0.0001 |
| Pro | 0.08 | 0.18 |
| Ser | −0.03 | 0.67 |
| Thr | 0.04 | 0.51 |
| Trp | 0.17 | 0.003 |
| Tyr | 0.20 | 0.0005 |
| Ile | 0.31 | <0.0001 |
| Leu | 0.33 | <0.0001 |
| Val | 0.15 | 0.01 |
| ∑ BCAA | 0.27 | <0.0001 |
| ∑ AAA | 0.23 | <0.0001 |
Abbreviations: AAA, aromatic amino acids; BCAA, branched-chain amino acids.
© 2018 by the authors. Licensee MDPI, Basel, Switzerland. This article is an open access article distributed under the terms and conditions of the Creative Commons Attribution (CC BY) license (http://creativecommons.org/licenses/by/4.0/).
Share and Cite
MDPI and ACS Style
Merz, B.; Frommherz, L.; Rist, M.J.; Kulling, S.E.; Bub, A.; Watzl, B. Dietary Pattern and Plasma BCAA-Variations in Healthy Men and Women—Results from the KarMeN Study. Nutrients 2018, 10, 623. https://doi.org/10.3390/nu10050623
AMA Style
Merz B, Frommherz L, Rist MJ, Kulling SE, Bub A, Watzl B. Dietary Pattern and Plasma BCAA-Variations in Healthy Men and Women—Results from the KarMeN Study. Nutrients. 2018; 10(5):623. https://doi.org/10.3390/nu10050623
Chicago/Turabian StyleMerz, Benedikt, Lara Frommherz, Manuela J. Rist, Sabine E. Kulling, Achim Bub, and Bernhard Watzl. 2018. "Dietary Pattern and Plasma BCAA-Variations in Healthy Men and Women—Results from the KarMeN Study" Nutrients 10, no. 5: 623. https://doi.org/10.3390/nu10050623
Note that from the first issue of 2016, this journal uses article numbers instead of page numbers. See further details here.