The Design, Development and Evaluation of the Vegetarian Lifestyle Index on Dietary Patterns among Vegetarians and Non-Vegetarians


Abstract
:1. Introduction
2. Materials and Methods
2.1. Study Population
2.2. Dietary and Lifestyle Data
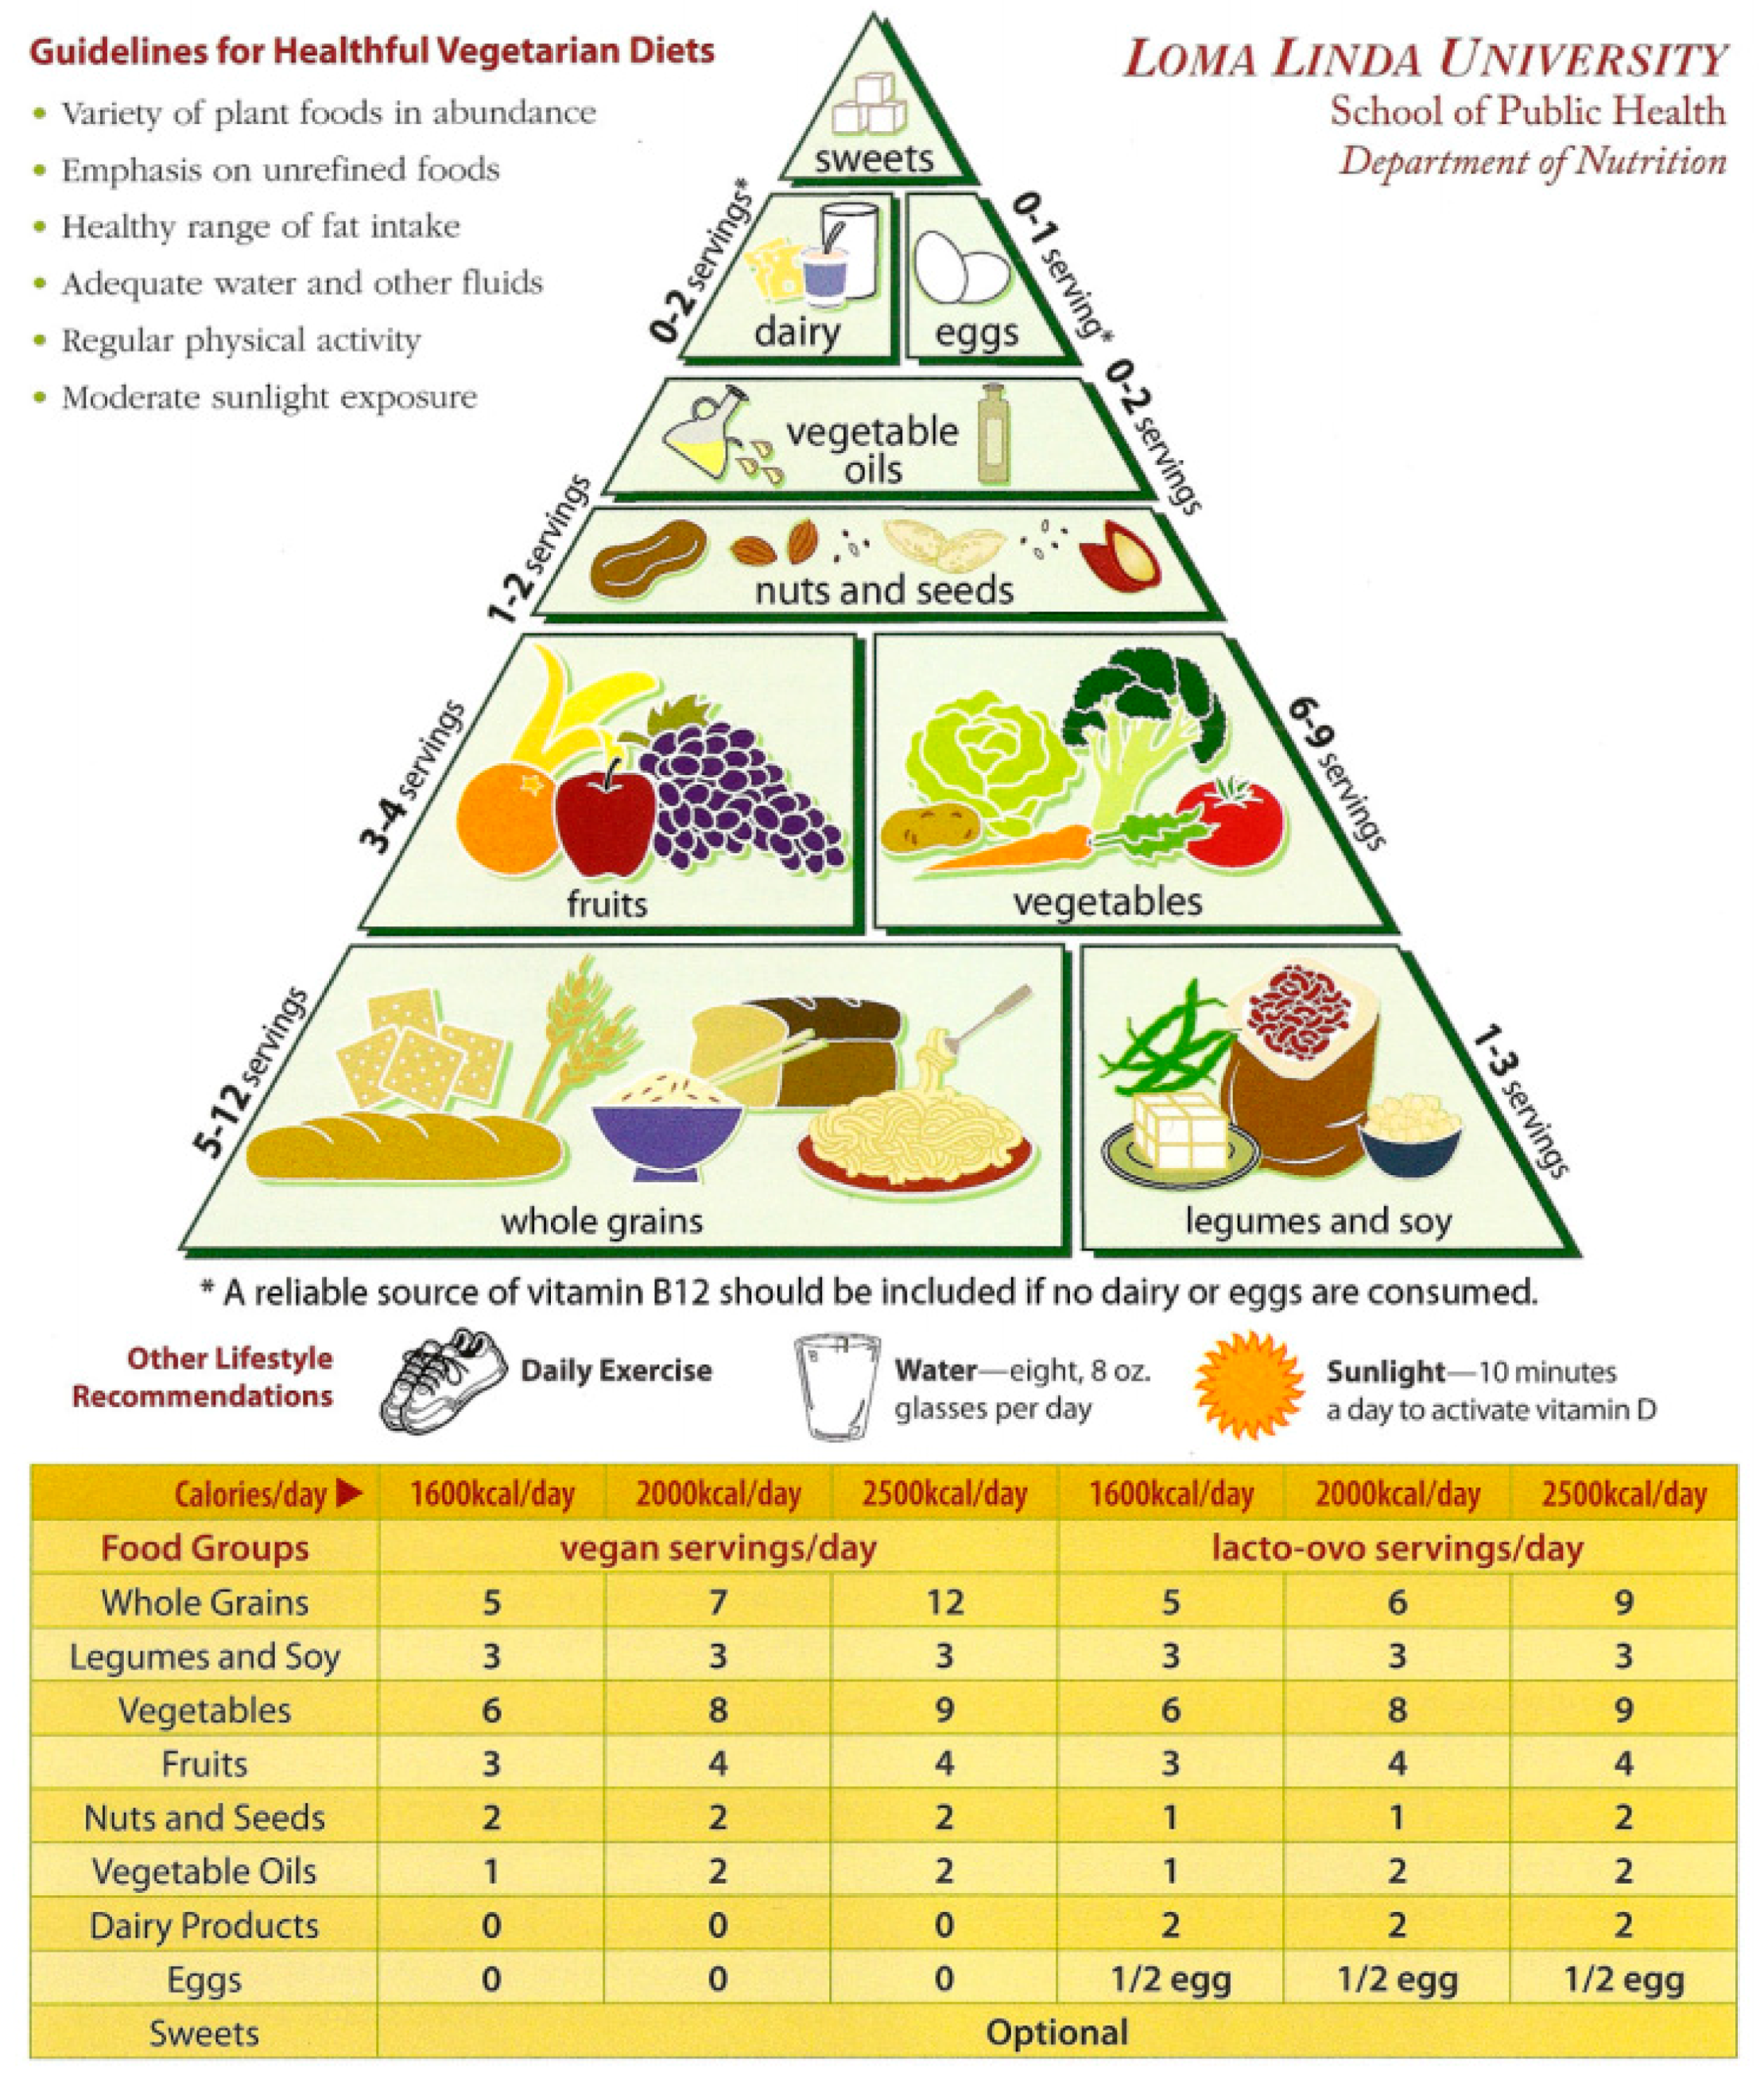
2.3. Loma Linda University Vegetarian Food Guide Pyramid
2.4. Design and Construction of Vegetarian Lifestyle Index (VLI)
Operationalization of the VLI Scores
2.5. Statistical Analysis
3. Results
4. Discussion
Strengths and Limitations
5. Conclusions
Author Contributions
Acknowledgments
Conflicts of Interest
Appendix A

| Categories of Dietary Pattern | ||||||||||||||
|---|---|---|---|---|---|---|---|---|---|---|---|---|---|---|
| Components | Non-Vegetarian | Semi- | Pesco- | Lacto-Ovo- | Vegan | |||||||||
| Mean | [ref] | Mean | [Diff] | SE | Mean | [Diff] | SE | Mean | [Diff] | SE | Mean | [Diff] | SE | |
| 1: Whole grains | 0.05 | [ref] | 0.10 | 0.04 | 0.004 | 0.08 | 0.03 | 0.003 | 0.11 | 0.06 | 0.002 | 0.20 | 0.15 | 0.003 |
| 2: Legumes, soy, meat substitutes | 0.29 | [ref] | 0.47 | 0.18 | 0.006 | 0.53 | 0.24 | 0.004 | 0.55 | 0.26 | 0.003 | 0.58 | 0.29 | 0.005 |
| 3: Vegetables | 0.24 | [ref] | 0.27 | 0.03 | 0.005 | 0.32 | 0.08 | 0.004 | 0.28 | 0.04 | 0.003 | 0.40 | 0.16 | 0.005 |
| 4: Fruits | 0.44 | [ref] | 0.51 | 0.06 | 0.007 | 0.56 | 0.12 | 0.005 | 0.54 | 0.10 | 0.004 | 0.69 | 0.25 | 0.006 |
| 5: Seeds and nuts | 0.42 | [ref] | 0.48 | 0.05 | 0.007 | 0.53 | 0.11 | 0.005 | 0.54 | 0.12 | 0.004 | 0.68 | 0.26 | 0.006 |
| 6: Vegetable oils | 0.76 | [ref] | 0.77 | 0.01 | 0.005 | 0.77 | 0.00 | 0.004 | 0.79 | 0.02 | 0.003 | 0.83 | 0.07 | 0.005 |
| 7: Dairy products | 0.41 | [ref] | 0.40 | −0.02 | 0.008 | 0.35 | −0.07 | 0.006 | 0.34 | −0.08 | 0.004 | 0.02 | −0.39 | 0.007 |
| 8: Eggs | 0.86 | [ref] | 0.91 | 0.05 | 0.004 | 0.92 | 0.06 | 0.003 | 0.93 | 0.07 | 0.002 | 0.99 | 0.13 | 0.004 |
| 9: Sweets | 0.34 | [ref] | 0.44 | 0.11 | 0.007 | 0.55 | 0.21 | 0.006 | 0.51 | 0.17 | 0.004 | 0.78 | 0.44 | 0.006 |
| 10: Reliable sources of vitamin B-12 | 0.63 | [ref] | 0.74 | 0.11 | 0.006 | 0.79 | 0.16 | 0.005 | 0.80 | 0.18 | 0.003 | 0.82 | 0.19 | 0.005 |
| 11: Flesh food intake | 0.02 | [ref] | 0.47 | 0.44 | 0.002 | 0.27 | 0.25 | 0.002 | 0.98 | 0.95 | 0.001 | 0.98 | 0.95 | 0.002 |
| 12: Exercise | 0.40 | [ref] | 0.40 | 0.01 | 0.004 | 0.42 | 0.02 | 0.003 | 0.41 | 0.01 | 0.002 | 0.42 | 0.02 | 0.004 |
| 13: Water intake | 0.30 | [ref] | 0.40 | 0.10 | 0.007 | 0.37 | 0.06 | 0.005 | 0.41 | 0.11 | 0.004 | 0.52 | 0.22 | 0.006 |
| 14: Sunlight exposure | 0.96 | [ref] | 0.95 | −0.01 | 0.003 | 0.96 | 0.00 | 0.002 | 0.95 | −0.01 | 0.002 | 0.95 | −0.01 | 0.003 |
| Total score | 6.14 | [ref] | 7.31 | 1.18 | 0.075 | 7.41 | 1.27 | 0.06 | 8.16 | 2.03 | 0.041 | 8.87 | 2.73 | 0.066 |
References
- Madden, J.P.; Yoder, M. Program Evaluation: Food Stamps and Commodity Distribution in Rural Areas of Central Pennsylvania; Bulletin/Pennsylvania State University, College of Agriculture, Agricultural Experiment Station, Department of Agricultural Economics and Rural Sociology, The Pennsylvania State University: University Park, PA, USA, 1972; Volume VII, p. 119. [Google Scholar]
- Hansen, R.G. An index of food quality. Nutr. Rev. 1973, 31, 1–7. [Google Scholar] [CrossRef] [PubMed]
- Clarke, M.; Wakefield, L.M. Food choices of institutionalized vs. independent-living elderly. J. Am. Diet. Assoc. 1975, 66, 600–604. [Google Scholar] [PubMed]
- Hulshof, K.F.; Wedel, M.; Löwik, M.R.; Kok, F.J.; Kistemaker, C.; Hermus, R.J.; Ockhuizen, T. Clustering of dietary variables and other lifestyle factors (Dutch nutritional surveillance system). J. Epidemiol. Commun. Health 1992, 46, 417–424. [Google Scholar] [CrossRef]
- Davis, M.A.; Murphy, S.P.; Neuhaus, J.M.; Gee, L.; Quiroga, S.S. Living arrangements affect dietary quality for U.S. adults aged 50 years and older: NHANES III 1988–1994. J. Nutr. 2000, 130, 2256–2264. [Google Scholar] [CrossRef] [PubMed]
- Toft, U.; Kristoffersen, L.H.; Lau, C.; Borch-Johnsen, K.; Jørgensen, T. The dietary quality score: Validation and association with cardiovascular risk factors: The inter99 study. Eur. J. Clin. Nutr. 2007, 61, 270–278. [Google Scholar] [CrossRef] [PubMed]
- Davenport, M.; Roderick, P.; Elliott, L.; Victor, C.; Geissler, C. Monitoring dietary change in populations and the need for specific food targets; lessons from the North West Thames regional health survey. J. Hum. Nutr. Diet. 1995, 8, 119–128. [Google Scholar] [CrossRef]
- Randall, E.; Marshall, J.R.; Graham, S.; Brasure, J. High-risk health behaviors associated with various dietary patterns. Nutr. Cancer 1991, 16, 135–151. [Google Scholar] [CrossRef] [PubMed]
- Ping-Delfos, W.L.C.S.; Beilin, L.J.; Oddy, W.H.; Burrows, S.; Mori, T.A. Use of the Dietary Guideline Index to assess cardiometabolic risk in adolescents. Br. J. Nutr. 2015, 113, 1741–1752. [Google Scholar] [CrossRef] [PubMed]
- Golley, R.K.; McNaughton, S.A.; Hendrie, G.A. A dietary guideline adherence score is positively associated with dietary biomarkers but not lipid profile in healthy children. J. Nutr. 2015, 145, 128–133. [Google Scholar] [CrossRef] [PubMed]
- Kant, A.K.; Schatzkin, A.; Graubard, B.I.; Schairer, C. A prospective study of diet quality and mortality in women. JAMA 2000, 283, 2109–2115. [Google Scholar] [CrossRef] [PubMed]
- McCullough, M.L.; Feskanich, D.; Stampfer, M.J.; Giovannucci, E.L.; Rimm, E.B.; Hu, F.B.; Willett, W.C. Diet quality and major chronic disease risk in men and women: Moving toward improved dietary guidance. Am. J. Clin. Nutr. 2002, 76, 1261–1271. [Google Scholar] [CrossRef] [PubMed]
- Michels, K.B.; Wolk, A. A prospective study of variety of healthy foods and mortality in women. Int. J. Epidemiol. 2002, 31, 847–854. [Google Scholar] [CrossRef] [PubMed]
- Cespedes, E.M.; Hu, F.B. Dietary patterns: From nutritional epidemiologic analysis to national guidelines. Am. J. Clin. Nutr. 2015, 101, 899–900. [Google Scholar] [CrossRef] [PubMed]
- Gil, A.; Martinez de Victoria, E.; Olza, J. Indicators for the evaluation of diet quality. Nutr. Hosp. 2015, 31, 128–144. [Google Scholar] [PubMed]
- Yu, D.; Sonderman, J.; Buchowski, M.S.; McLaughlin, J.K.; Shu, X.O.; Steinwandel, M.; Zheng, W. Healthy eating and risks of total and cause-specific death among low-income populations of African-Americans and other adults in the Southeastern United States: A prospective cohort study. PLoS Med. 2015, 12, e1001830. [Google Scholar] [CrossRef] [PubMed]
- Schwingshackl, L.; Hoffmann, G. Diet quality as assessed by the healthy eating index, the alternate healthy eating index, the dietary approaches to stop hypertension score, and health outcomes: A Systematic review and meta-analysis of cohort studies. J. Acad. Nutr. Diet. 2015, 115, 780–800. [Google Scholar] [CrossRef] [PubMed]
- Xie, J.; Poole, E.M.; Terry, K.L.; Fung, T.T.; Rosner, B.A.; Willett, W.C.; Tworoger, S.S. A prospective cohort study of dietary indices and incidence of epithelial ovarian cancer. J. Ovarian Res. 2014, 7, 112. [Google Scholar] [CrossRef] [PubMed] [Green Version]
- Jacobs, S.; Harmon, B.E.; Boushey, C. J.; Morimoto, Y.; Wilkens, L.R.; Le Marchand, L.; Maskarinec, G. A priori-defined diet quality indexes and risk of type 2 diabetes: The multiethnic cohort. Diabetologia 2015, 58, 98–112. [Google Scholar] [CrossRef] [PubMed]
- Clarys, P.; Deliens, T.; Huybrechts, I.; Deriemaeker, P.; Vanaelst, B.; De Keyzer, W.; Mullie, P. Comparison of nutritional quality of the vegan, vegetarian, semi-vegetarian, pesco-vegetarian and omnivorous diet. Nutrients 2014, 6, 1318–1332. [Google Scholar] [CrossRef] [PubMed] [Green Version]
- Harmon, B.E.; Boushey, C.J.; Shvetsov, Y.B.; Ettienne, R.; Reedy, J.; Wilkens, L.R.; Kolonel, L.N. Associations of key diet-quality indexes with mortality in the multiethnic cohort: The dietary patterns methods project. Am. J. Clin. Nutr. 2015, 101, 587–597. [Google Scholar] [CrossRef] [PubMed]
- Liese, A.D.; Krebs-Smith, S.M.; Subar, A.F.; George, S.M.; Harmon, B.E.; Neuhouser, M.L.; Reedy, J. The dietary patterns methods project: Synthesis of findings across cohorts and relevance to dietary guidance. J. Nutr. 2015, 145, 393–402. [Google Scholar] [CrossRef] [PubMed]
- Malagoli, C.; Malavolti, M.; Agnoli, C.; Crespi, C.M.; Fiorentini, C.; Farnetani, F.; Veneziano, L. Diet quality and risk of melanoma in an Italian population. J. Nutr. 2015, 145, 1800–1807. [Google Scholar] [CrossRef] [PubMed]
- Sotos-Prieto, M.; Bhupathiraju, S.N.; Mattei, J.; Fung, T.T.; Li, Y.; Pan, A.; Hu, F.B. Association of changes in diet quality with total and cause-specific mortality. N. Engl. J. Med. 2017, 377, 143–153. [Google Scholar] [CrossRef] [PubMed]
- Haveman-Nies, A.; de Groot, L.C.; van Staveren, W.A. Dietary quality, lifestyle factors and healthy ageing in Europe: The SENECA study. Age Ageing 2003, 32, 427–434. [Google Scholar] [CrossRef] [PubMed]
- Zeng, F.F.; Xue, W.Q.; Cao, W.T.; Wu, B.H.; Xie, H.L.; Fan, F.; Chen, Y.M. Diet-quality scores and risk of hip fractures in elderly urban Chinese in Guangdong, China: A case-control study. Osteoporos. Int. 2014, 25, 2131–2141. [Google Scholar] [CrossRef] [PubMed]
- Mila-Villarroel, R.; Bach-Faig, A.; Puig, J.; Puchal, A.; Farran, A.; Serra-Majem, L.; Carrasco, J.L. Comparison and evaluation of the reliability of indexes of adherence to the Mediterranean diet. Public Health Nutr. 2011, 14, 2338–2345. [Google Scholar] [CrossRef] [PubMed]
- Makarem, N.; Lin, Y.; Bandera, E.V.; Jacques, P.F.; Parekh, N. Concordance with world cancer research fund/American institute for cancer research (WCRF/AICR) guidelines for cancer prevention and obesity-related cancer risk in the Framingham offspring cohort (1991–2008). Cancer Causes Control 2015, 26, 277–286. [Google Scholar] [CrossRef] [PubMed]
- Romaguera, D.; Vergnaud, A.C.; Peeters, P.H.; van Gils, C.H.; Chan, D.S.; Ferrari, P.; Fagherazzi, G. Is concordance with world cancer research fund/American institute for cancer research guidelines for cancer prevention related to subsequent risk of cancer? Results from the EPIC study. Am. J. Clin. Nutr. 2012, 96, 150–163. [Google Scholar] [CrossRef] [PubMed]
- Cerhan, J.R.; Potter, J.D.; Gilmore, J.M.; Janney, C.A.; Kushi, L.H.; Lazovich, D.; Folsom, A.R. Adherence to the AICR cancer prevention recommendations and subsequent morbidity and mortality in the Iowa women’s health study cohort. Cancer Epidemiol. Biomarkers Prev. 2004, 13, 1114–1120. [Google Scholar] [PubMed]
- Inoue-Choi, M.; Lazovich, D.; Prizment, A.E.; Robien, K. Adherence to the world cancer research fund/American institute for cancer research recommendations for cancer prevention is associated with better health-related quality of life among elderly female cancer survivors. J. Clin. Oncol. 2013, 31, 1758–1766. [Google Scholar] [CrossRef] [PubMed]
- Realdon, S.; Antonello, A.; Arcidiacono, D.; Dassie, E.; Cavallin, F.; Fassan, M.; Battaglia, G. Adherence to WCRF/AICR lifestyle recommendations for cancer prevention and the risk of Barrett’s esophagus onset and evolution to esophageal adenocarcinoma: Results from a pilot study in a high-risk population. Eur. J. Nutr. 2016, 55, 1563–1571. [Google Scholar] [CrossRef] [PubMed]
- Haddad, E.H.; Sabate, J.; Whitten, C.G. Vegetarian food guide pyramid: A conceptual framework. Am. J. Clin. Nutr. 1999, 70, 615s–619s. [Google Scholar] [CrossRef] [PubMed]
- Butler, T.L.; Fraser, G.E.; Beeson, W.L.; Knutsen, S.F.; Herring, R.P.; Chan, J.; Bennett, H. Cohort profile: The adventist health study-2 (AHS-2). Int. J. Epidemiol. 2008, 37, 260–265. [Google Scholar] [CrossRef] [PubMed]
- Jaceldo-Siegl, K.; Knutsen, S.F.; Sabaté, J.; Beeson, W.L.; Chan, J.; Herring, R.P.; Sharma, S.S. Validation of nutrient intake using an FFQ and repeated 24 h recalls in black and white subjects of the adventist health study-2 (AHS-2). Public Health Nutr. 2010, 13, 812–819. [Google Scholar] [CrossRef] [PubMed]
- Ness, A. Diet Life Expectancy and Chronic Disease. Studies of Seventh-Day Adventists and Other Vegetarians. Gary E Fraser; Oxford University Press: Oxford, UK, 2003; p. 371. [Google Scholar]
- Fraser, G.E. Vegetarian diets: What do we know of their effects on common chronic diseases? Am. J. Clin. Nutr. 2009, 89, 1607s–1612s. [Google Scholar] [CrossRef] [PubMed]
- Barnard, N.D.; Katcher, H.I.; Jenkins, D. J.; Cohen, J.; Turner-McGrievy, G. Vegetarian and vegan diets in type 2 diabetes management. Nutr. Rev. 2009, 67, 255–263. [Google Scholar] [CrossRef] [PubMed]
- Barnard, N.D.; Levin, S.M.; Yokoyama, Y. A systematic review and meta-analysis of changes in body weight in clinical trials of vegetarian diets. J. Acad. Nutr. Diet. 2015, 115, 954–969. [Google Scholar] [CrossRef] [PubMed]
- Yokoyama, Y.; Barnard, N.D.; Levin, S.M.; Watanabe, M. Vegetarian diets and glycemic control in diabetes: A systematic review and meta-analysis. Cardiovasc. Diagn. Ther. 2014, 4, 373–382. [Google Scholar] [PubMed]
- Yokoyama, Y.; Nishimura, K.; Barnard, N.D.; Takegami, M.; Watanabe, M.; Sekikawa, A.; Miyamoto, Y. Vegetarian diets and blood pressure: A meta-analysis. JAMA Intern. Med. 2014, 174, 577–587. [Google Scholar] [CrossRef] [PubMed]
- Ajala, O.; English, P.; Pinkney, J. Systematic review and meta-analysis of different dietary approaches to the management of type 2 diabetes. Am. J. Clin. Nutr. 2013, 97, 505–516. [Google Scholar] [CrossRef] [PubMed]
- Haddad, E.H. Development of a vegetarian food guide. Am. J. Clin. Nutr. 1994, 59, 1248s–1254s. [Google Scholar] [CrossRef] [PubMed]
- International Congress on Vegetarian Nutrition (ICVN). Loma Linda University Vegetarian Food Guide Pyramid 2012. Available online: http://www.vegetariannutrition.org/6icvn/food-pyramid.pdf (accessed on 15 August 2017).
- Willett, W. Nutritional Epidemiology; Oxford University Press: New York, NY, USA, 1998. [Google Scholar]
- Nicklett, E.J.; Kadell, A.R. Fruit and vegetable intake among older adults: A scoping review. Maturitas 2013, 75, 305–312. [Google Scholar] [CrossRef] [PubMed]
- Kushner, R.F.; Choi, S.W. Prevalence of unhealthy lifestyle patterns among overweight and obese adults. Obesity 2010, 18, 1160–1167. [Google Scholar] [CrossRef] [PubMed]
- Shiferaw, B.; Verrill, L.; Booth, H.; Zansky, S.M.; Norton, D.M.; Crim, S.; Henao, O.L. Sex-Based differences in food consumption: Foodborne diseases active surveillance network (foodnet) population survey, 2006–2007. Clin. Infect. Dis. 2012, 54, S453–S457. [Google Scholar] [CrossRef] [PubMed]
- Baker, A.H.; Wardle, J. Sex differences in fruit and vegetable intake in older adults. Appetite 2003, 40, 269–275. [Google Scholar] [CrossRef]
- Wang, Y.; Chen, X. Between-group differences in nutrition-and health-related psychosocial factors among US adults and their associations with diet, exercise, and weight status. J. Acad. Nutr. Diet. 2012, 112, 486–498. [Google Scholar] [CrossRef] [PubMed]
- Davey, G.K.; Spencer, E.A.; Appleby, P.N.; Allen, N.E.; Knox, K.H.; Key, T.J. EPIC-Oxford: Lifestyle characteristics and nutrient intakes in a cohort of 33 883 meat-eaters and 31 546 non meat-eaters in the UK. Public Health Nutr. 2003, 6, 259–269. [Google Scholar] [CrossRef] [PubMed]
- Rizzo, N.S.; Jaceldo-Siegl, K.; Sabate, J.; Fraser, G.E. Nutrient profiles of vegetarian and nonvegetarian dietary patterns. J. Acad. Nutr. Diet. 2013, 113, 1610–1619. [Google Scholar] [CrossRef] [PubMed]
- Craig, W.J.; Mangels, A.R. Position of the American dietetic association: Vegetarian diets. J. Am. Diet. Assoc. 2009, 109, 1266–1282. [Google Scholar] [PubMed]
- Key, T.J.; Appleby, P.N.; Spencer, E.A.; Travis, R.C.; Roddam, A.W.; Allen, N.E. Mortality in British vegetarians: Results from the European prospective investigation into cancer and nutrition (EPIC-Oxford). Am. J. Clin. Nutr. 2009, 89, 1613s–1619s. [Google Scholar] [CrossRef] [PubMed]
- Clarys, P.; Deriemaeker, P.; Huybrechts, I.; Hebbelinck, M.; Mullie, P. Dietary pattern analysis: A comparison between matched vegetarian and omnivorous subjects. Nutr. J. 2013, 12, 82. [Google Scholar] [CrossRef] [PubMed] [Green Version]
- Larsson, C.L.; Johansson, G.K. Dietary intake and nutritional status of young vegans and omnivores in Sweden. Am. J. Clin. Nutr. 2002, 76, 100–106. [Google Scholar] [CrossRef] [PubMed]
- Orlich, M.J.; Jaceldo-Siegl, K.; Sabaté, J.; Fan, J.; Singh, P.N.; Fraser, G.E. Patterns of food consumption among vegetarians and non-vegetarians. Br. J. Nutr. 2014, 112, 1644–1653. [Google Scholar] [CrossRef] [PubMed]
- Deriemaeker, P.; Aerenhouts, D.; Hebbelinck, M.; Clarys, P. Nutrient based estimation of acid-base balance in vegetarians and non-vegetarians. Plant Foods Hum. Nutr. 2010, 65, 77–82. [Google Scholar] [CrossRef] [PubMed]
- Deriemaeker, P.; Aerenhouts, D.; De Ridder, D.; Hebbelinck, M.; Clarys, P. Health aspects, nutrition and physical characteristics in matched samples of institutionalized vegetarian and non-vegetarian elderly (>65 yrs). Nutr. Metab. 2011, 8, 37. [Google Scholar] [CrossRef] [PubMed]
- Turati, F.; Bravi, F.; Di Maso, M.; Bosetti, C.; Polesel, J.; Serraino, D.; Negri, E. Adherence to the world cancer research fund/American institute for cancer research recommendations and colorectal cancer risk. Eur. J. Cancer. 2017, 85, 86–94. [Google Scholar] [CrossRef] [PubMed]
- Romaguera, D.; Gracia-Lavedan, E.; Molinuevo, A.; de Batlle, J.; Mendez, M.; Moreno, V.; Molina, A.J. Adherence to nutrition-based cancer prevention guidelines and breast, prostate and colorectal cancer risk in the MCC-Spain case-control study. Int. J. Cancer. 2017, 141, 83–93. [Google Scholar] [CrossRef] [PubMed]
- Jankovic, N.; Geelen, A.; Winkels, R.M.; Mwungura, B.; Fedirko, V.; Jenab, M.; Franco, O.H. Adherence to the WCRF/AICR dietary recommendations for cancer prevention and risk of cancer in elderly from Europe and the United States: A meta-analysis within the CHANCES project. Cancer Epidemiol. Biomarkers Prev. 2017, 26, 136–144. [Google Scholar] [CrossRef] [PubMed]
- Hastert, T.A.; Beresford, S.A.; Sheppard, L.; White, E. Adherence to the WCRF/AICR cancer prevention recommendations and cancer-specific mortality: Results from the vitamins and lifestyle (VITAL) study. Cancer Causes Control 2014, 25, 541–552. [Google Scholar] [CrossRef] [PubMed]
- Vergnaud, A.C.; Romaguera, D.; Peeters, P.H.; Van Gils, C.H.; Chan, D.S.; Romieu, I.; Dartois, L. Adherence to the world cancer research fund/American institute for cancer research guidelines and risk of death in Europe: Results from the European prospective investigation into nutrition and cancer cohort study. Am. J. Clin. Nutr. 2013, 97, 1107–1120. [Google Scholar] [CrossRef] [PubMed]
- Waijers, P.M.; Feskens, E.J.; Ocke, M.C. A critical review of predefined diet quality scores. Br. J. Nutr. 2007, 97, 219–231. [Google Scholar] [CrossRef] [PubMed]
- Fransen, H.P.; Ocke, M.C. Indices of diet quality. Curr. Opin. Clin. Nutr. Metab. Care 2008, 11, 559–565. [Google Scholar] [CrossRef] [PubMed]

| Component | Diet/Lifestyle Description | Recommendation | Operationalization | Score | Frequency | % |
|---|---|---|---|---|---|---|
| 1: Whole grains | Whole grain bread, cereals such as oatmeal, and brown rice | 6 servings/day per 2000 kcal | <3 servings/day | 0 | 69,456 | 77.1 |
| ≥3 and <6 servings/day | 0.5 | 19,876 | 22.1 | |||
| ≥6 servings/day | 1 | 725 | 0.8 | |||
| 2:Legumes, soy, and meat substitutes | Beans, peas, soy, and meat substitutes | 3 servings/day per 2000 kcal | <1 servings/day | 0 | 25,339 | 28.1 |
| ≥1 and <3 servings/day | 0.5 | 47,490 | 52.7 | |||
| ≥3 serving/day | 1 | 17,228 | 19.1 | |||
| 3: Vegetables | Dark green vegetables, avocado, and 100% vegetable juice | 8 servings/day per 2000 kcal | <4 servings/day | 0 | 45,524 | 50.6 |
| ≥4 and <8 servings/day | 0.5 | 38,310 | 42.5 | |||
| ≥8 serving/day | 1 | 6223 | 6.9 | |||
| 4: Fruits | Fresh and dried fruits, canned or cooked fruits, and 100% fruit juices | 4 servings/day per 2000 kcal | <2 servings/day | 0 | 21,443 | 23.8 |
| ≥2 and <4 servings/day | 0.5 | 35,586 | 39.5 | |||
| ≥4 serving/day | 1 | 33,028 | 36.7 | |||
| 5: Nuts and seeds | Nuts and seeds (raw or roasted) | 1–2 serving/day per 2000 kcal | <4 servings/week | 0 | 25,417 | 28.2 |
| ≥4 servings/week and <1.5 servings/day | 0.5 | 33,261 | 36.9 | |||
| ≥1.5 serving/day | 1 | 31,379 | 34.8 | |||
| 6: Vegetable oils ‡ | Olive oil, and other salad oils | 2 serving/day per 2000 kcal | >4 servings/day | 0 | 4755 | 5.3 |
| >2 and ≤4 servings/day | 0.5 | 28,455 | 31.6 | |||
| 0–2 servings/day | 1 | 56,847 | 63.1 | |||
| 7: Dairy products ‡ | Dairy products, cheese, milk, and yogurt | 2 servings/day per 2000 kcal | <0.5 or >2 servings/day | 0 | 52,484 | 58.3 |
| ≥0.5 and <1 servings/day | 0.5 | 14,561 | 16.2 | |||
| 1–2 servings/day | 1 | 23,012 | 25.6 | |||
| 8: Eggs ‡ | Eggs (fried, boiled, scrambled deviled, plain omelet, egg salad) | 1/2 servings/day per 2000 kcal | >1 servings/day | 0 | 3263 | 3.6 |
| >0.5 and ≤1 servings/day | 0.5 | 11,483 | 12.8 | |||
| ≥0 and ≤0.5 servings/day | 1 | 75,311 | 83.6 | |||
| 9: Sweets ‡ $ | Sweets, sugary beverages, and desserts | Consume sweets and sugary beverages sparingly, per 2000 kcal | >5 servings/week | 0 | 35,877 | 39.8 |
| >2 and ≤5 servings/week | 0.5 | 23,809 | 26.4 | |||
| 0–2 servings/week | 1 | 30,371 | 33.7 | |||
| 10: Reliable sources of vitamin B-12 | Reliable sources of vitamin B-12 from reliable sources including meat, fish, dairy, eggs; yeast, fortification (cereals, meat substitutes, soymilk); supplementations | Meeting the recommended Estimated Average Requirement (EAR) of 2.0 mcg daily of vitamin B-12, based on per 2000 kcal | <1.0 mcg serving equivalent/day | 0 | 11,008 | 12.2 |
| ≥1.0 and <2.0 mcg serving equivalent/day | 0.5 | 24,599 | 27.3 | |||
| ≥2.0 mcg serving equivalent/day | 1 | 54,450 | 60.5 | |||
| 11: Flesh-food intake ‡ | Red meat, processed meat, poultry, and fish | >1 time/week | 0 | 44,898 | 49.9 | |
| ≤1 time/week and >1 time/month | 0.5 | 11,521 | 12.8 | |||
| ≤1 time/month | 1 | 33,638 | 37.4 | |||
| Lifestyle Component | ||||||
| 12:Daily exercise ¥ | Moderate/rigorous physical activity | 30 min/day to avoid chronic disease, and 60 min/day for weight loss | ≤0 min/day of moderate OR ≤0 min/day of vigorous exercise | 0 | 18,949 | 21.0 |
| >0 and <30 min/day of moderate exercise OR >0 and <15 min/day of vigorous exercise | 0.5 | 66,608 | 74.0 | |||
| ≥30 min/day of moderate OR ≥15 min/day of vigorous exercise | 1 | 4500 | 5.0 | |||
| 13:Water intake | Drinking water | At least eight, 8-oz glasses of water daily, per 2000 kcal | <4 glasses of water/day | 0 | 33,616 | 37.3 |
| ≥4 and <8 glasses of water/day | 0.5 | 37,276 | 41.4 | |||
| ≥8 glasses of water/day | 1 | 19,165 | 21.3 | |||
| 14:Sunlight exposure * | Adequate exposure to sunlight | At least 10 min of sun a day to activate vitamin D | <5 min/day | 0 | 2436 | 2.7 |
| ≥5 and <10 min/day | 0.5 | 725 | 0.8 | |||
| ≥10 min/day | 1 | 86,896 | 96.5 | |||
| No. of Participants (%) | Mean | ±SD | P25 | P75 | IQR | p-Value | p-Trend | |
|---|---|---|---|---|---|---|---|---|
| Participant characteristics, scores | 90,057 (100%) | 7.43 | 1.75 | 6.00 | 9.00 | 3.00 | - | - |
| Gender | <0.0001 | |||||||
| Female | 58,265 (64.7) | 7.48 | 1.75 | 6.00 | 9.00 | 3.00 | [ref] | |
| Male | 31,792 (35.3) | 7.36 | 1.75 | 6.00 | 8.50 | 2.50 | <0.0001 | |
| Age | <0.0001 | |||||||
| Less than 50 years | 28,615 (31.8) | 7.22 | 1.76 | 6.00 | 8.50 | 2.50 | [ref] | |
| 50–64 years | 29,372 (32.6) | 7.46 | 1.76 | 6.00 | 9.00 | 3.00 | <0.0001 | |
| Greater than 64 years | 32,070 (35.6) | 7.61 | 1.72 | 6.50 | 9.00 | 2.50 | <0.0001 | |
| Race | ||||||||
| Non-black | 66,557 (74.6) | 7.55 | 1.77 | 6.50 | 9.00 | 2.50 | [ref] | |
| Black | 22,703 (25.4) | 7.09 | 1.66 | 6.00 | 8.50 | 2.50 | <0.0001 | |
| Ethnicity | ||||||||
| White | 59,259 (66.4) | 7.57 | 1.78 | 6.50 | 9.00 | 2.50 | [ref] | |
| Black | 22,481 (25.2) | 7.09 | 1.66 | 6.00 | 8.50 | 2.50 | <0.0001 | |
| Hispanic | 3485 (3.9) | 7.32 | 1.73 | 6.00 | 8.50 | 2.50 | <0.0001 | |
| Middle Eastern | 120 (0.1) | 7.59 | 1.65 | 6.50 | 9.00 | 2.50 | 0.9158 | |
| Asian | 2705 (3.0) | 7.53 | 1.58 | 6.50 | 8.50 | 2.00 | 0.2749 | |
| Hawaiian | 94 (0.1) | 6.86 | 1.71 | 5.50 | 8.00 | 2.50 | <0.0001 | |
| American Indian | 323 (0.4) | 7.02 | 1.81 | 5.50 | 8.50 | 3.00 | <0.0001 | |
| Mixed | 793 (0.9) | 7.31 | 1.74 | 6.00 | 8.50 | 2.50 | <0.0001 | |
| Family history of cancer | <0.0001 | |||||||
| No | 5222 (5.8) | 7.33 | 1.73 | 6.00 | 8.50 | 2.50 | <0.0001 | |
| Yes | 84,835 (94.2) | 7.44 | 1.76 | 6.00 | 9.00 | 3.00 | [ref] | |
| BMI ‡ | <0.0001 | |||||||
| Underweight | 1682 (1.9) | 8.06 | 1.72 | 7.00 | 9.50 | 2.50 | <0.0001 | |
| Normal weight | 35,225 (39.1) | 7.87 | 1.69 | 6.50 | 9.00 | 2.50 | [ref] | |
| Overweight | 31,322 (34.8) | 7.33 | 1.71 | 6.00 | 8.50 | 2.50 | <0.0001 | |
| Obese | 21,828 (24.2) | 6.83 | 1.72 | 5.50 | 8.00 | 2.50 | <0.0001 | |
| Smoking status | <0.0001 | |||||||
| Never | 72,129 (80.1) | 7.55 | 1.72 | 6.50 | 9.00 | 2.50 | [ref] | |
| In the past | 16,945 (18.8) | 7.03 | 1.79 | 5.50 | 8.50 | 3.00 | <0.0001 | |
| Current | 983 (1.1) | 5.54 | 1.54 | 4.50 | 6.50 | 2.00 | <0.0001 | |
| Alcohol use | <0.0001 | |||||||
| Never | 53,482 (59.4) | 7.70 | 1.69 | 6.50 | 9.00 | 2.50 | [ref] | |
| In the past | 27,706 (30.8) | 7.23 | 1.78 | 6.00 | 8.50 | 2.50 | <0.0001 | |
| Current | 8869 (9.9) | 6.44 | 1.62 | 5.50 | 7.50 | 2.00 | <0.0001 | |
| Marital status | ||||||||
| Never married | 5641 (6.3) | 7.17 | 1.77 | 6.00 | 8.50 | 2.50 | <0.0001 | |
| Currently married | 65,021 (72.2) | 7.49 | 1.75 | 6.00 | 9.00 | 3.00 | [ref] | |
| Married in the past | 19,395 (21.5) | 7.31 | 1.75 | 6.00 | 8.50 | 2.50 | <0.0001 | |
| Household income, $USD per year | <0.0001 | |||||||
| Less than 10,000 | 5641 (6.3) | 7.17 | 1.77 | 6.00 | 8.50 | 3.00 | [ref] | |
| 10,000 to 75,000 | 65,021 (72.2) | 7.49 | 1.75 | 6.00 | 9.00 | 2.50 | 0.2738 | |
| >75,000 to 200,000 | 19,395 (21.5) | 7.31 | 1.75 | 6.00 | 9.00 | 2.50 | 0.1444 | |
| More than 200,000 | 5641 (6.3) | 7.17 | 1.77 | 6.50 | 9.00 | 2.00 | 0.5958 | |
| Education level | <0.0001 | |||||||
| High school or less | 19,508 (21.7) | 7.10 | 1.78 | 6.00 | 8.50 | 2.50 | [ref] | |
| Trade school, associate degree, or some college | 35,560 (39.5) | 7.37 | 1.77 | 6.00 | 8.50 | <0.0001 | ||
| Bachelor degree | 18,976 (21.1) | 7.62 | 1.70 | 6.50 | 9.00 | 2.50 | <0.0001 | |
| Graduate degree | 16,013 (17.8) | 7.78 | 1.66 | 6.50 | 9.00 | 2.50 | <0.0001 |
| Unadjusted Model | Adjusted Model | ||||||||||
|---|---|---|---|---|---|---|---|---|---|---|---|
| 1 | 2 | 3 | 4 | ||||||||
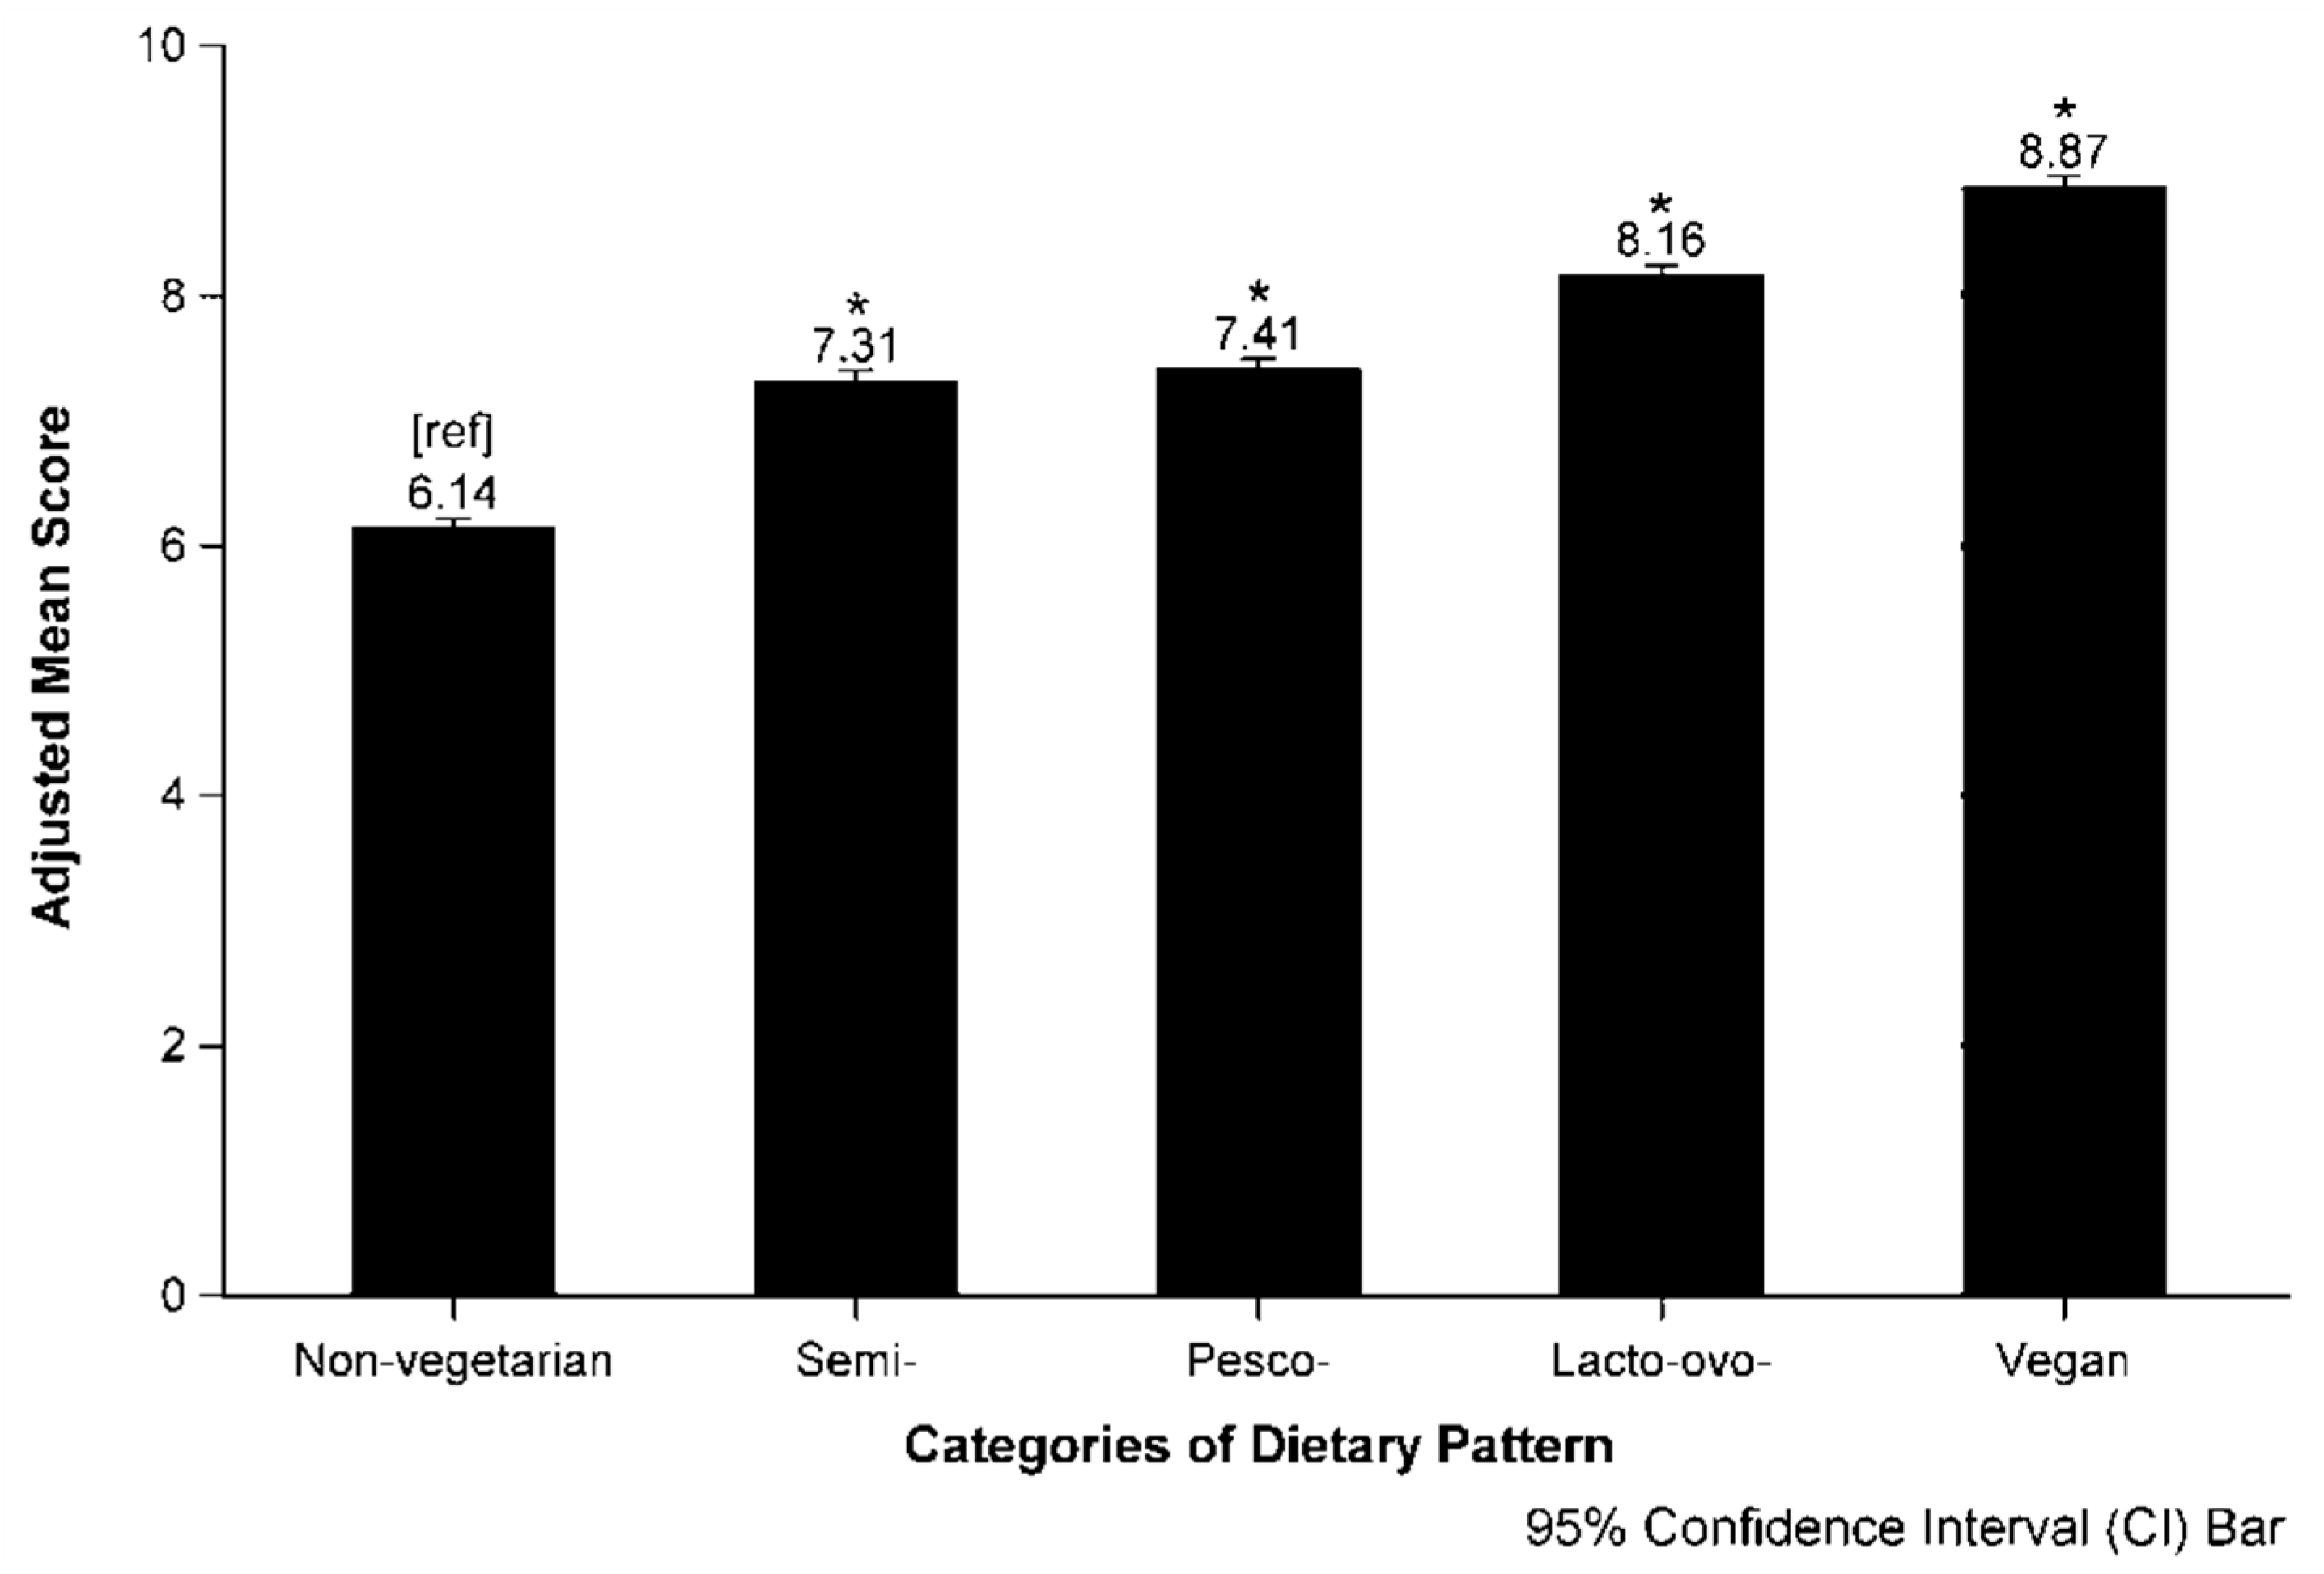
| Dietary pattern | n (%) | Mean (±SD) | 95% CI | Mean | 95% CI | Mean | 95% CI | Mean | 95% CI | ||
| Non-vegetarian | 42,954 (47.7) | 6.38 (1.48) | 6.36, 6.39 | 6.45 | 6.40, 6.51 | 6.15 | 6.09, 6.21 | 6.14 | 6.06, 6.21 | ||
| Vegetarian | |||||||||||
| Semi- | 5,007 (5.6) | 7.61 (1.42) | 7.58, 7.65 | 7.69 | 7.62, 7.76 | 7.31 | 7.24, 7.38 | 7.31 | 7.22, 7.40 | ||
| Pesco- | 9,078 (10.1) | 7.78 (1.34) | 7.75, 7.81 | 7.83 | 7.77, 7.89 | 7.42 | 7.35, 7.49 | 7.41 | 7.32, 7.49 | ||
| Lacto-ovo- | 26,101 (29.0) | 8.54 (1.30) | 8.52, 8.55 | 8.63 | 8.57, 8.68 | 8.18 | 8.12, 8.25 | 8.16 | 8.08, 8.24 | ||
| Vegan | 6,917 (7.7) | 9.27 (1.05) | 9.24, 9.30 | 9.35 | 9.29, 9.42 | 8.85 | 8.78, 8.92 | 8.87 | 8.78, 8.96 | ||
© 2018 by the authors. Licensee MDPI, Basel, Switzerland. This article is an open access article distributed under the terms and conditions of the Creative Commons Attribution (CC BY) license (http://creativecommons.org/licenses/by/4.0/).
Share and Cite
Le, L.T.; Sabaté, J.; Singh, P.N.; Jaceldo-Siegl, K. The Design, Development and Evaluation of the Vegetarian Lifestyle Index on Dietary Patterns among Vegetarians and Non-Vegetarians. Nutrients 2018, 10, 542. https://doi.org/10.3390/nu10050542
Le LT, Sabaté J, Singh PN, Jaceldo-Siegl K. The Design, Development and Evaluation of the Vegetarian Lifestyle Index on Dietary Patterns among Vegetarians and Non-Vegetarians. Nutrients. 2018; 10(5):542. https://doi.org/10.3390/nu10050542
Chicago/Turabian StyleLe, Lap T., Joan Sabaté, Pramil N. Singh, and Karen Jaceldo-Siegl. 2018. "The Design, Development and Evaluation of the Vegetarian Lifestyle Index on Dietary Patterns among Vegetarians and Non-Vegetarians" Nutrients 10, no. 5: 542. https://doi.org/10.3390/nu10050542