The Effect of Vitamin D Supplementation on Glycemic Control in Type 2 Diabetes Patients: A Systematic Review and Meta-Analysis


School of Public Health, Peking University Health Science Center, 38 Xueyuan Road, Beijing 100191, China
*
Author to whom correspondence should be addressed.
Nutrients 2018, 10(3), 375; https://doi.org/10.3390/nu10030375
Submission received: 14 January 2018
/
Revised: 13 March 2018
/
Accepted: 15 March 2018
/
Published: 19 March 2018
Abstract
:Observational studies have indicated an inverse association between vitamin D levels and the risk of diabetes, yet evidence from population interventions remains inconsistent. PubMed, EMBASE, Cochrane Library and ClinicalTrials.gov were searched up to September 2017. Data from studies regarding serum 25(OH)D, fasting blood glucose (FBG), hemoglobin A1c (HbA1c), fasting insulin and homeostasis model assessment of insulin resistance (HOMA-IR) were pooled. Twenty studies (n = 2703) were included in the meta-analysis. Vitamin D supplementation resulted in a significant improvement in serum 25(OH)D levels (weighted mean difference (WMD) = 33.98; 95%CI: 24.60–43.37) and HOMA-IR (standardized mean difference (SMD) = −0.57; 95%CI: −1.09~−0.04), but not in other outcomes. However, preferred changes were observed in subgroups as follows: short-term (WMDFBG = −8.44; 95%CI: −12.72~−4.15), high dose (WMDFBG = −8.70; 95%CI: −12.96~−4.44), non-obese (SMDFasting insulin = −1.80; 95%CI: −2.66~−0.95), Middle Easterners (WMDFBG = −10.43; 95%CI: −14.80~−6.06), baseline vitamin D deficient individuals (WMDFBG = −5.77; 95%CI: −10.48~−1.05) and well-controlled HbA1c individuals (WMDFBG = −4.09; 95%CI: −15.44~7.27). Vitamin D supplementation was shown to increase serum 25(OH)D and reduce insulin resistance effectively. This effect was especially prominent when vitamin D was given in large doses and for a short period of time, and to patients who were non-obese, Middle Eastern, vitamin D deficient, or with optimal glycemic control at baseline.
1. Introduction
Type 2 diabetes (T2D) has become a global health care problem. In 2016, there were 38 million diabetes patients worldwide, with 2.8 million years lived with disability [1]. Efforts have been devoted to finding innovative approaches for diabetes prevention and treatment, and a recent focus has been on vitamin D supplementation. Observational studies have indicated an association between vitamin D deficiency and the onset and progression of T2D as well as future macrovascular events [2,3,4,5,6]. Moreover, in vivo and in vitro studies have proposed potential roles of vitamin D in glucose metabolism, e.g., stimulating insulin secretion via the vitamin D receptor on pancreatic β cells; modulating immune responses and lowering systematic inflammation; and reducing peripheral insulin resistance through vitamin D receptors in the muscles and liver [7,8,9]. However, evidence from interventional studies at a population level have been inconclusive. Recently, three meta-analyses observed no benefits of vitamin D supplementation on glycemic indices and insulin resistance except for a modest reduction of hemoglobin A1c (HbA1c) (0.32–0.39%), although they did not separate intramuscular injections from oral supplementation, or fortified food from nutrient supplementation alone [10,11,12]. Additionally, co-supplementation of calcium plus vitamin D, versus a control group given vitamin C further introduced more heterogeneity in the studies. On the contrary, Mirhosseini et al. found significant positive effects of vitamin D supplementation on fasting blood glucose (FBG), HbA1c and a homeostasis model assessment of insulin resistance (HOMA-IR), yet it calculated one study with considerable influence twice in the pooled analysis and combined results reported as median and interquartile range together with those reported as mean and standard deviation [13].
The aim of the current review was to evaluate the effects of oral vitamin D supplementation on glycemic control in T2D patients compared with a placebo, and to assess various factors’ influences on supplementation effects.
2. Methods
This systematic review was performed according to the Preferred Reporting Items for Systematic Reviews and Meta-analysis (PRISMA) statement [14].
2.1. Selection of Studies
Studies were regarded as eligible if they (1) were randomized controlled trials that evaluated the glycemic effect of vitamin D supplementation in T2D patients; (2) used oral vitamin D formulations containing cholecalciferol or ergocalciferol; (3) reported at least one of the following primary outcomes of interest: serum 25(OH)D concentration, FBG, HbA1c, HOMA-IR and fasting insulin; and (4) had a trial length ≥ 8 weeks.
Exclusion criteria were as follows: (1) intramuscular delivery of vitamin D with different absorptions between oral and intramuscular routes; (2) studies involving participants with type 1 diabetes, gestational diabetes or conditions that could potentially alter vitamin D metabolism (e.g., chronic kidney disease Stage 4 or higher, or hyperparathyroidism); (3) studies involving participants < 18 years; (4) studies in which non placebo controls, such as calcium, were allowed when given to both groups; and (5) observational studies, review articles, case reports, editorials and poster abstracts.
2.2. Data Sources and Search Strategy
We searched databases including PubMed, EMBASE and Cochrane Central Register of Controlled Trials (CENTRAL) from inception to September 2017 to identify relevant studies published in English. We also searched NIH’s clinical trials registry (www.clinicaltrials.gov) for unpublished but completed trials. The reference lists of the index reviews were also reviewed to identify additional eligible studies. The following search strategy was run in PubMed and tailored to each database when necessary: (randomized controlled trial OR controlled clinical trial OR random OR clinical trial OR controlled trial OR RCT NOT review NOT animal) AND (vitamin D OR vitamin D2 OR vitamin D3 OR cholecalciferol OR ergocalciferol OR alphacalcidol OR alfacalcidol OR paricalcitol OR doxercalciferol OR calcitriol OR 25-Hydroxyvitamin D) AND (diabetes OR diabetes mellitus OR T2DM OR hyperglycemia OR hyperglycaemia OR glucose OR HbA1c OR glycated hemoglobin OR insulin resistance OR insulin sensitivity OR HOMA OR glucose homeostasis OR insulin secretion OR insulin OR beta-cell function OR glycemic control OR glycemic control OR glucose tolerance OR glucose metabolism).
2.3. Data Extraction and Risk of Bias Assessment
Pairs of independent reviewers screened the titles and the abstracts of each study prior to full text screening of candidate studies. Any discrepancies in terms of the decision on a given study were dealt with via discussion and, if necessary, arbitration by a third reviewer. For all included studies, two reviewers independently extracted information regarding basic information (authors, year, country, sample size, attrition rate), participants’ characteristics (gender, age, body mass index (BMI), ethnicity), intervention features (treatment, type, dose, and therapy duration) and results (baseline and post-test serum vitamin D, FBG, HbA1c and fasting insulin). For studies assessing the differences between a placebo, a vitamin D, a calcium and a vitamin D plus calcium group, we only used the vitamin D and placebo groups.
Two reviewers independently assessed the risk of bias of trials according to the Cochrane risk of bias assessment tool and assigned “high” or “low” or “unclear” to the following items: random sequence generation; allocation concealment; blinding of participants and personnel; blinding of outcome assessment; selective reporting; and other sources of bias [15].
2.4. Data Analysis and Rating Quality of Evidence
We combined the pre- and post-changes of each outcome with the random effects model due to diverse participant demographics and intervention characteristics; this was reported with weighted mean differences (WMD) for scales that were the same, or standardized mean differences (SMD) otherwise. Substantial heterogeneity was indicated as p < 0.1 in the χ2 test and an I2 > 50% [16].
Sensitivity analyses were completed to detect the robustness of the statistical results and analyze possible sources of heterogeneity, using an alternative summary statistic (standardized versus weighted mean difference) and statistical model (fixed versus random effects model), excluding studies on a one by one basis, followed by the exclusion of those with a high risk of bias.
When an adequate number of studies ensuring the power of tests, Funnel plots and Egger’s test had been conducted, to identify any publication bias. Subgroup analyses were performed to explore impacts of certain characteristics: supplementation dose, duration, ethnicity, BMI status (normal ≤ 24.9 kg/m2, overweight 25–29.9 kg/m2, obese ≥ 30 kg/m2) [17], baseline vitamin D status (deficiency < 50 nmol/L, insufficiency 50–75 nmol/L, sufficiency > 75 nmol/L) [18] and baseline HbA1c condition. Univariate and multivariate meta-regressions, if possible, were performed to detect whether %female, BMI, serum vitamin D concentration, FBG, or HbA1c at baseline were associated with the results. All data were analyzed using Stata 14.0 and Cochrane Review Manager (RevMan) 5.3.
The GRADE approach was used to rate the quality of evidence for each outcome. The strength of the evidence was categorized as high, moderate, low or very low [19].
3. Results
Of the 1963 articles, 32 remained as potentially eligible after title and abstract screening; of these, 20 randomized controlled trials involving 2703 participants were included in the review (Figure 1) [20,21,22,23,24,25,26,27,28,29,30,31,32,33,34,35,36,37,38,39].
3.1. Study Characteristics
Characteristics of all 20 studies are presented in Table 1. Among those, eight enrolled Middle Easterners [21,22,23,29,31,34,36,38], four enrolled individuals from other Asian countries [26,32,33,39], seven enrolled other ethnicities [20,24,25,27,28,35,37] and the one was conducted in 33 countries [30], with participants mainly from 48 to 67 years old. The intervention duration ranged from 2 to 6 months (median was 3 months). Vitamin D3 was used in 17 studies and vitamin D2 in one study [35], while the other two failed to report the type in detail [31,38]. Only two trials applied vitamin D and calcium co-supplementation (same doses of calcium also given to control groups) [32,33]. The other studies provided vitamin D supplementation alone.
3.2. Risk of Bias
The risk of bias assessments of the included studies are summarized in Figure 2. Ten, six and four studies were categorized as having high, low and unclear risks of bias, respectively. Attrition and reporting bias were primary sources of bias.
3.3. The Effect on Serum Vitamin D Level
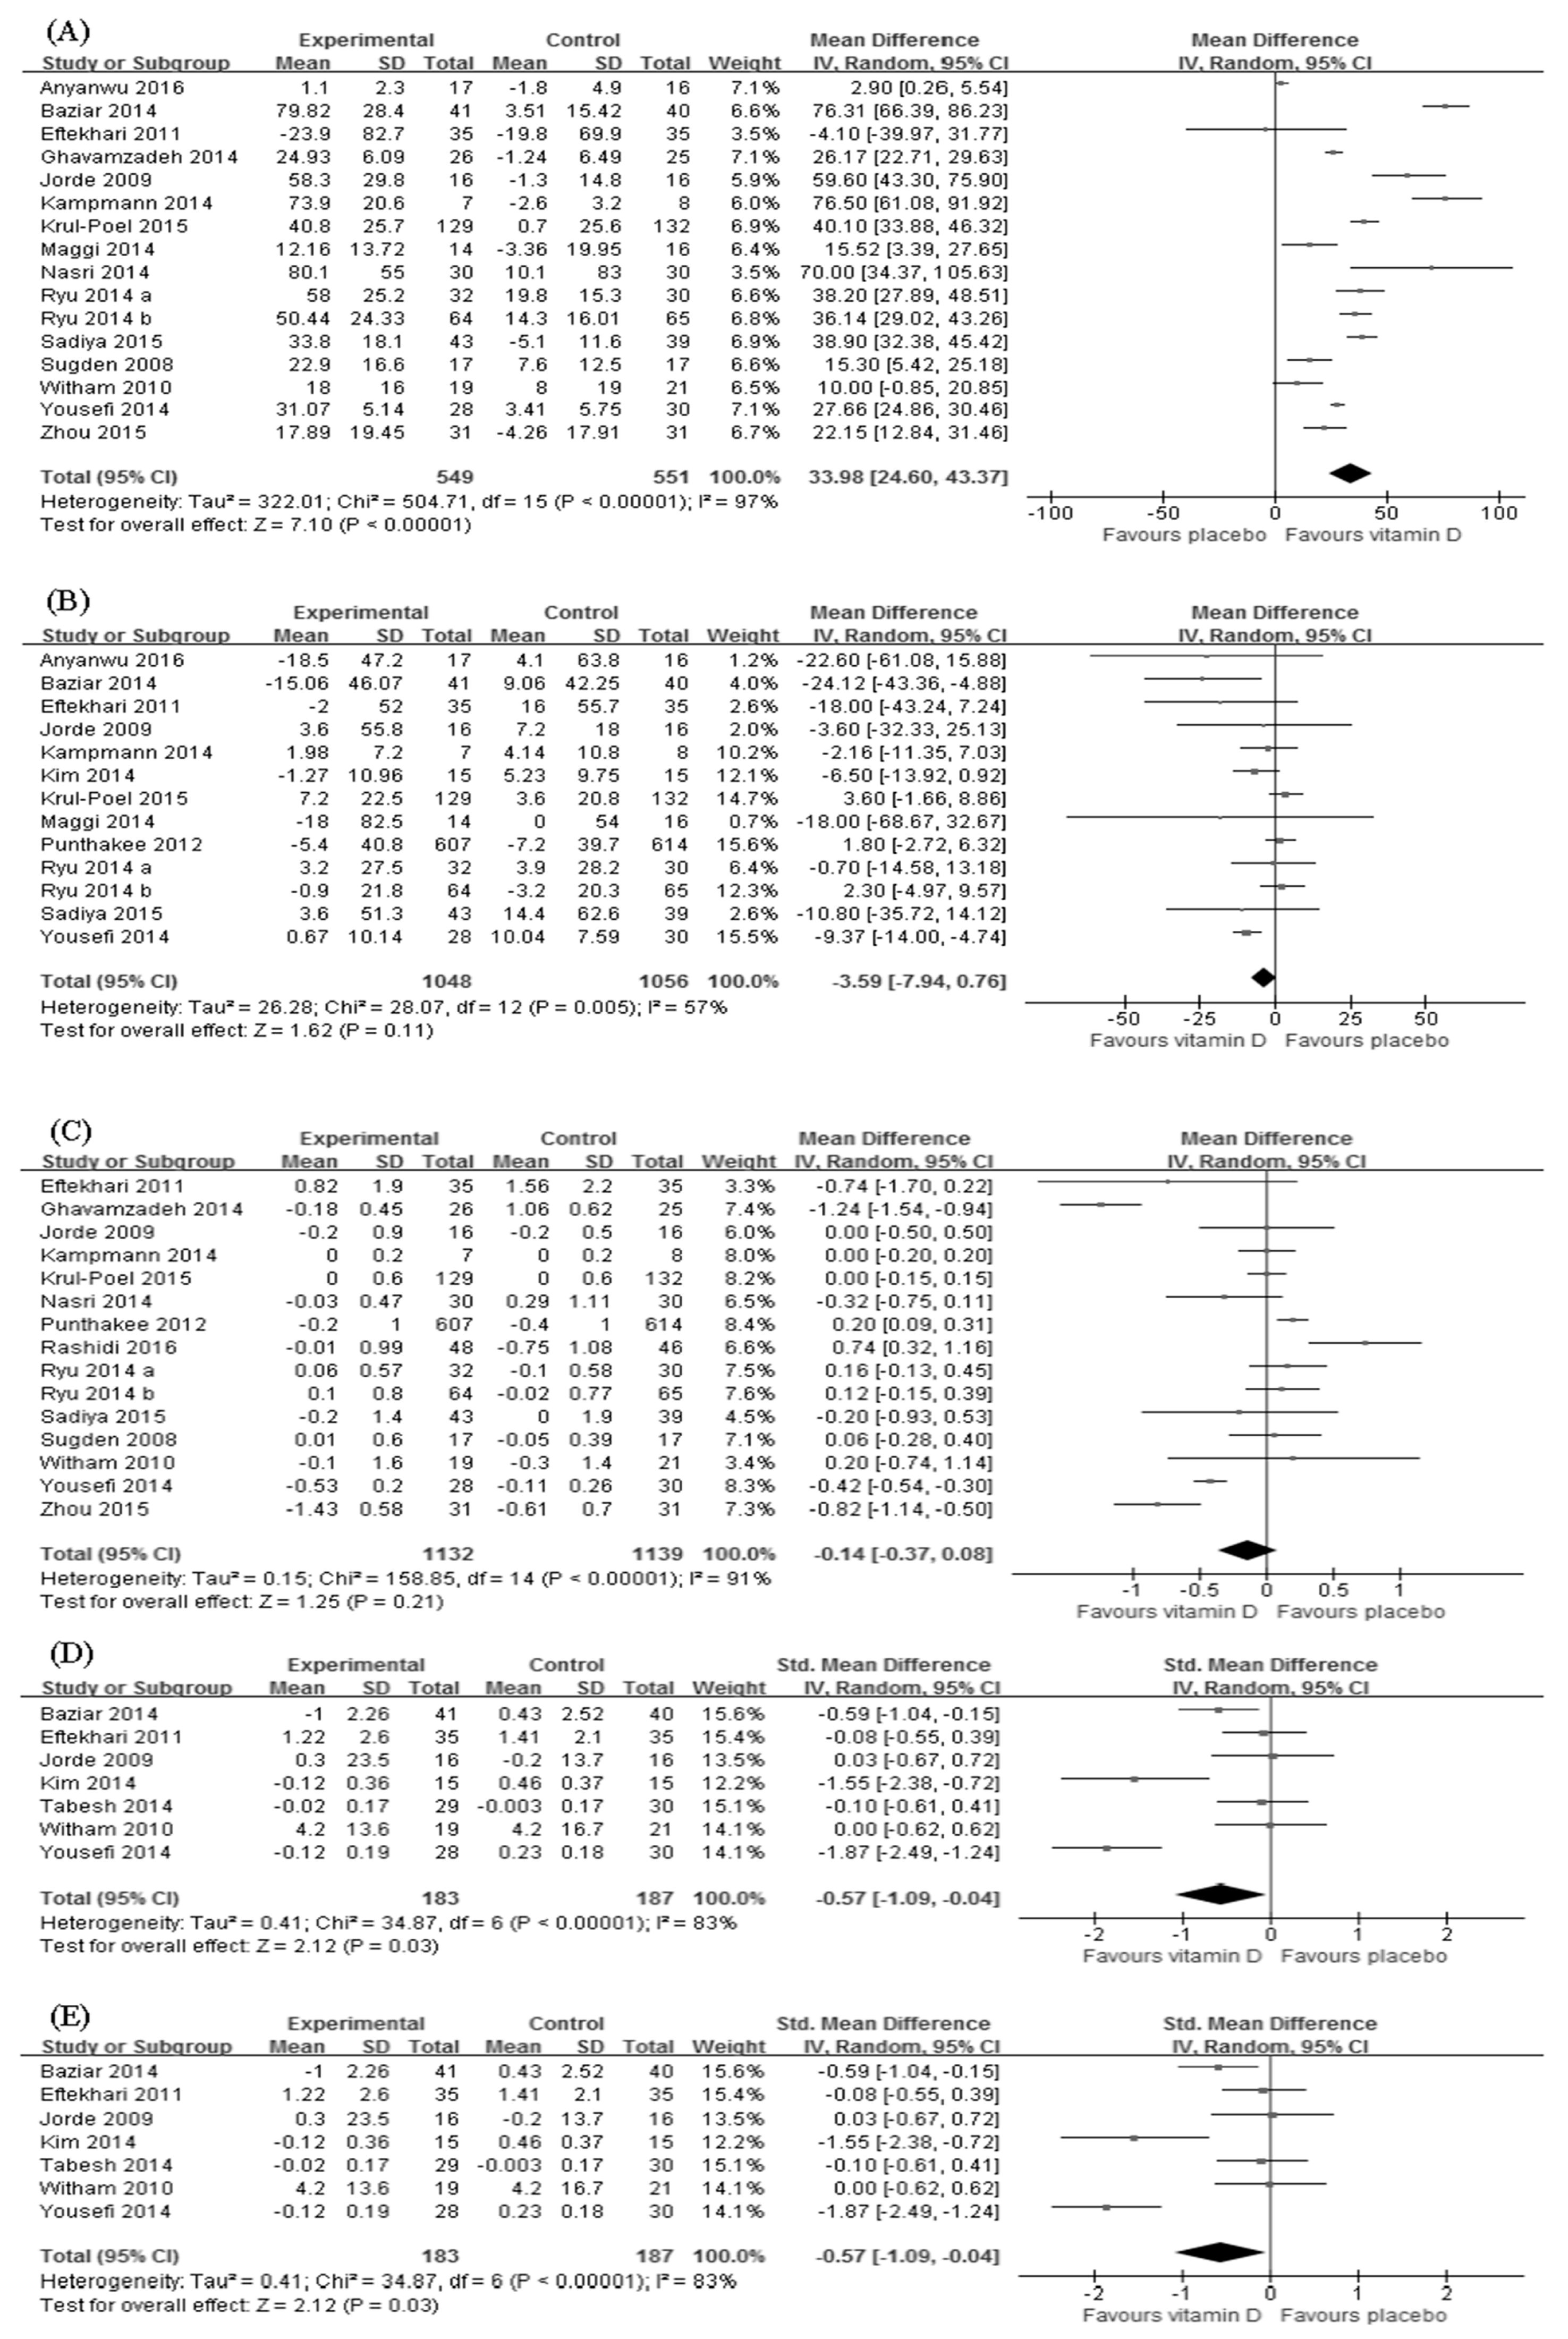
Sixteen trials (n = 1284) reported the change in serum vitamin D level after the intervention [20,21,22,23,24,25,27,28,29,32,33,34,35,37,38,39]. There was a significant increase in the serum vitamin D level in the vitamin D supplementation group (WMD = 33.98; 95%CI: 24.60–43.37; p < 0.001) (Figure 3A), albeit with substantial heterogeneity (p < 0.001; I2 = 97%). Subgroup analyses suggested similar findings in all subgroups except for participants with sufficient vitamin D prior to the intervention (Table 2).
3.4. The Effect on FBG
Thirteen trials (n = 2198) measured the effect of vitamin D supplementation on FBG [20,21,22,24,25,26,27,28,30,32,33,34,38]. Overall, we observed no difference in FBG reduction between intervention and control groups (WMD = −3.59; 95%CI: −7.94–0.76; p = 0.11). The heterogeneity was moderate (p = 0.005; I2 = 57%) (Figure 3B). However, vitamin D supplementation produced significant decreases in the following subgroups: Middle Easterners, dose > 2000 IU/day, study duration ≤ 3 months and baseline vitamin D deficient (Table 2).
3.5. The Effect on HbA1c
Changes in HbA1c was assessed in 15 trials (n = 2454) [22,23,24,25,27,29,30,31,32,33,34,35,37,38,39]. Compared with controls, the difference in HbA1c reduction was insignificant (WMD = −0.11; 95%CI: −0.35–0.13; p = 0.38) (Figure 3C) and had high heterogeneity (p < 0.001; I2 = 92%). Nevertheless, effects shown in other ethnicities and obesity subgroups were significantly in favor of the control group (Table 2).
3.6. The Effect on HOMA-IR
The effect of vitamin D supplementation on HOMA-IR was evaluated in seven trials (n = 409) [21,22,24,26,36,37,38]. We found a larger reduction of HOMA-IR in intervention groups than in placebo groups (SMD = −0.57; 95%CI: −1.09~−0.04; p = 0.03) although the heterogeneity was significant (p < 0.001; I2 = 83%) (Figure 3D). Similar results were demonstrated in subgroups of duration ≤ 3 months, other Asians, normal BMI, and baseline vitamin D deficient (Table 2).
3.7. The Effect of Fasting Insulin
Only four (n = 364) out of 20 randomized controlled trials measured fasting insulin [21,25,26,38]. Results showed no significant effect of vitamin D supplementation on fasting insulin (SMD = −0.84; 95%CI: −2.27–0.60; p = 0.25) (Figure 3E). The heterogeneity was relatively high (p < 0.001; I2 = 93%). However, preferred changes were manifested in the following subgroups: other Asians, normal BMI, vitamin D dose ≤ 2000 IU/day and baseline HbA1c > 7%. In contrast, other ethnicities and obesity subgroups showed preferred changes that were significantly in favor of the control group (Table 2).
3.8. Meta-Regression
The univariate meta-regression suggested that a higher baseline FBG was associated with a better effect of vitamin D supplementation in FBG (p = 0.04). However, this association vanished after adjusting for % female, BMI, baseline serum vitamin D and HbA1c in the multivariate meta-regression (p = 0.10).
3.9. Sensitivity Analyses
Findings regarding serum vitamin D levels and glycemic indices basically remained robust in the sensitivity analysis. However, the significant effect of vitamin D supplementation on HOMA-IR disappeared when excluding Baziar et al. [21], Yousefi et al. [38], Kim et al. [26] and trials carrying a high risk of bias [24,26,36]. On the contrary, the improvement of FBG became significant after Kampmann et al. and Krul-Poel et al. were excluded and an alternative summary statistic was used [25,27]. In addition, excluding Yousefi et al. from the meta-analysis of FBG resulted in a decrease in heterogeneity from 57% to 33% [38].
3.10. Publication Bias
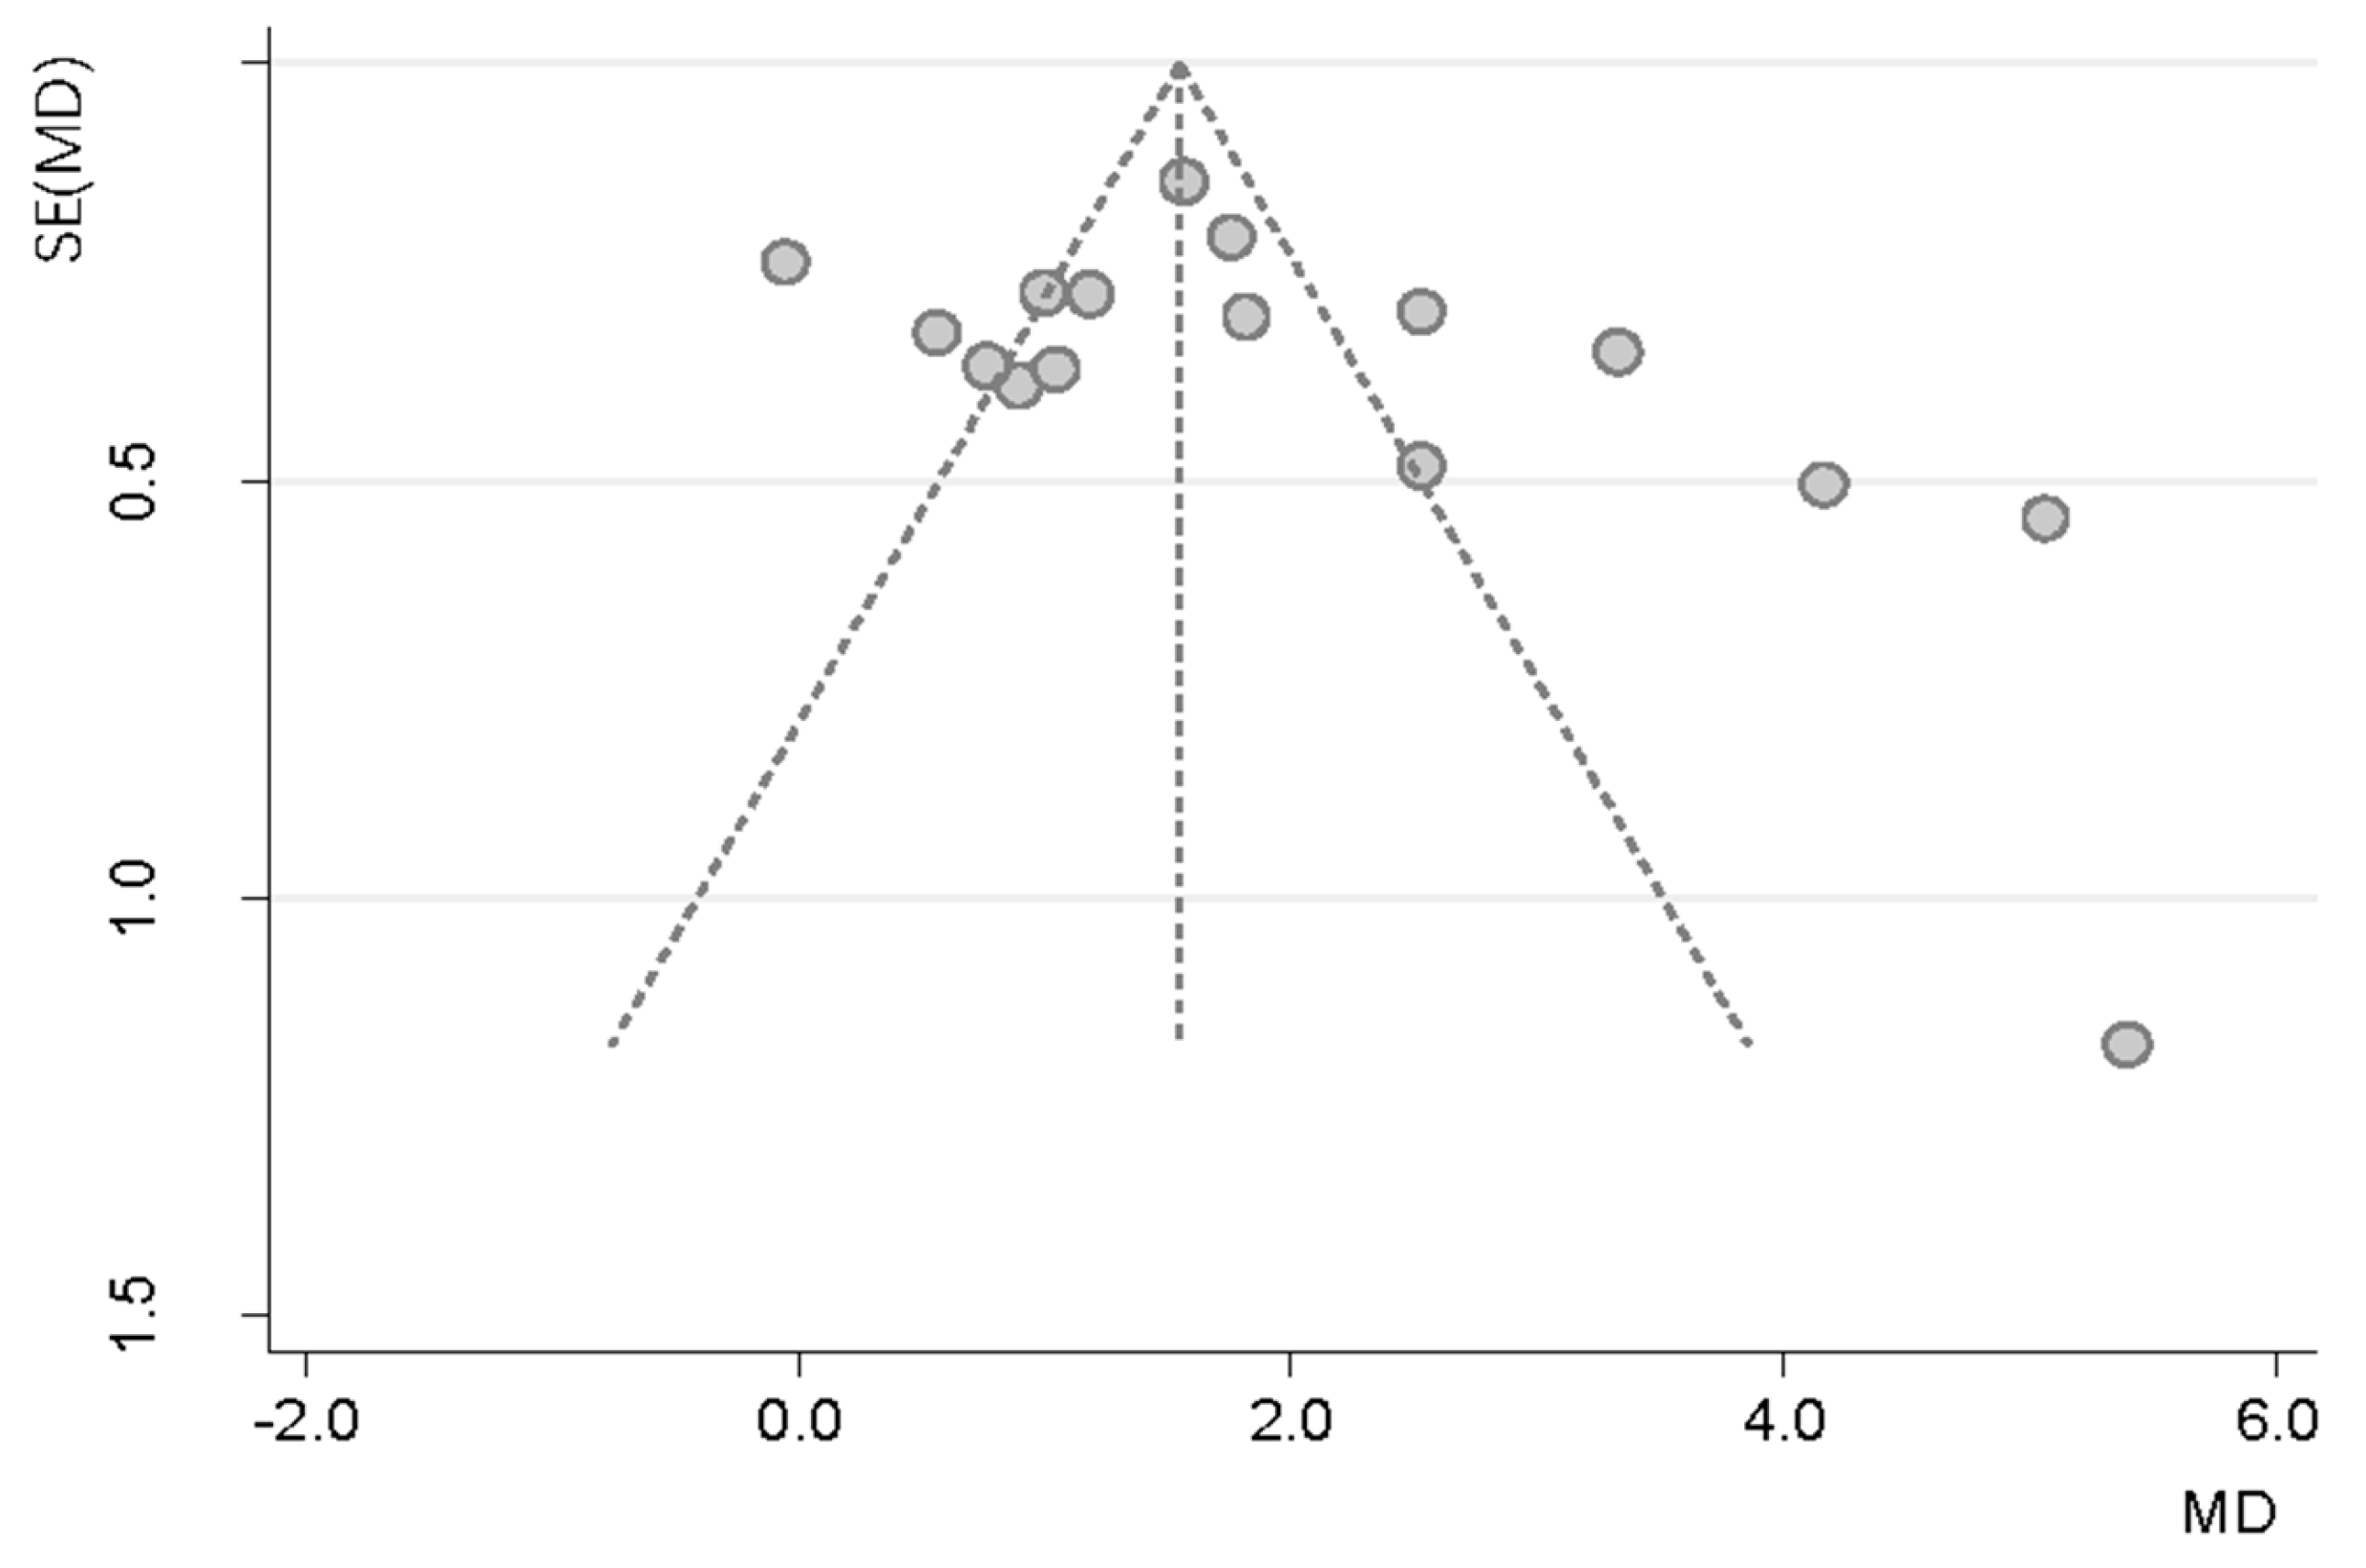
The funnel plot and statistical test showed no evidence of a publication bias (Figure 4; Egger’s test: p = 0.81; 95%CI: −5.39–6.77).
3.11. Quality of Evidence
Table 3 presents the quality of evidence by outcome, assessed with the GRADE system. Evidence quality was classified as low for serum vitamin D level and HOMA-IR, and very low for FBG, HbA1c and fasting insulin.
4. Discussion
This meta-analysis found that compared with placebo, oral vitamin D supplementation yielded better effects on HOMA-IR in T2D patients, although the result was not very robust when excluding studies one by one, and it was subject to substantial heterogeneity partially from the diversity between durations, ethnicities, BMIs and baseline vitamin D statuses across the studies. In contrast, we observed no benefit of vitamin D supplementation in regard to improving FBG, HbA1c and fasting insulin. However, despite the overall null finding, characteristics of the intervention and population greatly influenced the effects, and significant positive effects emerged in several subgroups.
In terms of the intervention, daily doses of more than 2000 IU/day were consistently associated with a higher post-test vitamin D status and larger improvement of glycemic indices. The appropriate dose of vitamin D to achieve non-skeletal benefits still remains unclear. Some observational studies indicated that supraphysiological dosing of vitamin D could be harmful; however, the most common dosing of supplementation, 2000 IU/day, was much lower than that, as well as than the debated dosing required for efficacy, 4000 to 5000 IU/day [13,40]. Under these conditions, the benefits of higher doses seemed reasonable since high doses increased the chances of correcting vitamin D deficiency or achieving favorable levels of serum 25(OH)D, confirmed by relatively higher 25(OH)D levels in the high dose subgroup after intervention (78.52 versus 75.01 nmol/L in the low dose subgroup).
The impact of intervention duration was more ambiguous. Contrary to the findings of Lee et al. and Mirhosseini et al. that longer durations of supplementation were associated with larger reductions in glycemic control, which was possibly due to the 2–3 month lifespan of HbA1c [11,13], our results were in line with Krul-Poel et al. and suggested the effects of vitamin D supplementation were mainly manifested in durations shorter than 3 months [10]. A potential explanation was the difference in doses. Actually, the average dose of studies included in the short-term subgroup was much higher than that in the long-term subgroups (3000 versus 1833 IU/day). In addition, the worsening of diabetic conditions over time could also attenuate the effects of a long-term intervention.
Apart from intervention features, several characteristics of participants also played important roles in modifying the efficacy of supplementation. First, significant reductions in FBG and HOMA-IR were observed in patients with vitamin D deficiency but not in patients with vitamin D insufficiency or sufficiency. Similarly, we found that even though 25(OH)D increased significantly in all subgroups, the highest improvement came in vitamin D deficient patients. This might be responsible for advantages in FBG and HOMA-IR shown in the vitamin D deficient group and could be because in the sufficient group the excess vitamin D from supplementation was stored in adipose tissue rather than triggering a further increase in serum level.
Second, vitamin D supplementation produced different effects among various ethnicities with a similar trend: Middle Easterners showed the biggest reduction, the other Asians the second, and other ethnicities had the smallest preferred changes. Incongruent results in subgroup analyses of HOMA-IR and fasting insulin were due to the limited number of studies that measured these variables. As Wang et al. demonstrated that vitamin D-binding protein polymorphism was associated with increased susceptibility to T2D in Asians, but not in Caucasians; this might explain the heterogeneous responses between Asians and the other groups [41]. In addition, studies found that populations with darker skin color and cultural preferences toward less exposure to the sun, which matched the profile of Middle Easterners, were at a higher risk of vitamin D deficiency, and that, in turn, was associated with better effects from supplementation [42,43]. However, none of the studies we included in the analysis were based on American participants’ data. Thus, the supplementation effect of vitamin D in this population warrants further investigation in the future.
Third, better glycemic parameters appeared in non-obese patients. This observation is somewhat opposite to previous studies that suggested that BMI was negatively associated with serum 25(OH)D concentration and that supplementation would be especially helpful in obese patients [44]; however, a recent meta-analysis supports our finding that the obese population, even with an inadequate vitamin D status, does not benefit more from supplementation beacause of doses trapped in their fat mass [12,13]. However, our data suggest a different mechanism because although the entry level baseline vitamin D status of the obese subgroup was slightly lower than the non-obese subjects’ baseline status (40.14 vs. 45.05 nmol/L), the relationship was reversed in the post-test analysis (obese 89.96 versus non-obese 75.96 nmol/L), in contrast to the previously published hypothesis.
Finally, optimal baseline glycemic control, HbA1c ≤ 7% to be specific, was associated with preferred effects of vitamin D supplementation on serum 25(OH)D levels, FBG and HbA1c. The HOMA-IR and fasting insulin data did not support this finding, but the fact that they were based on a small number of studies reduced their credibility. Nevertheless, Krul-Poel et al. and Soric et al. reported that significant improvements in glucose metabolism were only manifested in patients with poor glycemic control at baseline [10,45]. While they used different cutoffs (HbA1c ≥ 8% and 9% respectively), applying alternative cutoffs did not change the results in this meta-analysis. Further investigations are required to clarify this association and explore the underlying explanation for it.
To our knowledge, this meta-analysis is unique because it evaluates the effects of vitamin D supplementation on beta cell function as measured by fasting insulin. In addition, our analysis takes into account the most recent years of publications on vitamin D and type 2 diabetes, thereby expanding our appreciation of fasting blood glucose, hemoglobin A1c and HOMAR-IR by encompassing the evidence base related to type 2 diabetes. We also used the GRADE system to assess the quality of the evidence. In addition, we conducted a comprehensive exploration of the influential factors on the supplementation effects and identified some important ones, like ethnicity, BMI, baseline vitamin D status and HbA1c. This might encourage further studies to confirm the influence and mechanisms of these factors and allow the provision of supplementation with appropriate timing and in appropriate subpopulations. Moreover, the other strength of our study is that we only included randomized controlled trials with oral vitamin D supplementation, mainly cholecalciferol; thus, the relative uniformity of the study design and formulation of vitamin D reduced the overall heterogeneity. However, heterogeneity was still significant owing to the various lengths, doses, and participants involved in the studies. Other limitations include the fact that most studies did not assess effects of sun exposure, dietary intake and physical exercise, which may also have influenced vitamin D status. In addition, the use of antidiabetic medication or insulin therapy might also mask the benefits of vitamin D, especially in studies that allowed medication adjustment during the intervention period. Last, some trials included had relatively small sample sizes and short intervention durations.
5. Conclusions
Oral vitamin D supplementation has shown better effects in enhancing serum 25(OH)D levels and reducing insulin resistance compared with placebos among type 2 diabetes patients. However, it did not appear to influence FBG, HbA1c and fasting insulin levels. Large dosage, short-term vitamin D supplementation was most likely to yield preferred changes in vitamin D deficient, non-obese groups, Asians, especially Middle Easterners, and patients with optimal glycemic control at baseline. Additional large well-designed studies with longer duration are required to further clarify the impacts of BMI and baseline HbA1c.
Acknowledgments
This work was supported by the National Natural Science Foundation of China under grant No. 81573429 and by the Major Programs of Ministry of Science and Technology of China during the 13th Five-Year Plan Period under grant No. 2017YFD0400602.
Author Contributions
X.L. and Y.L. conducted the literature selection, interpreted the data and wrote the papaer; Yi.Z. contributed to the data analysis; P.W. and Yu.Z. conceived the study.
Conflicts of Interest
The authors declare no conflict of interest. The founding sponsors had no role in the design of the study; in the collection, analyses, or interpretation of data; in the writing of the manuscript, and in the decision to publish the results.
References
- GBD 2016 Disease and Injury Incidence and Prevalence Collaborators. Global, regional, and national incidence, prevalence, and years lived with disability for 328 diseases and injuries for 195 countries, 1990–2016: A systematic analysis for the Global Burden of Disease Study 2016. Lancet 2017, 390, 1211–1259. [Google Scholar]
- Joergensen, C.; Gall, M.A.; Schmedes, A.; Tarnow, L.; Parving, H.H.; Rossing, P. Vitamin D levels and mortality in type 2 diabetes. Diabetes Care 2010, 33, 2238–2243. [Google Scholar] [CrossRef] [PubMed] [Green Version]
- Mitri, J.; Muraru, M.D.; Pittas, A.G. Vitamin D and type 2 diabetes: A systematic review. Eur. J. Clin. Nutr. 2011, 65, 1005–1015. [Google Scholar] [CrossRef] [PubMed]
- Pittas, A.G.; Lau, J.; Hu, F.B.; Dawsonhughes, B. The role of vitamin D and calcium in type 2 diabetes. A systematic review and meta-analysis. J. Clin. Endocrinol. Metab. 2007, 92, 2017–2029. [Google Scholar] [CrossRef] [PubMed]
- Song, Y.; Wang, L.; Pittas, A.G.; Del Gobbo, L.C.; Zhang, C.; Manson, J.E.; Hu, F.B. Blood 25-Hydroxy Vitamin D Levels and Incident Type 2 Diabetes. Diabetes Care 2013, 36, 1422–1428. [Google Scholar] [CrossRef] [PubMed]
- Grimnes, G.; Emaus, N.; Joakimsen, R.M.; Jorde, R. Baseline serum 25-hydroxyvitamin D concentrations in the Troms Study 1994-95 and risk of developing type 2 diabetes mellitus during 11 years of follow-up: Vitamin D and diabetes—A prospective study. Diabet. Med. 2010, 27, 1107–1115. [Google Scholar] [CrossRef] [PubMed]
- Gysemans, C.A.; Cardozo, A.K.; Callewaert, H.; Giulietti, A.; Hulshagen, L.; Bouillon, R.; Eizirik, D.L.; Mathieu, C. 1,25-Dihydroxyvitamin D3 modulates expression of chemokines and cytokines in pancreatic islets: implications for prevention of diabetes in nonobese diabetic mice. Endocrinology 2005, 146, 1956–1964. [Google Scholar] [CrossRef] [PubMed]
- Park, S.; Kim, D.S.; Kang, S. Vitamin D deficiency impairs glucose-stimulated insulin secretion and increases insulin resistance by reducing PPAR-gamma expression in nonobese Type 2 diabetic rats. J. Nutr. Biochem. 2016, 27, 257–265. [Google Scholar] [CrossRef] [PubMed]
- Zhou, Q.G.; Hou, F.F.; Guo, Z.J.; Liang, M.; Wang, G.B.; Zhang, X. 1,25-Dihydroxyvitamin D improved the free fatty-acid-induced insulin resistance in cultured C2C12 cells. Diabetes Metab. Res. Rev. 2008, 24, 459–464. [Google Scholar] [CrossRef] [PubMed]
- Krul-Poel, Y.H.; Ter, W.M.; Lips, P.; Simsek, S. MANAGEMENT OF ENDOCRINE DISEASE: The effect of vitamin D supplementation on glycaemic control in patients with Type 2 Diabetes Mellitus: A systematic review and meta-analysis. Eur. J. Endocrinol. 2016, 176, R1–R14. [Google Scholar] [CrossRef] [PubMed]
- Lee, C.J.; Iyer, G.; Liu, Y.; Kalyani, R.R.; Bamba, N.; Liqon, C.B.; Varma, S.; Mathioudakis, N. The effect of vitamin D supplementation on glucose metabolism in type 2 diabetes mellitus: A systematic review and meta-analysis of intervention studies. J. Diabetes Complicat. 2017, 31, 1115–1126. [Google Scholar] [CrossRef] [PubMed]
- Wu, C.; Qiu, S.; Zhu, X.; Li, L. Vitamin D supplementation and glycemic control in type 2 diabetes patients: A systematic review and meta-analysis. Metabolism 2017, 73, 67–76. [Google Scholar] [CrossRef] [PubMed]
- Mirhosseini, N.; Vatanparast, H.; Mazidi, M.; Kimball, S.M. The Effect of Improved Serum 25-Hydroxyvitamin D Status on Glycemic Control in Diabetic Patients: A Meta-Analysis. J. Clin. Endocrinol. Metab. 2017, 102, 3097–3110. [Google Scholar] [CrossRef] [PubMed]
- Moher, D.; Liberati, A.; Tetzlaff, J.; Altman, D.G. Preferred reporting items for systematic reviews and meta-analyses: The PRISMA statement. BMJ 2009, 339, b2535. [Google Scholar] [CrossRef] [PubMed]
- Higgins, J.P.; Altman, D.G.; Gotzsche, P.C.; Juni, P.; Moher, D.; Oxman, A.D.; Savovic, J.; Schulz, K.F.; Weeks, L.; Sterne, J.A.C. The Cochrane Collaboration’s tool for assessing risk of bias in randomised trials. BMJ 2011, 343, d5928. [Google Scholar] [CrossRef] [PubMed] [Green Version]
- Higgins, J.; Green, S. Cochrane Handbook for Systematic Reviews of Interventions; Version 5.1.0; The Cochrane Collaboration: London, UK, 2013. [Google Scholar]
- WHO (World Health Organization). The Asia-Pacific Perspective: Redefining Obesity and Its Treatment; WHO: Geneva, Switzerland, 2000. [Google Scholar]
- Holick, M.F.; Binkley, N.C.; Bischoffferrari, H.A.; Gordon, C.M.; Hanley, D.A.; Heaney, R.P.; Murad, M.H.; Weaver, C.M.; Endocrine Society. Evaluation, treatment, and prevention of vitamin D deficiency: An Endocrine Society clinical practice guideline. J. Clin. Endocrinol. Metab. 2011, 96, 1911–1930. [Google Scholar] [PubMed]
- Guyatt, G.H.; Oxman, A.D.; Vist, G.E.; Kunz, R.; Falck-Ytter, Y.; Alonso-Coello, P.; Schunemann, H.J.; GRADE Working Group. GRADE: An emerging consensus on rating quality of evidence and strength of recommendations. BMJ 2008, 336, 924–926. [Google Scholar] [PubMed]
- Anyanwu, A.C.; Fasanmade, O.A.; Odeniyi, I.A.; Iwuala, S.; Coker, H.B.; Ohwovoriole, A.E. Effect of Vitamin D supplementation on glycemic control in Type 2 diabetes subjects in Lagos, Nigeria. Indian J. Endocrinol. Metab. 2016, 20, 189–194. [Google Scholar] [CrossRef] [PubMed]
- Baziar, N.; Jafarian, K.; Shadman, Z.; Qorbani, M.; Khoshniat, N.M.; Abd, M.M. Effect of therapeutic dose of vitamin d on serum adiponectin and glycemia in vitamin D-insufficient or deficient type 2 diabetic patients. Iran. Red Crescent Med. J. 2014, 16, e21458. [Google Scholar] [CrossRef] [PubMed]
- Eftekhari, M.H.; Akbarzadeh, M.; Dabbaghmanesh, M.H.; Hasanzadeh, J. Impact of treatment with oral calcitriol on glucose indices in type 2 diabetes mellitus patients. Asia Pac. J. Clin. Nutr. 2011, 20, 521–526. [Google Scholar] [PubMed]
- Ghavamzadeh, S.; Mobasseri, M.; Mahdavi, R. The effect of vitamin D supplementation on adiposity, blood glycated hemoglobin, serum leptin and TNF-α in type 2 diabetic patients. Int. J. Prev. Med. 2014, 5, 1091–1098. [Google Scholar] [PubMed]
- Jorde, R.; Figenschau, Y. Supplementation with cholecalciferol does not improve glycaemic control in diabetic subjects with normal serum 25-hydroxyvitamin D levels. Eur. J. Nutr. 2009, 48, 349–354. [Google Scholar] [CrossRef] [PubMed]
- Kampmann, U.; Mosekilde, L.; Juhl, C.; Moller, N.; Christensen, B.; Rejnmark, L.; Wamberq, L.; Orskov, L. Effects of 12 weeks high dose vitamin D3 treatment on insulin sensitivity, beta cell function, and metabolic markers in patients with type 2 diabetes and vitamin D insufficiency—A double-blind, randomized, placebo-controlled trial. Metabolism 2014, 63, 1115–1124. [Google Scholar] [CrossRef] [PubMed]
- Kim, H.J.; Kang, C.K.; Park, H.; Lee, M.G. Effects of vitamin D supplementation and circuit training on indices of obesity and insulin resistance in T2D and vitamin D deficient elderly women. J. Exerc. Nutr. Biochem. 2014, 18, 249–257. [Google Scholar] [CrossRef] [PubMed]
- Krul-Poel, Y.H.; Westra, S.; Ten, B.E.; Ter Wee, M.M.; Van Schoor, N.M.; Van Wijland, H.; Stam, F.; Lips, P.T.; Simsek, S. Effect of Vitamin D Supplementation on Glycemic Control in Patients with Type 2 Diabetes (SUNNY Trial): A Randomized Placebo-Controlled Trial. Diabetes Care 2015, 38, 1420–1426. [Google Scholar] [CrossRef] [PubMed]
- Maggi, S.; Siviero, P.; Brocco, E.; Albertin, M.; Romanato, G.; Crepaldi, G. Vitamin D deficiency, serum leptin and osteoprotegerin levels in older diabetic patients: an input to new research avenues. Acta Diabetol. 2014, 51, 461–469. [Google Scholar] [CrossRef] [PubMed]
- Nasri, H.; Behradmanesh, S.; Maghsoudi, A.R.; Ahmadi, A.; Nasri, P.; Rafieian-Kopaei, M. Efficacy of supplementary vitamin D on improvement of glycemic parameters in patients with type 2 diabetes mellitus; a randomized double blind clinical trial. J. Renal Inj. Prev. 2014, 3, 31–34. [Google Scholar] [PubMed]
- Punthakee, Z.; Bosch, J.; Dagenais, G.; Diaz, R.; Holman, R.; Probstfield, J.; Ramachandran, A.; Riddle, M.; Ryden, L.E.; Zinman, B.; et al. Design, history and results of the Thiazolidinedione Intervention with vitamin D Evaluation (TIDE) randomised controlled trial. Diabetologia 2012, 55, 36–45. [Google Scholar] [PubMed]
- Rashidi, H.; Ghaderian, S.B.; Shirinpour, Z.; Yazdanpanah, L.; Kaykhaei, M.A.; Aleali, A.M.; Latifi, S.M.; Bazdar, M. The effect of vitamin D supplementation on insulin resistance and glycemic control in patients with type 2 diabetes. Int. J. Pharm. Technol. 2016, 8, 11665–11674. [Google Scholar]
- Ryu, O.H.; Chung, W.; Lee, S.; Hong, K.S.; Choi, M.G.; Yoo, H.J. The effect of high-dose vitamin D supplementation on insulin resistance and arterial stiffness in patients with type 2 diabetes. Korean. J. Intern. Med. 2014, 29, 620–629. [Google Scholar] [CrossRef] [PubMed]
- Ryu, O.H.; Lee, S.; Yu, J.; Choi, M.G.; Yoo, H.J.; Mantero, F. A prospective randomized controlled trial of the effects of vitamin D supplementation on long-term glycemic control in type 2 diabetes mellitus of Korea. Endocr. J. 2014, 61, 167–176. [Google Scholar] [CrossRef] [PubMed]
- Sadiya, A.; Ahmed, S.M.; Carlsson, M.; Ali, S.H.; Siddieq, H.H.; Abusnana, S. Vitamin D supplementation in obese type 2 diabetes subjects in Ajman, UAE: A randomized controlled double-blinded clinical trial. Eur. J. Clin. Nutr. 2015, 69, 707–711. [Google Scholar] [CrossRef] [PubMed]
- Sugden, J.A.; Davies, J.I.; Witham, M.D.; Morris, A.D.; Struthers, A.D. Vitamin D improves endothelial function in patients with Type 2 diabetes mellitus and low vitamin D levels. Diabet. Med. 2008, 25, 320. [Google Scholar] [CrossRef] [PubMed]
- Tabesh, M.; Azadbakht, L.; Faghihimani, E.; Tabesh, M.; Esmaillzadeh, A. Effects of calcium-vitamin D co-supplementation on metabolic profiles in vitamin D insufficient people with type 2 diabetes: A randomised controlled clinical trial. Diabetologia 2014, 57, 2038–2047. [Google Scholar] [CrossRef] [PubMed]
- Witham, M.D.; Dove, F.J.; Dryburgh, M.; Sugden, J.A.; Morris, A.D.; Struthers, A.D. The effect of different doses of vitamin D(3) on markers of vascular health in patients with type 2 diabetes: A randomised controlled trial. Diabetologia 2010, 53, 2112. [Google Scholar] [CrossRef] [PubMed]
- Yousefi, R.E.; Djalali, M.; Koohdani, F.; Saboor-Yaraqhi, A.A.; Eshraqhian, M.R.; Javanbakht, M.H.; Saboori, S.; Zarei, M.; Hosseinzadeh-After, M.J. The Effects of Vitamin D Supplementation on Glucose Control and Insulin Resistance in Patients with Diabetes Type 2: A Randomized Clinical Trial Study. Iran. J. Public Health 2014, 43, 1651–1656. [Google Scholar]
- Zhou, W.; Ye, S.D. Relationship between Serum 25-Hydroxyvitamin D and Lower Extremity Arterial Disease in Type 2 Diabetes Mellitus Patients and the Analysis of the Intervention of Vitamin D. J. Diabetes Res. 2015, 2015, 1–6. [Google Scholar] [CrossRef] [PubMed]
- Nigil, H.N.; Anton, A.; John, J.; Mittal, M. Effect of vitamin D supplementation on glycemic control in patients with type 2 diabetes: A systematic review of interventional studies. J. Diabetes Metab. Disord. 2015, 14, 3. [Google Scholar] [CrossRef] [PubMed]
- Wang, G.; Li, Y.; Li, L.; Yu, F.; Cui, L.; Ba, Y.; Li, W.; Wang, C. Association of the vitamin D binding protein polymorphisms with the risk of type 2 diabetes mellitus: A meta-analysis. BMJ Open 2014, 4, e5617. [Google Scholar] [CrossRef] [PubMed]
- Lips, P. Worldwide status of vitamin D nutrition. J. Steroid Biochem. Mol. Biol. 2010, 121, 297–300. [Google Scholar] [CrossRef] [PubMed]
- Rajan, S.; Weishaar, T.; Keller, B. Weight and skin colour as predictors of vitamin D status: Results of an epidemiological investigation using nationally representative data. Public Health Nutr. 2016, 20, 1857–1864. [Google Scholar] [CrossRef] [PubMed]
- Li, F.; Hu, B.; Liu, J.F.; Zha, L.X.; Zhu, X.L. Effects of Vitamin D Supplementation on Glycaemic Control, Insulin Resistance and β Cell Function in Type 2 Diabetes Mellitus: A Meta-analysis. Chin. J. Evid.-Based Med. 2016, 16, 1080–1089. (In Chinese) [Google Scholar]
- Soric, M.M.; Renner, E.T.; Smith, S.R. Effect of daily vitamin D supplementation on HbA1c in patients with uncontrolled type 2 diabetes mellitus: a pilot study. J. Diabetes 2012, 4, 104–105. [Google Scholar] [CrossRef] [PubMed]
Figure 1.
Flow diagram of search and selection of studies.
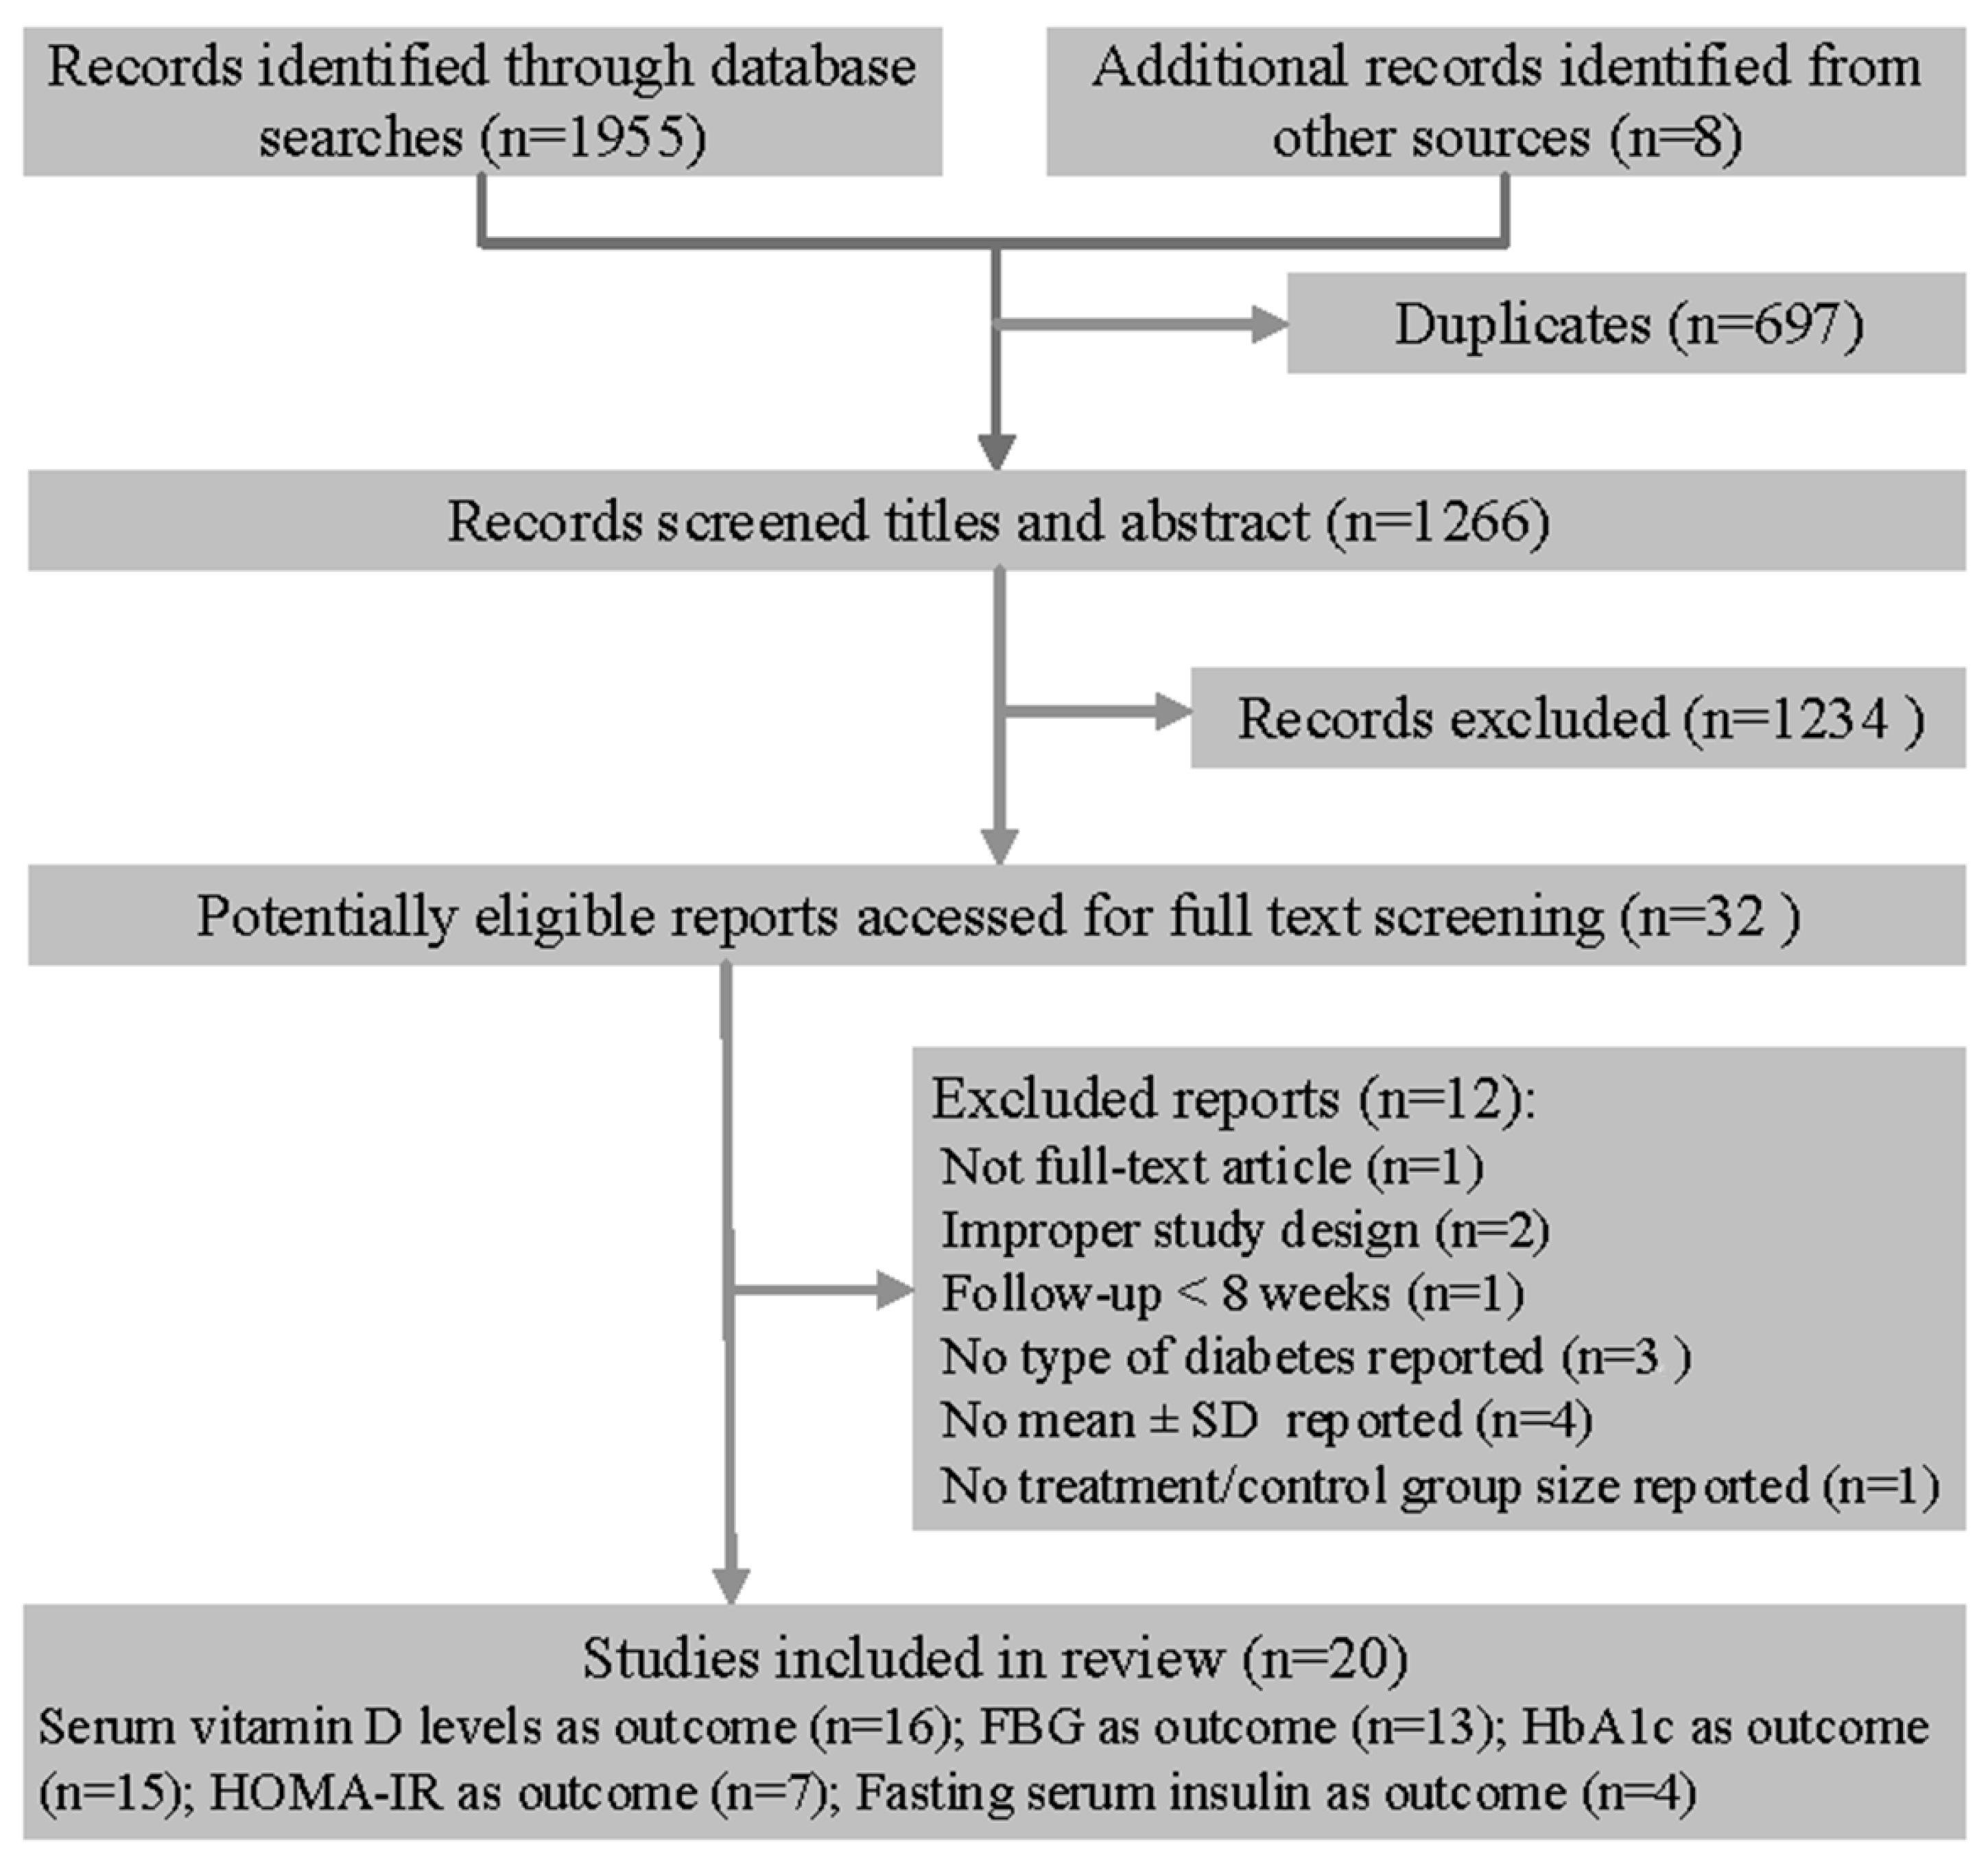
Figure 2.
Risk of bias assessment of the included studies using the Cochrane Collaboration tool across seven domains. Risk of bias levels: low (green), unclear (yellow), high (red).
Figure 2.
Risk of bias assessment of the included studies using the Cochrane Collaboration tool across seven domains. Risk of bias levels: low (green), unclear (yellow), high (red).

Figure 3.
Effect of vitamin D supplementation on (A) serum vitamin D level; (B) fasting blood glucose; (C) hemoglobin A1c; (D) homeostasis model assessment of insulin resistance and (E) fasting insulin. (The size of box represents the weight of each study, and the lateral tips of diamond shows the confidence interval of the pooled result.)

Figure 4.
Funnel plot of serum vitamin D changes in patients with type 2 diabetes receiving vitamin D supplementation based treatment versus controls in 16 randomized controlled trials (Each circle represents a study, with the y-axis representing the standard error of the study and the x-axis meaning the weighted mean difference of it. The funnel-shaped distribution is created by studies with high precision plotted near the average, and studies with low precision spread evenly on both sides of the average. Deviation from this shape indicates publication bias).


Table 1.
Characteristics of studies included in the meta-analysis.
| Author Year | Country | Participants (T/C 1) | Female (%) | Attrition Rate (%) | Age(y) (Mean ± SD) | BMI (kg/m2) 1 (Mean ± SD) | Baseline Vitamin D Level (nmol/L) (Mean ± SD) | Study Duration | Supplementation | Vitamin D Type | Dose & Frequency | Outcomes 2 |
|---|---|---|---|---|---|---|---|---|---|---|---|---|
| Baziar 2014 [21] | Iran | 41/40 | 33.3 | 6.9 | T: 50.34 ± 6.71 C: 52.75 ± 6.34 | T: 27.33 ± 1.64 C: 27.25 ± 1.35 | T: 37.26 ± 15.21 C: 40.30 ± 14.43 | 8 weeks | Vit D | VD3 | 50,000 IU/week | ①②③④ |
| Maggi 2014 [28] | Italy | 14/16 | 23.3 | 0.0 | 69 | 29 | T: 27.79 ± 10.81 C: 33.73 ± 17.13 | 24 weeks | Vit D | VD3 | 300,000 IU once | ①② |
| Anyanwu 2016 [20] | Nigeria | 17/16 | 57.6 | 21.4 | T: 52.5 ± 2.2 C: 51.1 ± 1.9 | NR 1 | T: 17.9 ± 2.3 C: 19.2 ± 5.5 | 12 weeks | Vit D | VD3 | 3000 IU/day | ①② |
| Eftekhari 2011 [22] | Iran | 35/35 | 50.0 | 0.0 | T: 53.8 ± 8.9 C: 52.4 ± 7.8 | T: 28.3 ±4.4 C: 27.0 ± 3.4 | T: 112.6 ± 83.5 C: 100.1 ± 77.7 | 12 weeks | Vit D | VD3 | 20 IU/day | ①②③④ |
| Ghavamzadeh 2014 [23] | Iran | 26/25 | 58.8 | 57.5 | T: 52.26 ± 2.09 C: 49.28 ± 2.00 | T: 28.9 ± 0.86 C: 27.9 ± 0.93 | T: 21.46 ± 4.65 C: 22.16 ± 5.32 | 14 weeks | Vit D | VD3 | 400 IU/day | ①③ |
| Jorde 2009 [24] | Norway | 16/16 | 43.8 | 11.1 | T: 57.7 ± 9.7 C: 54.8 ± 5.9 | T: 32.8 ± 6.8 C: 31.3 ± 6.3 | T: 60.0 ± 14.0 C: 58.5 ± 21.0 | 6 months | Vit D | VD3 | 40,000 IU/week | ①②③④ |
| Kampmann 2014 [25] | Denmark | 7/8 | 53.3 | 6.3 | T: 61.6 ± 4.4 C: 57 ± 4.5 | T: 35.3 ± 2.9 C: 32.4 ± 2.0 | T: 31.0 ± 4.9 C: 34.8 ± 3.8 | 12 weeks | Vit D | VD3 | 11,200 IU/day × 2 weeks, then 5600 IU/day × 10 weeks | ①②③⑤ |
| Krul-Poel 2015 [27] | The Netherlands | 129/132 | 34.9 | 5.1 | T: 67 ± 8 C: 67 ± 9 | T: 28.7 ± 4.6 C: 28.5 ± 4.5 | T: 60.6 ± 23.3 C: 59.1 ± 23.2 | 6 months | Vit D | VD3 | 50,000 IU/month | ①②③ |
| Nasri 2014 [29] | Iran | 30/30 | 71.7 | 0.0 | 55 ± 10.7 | NR | T: 83.9 ± 52 C: 105.7 ± 64 | 12 weeks | Vit D | VD3 | 50,000 IU/week | ①③ |
| Ryu 2014 a [32] | Korea | 32/30 | NR | 23.5 | T: 54.5 ± 7.4 C: 56.7 ± 7.9 | T: 24.4 ± 5.0 C: 25.3 ± 3.4 | T: 32.0 ± 7.8 C: 27.8 ± 6.8 | 6 months | Vit D + Ca | VD3 | 2000 IU/day | ①②③ |
| Sadiya 2015 [34] | UAE1 | 43/39 | 81.6 | 5.7 | T: 49 ± 8 C: 48 ± 8 | T: 37.9 ± 6.1 C: 37.6± 7.7 | T: 28.5 ± 9.2 C: 30.5 ± 11.3 | 6 months | Vit D | VD3 | 6000 IU/day × 3 months, then 3000 IU/day × 3 months | ①②③ |
| Yousefi 2014 [38] | Iran | 28/30 | 37.9 | 10.8 | T: 50.03 C: 49.90 | T: 27.94 ± 0.92 C: 28.75 ± 0.95 | T: 40.43 ± 4.97 C: 38.06 ± 5.77 | 2 months | Vit D | NR | 4000 IU/day | ①②③④⑤ |
| Tabesh 2014 [36] | Iran | 29/30 | 50.0 | 1.7 | T: 50.2 ± 6.6 C: 51.0 ± 6.1 | T: 30.5 ± 5.3 C: 30.3 ± 3.8 | T: 28.0 ± 13.9 C: 45.7 ± 16.4 | 2 months | Vit D | VD3 | 50,000 U/week | ④ |
| Witham 2010 [37] | UK 1 | 19/21 | 32.8 | 2.4 | T: 65.3 ± 11.1 C: 66.7 ± 9.7 | T: 31.1 ± 6.7 C: 33.3 ± 7.1 | T: 41 ± 14 C: 45 ± 17 | 4 months | Vit D | VD3 | 100,000 IU once | ①③④ |
| Ryu 2014 b [33] | Korea | 64/65 | 50.0 | 18.4 | T:54.8 ± 7.6 C:55.9 ± 8.1 | T: 25.0 ± 3.3 C: 25.6 ± 3.6 | T: 28.08 ± 13.26 C: 26.26 ± 10.14 | 6 months | Vit D +Ca | VD3 | 2000 IU/day | ①②③ |
| Punthakee 2012 [30] | 33 countries | 607/614 | 40.9 | 0.9 | T: 66.7 ± 6.7 C: 66.6 ± 6.3 | T: 30.6 ± 5.3 C: 30.7 ± 5.3 | NR | 4 months | Vit D | VD3 | 1000 IU/day | ②③ |
| Sugden 2008 [35] | UK 1 | 17/17 | 47.1 | 21.0 | T: 64.9 ± 10.3 C: 63.5 ± 9.5 | T: 31.7 ±6.4 C: 31.7 ± 6.5 | T: 40.2 ± 10.3 C: 36.4 ± 8.5 | 2 months | Vit D | VD2 | 100,000 IU once | ①③ |
| Rashidi 2016 [31] | Iran | 48/46 | 41.7 | 13.0 | 47 | T: 28.08 ± 3.46 C: 28.65 ± 2.9 | NR | 3 months | Vit D | NR | 50,000 IU/2 weeks | ③ |
| Kim 2014 [26] | Korea | 11/13 | 100.0 | 13.3 | T: 73.27 ± 2.06 C: 70.08 ± 1.37 | T: 24.08 ± 0.73 C: 23.72 ± 0.68 | T: 27.14 ± 4.68 C: 30.32 ± 7.28 | 3 months | Vit D | VD3 | 1200 IU/day | ③④⑤ |
| Zhou 2015 [39] | China | 31/31 | 38.7 | 9.7 | 58.85 ± 6.18 | T: 25.05 ± 3.30 C: 24.09 ± 3.77 | T: 32.21 ± 21.76 C: 34.58 ± 20.18 | 3 months | Vit D | VD3 | 1000 IU/day | ①③ |
1 Abbreviations: T: treatment group; C: control group; NR: not reported; UAE: The United Arab Emirates; UK: United Kingdom; BMI: body mass index.2 ① serum vitamin D levels; ② fasting blood glucose; ③ HbA1c; ④ HOMA-IR; ⑤ fasting serum insulin.
Table 2.
Subgroup analyses.
| Subgroups | Serum Vitamin D | FBG 1 | HbA1c 1 | HOMA-IR 1 | Fasting Insulin | |||||||||||
|---|---|---|---|---|---|---|---|---|---|---|---|---|---|---|---|---|
| WMD 1 | 95%CI | p | WMD | 95%CI | p | WMD | 95%CI | p | SMD | 95%CI | p | SMD | 95%CI | p | ||
| Ethnicity | ||||||||||||||||
| Middle Easterners | 40.03 | (27.71, 52.34) | <0.001 | −10.43 | (−14.80, −6.06) | <0.001 | −0.36 | (−0.87, 0.15) | 0.170 | −0.65 | (−1.37, 0.08) | 0.081 | −1.48 | (−3.59, 0.63) | 0.170 | |
| Other Asians | 32.23 | (22.72, 41.73) | <0.001 | −1.83 | (−7.80, 4.15) | 0.549 | −0.18 | (−0.77, 0.42) | 0.565 | −1.59 | (−2.42, −0.76) | <0.001 | −1.80 | (−2.66, −0.95) | <0.001 | |
| Other ethnicities | 30.72 | (12.25, 49.19) | 0.001 | 1.67 | (−1.50, 4.85) | 0.301 | 0.17 | (0.00, 0.33) | 0.044 | 0.01 | (−0.45, 0.47) | 0.961 | 1.67 | (0.47, 2.87) | 0.006 | |
| BMI 1 | ||||||||||||||||
| Normal 2 | 38.20 | (27.89, 48.51) | <0.001 | −5.21 | (−11.76, 1.34) | 0.119 | 0.16 | (−0.13, 0.45) | 0.274 | −1.59 | (−2.42, −0.76) | <0.001 | −1.80 | (−2.66, −0.95) | <0.001 | |
| Overweight 2 | 33.01 | (23.94, 42.09) | <0.001 | −5.71 | (−14.09, 2.66) | 0.181 | −0.32 | (−0.70, 0.06) | 0.102 | −0.84 | (−1.78, 0.11) | 0.084 | −1.48 | (−3.59, 0.63) | 0.170 | |
| Obese 2 | 39.34 | (18.71, 59.97) | <0.001 | 0.64 | (−3.32, 4.60) | 0.751 | 0.22 | (0.05, 0.38) | 0.010 | −0.04 | (−0.38, 0.30) | 0.825 | 1.67 | (0.47, 2.87) | 0.006 | |
| Dose | ||||||||||||||||
| ≤2000 IU/day | 25.16 | (18.16, 32.16) | <0.001 | 0.35 | (−3.18, 3.89) | 0.844 | −0.21 | (−0.53, 0.11) | 0.189 | −0.50 | (−1.35, 0.35) | 0.249 | −1.80 | (−2.66, −0.95) | <0.001 | |
| >2000 IU/day | 48.45 | (29.94, 66.97) | <0.001 | −8.70 | (−12.96, −4.44) | <0.001 | 0.05 | (−0.41, 0.51) | 0.832 | −0.64 | (−1.42, 0.14) | 0.107 | −0.50 | (−2.44, 1.45) | 0.617 | |
| Duration | ||||||||||||||||
| ≤3 m | 35.51 | (18.84, 52.18) | <0.001 | −8.44 | (−12.72, −4.15) | <0.001 | −0.11 | (−0.42, 0.21) | 0.590 | −0.81 | (−1.49, −0.13) | 0.019 | ---- | ---- | ---- | |
| >3 m | 32.61 | (24.951, 40.271) | <0.001 | 2.04 | (-0.94, 5.02) | 0.180 | −0.12 | (−0.54, 0.31) | 0.509 | 0.01 | (−0.45, 0.47) | 0.961 | ---- | ---- | ---- | |
| Baseline 25(OH)D | ||||||||||||||||
| <50 nmol/L | 31.65 | (21.31, 41.99) | <0.001 | −5.77 | (−10.48, −1.05) | 0.017 | −0.11 | (−0.47, 0.26) | 0.563 | −0.81 | (−1.51, −0.11) | 0.024 | ---- | ---- | ---- | |
| 50–75 nmol/L | 48.33 | (29.46, 67.21) | <0.001 | 3.37 | (−1.81, 8.54) | 0.202 | −0.00 | (−0.14, 0.14) | 1.000 | 0.03 | (−0.67, 0.72) | 0.941 | ---- | ---- | ---- | |
| >75 nmol/L | 32.98 | (−39.64, 105.06) | 0.373 | −18.00 | (−43.24, 7.24) | 0.162 | −0.39 | (−0.78, 0.00) | 0.052 | −0.08 | (−0.55, 0.39) | 0.737 | ---- | ---- | ---- | |
| Baseline HbA1c 1 | ||||||||||||||||
| ≤7% | 45.27 | (25.39, 65.15) | <0.001 | −4.09 | (−15.44, 7.27) | 0.481 | −0.17 | (−0.86, 0.52) | 0.635 | −0.27 | (−0.65, 0.11) | 0.160 | 0.55 | (−1.49,2.59) | 0.53 | |
| >7% | 29.86 | (18.22, 41.49) | <0.001 | −3.53 | (−9.42, 2.35) | 0.240 | −0.08 | (−0.34, 0.18) | 0.548 | −0.65 | (−1.83, 0.54) | 0.286 | −2.57 | (−3.27, −1.87) | <0.001 | |
| Overall | 33.98 | (24.60, 43.37) | <0.001 | −3.59 | (−7.94, 0.76) | 0.105 | −0.11 | (−0.35, 0.13) | 0.381 | −0.58 | (−1.11, −0.05) | 0.033 | −0.83 | (−2.31, 0.64) | 0.268 | |
1 Abbreviations: WMD: weighted mean difference; SMD: standardized mean difference; FBG: fasting blood glucose; HbA1c: hemoglobin A1c; HOMA-IR: homeostatic model assessment of insulin resistance; BMI: Body mass index. 2 normal: 18.5–24.9kg/m2; overweight: 25.0–29.9 kg/m2; obese: ≥30.0 kg/m2. “----”: subgroup inapplicable to this outcome.
Table 3.
Evidence quality rated using the GRADE approach.
| Outcomes | No. of Studies | Limitations | Inconsistency | Indirectness | Imprecision | Publication Bias | Evidence Quality | |
|---|---|---|---|---|---|---|---|---|
| Serum vitamin D levels | 16 | Serious 2,3,4 | Serious 5 | Not serious | Not serious | Not found | ⊕⊕⊝⊝ | Low |
| FBG 1 | 13 | Serious 2,3,4 | Serious 5 | Not serious | Serious 6 | Not found | ⊕⊝⊝⊝ | Very low |
| HbA1c 1 | 15 | Serious 3,4 | Serious 5 | Not serious | Serious 6 | Not found | ⊕⊝⊝⊝ | Very low |
| HOMA-IR 1 | 7 | Serious 3,4 | Serious 5 | Not serious | Not serious | Not assessed 7 | ⊕⊕⊝⊝ | Low |
| Fasting serum insulin | 4 | Serious 4 | Serious 5 | Not serious | Serious 6 | Not assessed 7 | ⊕⊝⊝⊝ | Very low |
1 Abbreviations: FBG: fasting blood glucose; HbA1c: hemoglobin A1c; HOMA-IR: homeostasis model assessment of insulin resistance. 2 Had single-blind randomized controlled trial design; 3 had reporting bias; 4 had attrition bias. 5 A significant heterogeneity was observed in this meta-analysis. 6 Wide confidence interval, including values in favour of the experimental group and values in favour of the control group. 7 Not assessed because a limited number of studies were included in the meta-analyses on HOMA-IR and fasting serum insulin.
© 2018 by the authors. Licensee MDPI, Basel, Switzerland. This article is an open access article distributed under the terms and conditions of the Creative Commons Attribution (CC BY) license (http://creativecommons.org/licenses/by/4.0/).
Share and Cite
MDPI and ACS Style
Li, X.; Liu, Y.; Zheng, Y.; Wang, P.; Zhang, Y. The Effect of Vitamin D Supplementation on Glycemic Control in Type 2 Diabetes Patients: A Systematic Review and Meta-Analysis. Nutrients 2018, 10, 375. https://doi.org/10.3390/nu10030375
AMA Style
Li X, Liu Y, Zheng Y, Wang P, Zhang Y. The Effect of Vitamin D Supplementation on Glycemic Control in Type 2 Diabetes Patients: A Systematic Review and Meta-Analysis. Nutrients. 2018; 10(3):375. https://doi.org/10.3390/nu10030375
Chicago/Turabian StyleLi, Xinyi, Yan Liu, Yingdong Zheng, Peiyu Wang, and Yumei Zhang. 2018. "The Effect of Vitamin D Supplementation on Glycemic Control in Type 2 Diabetes Patients: A Systematic Review and Meta-Analysis" Nutrients 10, no. 3: 375. https://doi.org/10.3390/nu10030375
Note that from the first issue of 2016, this journal uses article numbers instead of page numbers. See further details here.