Standardized Parenteral Nutrition for the Transition Phase in Preterm Infants: A Bag That Fits


1
Department of Clinical Nutrition and Dietetics, Cork University Maternity Hospital, T12 YE02 Cork, Ireland
2
Irish Centre for Fetal and Neonatal Translational Research (INFANT), University College Cork, T12 DFK4 Cork, Ireland
3
Cork Centre for Vitamin D and Nutrition Research, School of Food and Nutritional Sciences, University College Cork, T12 Y337 Cork, Ireland
4
Pharmacy Department, Cork University Hospital, T12 YE02 Cork, Ireland
5
Department of Neonatology, Cork University Maternity Hospital, T12 YE02 Cork, Ireland
*
Author to whom correspondence should be addressed.
Nutrients 2018, 10(2), 170; https://doi.org/10.3390/nu10020170
Submission received: 12 December 2017
/
Revised: 12 January 2018
/
Accepted: 30 January 2018
/
Published: 2 February 2018
Abstract
:The optimal composition of standardized parenteral nutrition (SPN) is not yet known, contributing to nutrient deficit accrual and growth failure, with the period of parenteral nutrition weaning, i.e., transition (TN) phase, being identified as particularly vulnerable. We created a comprehensive nutrition database, representative of the nutritional course of a diverse range of preterm infants (n = 59, birth weight ≤ 1500 g, gestation < 34 weeks) by collecting hourly macronutrient intake data as part of a prospective, observational study over 19 months. Using a nutrient modeling technique for the TN phase, various amino acid (AA) concentrations of SPN were tested within the database, whilst acknowledging the nutritional contribution from enteral feeds until target AA intakes were consistently achieved. From the modeling, the AA composition of SPN was determined at 3.5 g/100 mL, which was the maximum to avoid exceeding target intakes at any point in the TN phase. However, in order to consistently achieve target AA intakes, additional nutritional strategies were required, which included increasing the exclusion of enteral feeds in fluid and nutrient calculations from <20 mL/kg/day to <40 mL/kg/day, and earlier fortification of breastmilk at 80 mL/kg/day. This data-driven nutrient modeling process supported the development of an improved SPN regimen for our preterm population in the TN phase.
1. Introduction
The nutrition course of the preterm infant has more recently been described as three discrete nutrition phases, i.e., the parenteral nutrition (PN) phase when the infant in entirely dependent on PN for nutrition, the enteral nutrition (EN) phase when the infant is fully established on milk feeds, and the transition (TN) phase [1,2,3] when PN is being weaned with advancing enteral feeds. The TN phase is an extremely complex nutritional period characterized by multiple nutrient sources (PN and EN), and has been reported to last from 7 [1] to 10 days [2]. Despite some studies showing that early, high amino acid (AA) intakes were associated with improvements in growth, glycaemic tolerance and electrolyte homeostasis [4], the TN phase has recently been exposed as a period of cumulative nutrient deficits, in particular AA [1], and compromised growth [3]. It has been reported that infants who experience growth failure in the TN phase are five times more likely to be discharged with a weight < 10th centile for corrected gestational age (GA) [2]. Currently, there is a lack of specific nutrition recommendations for the TN phase. International recommended nutrient intakes (RI) are based on the infant being either solely on PN [5,6,7] or EN [5,6,8] with no specific guidelines in relation to weaning PN, whilst minimizing the disruption to nutrient delivery during the incremental introduction of enteral feeds [1]. We recently proposed that the lack of specific TN phase nutrition recommendations weakens the nutritional management of the phase, and may be directly contributing to the accumulation of nutrient deficits [1].
Miller and colleagues have recently shown improved nutrient intakes, in particular AA, and growth in the TN phase [2]. This was achieved through the use of concentrated PN, and took into consideration the nutritional contribution from enteral feeds. However, target AA intakes were not consistently achieved throughout the phase. Therefore, the optimal composition of PN to achieve target AA intakes for the TN phase is not yet known. We reported from a prospective observational study, substantial nutrient deficits, in particular AA, throughout the entire TN phase, despite the implementation of commonly used nutritional strategies, i.e., ‘mL per mL’ PN weaning protocol, and fortification of breastmilk (BM) [1]. There is increasing evidence to support the use of concentrated standardised PN (SPN) regimens [9,10]. However, increasing the AA concentration of PN should take the increasing nutritional contribution from enteral feeds into consideration throughout the TN phase, as recent observations from early enhanced nutritional management, i.e., high AA intake, have reported unintended adverse effects [11,12,13,14,15].
Dietary modeling techniques are useful in translating RI into practical nutrition guidelines to achieve target intakes in older populations [16,17,18,19,20]. In these studies, dietary modeling was based on population nutrient intake databases; however, in the neonatal setting, such databases do not exist and dietary modeling techniques have not been exploited. In this study, we describe a novel process to determine the optimal AA composition of SPN for the TN phase using nutrient modeling of a preterm nutrition database based on actual nutrient intake data [21]. To overcome the lack of international guidelines for this phase, we used our recently described application of current international RI, based on the infants’ ability to tolerate enteral feeds, and the dominant nutrition source [1] to define target AA intakes, throughout the TN phase.
2. Materials and Methods
2.1. Study Design and Population
As part of a prospective, observational, longitudinal study on nutrition and growth in 59 preterm infants (birth weight (BW) ≤ 1500 g and GA < 34 weeks), we constructed a comprehensive nutrition database based on actual hourly nutrient intake data [21]. The study took place at Cork University Maternity Hospital neonatal unit (NU) over a 19-month period from March 2010 to October 2011; the study commenced after updating our nutrition guidelines (supplementary Table S1) on the basis of recent international recommendations [6,7,8]. Written parental informed consent for participation was obtained. Exclusion criteria included congenital or chromosomal abnormalities and use of postnatal steroids for neonatal chronic lung disease. The Cork University Hospitals Clinical Research Ethics Committee approved the study protocol (reference no. ECM 4 (e)) and the study was registered at ClinicalTrials.gov (NCT01881256).
Nutrient data was stratified by infant BW to allow precise comparisons with international nutrition recommendations [5,6], which are primarily BW based. We defined infants born < 1000 g as extremely low birth weight (ELBW, n = 12) and infants born between 1000 and 1500 g as very low birth weight (VLBW). We subdivided VLBW infants by GA to distinguish between early (VLBW < 30 weeks (n = 23)) versus late preterm (VLBW ≥ 30 weeks (n = 24)), as those born < 30 weeks GA are considered to be at increased nutritional risk, due to their more immature physiological development [22].
2.2. Nutrition Database Design and Construction
The nutrition database was constructed in MS Excel (Microsoft, Redmond, WA, USA). Total daily nutrient intakes were recorded retrospectively from PN prescriptions, drug prescriptions and daily fluid balance sheets, which were documented hourly enabling observed (not prescribed) parenteral and enteral intakes to be precisely determined for each infant on a 24-h basis. A ‘parenteral and enteral intake’ spreadsheet was created to record the intake, in terms of volume per kg, for each infant, for each nutritional source by the investigator (AMB). Day of life was defined from hour of birth, i.e., day 1 of life was the first 24-h period. Use of hourly intake source data captured all changes to the parenteral and enteral prescriptions administered to the infants each day.
A ‘nutrient composition’ spreadsheet was created with composition data for each parenteral, i.e., intravenous (IV) dextrose 10%, 12.5%, PN, and enteral solution, i.e., breastmilk (BM), fortified BM and preterm formula. This was constructed with the most accurate nutrient composition data at that time according to product specifications. BM nutrient provision was estimated based on published values for transitional BM at 1.5 g protein/100 mL [23,24]. In the absence of definitive evidence of the bioavailability data for enteral nutrients in preterm infants, 100% bioavailability was assumed in line with current recommendations [23]. Energy calculations for PN were glucose = 3.4 kcal/g [25], AA = 3.7 kcal/g (Vaminolact; Fresenius Kabi, Graz, Austria), and lipid = 10 kcal/g (Intralipid 20% and SMOF; Fresenius Kabi, Graz, Austria). Energy values for EN products were according to most up-to-date product specifications which were based on 4 kcal/g for carbohydrate, 4 kcal/g for protein and 9 kcal/g for fat [26], and based on published values for transitional BM at 67 kcal/100 mL [24]. For individualized PN prescriptions, individual nutrient intakes contained within each infusion were individually calculated. The ‘parenteral and enteral intake’ and ‘nutrient composition’ spreadsheets were linked to enable calculation of observed macronutrient and energy intakes for both, which were summed to provide total daily intakes, an approach previously described for the TN phase [1,2]. The database was designed such that any update to the individual spreadsheets would recalculate the intake data.
2.3. Nutrition Database Modeling for the TN Phase
2.3.1. TN Phase Classification
Prior to nutrient modeling, once the database, which followed the infant’s chronological age, was completed, daily nutrient intakes were analyzed according to enteral feed volumes (EFV), to allow classification according to the TN phase, previously described elsewhere [1]. The TN phase was defined as EFV greater or equal to 20 mL/kg/day but less than 120 mL/kg/day (PN was generally discontinued once EFV reached 120 mL/kg/day as enteral feeds provided adequate protein intakes, i.e., 3.5 g/kg/day at this EFV). We subcategorized the TN phase into a PN-dominant TN phase (defined by EFV < 80 mL/kg/day, i.e., approximately 50% of full enteral feeds), and an EN-dominant TN phase (defined by EFV ≥ 80 mL/kg/day). We grouped EFV per 10 mL aliquots, i.e., 20 mL/kg/day represents 20 to 29 mL/kg/day, and mapped daily AA/protein intakes to the corresponding EFV received on that day by each infant.
2.3.2. Fluid and Nutritional Constraints
In nutrient modeling, the outcome of each decision (e.g., PN composition, or other nutritional strategies) must be constrained by a minimum and maximum range of limits or targets, i.e., PN or EN RI [16]. These limits or targets are termed constraints (Table 1). Target AA intakes were set according to the recently described TN phase RI [1]. During the PN-dominant TN phase (EFV < 80 mL/kg/day), target AA intakes were based on PN RI [6] and during the EN-dominant TN phase (EFV ≥ 80 mL/kg/day), target AA intakes were based on EN RI [5]; this approach was used to account for the differences in bioavailability between parenteral and enteral nutrient sources [1]. For ease of comparison and improved accuracy between AA/protein intakes and target intakes, during the PN-dominant TN phase, enteral protein intakes were converted to the corresponding AA equivalent using the following equation: 1 g protein = 1.13 g AA [27] and during the EN-dominant TN phase, parenteral AA were converted to the corresponding protein equivalent using the following equation: 1 g AA = 0.89 g protein.
Actual daily total IV fluid, i.e., parenteral (aqueous and lipid PN, and any IV dextrose), and enteral feeds were set as non-modifiable fluid constraints, in order to reflect the clinical realities of fluid management, and challenges with enteral feed tolerance in this population. However, the ratio of the different components of the infant’s IV fluid intake could be modified within reasonable clinical parameters.
2.3.3. Nutrient Modeling Steps
Using the linked design of the ‘parenteral and enteral intake’ with the ‘nutrient composition’ spreadsheets, and using a manual nutrient modeling technique [16], the investigator AMB, an experienced neonatal dietitian, manipulated the spreadsheets in a clinically relevant sequential manner, as described in Figure 1. The volume available for aqueous SPN had to be determined first (Figure 1, Steps 1–3). After these steps, modeled AA intakes were reviewed to assess if target AA intakes were achieved but not exceeded at each EFV, defined by the calculated sum totals of daily parenteral and enteral intakes being within target ranges. Additional modeling steps were undertaken in combination with SPN, and included the testing of various nutritional strategies, i.e., exclusion of enteral feeds from fluid and nutrient calculations (Figure 1, Step 5a), and fortification of BM (Figure 1, Step 5b) until target AA intakes were consistently achieved throughout the TN phase. In addition to AA, the provision of lipid, carbohydrate and energy were also considered to ensure optimal macronutrient compostion of SPN for the TN phase.
2.4. Statistics
Statistical analysis was conducted using PASW Statistics Version 20.0 (SPSS, IBM, Armonk, NY, USA). Descriptive statistics (mean (+/−SD, SEM) and prevalence data where appropriate) were determined for all variables. Characteristics of subjects in the three groups were compared using either one-factor analysis of a variance (ANOVA) followed by Tukey’s test (parametric data) for continuous variables or a chi-square test for categorical variables. A P value of <0.05 was considered statistically significant.
3. Results
The parents of 74 eligible infants were invited to participate and 70 provided written informed consent, of whom 2 subsequently died, 4 were transferred to another NU, 2 were withdrawn by parents and 3 were excluded as they could not complete the protocol due to clinical complications. Thus, the final sample size was 59 infants; 24 were boys, 12 were ELBW infants and 57 were Caucasian. Clinical and nutritional baseline data are summarized in Table 2.
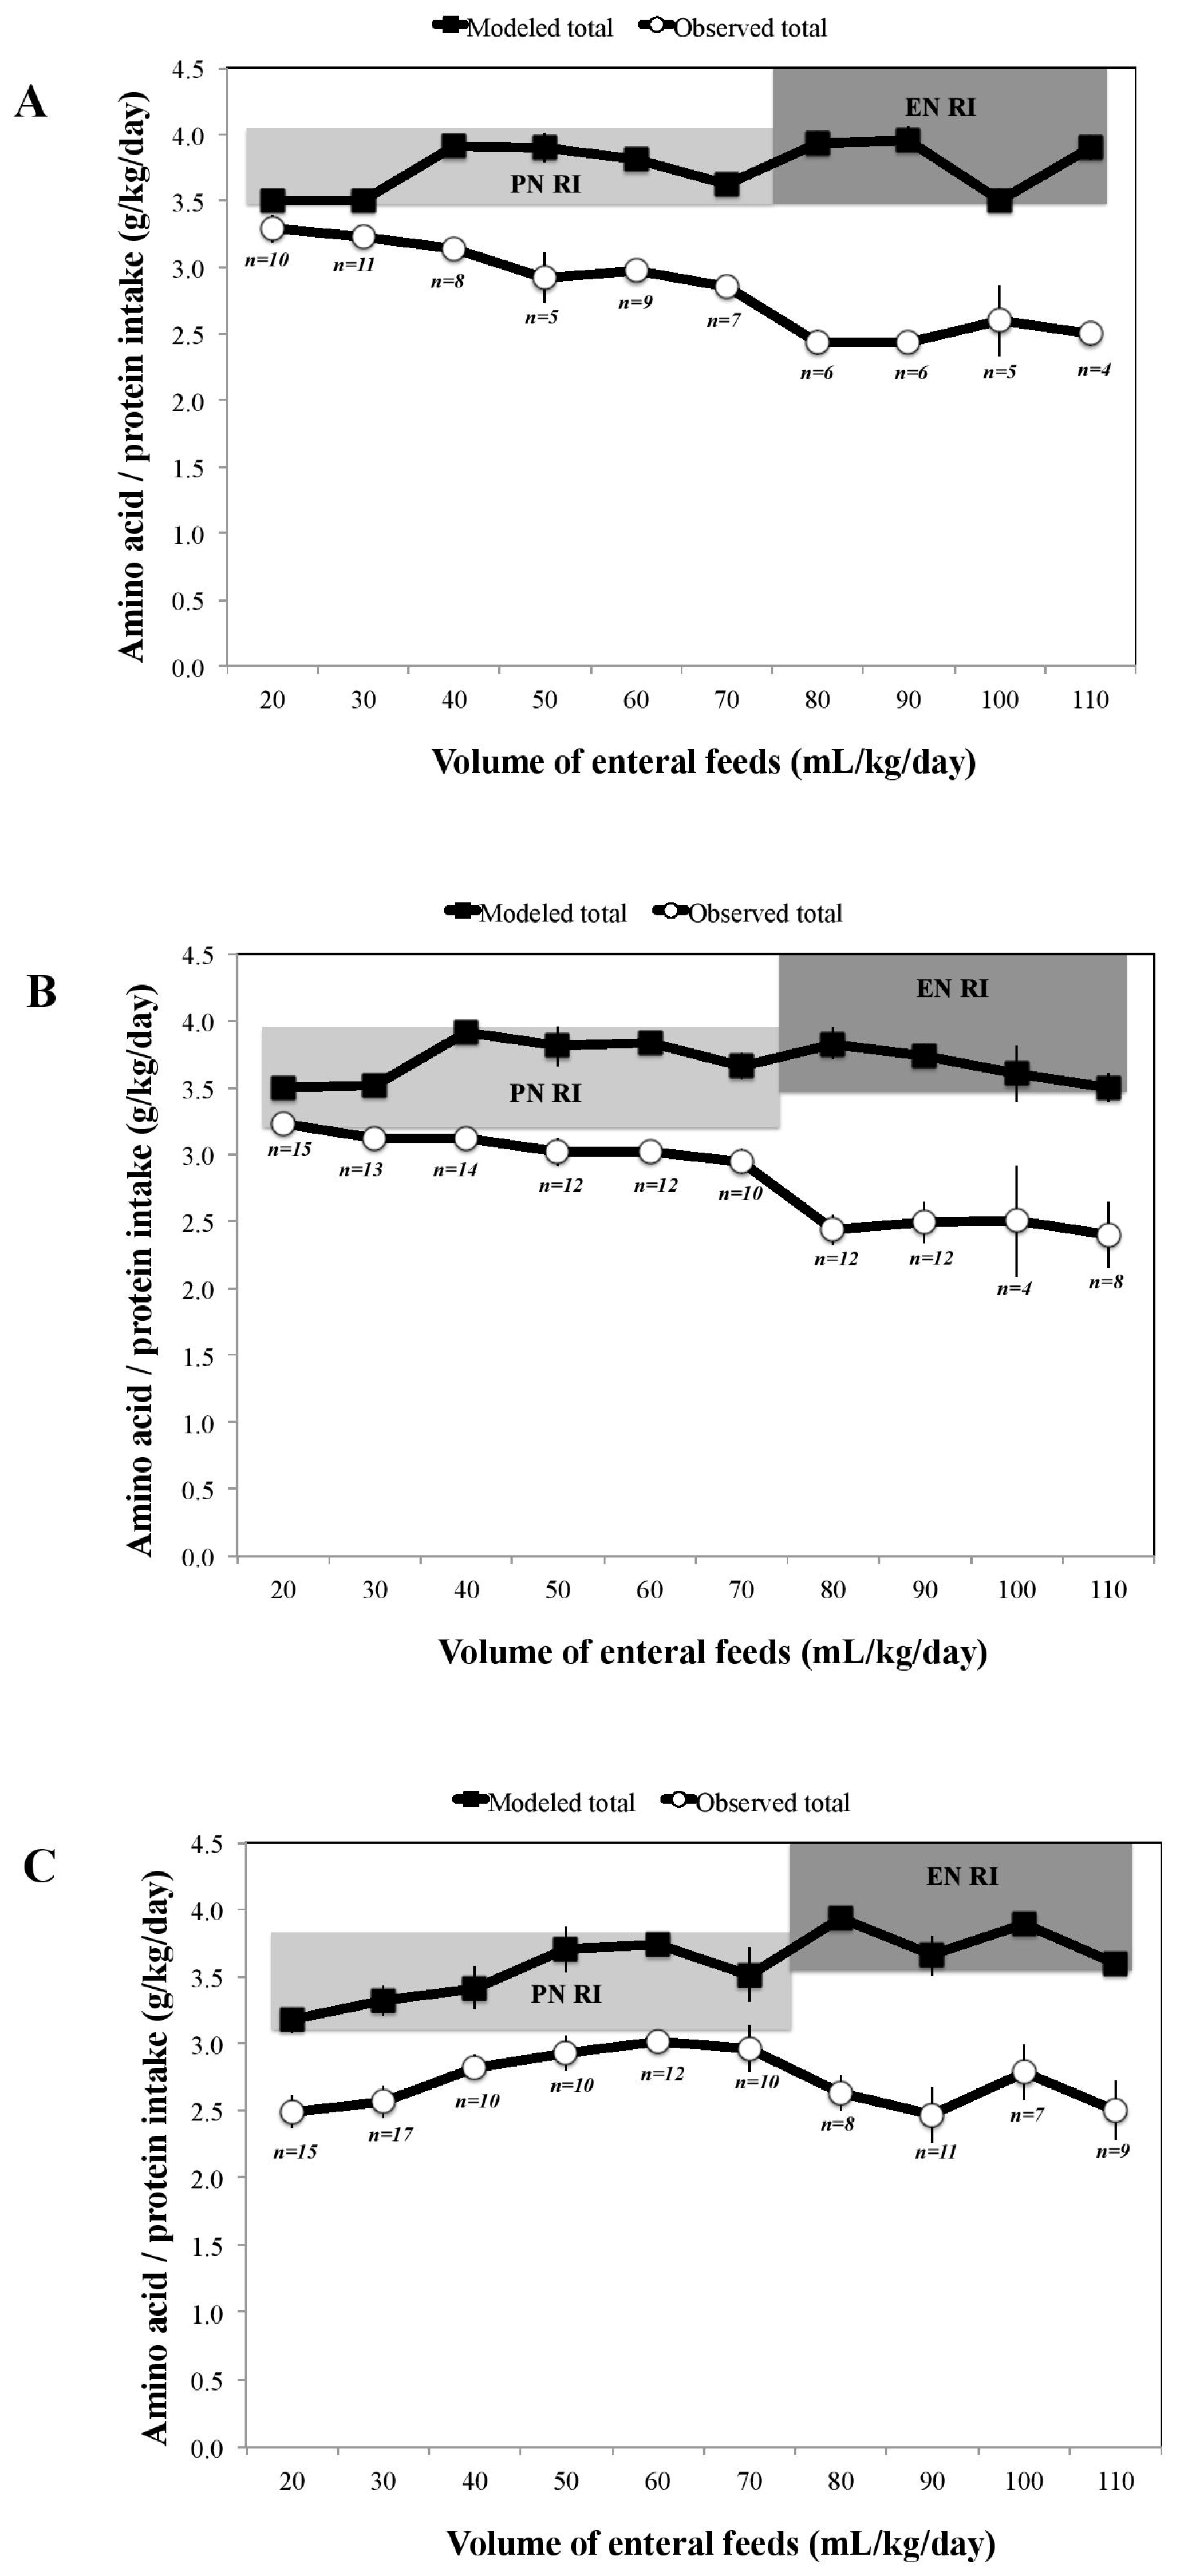
From the modeling, the optimal AA composition of SPN was determined at 3.5 g/100 mL (previously 2.5 g/100 mL), as shown in Figure 1, Step 4. This was the maximum concentration possible to avoid exceeding target AA intakes at any point in the TN phase. However, in order to achieve target AA intakes at all EFV, modifications to other nutritional strategies were required. During the PN-dominant TN phase, at EFV 20 and 30 mL/kg/day, it was necessary to increase the exclusion of enteral feeds in fluid and nutrient calculations from <20 mL/kg/day to <40 mL/kg/day (Figure 1, Step 5a). This modification resulted in redefining the beginning of the TN phase to 40 mL/kg/day instead of previously at 20 mL/kg/day. During the EN-dominant TN phase, earlier fortification of BM at 80 mL/kg/day instead of previously at 120 mL/kg/day was required (Figure 1, Step 5b). Figure 2 illustrates how the combined application of these three nutritional strategies (modeled total) resulted in the consistent achievement of target AA intakes across the three infant groups when compared with our observational intake data (observed total).
The achievements of target intakes for lipid, carbohydrate, and energy for the TN phase are shown in supplementary Figures S1–S3. In addition, the clinical application of these nutrient modeling outputs is summarized in the integrated TN phase protocol described in Table 3.
4. Discussion
In this study, we established, through nutrient modeling of a comprehensive preterm nutrition database, the optimal AA composition of SPN for the TN phase. Our analysis showed that the achievement of target AA intakes required not just an increased AA concentration of our SPN bag, but also modifications to other nutritional strategies, which included exclusion of some EFV from fluid and nutrient calculations and the earlier fortification of BM. In this study, the nutrition database was representative of the preterm infant’s actual nutritional course, overcoming the well documented discrepancy between prescribed versus actual intakes [28,29] related to the clinical realities facing preterm infants day to day, and represented a broad range of preterm infants, i.e., ELBW and VLBW infants. In the literature, nutrient modeling techniques have been shown to be useful in translating RI into practical nutrition guidelines to achieve target nutrient intakes in other populations [16,17,18,19,20]. To the best of our knowledge, this is the first time that nutrient modeling of a preterm nutrition database has been used to determine the composition of SPN to improve the nutritional management of preterm infants.
It has been proposed that in order to optimize the nutritional management of the TN phase, consideration of both PN and EN sources is required [1,2]. However, recent efforts to apply this approach in practice have not yet yielded the consistent achievement of target AA intakes [2]. In our current analysis, the nutrition database, when used as a test environment, facilitated a more detailed consideration of the relationship between the multiple nutrient sources that characterize the TN phase, than has previously been described. We tested a range of AA concentrations for PN; similar to those reported in the literature, i.e., 3.8 g/100 mL [30] and 4.2 g/100 mL [10], and observed that target intakes were exceeded at some EFV once the nutritional contribution from enteral feeds was considered, in our population. Similarly, when we tested the BM fortification as early as 50 mL/kg/day, as has been recently suggested in the literature [31], target AA intakes were exceeded. Our standard practice of including EFV in fluid and nutrient calculations from as early as 20 mL/kg/day contributed to suboptimal AA intakes amongst some VLBW infants but exclusion of higher volumes, i.e., ≥40 mL/kg/day would have led to excessive AA intakes. Our data analysis supports the recent recommendation of excluding enteral feeds < 40 mL/kg/day in fluid calculations [4], and identifying this as the optimal EFV to begin weaning PN, i.e., start of TN phase. Nutrient modeling ensured nutritional strategies, i.e., PN concentration and BM fortification worked together in a complementary manner to support the achievement of target AA intakes, without exposing infants to excessive intakes, and may support the development and refinement of integrated TN phase protocols. The modeling outputs and resultant TN phase protocol reflect our fluid and nutritional constraints but the principles of this process can be universally applied. Additionally, it should be noted that fluid and nutritional constraints are not fixed due to the advancing evidence-base and changes to nutritional products.
There is evidence that a TN phase protocol incorporating concentrated PN is a simple, practical, and effective method to help address nutrient deficits inherent in the TN phase of preterm infants, and results in improved growth [2]. Despite the knowledge of early nutrient deficit accrual [1,32], due to the recent reports of safety concerns regarding early enhanced nutritional management [11,12,13,14,15], we were justifiably reluctant to modify our PN composition. We used nutrient modeling to provide a scientific approach to determine optimal SPN composition, and develop an integrated TN phase protocol, thus allowing a novel data-driven rather than best-guess rationale for making changes. This provided confidence and reassurance to the clinical multidisciplinary team that the proposed changes in unit practice, i.e., PN composition and other nutritional strategies, would be safe and effective in our diverse preterm population. We believe that this nutrient modeling process provides a platform to support change in clinical practice and could inform future development and composition of nutritional products, i.e., SPN bags, BM fortifiers and preterm formulas.
A strength of this study is the consistent involvement of a neonatal dietitian who was responsible for constructing and manually modeling the nutrition database. Additionally, testing across the three preterm infant groups ensured that a single SPN composition within an integrated TN phase protocol could meet the needs of our diverse preterm population. A limitation of the study was that the protein content of BM was not analyzed, and published values [23,24] were used to calculate nutrient intakes. Therefore, modeled and observed protein intakes relied on estimated rather than the actual content of BM. However, the value we used for transitional BM of 1.5 g protein/100 mL is consistent with the recent recommendation from Cormack and colleagues, 2016 [23]. Future studies evaluating the impact of nutrient intakes in preterm infants should use analyzed BM values rather than estimated values. Another limitation in the field of neonatal nutrition is the lack of definitive evidence of the bioavailability of enteral nutrients. In the future, we would welcome the establishment of bioavailability data for this population to facilitate the appropriate analysis of nutrient intakes from multiple sources, i.e., during the TN phase.
5. Conclusions
The transition phase is a nutritionally complex and vulnerable period in preterm infants where the achievement of target nutrient intakes is challenging. We have demonstrated that nutrient modeling is a valuable process to determine the amino acid composition of standardized parenteral nutrition, and modifications to other nutritional strategies within an integrated TN phase protocol that support optimal amino acid intakes during the transition phase. Data derived from nutrient modeling provides evidence and a scientific basis to support nutritional change management in neonatal units.
Supplementary Materials
The following are available online at https://www.mdpi.com/2072-6643/10/2/170/s1, Figure S1: Mean (SEM) modeled versus observed total (sum of parenteral and enteral) lipid intakes during the transition (TN) phase (previously defined as enteral feeds ≥ 20 and <120 mL/kg/day) in ELBW (A), VLBW < 30 weeks (B) and VLBW ≥ 30 weeks (C) infants, compared with parenteral nutrition (PN) recommended intakes (RI) [6] during the PN-dominant TN phase (enteral feeds < 80 mL/kg/day; light grey banding), and enteral nutrition (EN) RI [5] during the EN-dominant TN phase (enteral feeds ≥ 80 mL/kg/day; dark grey banding). Figure S2: Mean (SEM) modeled versus observed total (sum of parenteral and enteral) carbohydrate intakes during the transition (TN) phase (previously defined as enteral feeds ≥ 20 and <120 mL/kg/day) in ELBW (A), VLBW < 30 weeks (B) and VLBW ≥ 30 weeks (C) infants, compared with parenteral nutrition (PN) recommended intakes (RI) [6] during the PN-dominant TN phase (enteral feeds < 80 mL/kg/day; light grey banding), and enteral nutrition (EN) RI [5] during the EN-dominant TN phase (enteral feeds ≥ 80 mL/kg/day; dark grey banding). Figure S3: Mean (SEM) modeled versus observed total (sum of parenteral and enteral) energy intakes during the transition (TN) phase (previously defined as enteral feeds ≥ 20 and <120 mL/kg/day) in ELBW (A), VLBW < 30 weeks (B) and VLBW ≥ 30 weeks (C) infants, compared with parenteral nutrition (PN) recommended intakes (RI) [6] during the PN-dominant TN phase (enteral feeds < 80 mL/kg/day; light grey banding), and enteral nutrition (EN) RI [5] during the EN-dominant TN phase (enteral feeds ≥ 80 mL/kg/day; dark grey banding). Table S1: description of the nutrition guideline at the Cork University Maternity Hospital neonatal unit at the time of the study.
Acknowledgments
We thank the families and the medical, nursing and administrative staff who participated in this study. We thank Jennifer Wilkinson, Neonatal Dietitian for assistance with recruiting infants, Ana O’Reilly Marshall, Neonatal Dietitian and Elaine McCarthy, Postdoctoral Researcher in Neonatal Nutrition for critically reviewing the manuscript, and Aodhaidin O’Shea for assistance with the construction of the nutrition database. Danone Nutricia and Nestle made a contribution to the BabyGrow study. The analysis was completed with funding from Science Foundation Ireland to MEK for the PINPOINT project [Personalised nutrition for the preterm infant; 13SP INFANT B2888]. The funding agencies had no role in the design of the study; in the collection, analyses, or interpretation of data; in the writing of the manuscript, and in the decision to publish the results.
Author Contributions
A.-M.B., B.P.M. and M.E.K. conceived and designed the study and interpreted the data; A.-M.B. conducted the study, constructed and modeled the nutrition database and conducted the data analysis; A.-M.B., B.P.M., S.F. and M.E.K. wrote the paper; all authors critically revised the manuscript, and read and approved the final manuscript.
Conflicts of Interest
The authors declare no conflict of interest.
References
- Brennan, A.M.; Fenton, S.; Murphy, B.P.; Kiely, M.E. Transition Phase Nutrition Recommendations: A Missing Link in the Nutrition Management of Preterm Infants. J. Parenter. Enter. Nutr. 2017. [Google Scholar] [CrossRef] [PubMed]
- Miller, M.; Donda, K.; Bhutada, A.; Rastogi, D.; Rastogi, S. Transitioning Preterm Infants From Parenteral Nutrition: A Comparison of 2 Protocols. J. Parenter. Enter. Nutr. 2017, 41, 1371–1379. [Google Scholar] [CrossRef] [PubMed]
- Miller, M.; Vaidya, R.; Rastogi, D.; Bhutada, A.; Rastogi, S. From parenteral to enteral nutrition: A nutrition-based approach for evaluating postnatal growth failure in preterm infants. J. Parenter. Enter. Nutr. 2014, 38, 489–497. [Google Scholar] [CrossRef] [PubMed]
- Senterre, T.T.; Terrin, G.; De Curtis, M.; Rigo, J. Parenteral Nutrition in Premature Infants. In Textbook of Pediatric Gastroenterology, Hepatology and Nutrition: A Comprehensive Guide to Practice; Guandalini, S., Dhawan, A., Branski, D., Eds.; Springer International Publishing: Basel, Switzerland, 2016. [Google Scholar]
- Koletzko, B.; Poindexter, B.; Uauy, R. Nutritional Care of Preterm Infants: Scientific Basis and Practical Guidelines; Karger: Basel, Switzerland, 2014. [Google Scholar]
- Tsang, R.C.; Uauy, R.; Koletzko, B.; Zlotkin, S. Appendix 3-summary of reasonable nutrient intakes (mass units) for preterm infants. In Nutrition of the Preterm Infant: Scientific Basis and Practical Guidelines, 2nd ed.; Tsang, R.C., Uauy, R., Koletzko, B., Zlotkin, S., Eds.; Digital Educational Publishing, Inc.: Cincinnati, OH, USA, 2005; pp. 415–416. [Google Scholar]
- Koletzko, B.; Goulet, O.; Hunt, J.; Krohn, K.; Shamir, R. Guidelines on Paediatric Parenteral Nutrition of the European Society of Paediatric Gastroenterology, Hepatology and Nutrition (ESPGHAN) and the European Society for Clinical Nutrition and Metabolism (ESPEN), Supported by the European Society of Paediatric Research (ESPR). J. Pediatr. Gastroenterol. Nutr. 2005, 41, S1–S87. [Google Scholar] [PubMed]
- Agostoni, C.; Buonocore, G.; Carnielli, V.P.; De Curtis, M.; Darmaun, D.; Decsi, T.; Domellof, M.; Embleton, N.D.; Fusch, C.; Genzel-Boroviczeny, O.; et al. Enteral nutrient supply for preterm infants: Commentary from the European Society of Paediatric Gastroenterology, Hepatology and Nutrition Committee on Nutrition. J. Pediatr. Gastroenterol. Nutr. 2010, 50, 85–91. [Google Scholar] [CrossRef] [PubMed]
- Morgan, C.; McGowan, P.; Herwitker, S.; Hart, A.E.; Turner, M.A. Postnatal head growth in preterm infants: A randomized controlled parenteral nutrition study. Pediatrics 2014, 133, e120–e128. [Google Scholar] [CrossRef] [PubMed]
- Cormack, B.E.; Bloomfield, F.H. Increased protein intake decreases postnatal growth faltering in ELBW babies. Arch. Dis. Child. Fetal Neonatal Ed. 2013, 98, F399–F404. [Google Scholar] [CrossRef] [PubMed]
- Moltu, S.J.; Strommen, K.; Blakstad, E.W.; Almaas, A.N.; Westerberg, A.C.; Braekke, K.; Ronnestad, A.; Nakstad, B.; Berg, J.P.; Veierod, M.B.; et al. Enhanced feeding in very-low-birth-weight infants may cause electrolyte disturbances and septicemia—A randomized, controlled trial. Clin. Nutr. 2013, 32, 207–212. [Google Scholar] [CrossRef] [PubMed]
- Blanco, C.L.; Gong, A.K.; Schoolfield, J.; Green, B.K.; Daniels, W.; Liechty, E.A.; Ramamurthy, R. Impact of early and high amino acid supplementation on ELBW infants at 2 years. J. Pediatr. Gastroenterol. Nutr. 2012, 54, 601–607. [Google Scholar] [CrossRef] [PubMed]
- Bonsante, F.; Iacobelli, S.; Chantegret, C.; Martin, D.; Gouyon, J.B. The effect of parenteral nitrogen and energy intake on electrolyte balance in the preterm infant. Eur. J. Clin. Nutr. 2011, 65, 1088–1093. [Google Scholar] [CrossRef] [PubMed]
- Brener Dik, P.H.; Galletti, M.F.; Fernandez Jonusas, S.A.; Alonso, G.; Mariani, G.L.; Fustinana, C.A. Early hypophosphatemia in preterm infants receiving aggressive parenteral nutrition. J. Perinat. 2015, 35, 712–715. [Google Scholar] [CrossRef] [PubMed]
- Guellec, I.; Gascoin, G.; Beuchee, A.; Boubred, F.; Tourneux, P.; Ramful, D.; Zana-Taieb, E.; Baud, O. Biological impact of recent guidelines on parenteral nutrition in preterm infants. J. Pediatr. Gastroenterol. Nutr. 2015, 61, 605–609. [Google Scholar] [CrossRef] [PubMed]
- Probst, Y.; Morrison, E.; Sullivan, E.; Dam, H.K. First-stage development and validation of a web-based automated dietary modeling tool: Using constraint optimization techniques to streamline food group and macronutrient focused dietary prescriptions for clinical trials. J. Med. Internet Res. 2016, 18, e190. [Google Scholar] [CrossRef] [PubMed]
- Okubo, H.; Sasaki, S.; Murakami, K.; Yokoyama, T.; Hirota, N.; Notsu, A.; Fukui, M.; Date, C. Designing optimal food intake patterns to achieve nutritional goals for Japanese adults through the use of linear programming optimization models. Nutr. J. 2015, 14. [Google Scholar] [CrossRef] [PubMed]
- Masset, G.; Monsivais, P.; Maillot, M.; Darmon, N.; Drewnowski, A. Diet optimization methods can help translate dietary guidelines into a cancer prevention food plan. J. Nutr. 2009, 139, 1541–1548. [Google Scholar] [CrossRef] [PubMed]
- Soden, P.M.; Fletcher, L.R. Modifying diets to satisfy nutritional requirements using linear programming. Br. J. Nutr. 1992, 68, 565–572. [Google Scholar] [CrossRef] [PubMed]
- Briend, A.; Darmon, N.; Ferguson, E.; Erhardt, J.G. Linear programming: A mathematical tool for analyzing and optimizing children’s diets during the complementary feeding period. J. Pediatr. Gastroenterol. Nutr. 2003, 36, 12–22. [Google Scholar] [CrossRef] [PubMed]
- Brennan, A.M.; Murphy, B.P.; Kiely, M. Nutritional management and assessment of preterm infants: The BabyGrow longitudinal nutrition and growth study. Top. Clin. Nutr. 2015, 30, 80–93. [Google Scholar] [CrossRef]
- Tudehope, D.; Fewtrell, M.; Kashyap, S.; Udaeta, E. Nutritional needs of the micropreterm infant. J. Pediatr. 2013, 162, S72–S80. [Google Scholar] [CrossRef] [PubMed]
- Cormack, B.E.; Embleton, N.D.; van Goudoever, J.B.; Hay, W.W., Jr.; Bloomfield, F.H. Comparing apples with apples: It is time for standardized reporting of neonatal nutrition and growth studies. Pediatr. Res. 2016, 79, 810–820. [Google Scholar] [CrossRef] [PubMed]
- Food Standard Agency (FSA). McCance and Widdowson’s The Composition of Foods, 6th ed.; Royal Society of Chemistry: Cambridge, UK, 2002.
- Food and Agriculture Organization of the United Nations (FAO). Energy and Protein Requirements: Report of a Joint FAO/WHO Ad Hoc Expert Committee; Food and Agriculture Organization of the United Nations (FAO): Rome, Italy, 1971; pp. 1–118. [Google Scholar]
- Atwater, W.O.; Bryant, A.P. The Availability and Fuel Value of Food Materials; 12th Annual Report 73-110; US Government Printing Office, (Agriculture Experiment Station): Washington, DC, USA, 1900.
- Ball, P.A.; Booth, I.W.; Holden, C.E.; Puntis, J.W. Paediatric Parenteral Nutrition, 3rd ed.; Pharmacia Ltd.: Milton Keynes, UK, 1998. [Google Scholar]
- Iacobelli, S.; Viaud, M.; Lapillonne, A.; Robillard, P.Y.; Gouyon, J.B.; Bonsante, F. Nutrition practice, compliance to guidelines and postnatal growth in moderately premature babies: The NUTRIQUAL French survey. BMC Pediatr. 2015, 15, 110. [Google Scholar] [CrossRef] [PubMed]
- Grover, A.; Khashu, M.; Mukherjee, A.; Kairamkonda, V. Iatrogenic malnutrition in neonatal intensive care units: Urgent need to modify practice. J. Parenter. Enter. Nutr. 2008, 32, 140–144. [Google Scholar] [CrossRef] [PubMed]
- Morgan, C.; Herwitker, S.; Badhawi, I.; Hart, A.; Tan, M.; Mayes, K.; Newland, P.; Turner, M.A. SCAMP: Standardised, concentrated, additional macronutrients, parenteral nutrition in very preterm infants: A phase IV randomised, controlled exploratory study of macronutrient intake, growth and other aspects of neonatal care. BMC Pediatr. 2011, 11, 53. [Google Scholar] [CrossRef] [PubMed] [Green Version]
- Hay, W.W.; Ziegler, E.E. Growth failure among preterm infants due to insufficient protein is not innocuous and must be prevented. J. Perinat. 2016, 36, 500–502. [Google Scholar] [CrossRef] [PubMed]
- Ng, D.V.; Brennan-Donnan, J.; Unger, S.; Bando, N.; Gibbins, S.; Nash, A.; Kiss, A.; O’Connor, D.L. How close are we to achieving energy and nutrient goals for very low birth weight infants in the first week? J. Parenter. Enter. Nutr. 2017, 41, 500–506. [Google Scholar] [CrossRef] [PubMed]
Figure 1.
Flow chart of nutrient modeling steps. TN: transition; EFV: enteral feed volume; PN: parenteral nutrition; EN: enteral nutrition; AA: amino acid; SPN: standardized parenteral nutrition; BM: breastmilk. * PN recommendations [6]. ** EN recommendations [5].
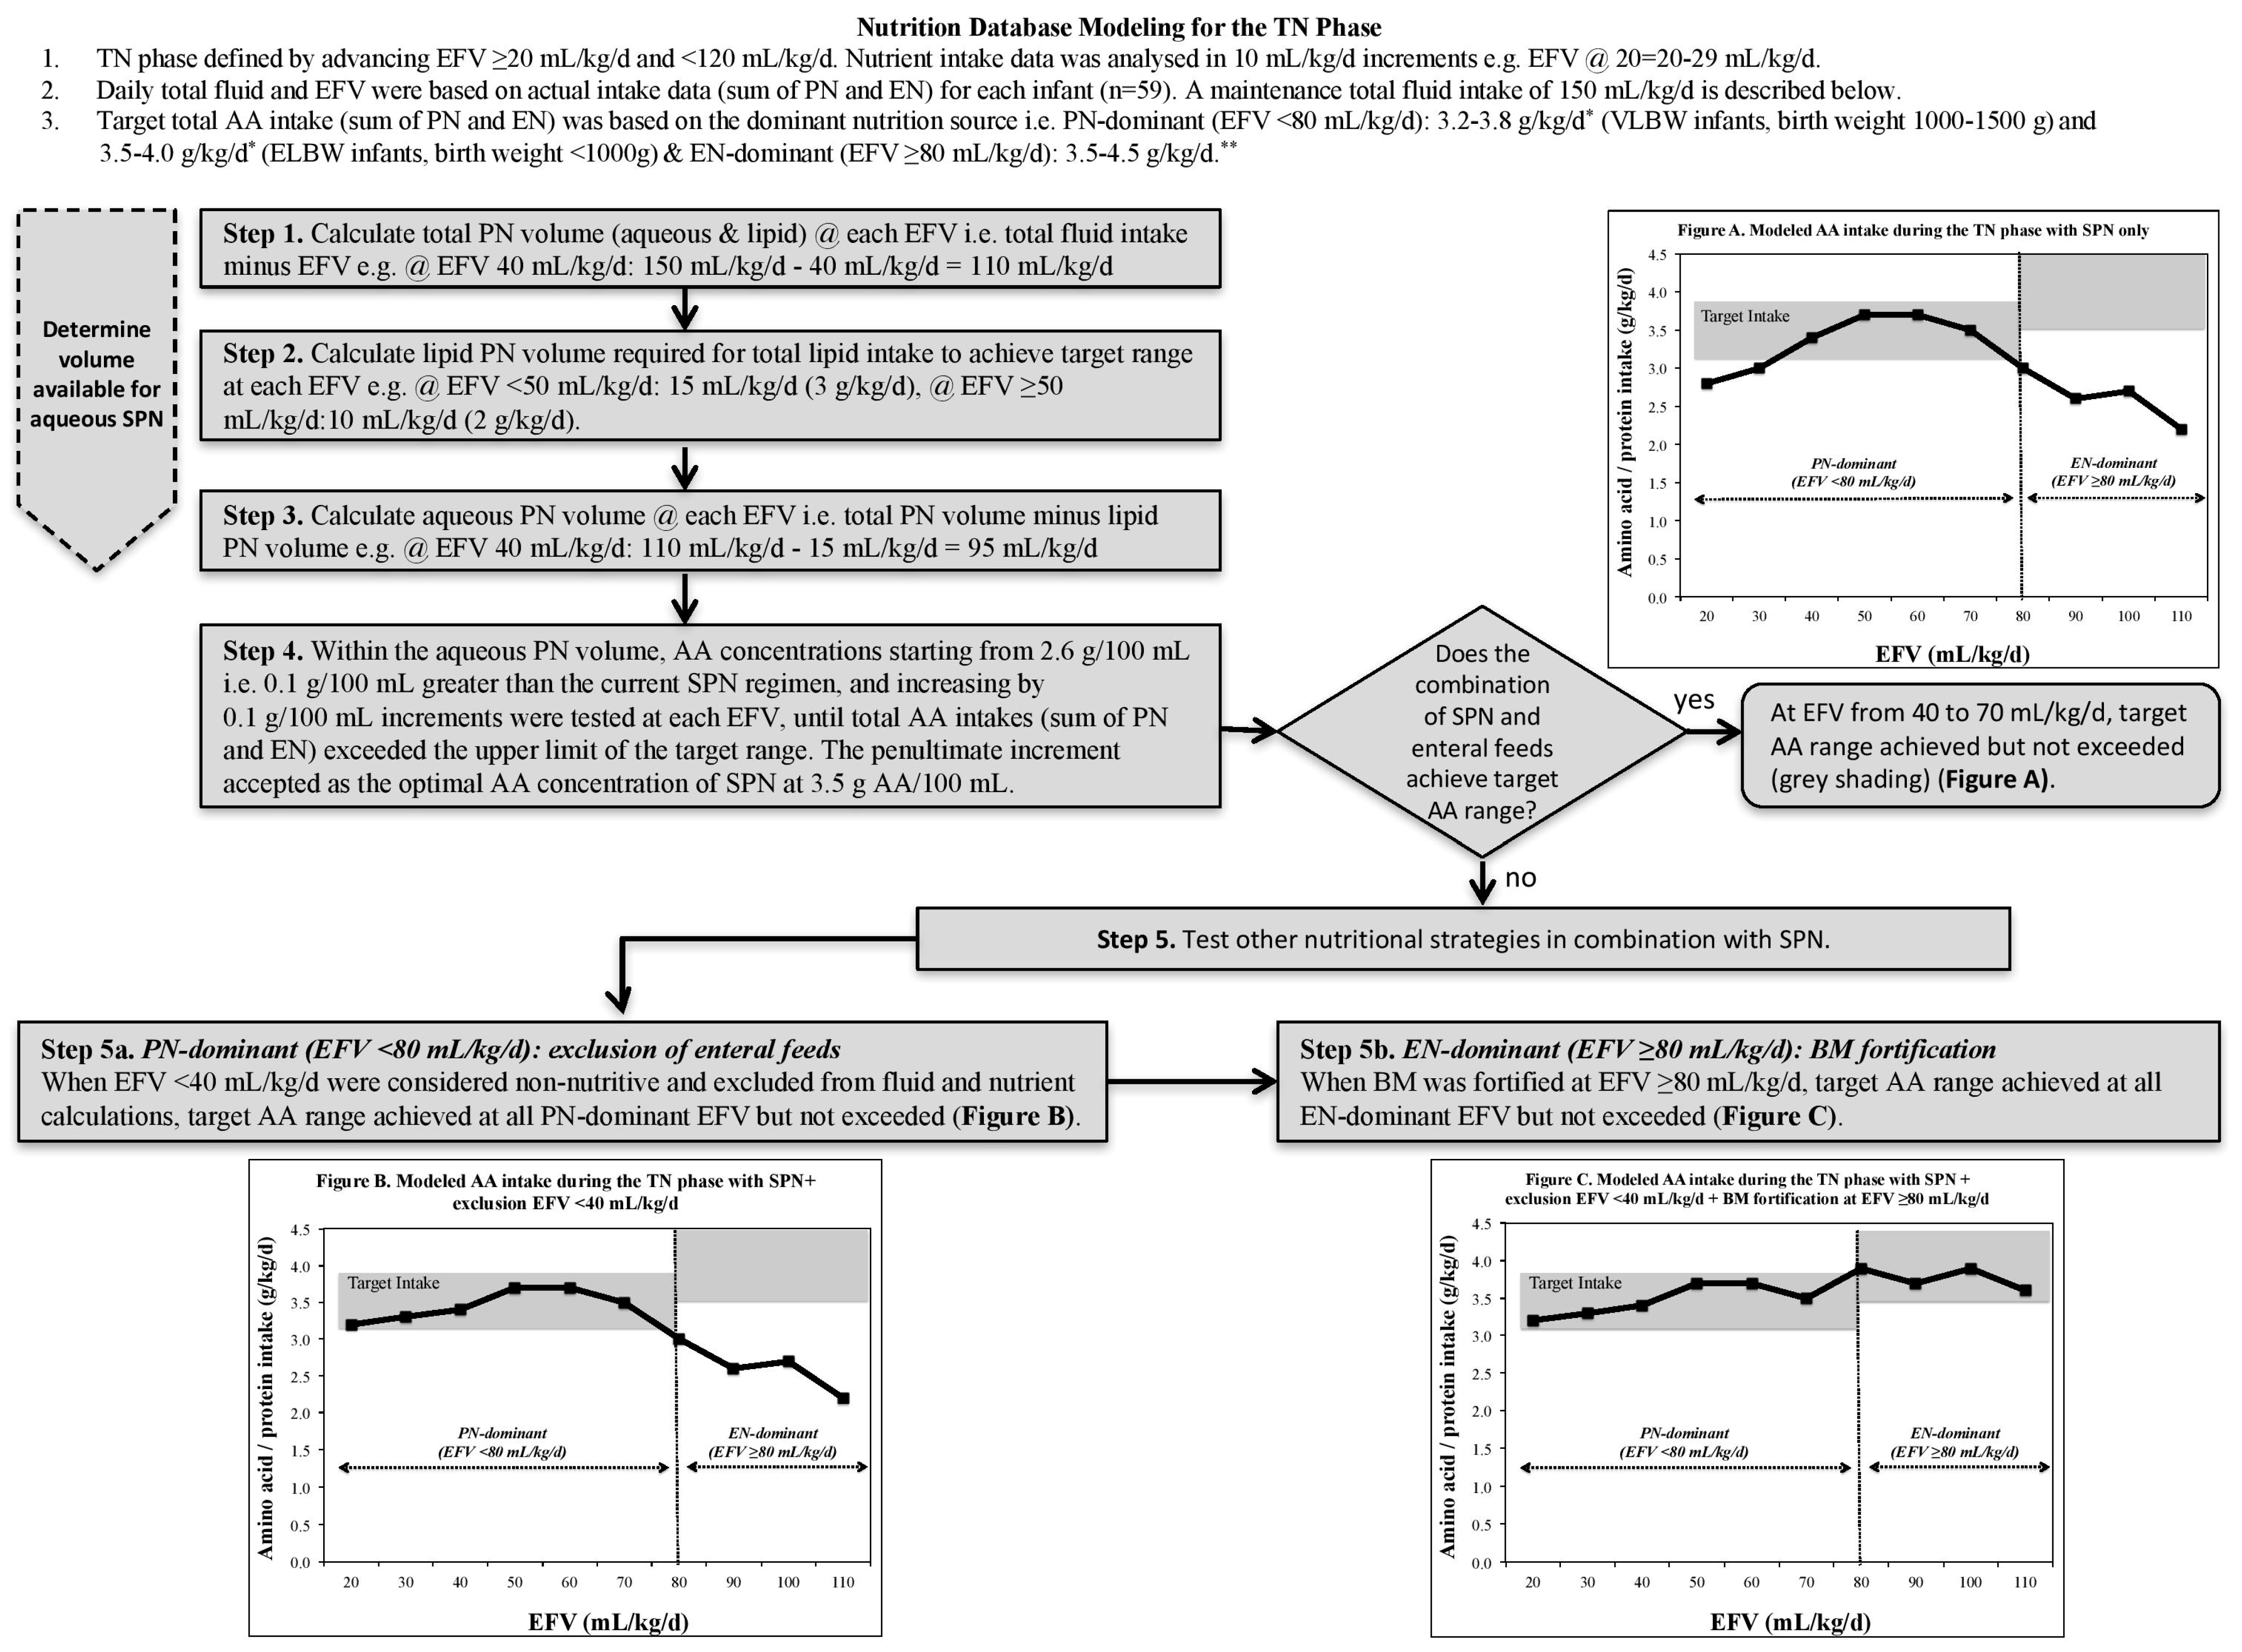
Figure 2.
Mean (SEM) modeled versus observed total (sum of parenteral and enteral) amino acid/protein intakes during the transition (TN) phase (previously defined as enteral feeds ≥ 20 and <120 mL/kg/day) in ELBW (A); VLBW < 30 weeks (B) and VLBW ≥ 30 weeks (C) infants, compared with parenteral nutrition (PN) recommended intakes (RI) [6] during the PN-dominant TN phase (enteral feeds < 80 mL/kg/day; light grey banding), and enteral nutrition (EN) RI [5] during the EN-dominant TN phase (enteral feeds ≥ 80 mL/kg/day; dark grey banding).


Table 1.
List of local nutritional and fluid constraints used in nutrient modeling of the preterm nutrition database for the TN phase.
Table 1.
List of local nutritional and fluid constraints used in nutrient modeling of the preterm nutrition database for the TN phase.
| Nutritional * | Amino acid, g/kg/day | PN-dominant TN phase: 3.5–4.0 (ELBW), 3.2–3.8 (VLBW)
EN-dominant TN phase: 3.5–4.5 ** |
| Lipid, g/kg/day | PN-dominant TN phase: 3.0–4.0 ***
EN-dominant TN phase: 4.8–6.6 | |
| Glucose, g/kg/day | PN-dominant TN phase: 13.0–17.0 (ELBW), 9.7–15.0 (VLBW)
EN-dominant TN phase: 11.6–13.2 | |
| Energy, kcal/kg/day | PN-dominant TN phase: 90–115
EN-dominant TN phase: 110–130 | |
| Fluid | Total daily fluid intake | Actual total daily fluid intakes were not altered |
| Enteral feed intake | Actual daily enteral feed intakes were not altered | |
| Parenteral lipid | Each g lipid is delivered in 5 mL (20% concentration) | |
| IV fluid concentration | PN regimens and IV fluids set at a maximum 12.5% dextrose to allow flexibility for peripheral and central access |
ELBW: extremely low birth weight infant; IV: intravenous; PN: parenteral nutrition; TN: transition; VLBW: very low birth weight infant. * During the PN-dominant TN phase, when nutrition intake was predominantly parenterally sourced (defined by enteral feeds < 80 mL/kg/day), nutritional constraints were based on Tsang’s PN ‘growing’ recommendations [6]. During the EN-dominant TN phase, when nutrition intake was predominantly enterally sourced (defined by enteral feeds ≥ 80 mL/kg/day), nutritional constraints were based on the most up-to-date EN recommendations [5]. ** Represents enteral protein recommendations. *** In the PN-dominant TN phase, an initial upper lipid constraint of 4.0 g/kg/day was assigned. However, in order to achieve target energy intakes whilst respecting all other constraints, the upper constraint was increased to 4.8 g/kg/day (combined parenteral and enteral intake) with a maximum of 3 g/kg/day from parenteral lipid. This approach took into account the reduced bioavailability of enteral lipid when compared to a PN recommendation.
Table 2.
Baseline population characteristics and observed nutrient intake data of 59 preterm infants.
Table 2.
Baseline population characteristics and observed nutrient intake data of 59 preterm infants.
| ELBW (n = 12) | VLBW < 30 Weeks (n = 23) | VLBW ≥ 30 Weeks (n = 24) | P * | |
|---|---|---|---|---|
| Perinatal and postnatal data | ||||
| Male | 5 (42%) | 9 (39%) | 10 (42%) | 0.98 |
| Gestational age, weeks | 26.9 ± 1.8 a | 28.0 ± 0.8 b | 31.3 ± 1.1 c | <0.001 |
| Birth weight, g | 834 ± 113 a | 1220 ± 120 b | 1330 ± 140 c | <0.001 |
| SGA at birth | 4 (33%) | 1 (4%) | 11 (46%) | 0.005 |
| Maternal hypertension | 3 (25%) | 1 (4%) | 7 (29%) | 0.08 |
| Cesarean section | 7 (58%) | 14 (61%) | 21 (88%) | 0.07 |
| Antenatal steroids | 11 (92%) | 20 (87%) | 22 (92%) | 0.84 |
| Multiple births | 6 (50%) | 11 (48%) | 16 (67%) | 0.39 |
| Nasal CPAP | 12 (100%) | 22 (96%) | 17 (71%) | 0.01 |
| Conventional ventilation after birth | 9 (75%) | 13 (57%) | 4 (17%) | 0.001 |
| Chronic lung disease | 3 (25%) | 1 (4%) | 0 | 0.02 |
| Patent ductus arteriosus | 9 (75%) | 12 (52%) | 6 (25%) | 0.01 |
| Late onset sepsis | 2 (17%) | 5 (22%) | 2 (8%) | 0.44 |
| Nutrition data | ||||
| Age PN commenced, day | 1.0 ± 0.0 | 1.1 ± 0.3 | 1.2 ± 0.4 | 0.24 |
| Age lipid commenced, day | 1.5 ± 0.5 a,b | 2.2 ± 1.1 a | 1.6 ± 1.0 b | 0.04 |
| Individualized PN | 12 (100%) | 16 (70%) | 3 (13%) | <0.001 |
| Duration of PN phase, day | 6.3 ± 2.8 a | 4.5 ± 1.7 b | 2.6 ± 1.1 c | <0.001 |
| Duration of TN phase, day | 9.0 ± 2.2 a | 6.0 ± 3.0 b | 5.9 ± 3.0 b | 0.005 |
| Days receiving PN | 15.3 ± 3.5 a | 10.5 ± 3.7 b | 8.5 ± 3.1 b | <0.001 |
| Age EN commenced, day | 2.9 ± 2.0 a | 2.9 ± 0.6 a | 1.9 ± 0.7 b | 0.003 |
| Age when feeds ≥ 150 mL/kg/day achieved, day | 17.7 ± 4.5 a | 13.0 ± 4.0 b | 10.7 ± 2.7 b | <0.001 |
| Fortification of BM at EN volume, mL/kg/day | 117 ± 22 | 121 ± 20 | 125 ± 20 | 0.61 |
| BM, any ** | 12 (100%) | 23 (100%) | 21 (88%) | 0.10 |
| BM, >80% of total enteral feeds | 12 (100%) | 21 (91%) | 19 (79%) | 0.16 |
Data are presented as number (percentage) and mean ± SD. BM: breastmilk; CPAP: continuous positive airway pressure; EN: enteral nutrition; PN: parenteral nutrition; SGA: small for gestational age (birth weight < 10th percentile); TN: transition. * One-factor ANOVA followed by Tukey’s test or chi-square test for percentages. Superscript letters denote significant differences between groups, P < 0.05. ** A total of four infants received donor BM (range 2–20 days).
Table 3.
A proposed integrated TN phase protocol.
| Enteral Nutrition | Parenteral Nutrition | Nutritional Strategy | ||
|---|---|---|---|---|
| Enteral Feed Volume mL/kg/day | Target Aqueous Volume mL/kg/day | Target Lipid Volume mL/kg/day | Target Total PN Volume mL/kg/day | |
| 40 | 95 | 15 (3 g/kg/day) | 110 | |
| 50 | 85 | 15 (3 g/kg/day) | 100 | |
| 60 | 80 | 10 (2 g/kg/day) | 90 | Reduce lipid from 3 to 2 g/kg/day |
| 70 | 70 | 10 (2 g/kg/day) | 80 | |
| 80 | 60 | 10 (2 g/kg/day) | 70 | Commence breastmilk fortifier |
| 90 | 50 | 10 (2 g/kg/day) | 60 | |
| 100 | 40 | 10 (2 g/kg/day) | 50 | |
| 110 | 30 | 10 (2 g/kg/day) | 40 | |
| 120 | Consider stopping PN | |||
TN: transition; PN: parenteral nutrition.
© 2018 by the authors. Licensee MDPI, Basel, Switzerland. This article is an open access article distributed under the terms and conditions of the Creative Commons Attribution (CC BY) license (http://creativecommons.org/licenses/by/4.0/).
Share and Cite
MDPI and ACS Style
Brennan, A.-M.; Kiely, M.E.; Fenton, S.; Murphy, B.P. Standardized Parenteral Nutrition for the Transition Phase in Preterm Infants: A Bag That Fits. Nutrients 2018, 10, 170. https://doi.org/10.3390/nu10020170
AMA Style
Brennan A-M, Kiely ME, Fenton S, Murphy BP. Standardized Parenteral Nutrition for the Transition Phase in Preterm Infants: A Bag That Fits. Nutrients. 2018; 10(2):170. https://doi.org/10.3390/nu10020170
Chicago/Turabian StyleBrennan, Ann-Marie, Mairead E. Kiely, Sarah Fenton, and Brendan P. Murphy. 2018. "Standardized Parenteral Nutrition for the Transition Phase in Preterm Infants: A Bag That Fits" Nutrients 10, no. 2: 170. https://doi.org/10.3390/nu10020170
Note that from the first issue of 2016, this journal uses article numbers instead of page numbers. See further details here.