
Performance of MODIS C6 Aerosol Product during Frequent Haze-Fog Events: A Case Study of Beijing


1
College of Geoscience and Surveying Engineering, China University of Mining & Technology, Beijing 100083, China
2
Beijing Key Lab of Spatial Information Integration & Its Applications, Peking University, Beijing 100871, China
*
Authors to whom correspondence should be addressed.
Remote Sens. 2017, 9(5), 496; https://doi.org/10.3390/rs9050496
Submission received: 22 March 2017
/
Revised: 4 May 2017
/
Accepted: 14 May 2017
/
Published: 18 May 2017
(This article belongs to the Special Issue Remote Sensing of Atmospheric Pollution)
Abstract
:The newly released MODIS Collection 6 aerosol products have been widely used to evaluate fine particulate matter with a 10 km Dark Target aerosol optic depth (DT AOD) product, a new 3 km DT AOD product and an enhanced Deep Blue (DB) AOD product. However, the representativeness of MODIS AOD products under different air quality conditions remains unclear. In this study, we obtained all three types of MODIS Terra AOD from 2001 to 2015 and Aqua AOD from 2003 to 2015 for the Beijing region to study the performance of the different AOD products (Collection 6) under different air quality situations. The validation of three MODIS AOD products suggests that DB AOD has the highest accuracy with an expected error (EE) envelope (containing at least 67% of the matchups on a scatter plot) of 0.05 + 0.15τ, followed by 10 km DT AOD (0.08 + 0.2τ) and 3 km DT AOD (0.35 + 0.15τ), specifically for Beijing. Near-surface PM2.5 concentrations during the passage of MODIS from 2013 to 2015 were also obtained to categorize air quality as unpolluted, moderately, and heavily polluted, as well as to analyze the performance of the different AOD products under different air quality conditions. Very few MODIS 3 km DT retrievals appeared on heavily polluted days, making it almost impossible to play an effective role in air quality applications in Beijing. While the DB AOD allowed for considerable retrievals under all air quality conditions, it had a coarse spatial resolution. These results demonstrate that the MODIS 3 km DT AOD product may not be the appropriate proxy to be used in the satellite retrieval of surface PM2.5, especially for those areas with frequent haze-fog events like Beijing.
1. Introduction
Aerosols are important components of the atmosphere that can affect atmospheric environment [1], weather [2], climate [3], and human health [4]. Aerosol particles in the atmosphere absorb and scatter incident solar radiation, and affect the Earth’s radiation budget [5]. Aerosol particles can act as condensation nuclei to form clouds and affect precipitation, while excessive aerosol loading can change cloud properties (e.g., albedo, etc.) by means of the indirect radiative forcing effects of the aerosol [6]. Therefore, the analysis of aerosol properties has been the focus of atmospheric research via both ground-based sun-photometers and satellite-based observations [7]. Satellite observation of aerosols utilizes the reflected signals of the atmosphere to retrieve the optical properties of the aerosol (primarily the aerosol optical depth, AOD), and is very powerful for monitoring the global distribution of aerosol loadings due to its instantaneous coverage of the Earth’s surface. Various satellite sensors have been launched, such as the Moderate Resolution Imaging Spectroradiometer (MODIS), Multi-angle Imaging Spectroradiometer (MISR), and POLarization and Directionality of the Earth’s Reflectances (POLDER) [8,9,10]. The MODIS aerosol products employ different aerosol retrieval algorithms over land and ocean. Over land, AOD over vegetation and other dark objects is retrieved with the Dark Target (DT) algorithm, which primarily utilizes the relationship between two visible bands (red and blue) and a shortwave infrared band (2.1 μm). The Deep Blue (DB) algorithm was developed to retrieve the AOD over bright surfaces [11], and was later extended to cover vegetated surfaces. MISR utilizes multi-angular observation to retrieve aerosol properties with nine discrete view angles in four bands [12]. POLDER is also able to retrieve aerosol properties with multi-angular observations with additional polarization signals, but the land aerosol properties retrieved by POLDER are currently limited to fine mode aerosols, as it assumes that the polarization signal is sensitive to fine mode aerosols over land [13]. Among these satellite aerosol products, the MODIS products have been the most widely used because of their high accuracy; global expected error envelope of ±(0.05 + 15%) over land and +(0.04 + 10%) to −(0.2 + 10%) over ocean [14]; wide-coverage (a swath of 2330 km); long-term dataset (beginning in 2000); and high temporal resolution (Terra and Aqua in the morning and afternoon) [15]. However, satellite-based sensors retrieve aerosol properties by utilizing relatively weak reflected signals from the atmosphere, and are easily contaminated by surface reflective signals if the surface reflectance is too high [16]. Therefore, over a bright surface such as a desert or city, surface-reflected signals dominate and the accuracy of the satellite-retrieved aerosol properties is limited [17]. Although the accuracy of AOD retrieval is relatively high, other aerosol properties—such as the single scattering albedo (SSA), size distribution, and refractive index—cannot be effectively obtained via satellite remote sensing [18]. Furthermore, the retrieval of aerosol properties relies on the radiative transfer calculation for reflected signals, involving both surface and atmospheric properties. If the surface is “masked” by clouds or high concentrations of particulate matter, the radiative transfer models may not be able to decouple surface and atmosphere contributions, making aerosol retrieval inaccurate. For example, the Second Simulation of the Satellite Signal in the Solar Spectrum (6S) suggests that visibility should be larger than 5 km; otherwise, the accuracy is doubtful [19]. This might be acceptable for regions such as the United States and Western Europe that have good air quality resulting from strict environmental policies; however, for areas such as northern China that have frequent haze-fog events when the particulate matter concentration could be as high as 300 µg/m3 [20], the retrieval of aerosol properties has a high fail rate, as the high concentration of particulate matter acts as a particle “wall” that stops radiative transfer from the land surface to the satellite.
Ground-based sun-photometer observations retrieve AOD by aiming directly towards the sun, thus avoiding surface reflectance contamination [21,22]. Considering the high accuracy of ground-based sun-photometer observations and the limitations imposed by a fixed location, it is necessary to construct a network to observe the aerosol with sun-photometers with comparable accuracy and retrieval methods, such as Aerosol RObotic NETwork (AERONET). China has also established its own ground-based sun-photometer networks, such as the China Aerosol Remote Sensing Network (CARSNET) [23] and Chinese Sun Hazemeter Network (CSHNET) [24], to monitor the properties of aerosols in several key regions. Due to the high accuracy of sun-photometer observations, they have been regarded as benchmarks for the validation of satellite aerosol retrievals [25]. Although many sun-photometer sites exist worldwide, they do not cover a wide spatial range, so their application for local monitoring and satellite result validation is limited. Sun-photometer observations—especially AERONET retrievals—provide a unique tool to investigate the comprehensive properties of aerosols for local issues [26].
Beijing is the capital of China, is located in Northern China, and has a population greater than 20 million [27]. During the rapid economic development that occurred during the past three decades, air pollution in Beijing has become an issue of comprehensive public concern because of the frequent haze-fog events in late autumn, winter, and early spring [28]. To investigate the properties of aerosols in Beijing, four AERONET sites were deployed in and around Beijing (i.e., the Beijing site, the Beijing-CAMS site, the PKU_PEK site, and the Yufa_PEK site), and these provide relatively long-term monitoring data of aerosol properties in Beijing. In addition to the AERONET observations, 35 air quality monitoring stations have been deployed in Beijing since 2013 to obtain real-time concentrations of six key atmospheric pollutants (PM2.5, PM10, SO2, NO2, O3, and CO). Therefore, the properties of aerosols during different air quality situations can be obtained with the aid of air quality monitoring data.
In previous studies, the performance of MODIS aerosol products has been validated globally by means of AERONET observations [29,30]. However, these validations have been primarily focused on successfully retrieving pairs of both effective MODIS and AERONET results. The results may be correct for areas that have few occurrences of heavy particulate matter pollution, as aerosol retrieval is likely to be successful. However, for areas such as Beijing that have frequent particulate matter pollution episodes, MODIS retrieval is highly possible to fail, while AERONET—which is aimed directly at the sun—could produce sufficiently accurate results [31,32]. As MODIS AOD products—including 3 km DT, 10 km DT, and 10 km DB—have been widely used to estimate the surface PM2.5 concentrations over various situations [33,34], it raises a question of what the representativeness of different MODIS AOD products under different air quality conditions is. By failing to retrieve effective AOD under heavily polluted days, retrieving PM2.5 from MODIS AOD may be biased due to the lack of sufficient samples under heavy polluted areas such as Northern China, with frequent haze-fog events.
In this study, we documented AOD data in Beijing collected from two AERONET (Beijing station and Beijing-CAMS station) and three MODIS AOD products from 2001 to 2015 to obtain successful retrieval pairs to evaluate the performance and representativeness of MODIS aerosol retrievals over Beijing. Furthermore, detailed PM2.5 concentrations measured by two air quality monitoring stations close to the two AERONET stations were also collected to characterize the air quality. The major objectives of this study are to: (1) investigate the performance of the MODIS AOD product under different air quality situations; and (2) to figure out whether these AOD products are suitable for PM2.5 retrieval in frequent haze-fog areas such as Beijing.
2. Study Area and Data Sets
2.1. Study Area
Beijing (40°N, 116°E) is the capital city of the People’s Republic of China, and has over 20 million inhabitants and an area of 16,800 km2. It lies on the northwest border of the Northern China Plain and is surrounded by the Yansan Mountains in the north and west. The climate in Beijing is semi-humid continental with an annual precipitation of 644 mm. Affected by the East Asia monsoon, approximately 80% of annual precipitation occurs in the summer months, causing wet, hot summers, and dry, cold winters. As the political and cultural center of China, air quality in Beijing has raised both domestic and foreign concerns. In the late 20th century and the beginning of the 21st century, frequent dust storms in the winter and early spring caused major atmospheric pollution issues [35]. Since 2012, serious haze events with high concentrations of PM2.5 have aroused public concern. To mitigate serious atmospheric problems, the Beijing municipal government launched the “Defending Blue Sky” campaign to report the “Blue Sky Index” to delineate the “Blue Sky Days” each year since 1998 [36]. The official data show that “Blue Sky Days” have increased from 100 per year in 1998 to 286 per year in 2012, but the public has remained confused by the deteriorating air quality conditions [37]. The reason for the confusion is that the previous ambient air quality assessments only considered PM10, NO2, and SO2, but PM2.5 has become an increasingly important issue regarding deteriorating air quality. Partly due to public pressure, the new ambient air quality standards (National Ambient Air Quality Standards, GB 3095-2012) have included PM2.5 as a key pollutant since 2013. Furthermore, air quality control guidelines such as the “Air Pollution Prevention and Control Action Plan” released by the State Council of China has requested a reduction of 25% in PM2.5 concentration in the Beijing-Tianjin-Hebei region by 2017 compared with that in 2012. To achieve these goals, a number of air quality monitoring stations were deployed to provide real-time data for the evaluation of air quality.
2.2. AERONET Data
AERONET is a global aerosol property observation network that has more than 500 stations, and some of the monitoring at AERONET began prior to 2000 [38]. AODs of several bands (typically, 340 nm, 380 nm, 440 nm, 500 nm, 670 nm, 870 nm, and 1020 nm) can be obtained through direct observation aimed at the sun. Through sky radiance measurements in the almucantar plane at 440 nm, 670 nm, 870 nm, and 1020 nm combined with the directly-obtained direct sun measured AOD at these four bands, the microphysical properties of the aerosol particles (i.e., the size distribution, the refractive index, the single scattering albedo, etc.) are retrieved via radiative transfer calculations. Furthermore, the radiative forcing and forcing efficiency are also integrated into the AERONET inversion scheme by utilizing the AOD, surface albedo, size distribution, refractive indices, particle size parameters, and so on [39]. Three levels of aerosol retrieval data are provided by AERONET: Level 1.0, Level 1.5, and Level 2.0. The Level 1.0 product provides the direct inversion of the aerosol properties without a strict quality check. The Level 1.5 product is the cloud screen product that provides a series of quality checks: data quality checks, triplet stability criterion checks, a diurnal stability check, and three standard deviation criteria checks to exclude the clouds [40]. The Level 2.0 product has more rigorous quality checks: an instrument performance check, a temperature sensor check, a calibration check, an aerosol optical depth spectral dependency check, a cloud contamination check, a consistency check, and a historical data impact check [41]. Although the Level 2.0 product has the highest quality, the strict quality checks screen out a large amount of data. Moreover, some AERONET stations do not have enough Level 2.0 data, thus limiting the scientific applications of the Level 2.0 product. Therefore, the Level 1.5 product was deemed to be of sufficient quality and quantity, and was selected and analyzed in this study.
Four AERONET stations have been deployed in Beijing, and two stations’ data with nearby air quality monitoring stations and with more than three years of data were included in this study: the Beijing station (39°58′37″N, 116°22′51″E since March 2001) and the Beijing-CAMS station (39°55′58″N, 116°19′01″E since August 2012). Both AERONET stations both have a nearby air quality monitoring station to obtain AOD–PM2.5 data pairs.
2.3. MODIS Data
Two MODIS sensors on the Terra and Aqua platforms have provided extensive aerosol data sets since 2000 and 2002, respectively. The aerosol products provided by MODIS have been updated to Collection 6 (C6) and primarily use three algorithms: (1) the Dark Target (DT) land algorithm (dark vegetated/soil lands); (2) the Dark Target ocean algorithm; and (3) the enhanced Deep Blue (DB) algorithm (originally over desert or arid lands in C5.1 and expanded to cover vegetated land surfaces in C6). Over land, the main principle of the DT algorithm relies on a consistent relationship between the 0.47, 0.66, and 2.1 µm bands in dense vegetated regions [42,43]. Therefore, the DT algorithm only provides aerosol retrievals over vegetated land and other dark land surfaces, which restricts its application. The DB algorithm was developed to obtain aerosol properties over desert and other arid surfaces, and later extended to cover vegetated land surfaces [44]. The DB algorithm makes use of the relatively low reflectance of the desert and other surfaces in the deep blue bands to retrieve aerosol properties and then extrapolate them to the 0.55 µm band. Compared to the Collection 5.1 data, the accuracy and extension of the DB results have largely increased. In Collection 5.1, the MODIS aerosol products have a spatial resolution of 10 km at the nadir, which has been retained in Collection 6. In addition to the 10 km product, Collection 6 has provided a 3 km DT product for air quality applications. In this study, both the 10 km and 3 km level 2 MODIS Collection 6 Terra and Aqua aerosol products were obtained and analyzed to provide a comprehensive analysis of the performance of MODIS aerosol products over Beijing with frequent haze-fog events.
2.4. Air Quality Monitoring Data
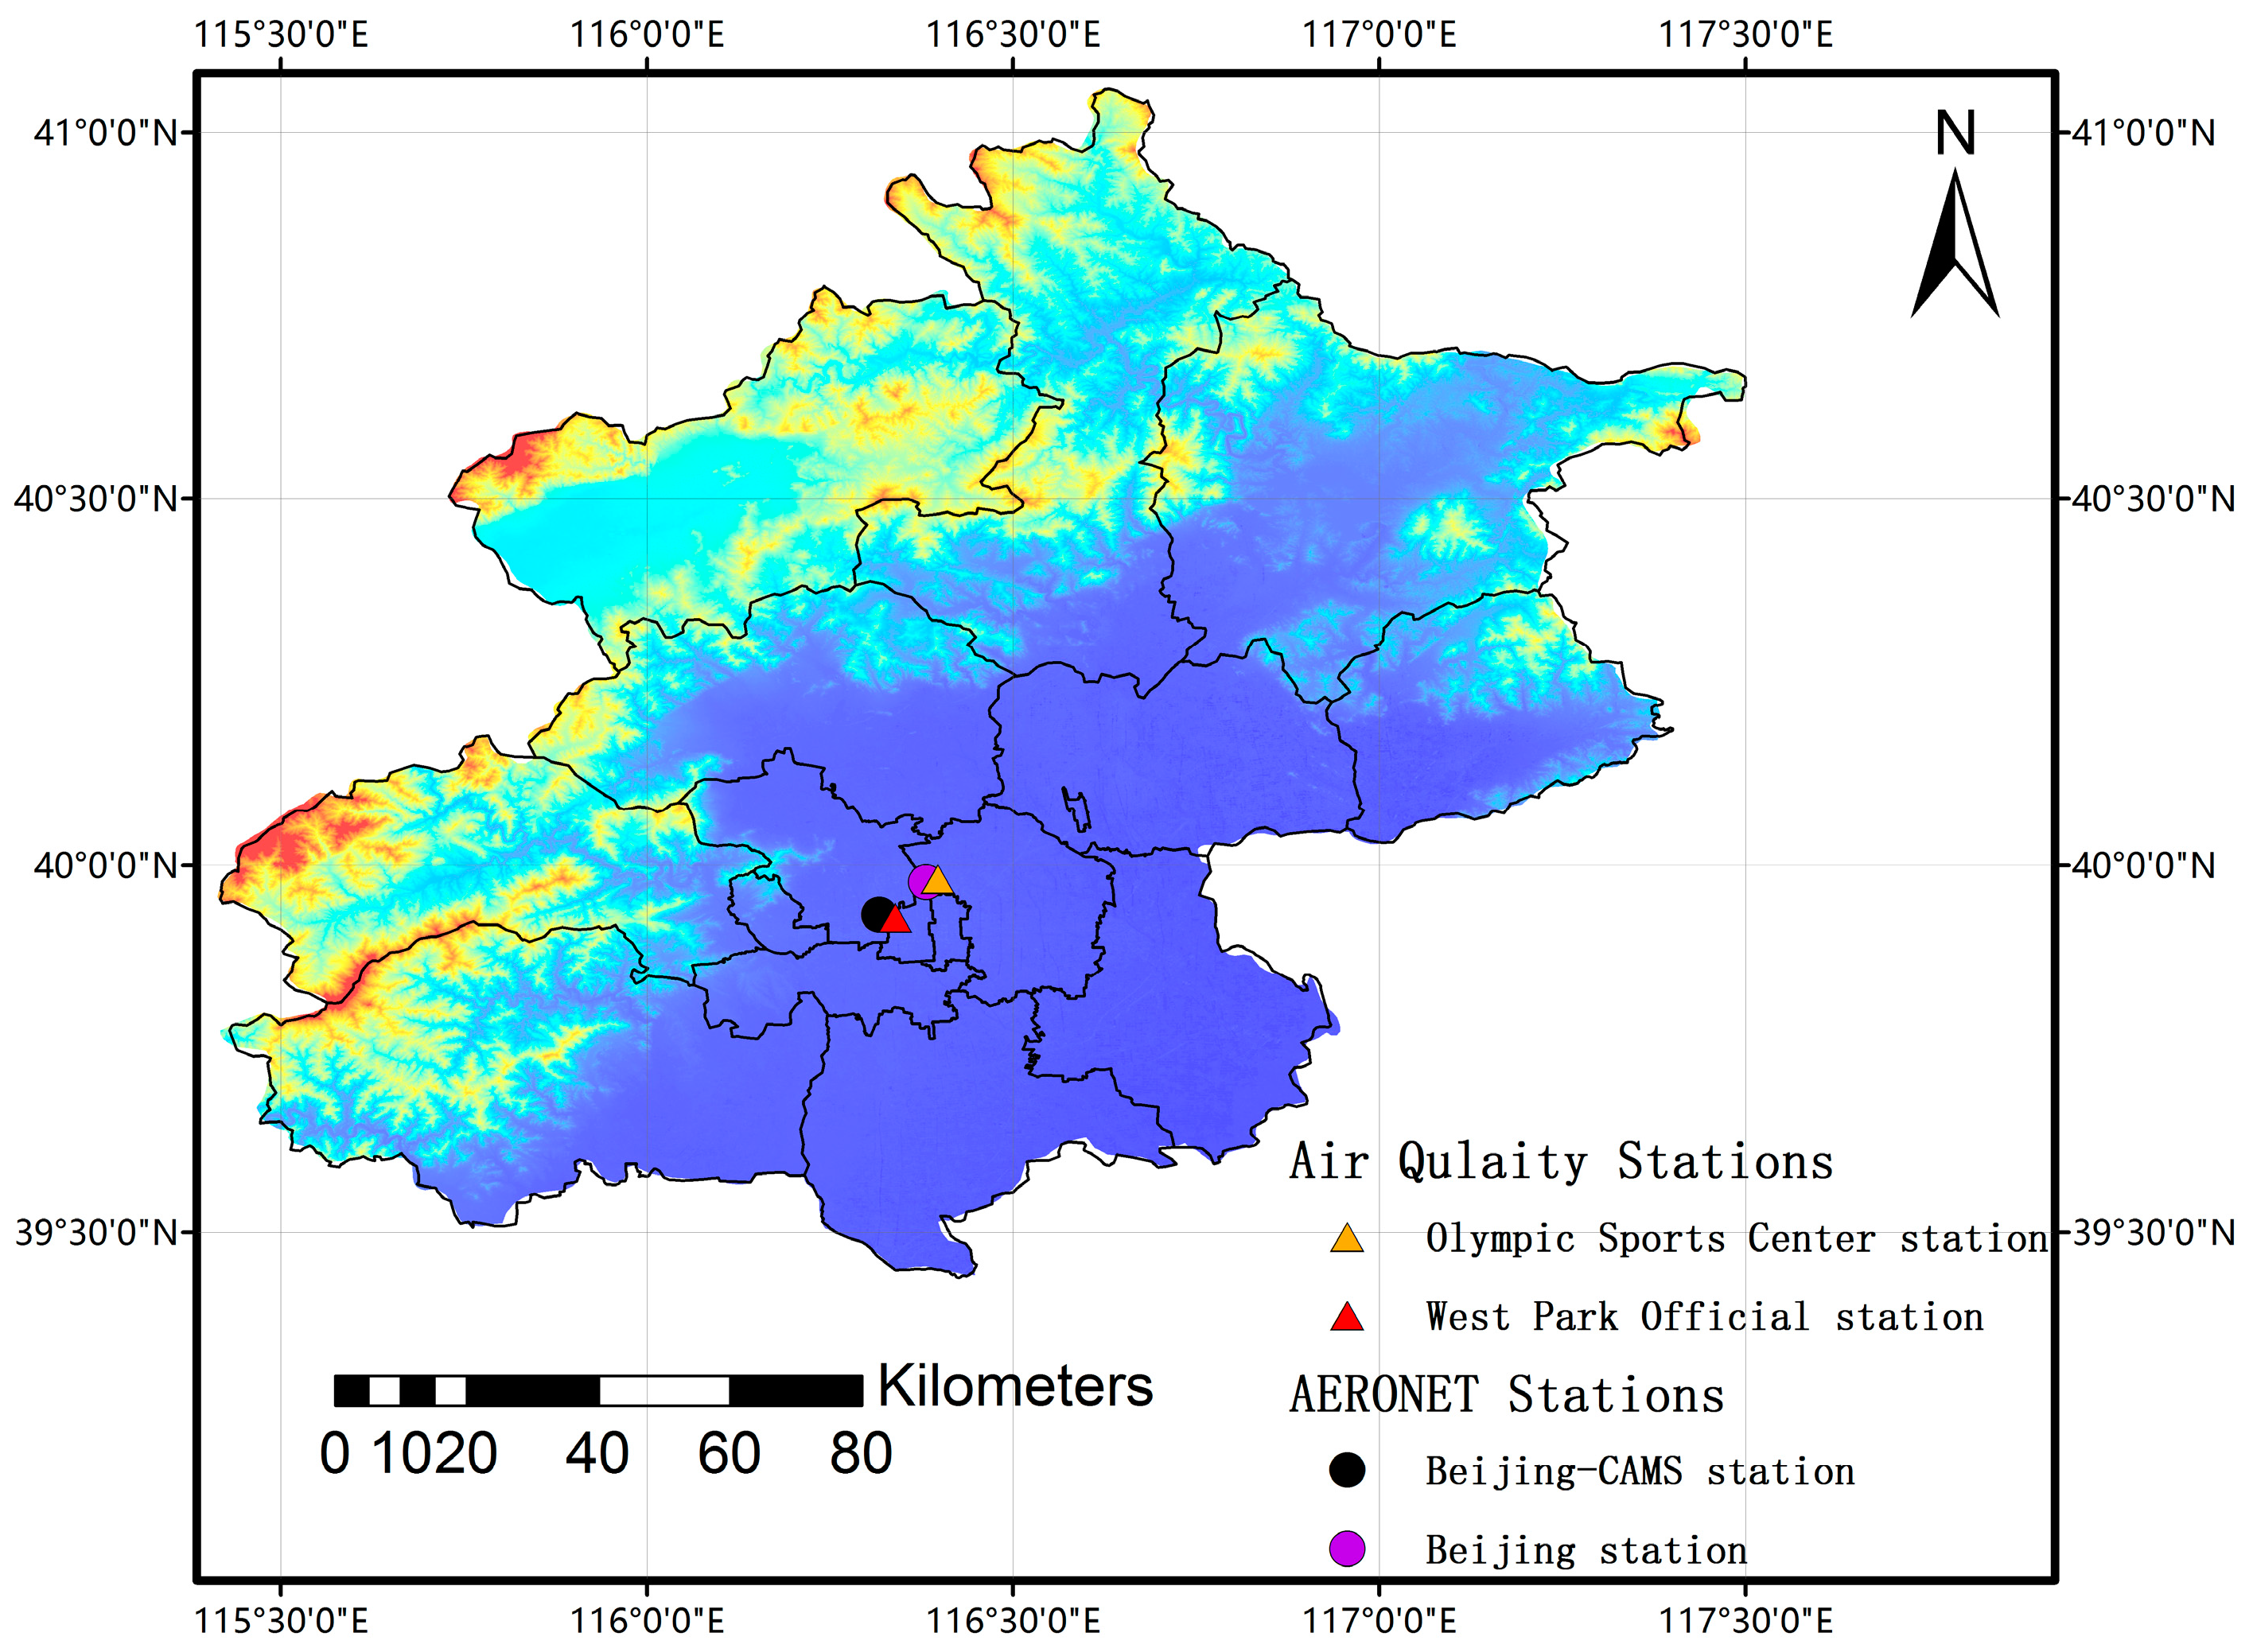
AERONET and MODIS aerosol retrievals provide the column-integrated effects of aerosol particles, but air quality monitoring data—including PM2.5 and PM10 measurements—are another method to evaluate the dry aerosol concentrations near the surface. Before 2013, the daily air quality for main cities only considered PM10, SO2, and NO2. Since 2013, the new national ambient air quality standards required 74 key cities to monitor six key pollutants at one hour intervals. From 2015, 367 cities with more than 1400 air quality monitoring stations published real-time air pollutant concentration data on the web platform of Ministry of Environmental Protection of China [45]. A total of 12 state-controlled stations and 23 municipal stations were deployed in Beijing. In this study, two air quality stations in Beijing (the West Park Officials station that matches the Beijing-CAMS station and the Olympic Sports Center station that matches the Beijing station) were selected to match the AERONET monitoring observations. The air quality monitoring data were used to characterize air quality during the overpassing of MODIS and the AERONET retrieval as follows: unpolluted (PM2.5 concentration ≤ 75 µg/m3), moderately polluted (75 µg/m3 < PM2.5 concentration ≤ 150 µg/m3), and heavily polluted (PM2.5 concentration > 150 µg/m3). The distribution of the two AERONET stations and the two air quality monitoring stations are shown in Figure 1.
3. Analytical Methods
AERONET observations during MODIS overpasses have been used as benchmarks in the evaluation and application of MODIS aerosol products. However, such comparisons require both effective AERONET and high quality MODIS retrievals. If the MODIS retrieval fails or is less reliable, the comparison cannot be made; this may be due to a variety of sources, including cloud contamination, bright surface contamination, haze-fog masking, and so on. As MODIS aerosol retrievals rely on the separation of surface and atmospheric contributions, the retrieval scheme is highly likely to fail when the particulate matter concentrations are too high (moderately polluted and heavily polluted). Urban monitoring stations in Beijing indicate that the average annual PM2.5 concentration is approximately 78 µg/m3 (5.5–475.0 µg/m3), and particulate matter pollution is present for one-third of a year. Therefore, it is highly possible that MODIS aerosol products may only retrieve aerosol optical properties when the atmosphere is not heavily polluted, causing errors in the estimates of the long-term aerosol properties from MODIS. In this study, only those MODIS retrievals with sufficient quality (Quality Assurance Confidence, QAC = 3) were included: SDS Optical_Depth_Land_And_Ocean in the 3 km DT and 10 km DT products and SDS Deep_Blue_Aerosol_Optical_Depth_550_Land selected with “QAC = 3” in the 10 km DB product.
In this study, we selected MODIS pixels within ±25 km of the two AERONET stations and averaged the all the effective AOD retrievals as effective MODIS AOD retrievals for 10 km DT and DB products [46]. The AERONET retrievals within a temporal interval of ±30 min of the MODIS overpass time were averaged to obtain effective AERONET retrievals. Because 25 km is around the 2.5 pixel resolution of MODIS 10 km DT and DB products, we restricted the spatial searching range of MODIS 3 km DT products to ±7.5 km proportionally. Both effective data pairs (with both effective MODIS and AERONET data) and ineffective data pairs (with either the MODIS or AERONET data missing) were collected and analyzed for different air quality conditions (unpolluted, moderately polluted, and heavily polluted) to evaluate the performance of MODIS aerosol products.
4. Results
4.1. Performance of the MODIS 10 km DT, 10 km DB, and 3 km DT Products
AOD data retrieved from the MODIS 10 km DT, 10 km DB, and 3 km DT products are shown in Figure 2, Figure 3 and Figure 4. In this study, Terra AOD observations from 2001 to 2015 and Aqua AOD observations from 2003 to 2015 were acquired from the MODIS Level-1 and Atmosphere Archive and Distribution System (http://ladsweb.nascom.nasa.gov) for the Beijing station, as the AERONET retrievals for this station began in 2001. For the Beijing-CAMS station (which began operation in 2012), both the MODIS Terra and Aqua data that were used to match the AERONET data were from 2012. In this study, only the highest-quality MODIS data over land (QAC = 3) were selected to match the AERONET data.
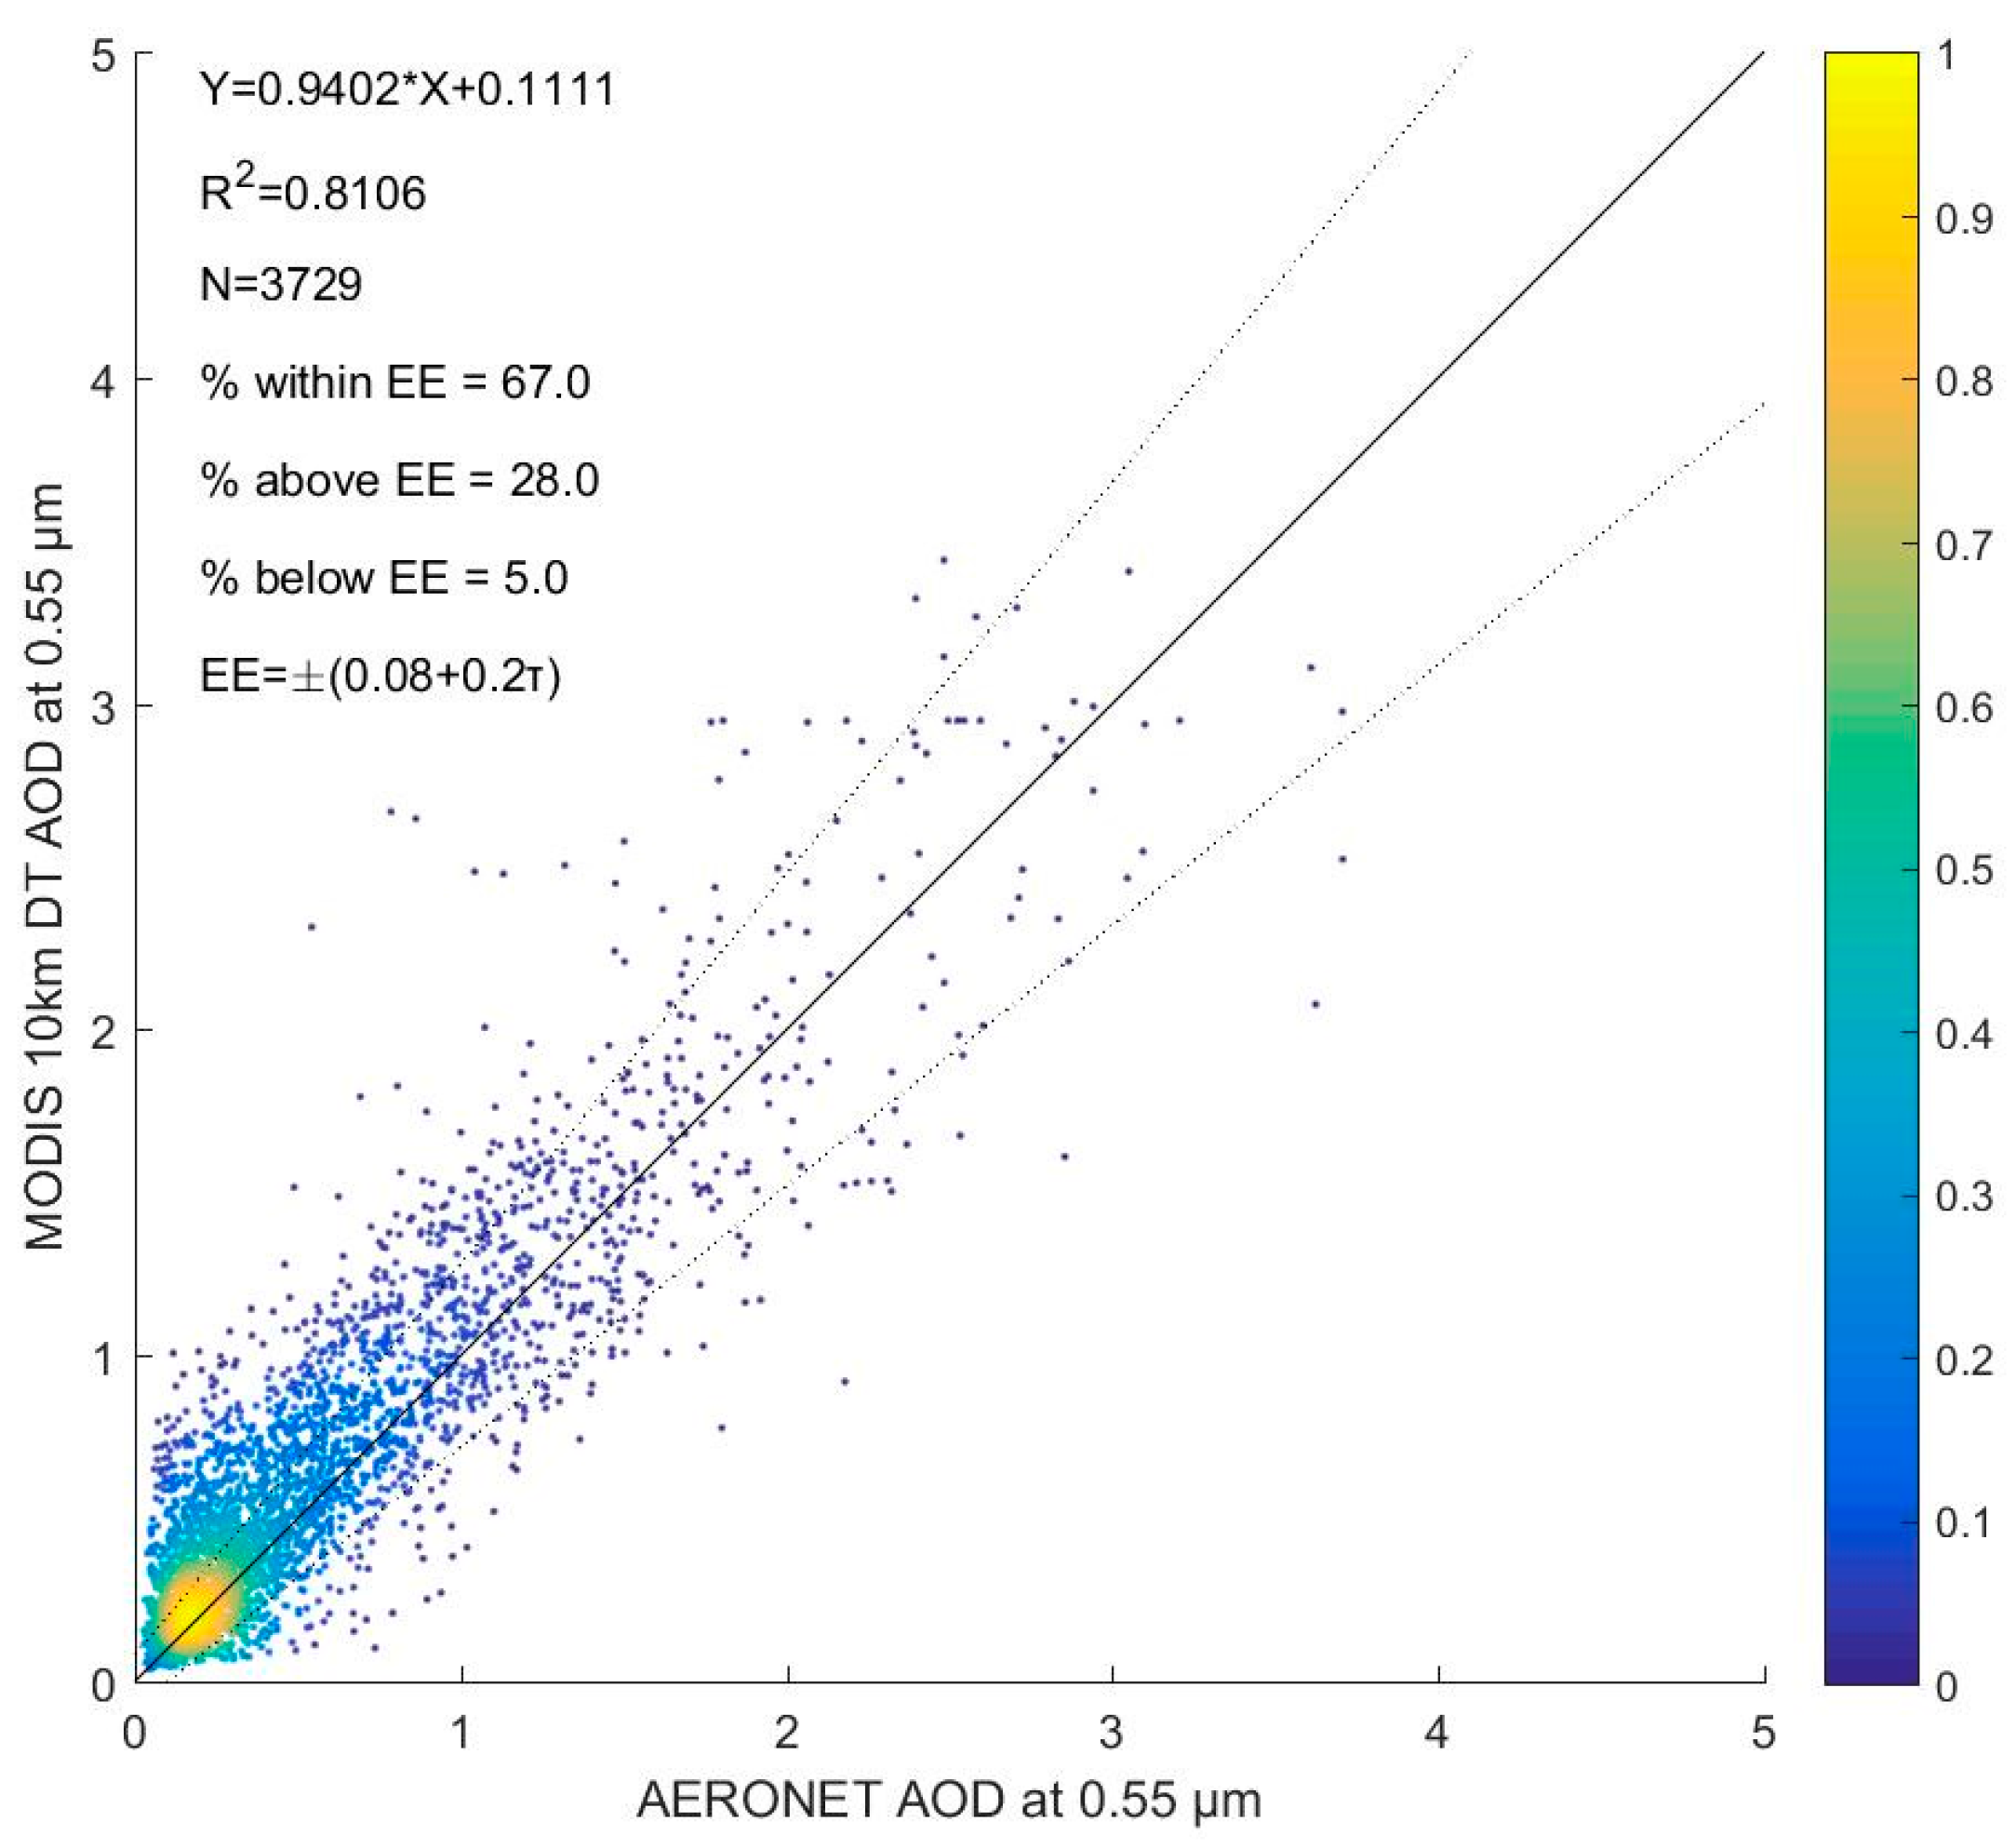
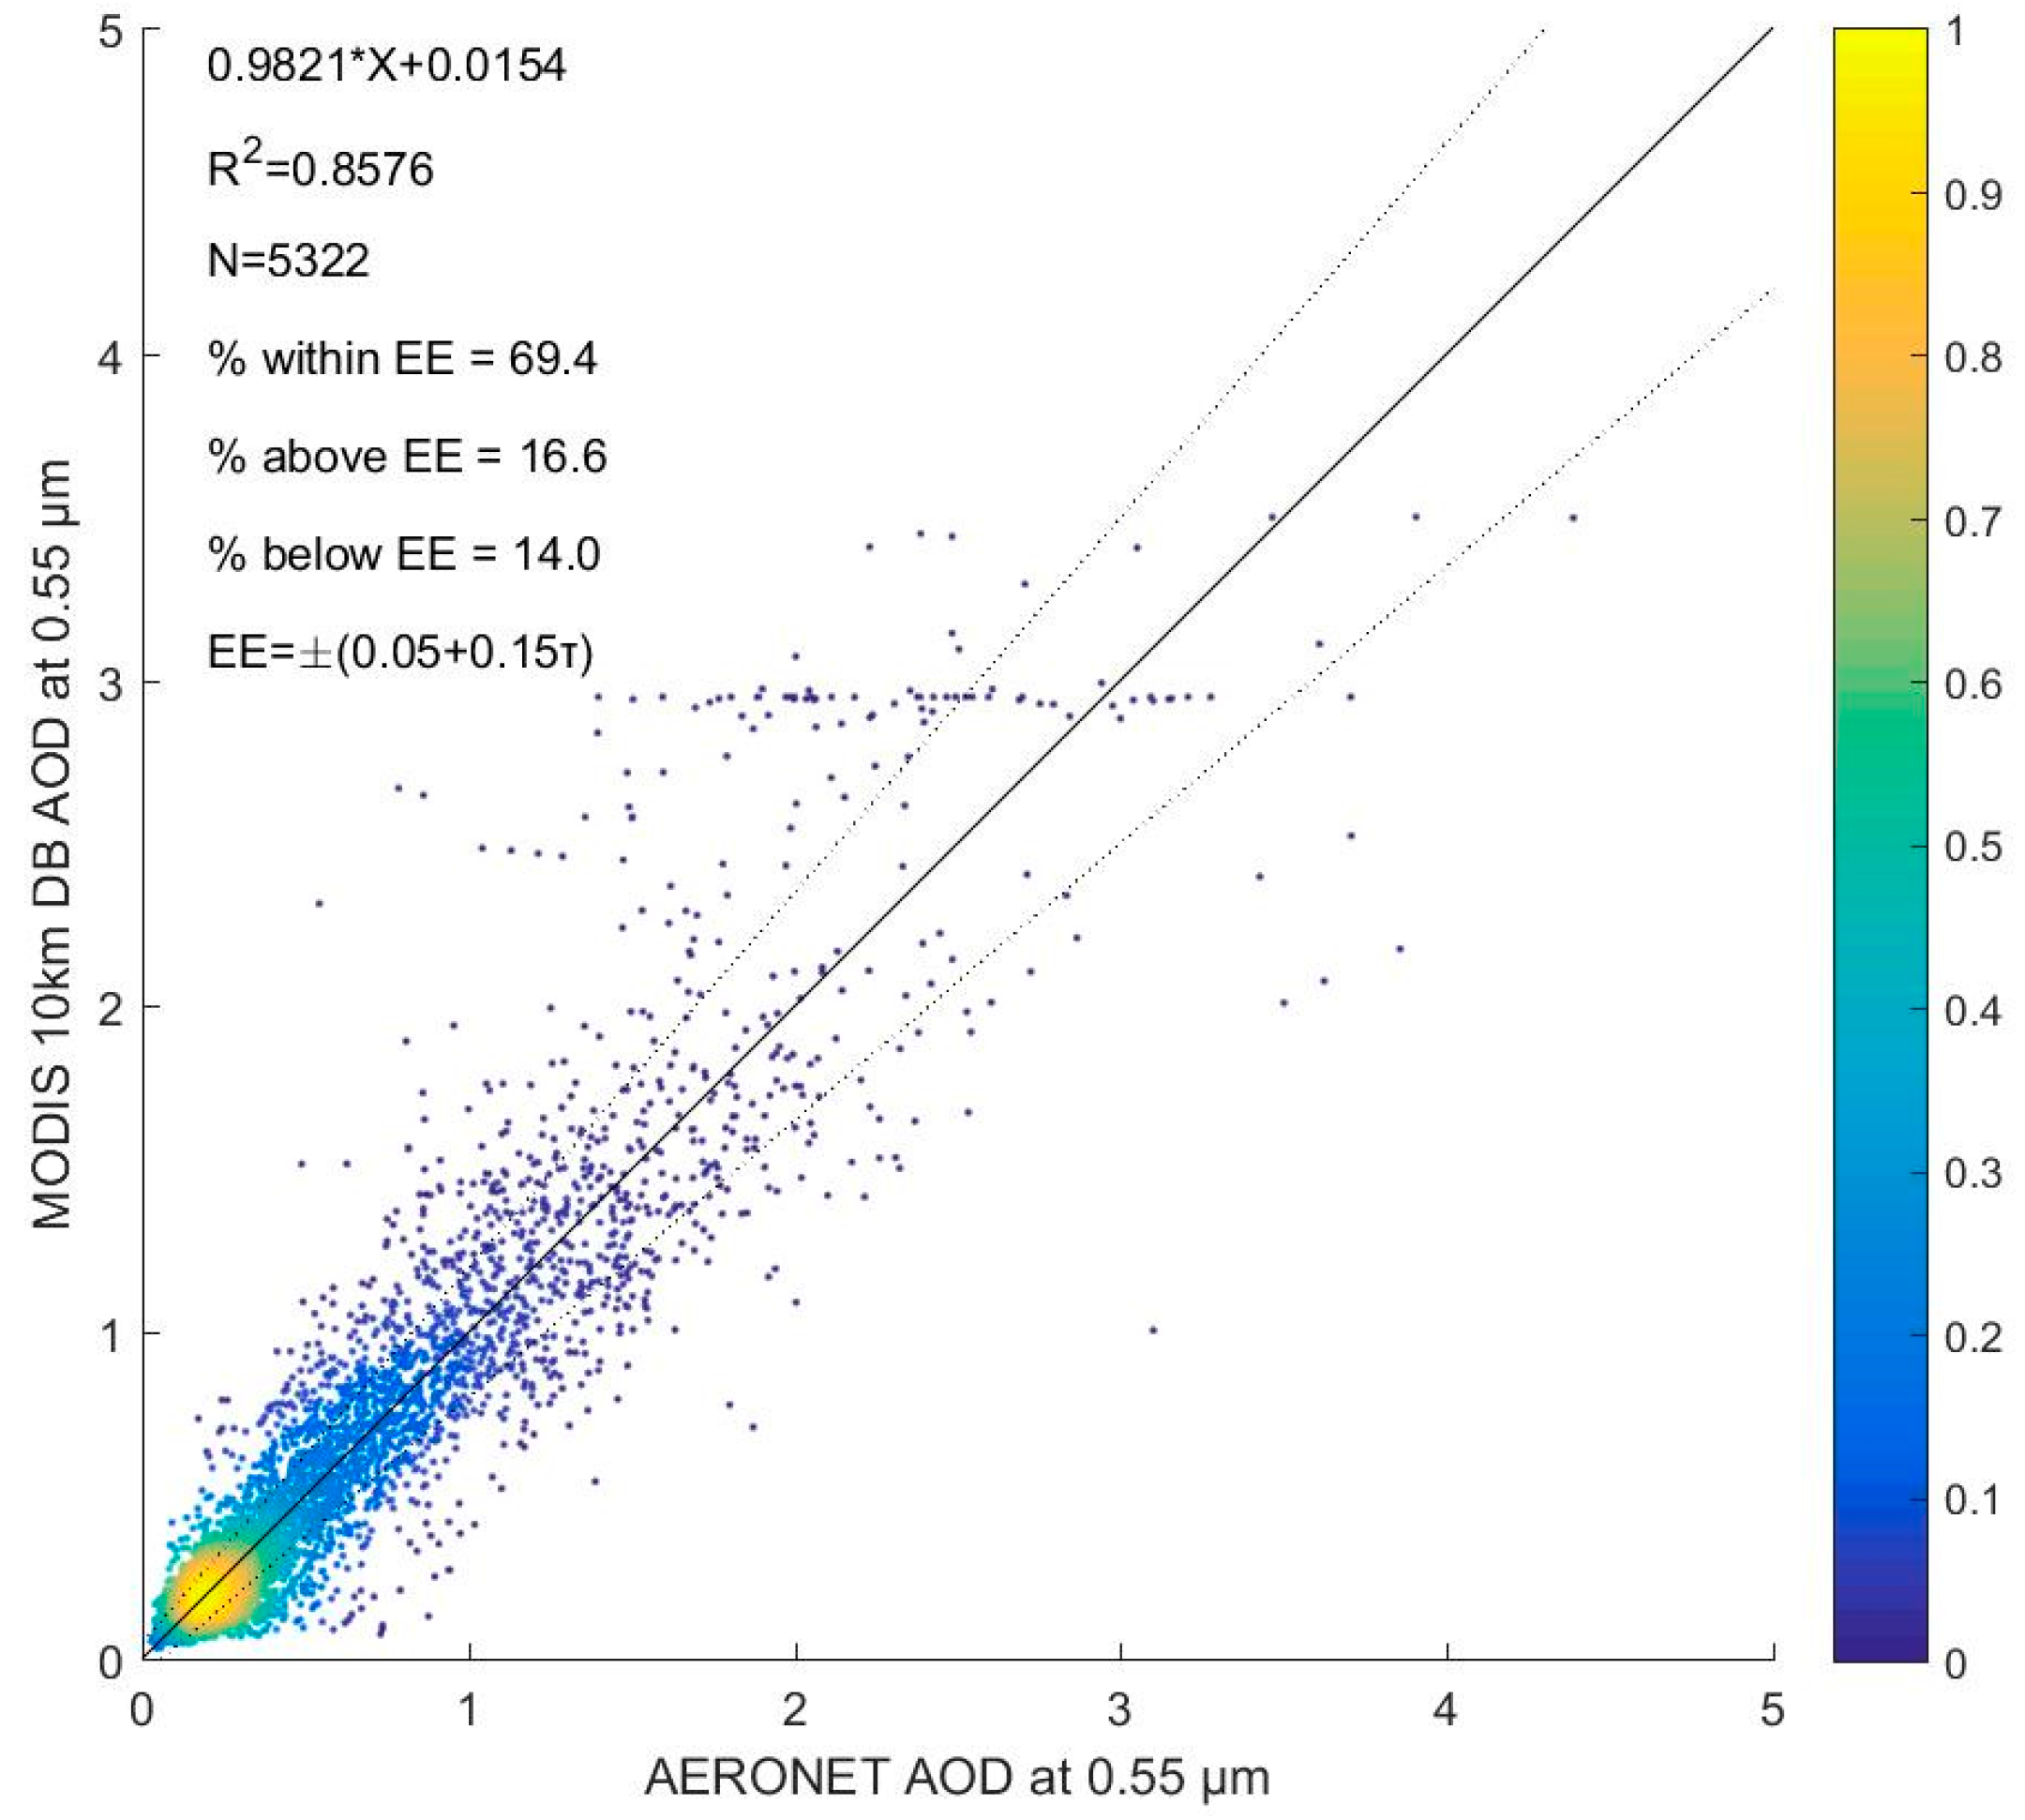
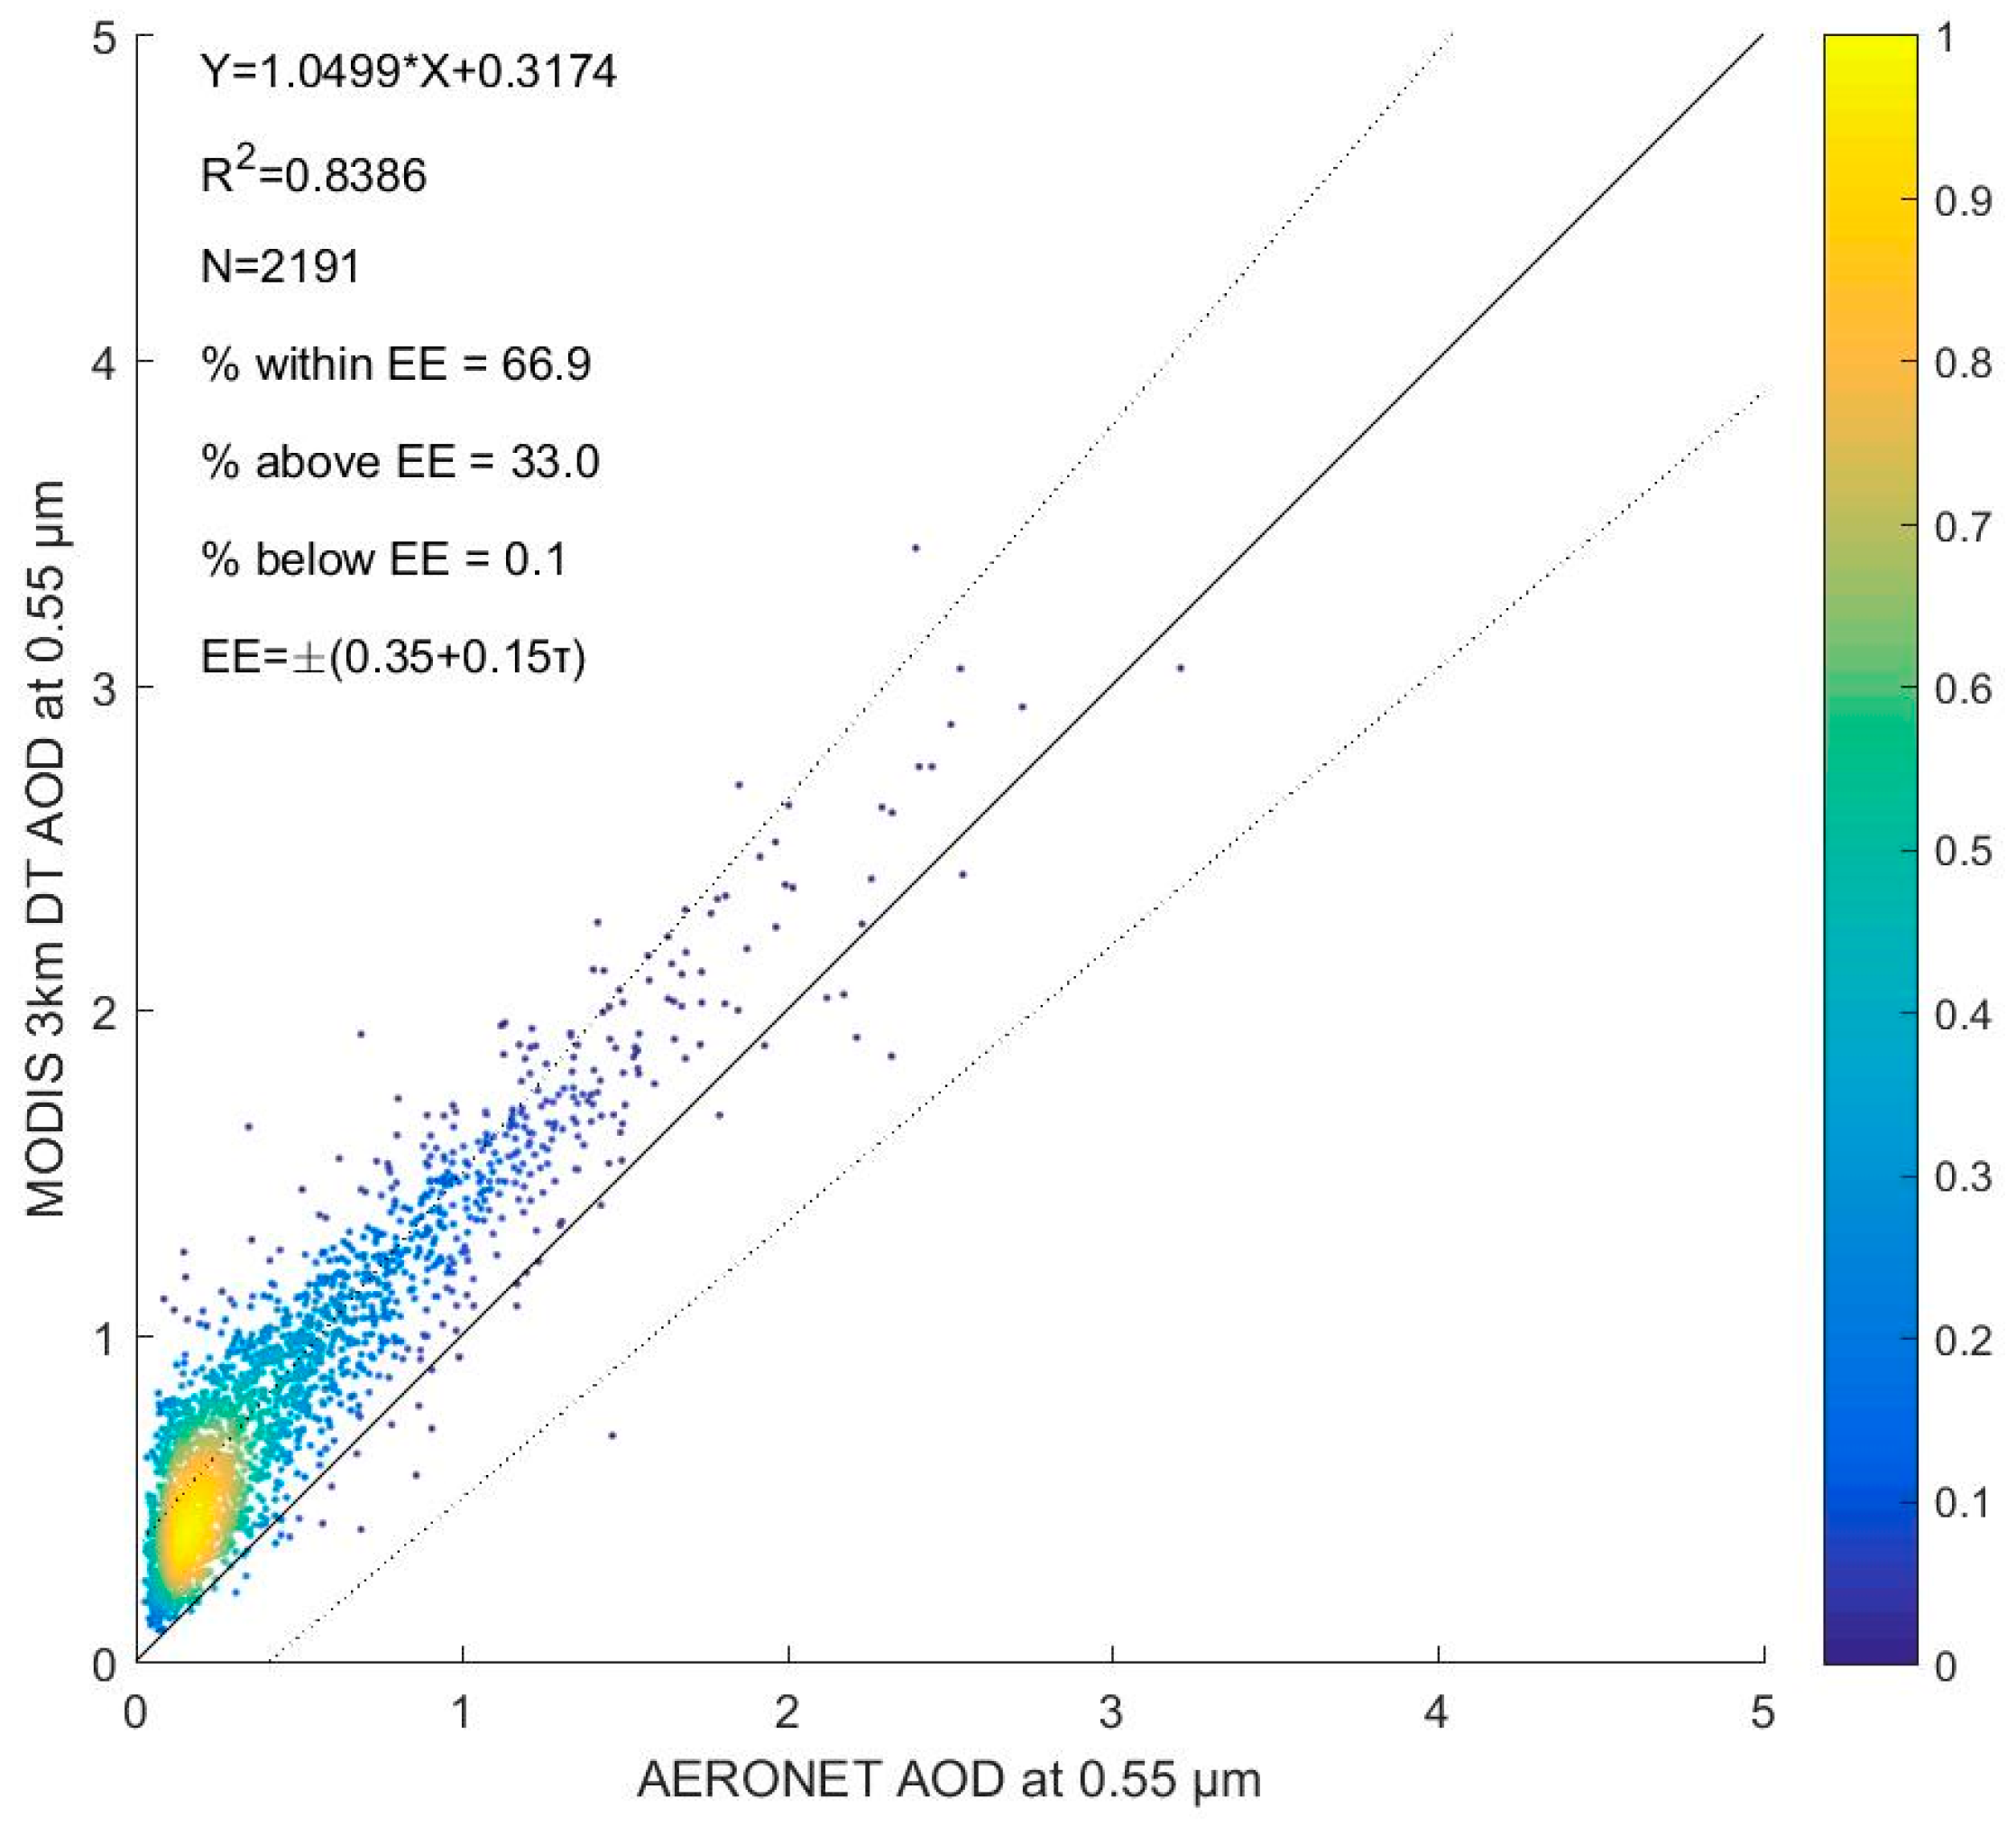
As shown in Figure 2, a total of 3729 pairs of MODIS 10 km DT AOD and AERONET retrievals were obtained for the two stations. Most of the retrieval pairs ranged from 0 to 1.0. A linear relationship between the MODIS 10 km DT AOD and AERONET AOD with a very high determination coefficient (R2 = 0.8106) was found. The expected error (EE, with at least 67% of data falling within the EE) envelope was approximately ±(0.08 + 0.2τ), which is slightly larger than the global average accuracy of the MODIS AOD over land (±(0.05 + 0.15τ)). As shown in Figure 3, a total 5322 pairs of MODIS 10 km DB AOD and AERONET retrievals were collected, as the DB algorithm was developed to overcome the restriction of the DT algorithm only covering densely vegetated areas or water bodies and failing for retrieval over bright surfaces. Although the DB algorithm is relatively less accurate than DT globally; for the three stations in Beijing, the DB AOD in Beijing was relatively highly accurate (±(0.05 + 0.15τ)) [47] and had more successful pairs (N = 5322). The accuracy of the DB AOD was comparable to the global average accuracy of the DT AOD. The 3 km MODIS aerosol products (shown in Figure 4) was designed to provide refined spatial resolution of aerosol retrieval for regional air quality applications [48]. However, in our study, the accuracy of the 3 km MODIS aerosol product was much lower (±(0.35 + 0.15τ)) at Beijing, suggesting that despite a higher spatial resolution, the MODIS 3 km products were less reliable, which is consistent with a previous validation of the Aqua 3 km products over Asia [49]. However, our result was slightly different because we selected a 7.5 × 7.5 km square rather than a 9 × 9 km square. The validation results of the 3 km MODIS AOD suggested that in a heavily-polluted area such as Beijing, the MODIS 3 km AOD was neither highly accurate nor had a wide coverage, and only had a high spatial resolution. Most previous studies have compared AERONET AOD in a range of 0–2.0, and values larger than 2.0 seldom occurred. In this study, we found many retrievals larger than 2.0, with some retrievals as high as approximately 3.5, suggesting that the aerosol load in Beijing is very high.
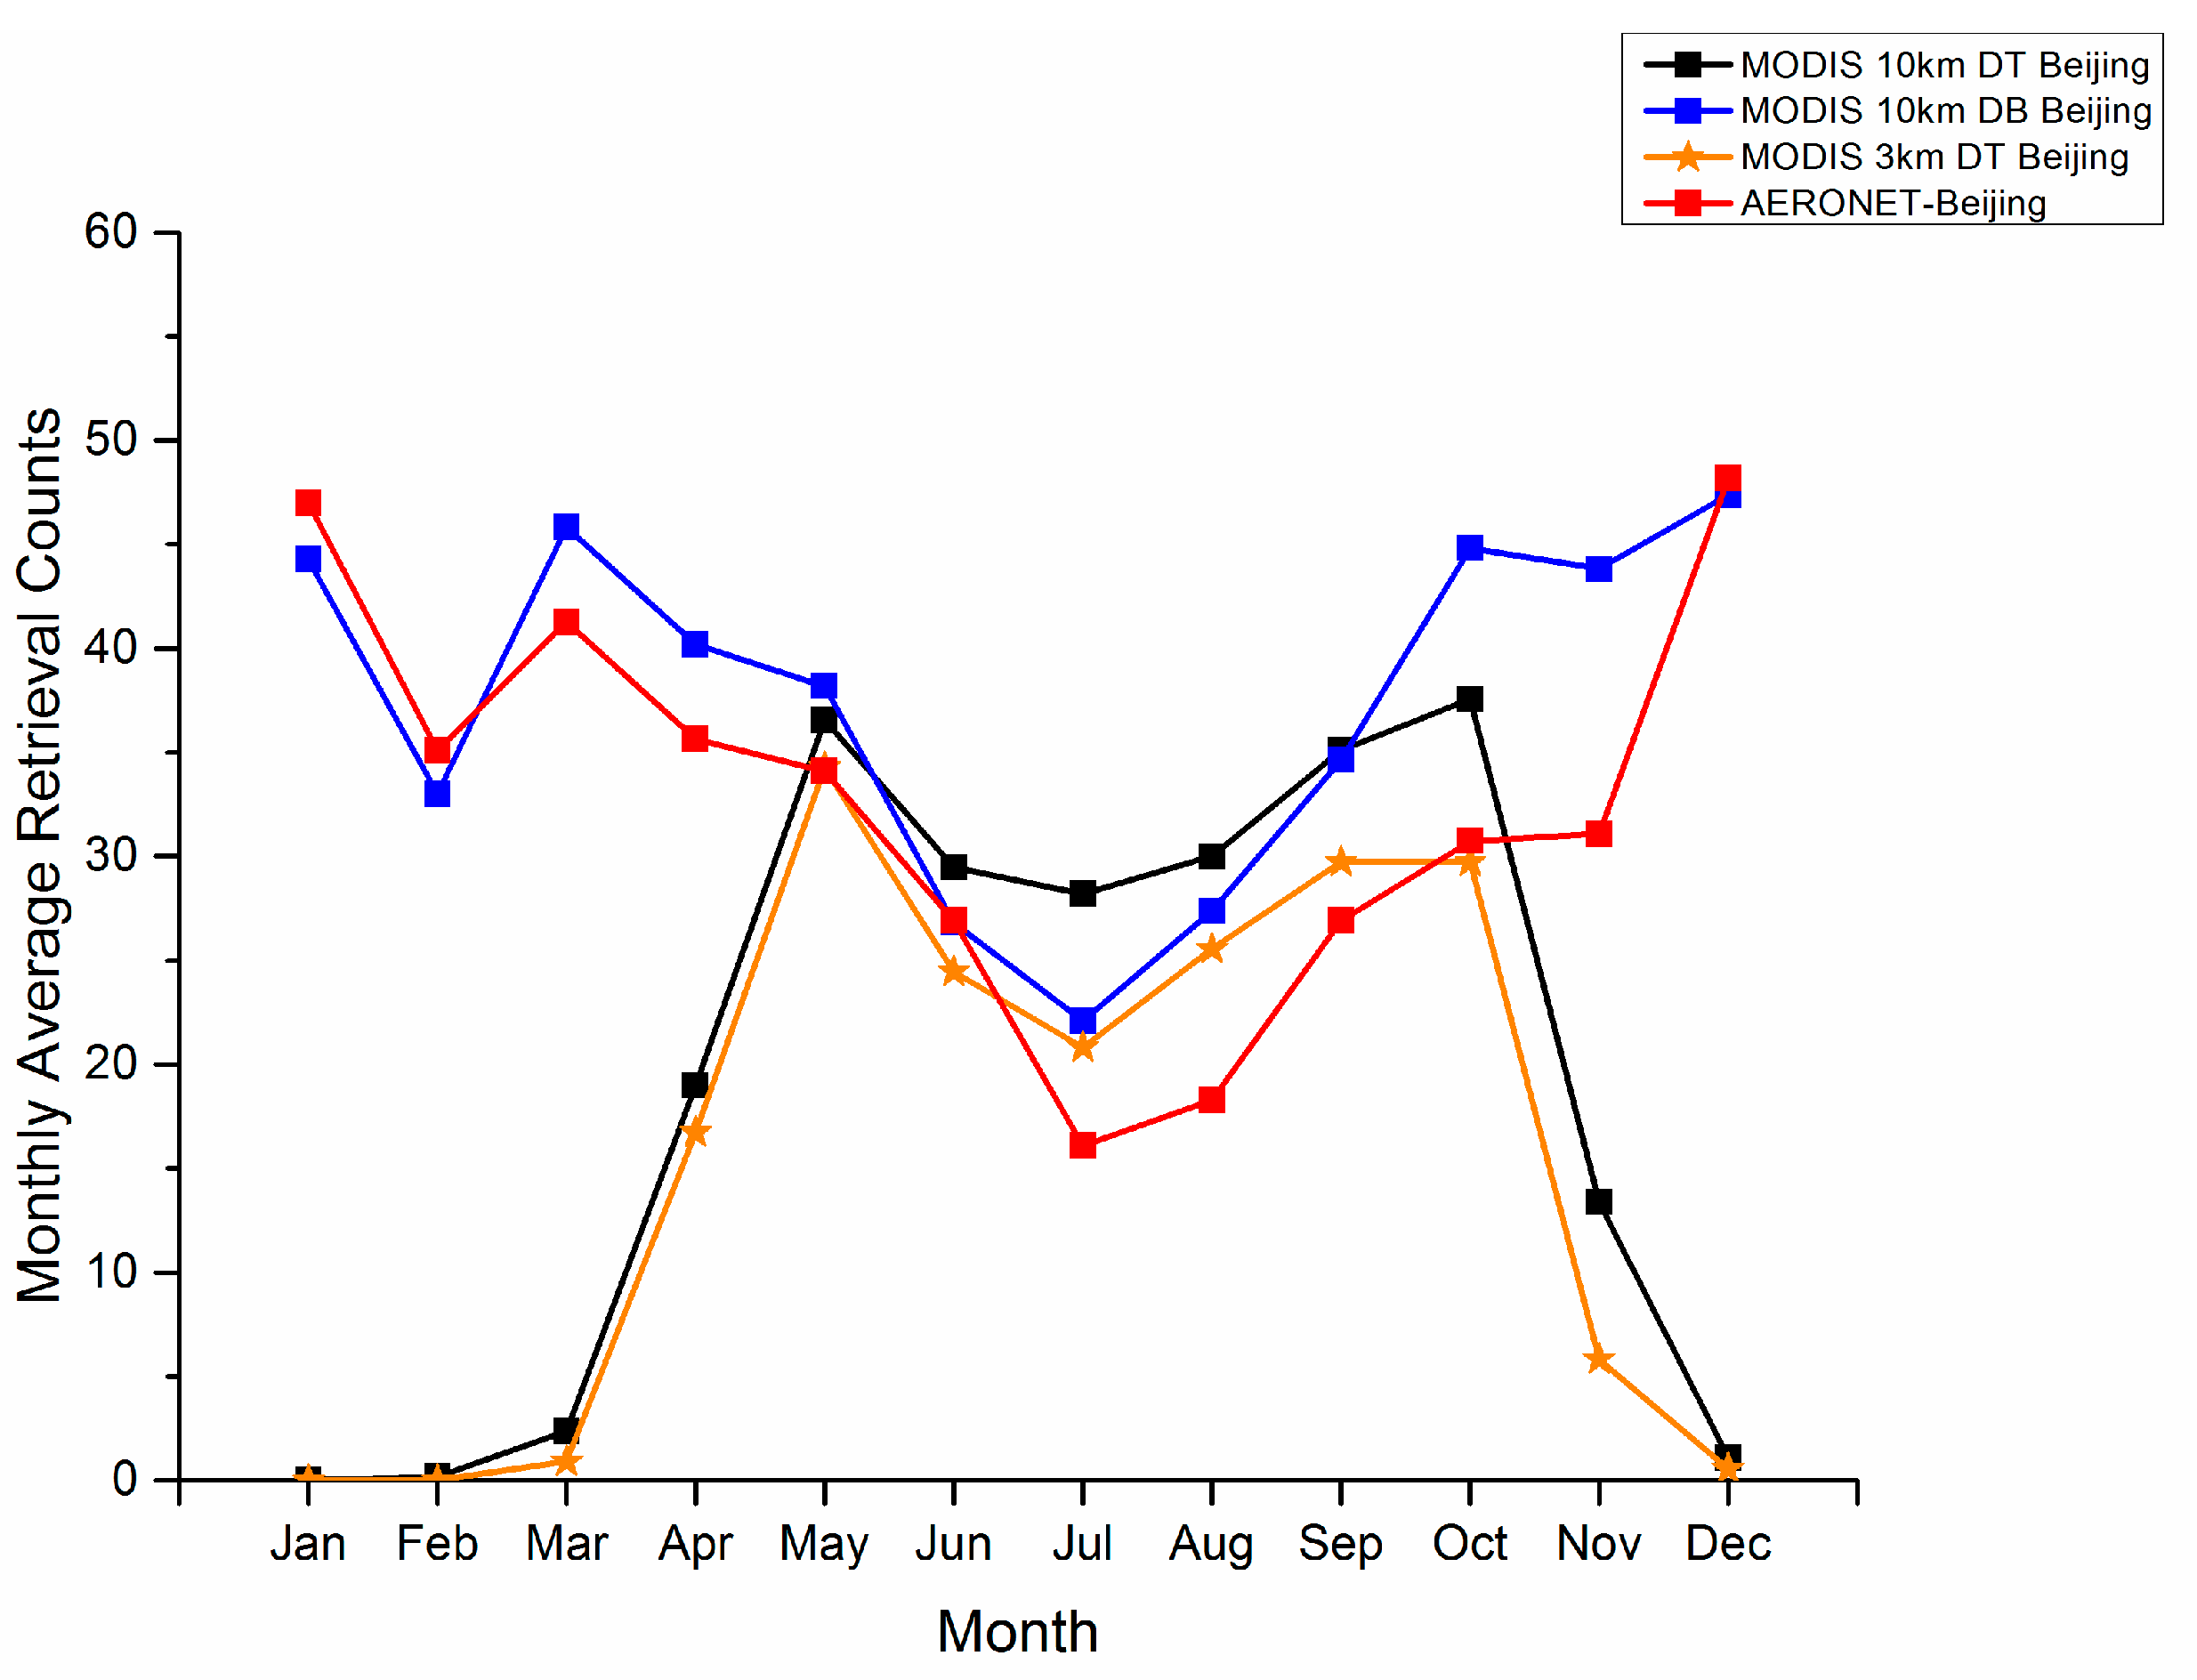
Beijing station began monitoring aerosols in March 2001, and has continuously released data since 2003, while the Beijing-CAMS station started in 2012. We have collected the monthly retrieval counts for MODIS 10 km DT, 10 km DB, 3 km DT, and AERONET retrievals during the MODIS overpass since 2005 at the Beijing stations (Figure 5). Very few successful retrievals were obtained in winter (December, January, and February) from the two DT algorithms (10 km and 3 km), and more retrievals were obtained in the middle of the year (April–October), in the shape of an “M”. However, the successful DB algorithms and AERONET retrievals had an opposite pattern, with the largest values occurring in winter and fewer values in summer. The successful DB and AERONET retrievals were comparable. The fewer successful AERONET retrievals in summer may have been due to the rainy season, while in autumn and winter, less precipitation and fewer clouds allowed more AOD retrievals.
In Beijing, air quality is good in the middle of the year and poor in autumn and winter. Particulate matter (PM2.5 and PM10) is the principal reason for the deterioration of air quality in Beijing. Although the MODIS 3 km DT products were developed for the applications by the air quality community, the low number of successful retrievals in winter in a heavily polluted region such as Beijing, restricts its effective application. Therefore, in this study we analyzed the retrievals of various MODIS AOD products and AERONET AOD retrievals under different air quality conditions to estimate the performance of different MODIS AOD products.
4.2. Retrieval Statistics under Different Air Quality Situations
Beijing began to publish real-time air quality data—including PM2.5—at one hour intervals on its official website in January 2013, providing a powerful data source for atmospheric pollution research. Two stations (West Park Official and Olympic Sports Center stations) out of the 35 air quality monitoring stations are very close to two AERONET stations (the Beijing and Beijing-CAMS stations). The successful retrieval counts of the MODIS 3 km DT, 10 km DT, 10 km DB, and AERONET during different PM2.5 concentrations were obtained for the West Park Official–Beijing-CAMS and Olympic Sports Center–Beijing station pairs. In total, 2028 and 1920 successful PM2.5 concentration data pairs were collected during the overpass of the twin MODIS sensors for the Beijing-CAMS station and the Beijing station, respectively. For the Beijing-CAMS station, 1203 PM2.5 data indicated less than 75 µg/m3 (unpolluted), 479 PM2.5 data indicated a range of 75–150 µg/m3 (moderately polluted), and 346 PM2.5 data were larger than 150 µg/m3 (heavily polluted). The average PM2.5 concentration was 82.1 µg/m3. For the Beijing station, the corresponding values were 1151 (unpolluted), 455 (moderately polluted), and 314 (heavily polluted), with an average PM2.5 concentration of 78.9 µg/m3. It should be mentioned that the average PM2.5 concentration only considered data collected during the MODIS fly-over time, which was different from the actual annual average. Additionally, the West Park Official station data started in January 2013, while the Olympic Sports Center station started in March 2013. Histograms of the retrievals from the different MODIS products, AERONET retrievals, and total PM2.5 data are shown in Figure 6. The PM2.5 data had the largest effective number of retrievals due to the automatic PM2.5 monitoring and was affected by weather conditions, while AOD retrievals were restricted to cloud-free conditions. For both stations, the MODIS 10 km DB products had the largest number of successful retrievals, followed by the AERONET retrievals, retrievals of the MODIS 10 km DT products, and retrievals of the MODIS 3 km DT products. The number of successful MODIS 10 km DB products was even greater than the AERONET retrievals. Furthermore, when the PM2.5 concentration increased to more than 150 µg/m3 (heavily polluted), very few successful retrievals resulted from the MODIS 3 km DT products, but a considerable number resulted from the MODIS 10 km DB products and AERONET. In this study, we categorized air qualities into three levels: unpolluted, moderately polluted, and heavily polluted, as described in Section 2 and summarized the air quality situations regarding effective MODIS or AERONET retrievals as shown in Table 1. By simply analyzing the PM2.5 monitoring data during the overpass of MODIS, approximately 17% of these data were from heavily polluted times, 23% from moderately polluted times, and 60% from unpolluted times, which suggests that the air quality in Beijing was polluted 40% of the time. When considering rainy or cloudy conditions, the number of aerosol retrievals was less than the PM2.5 monitoring data. The results in Table 1 showed that three MODIS AOD products and AERONET retrievals all have comparable successful retrieval percentages on moderately polluted days (75 µg/m3 < PM2.5 concentration ≤ 150 µg/m3) of approximately 20%, which was slightly less than the 23% directly derived from the PM2.5 monitoring data. All four AOD products had far lower successful retrieval rates during heavily polluted days than the actual situation. For the MODIS 3 km DT AOD, only 3–4% of the successful retrievals occurred during heavily polluted conditions, and for the MODIS 10 km DT AOD, the rate was approximately 6.5%—far less than the 17% demonstrated by the monitoring data. The successful retrieval rate on heavily polluted days for the MODIS 10 km DB AOD was slightly less than 10%. The successful retrieval rates on heavily polluted days for the two AERONET stations were very different: 11.9% from Beijing station, and 3.1% from the Beijing-CAMS station. These results suggest that when considering air quality in Beijing, the MODIS 3 km DT products may not be able to reflect the actual air quality when the air is moderately or heavily polluted. Although developed for air quality monitoring, the MODIS 3 km DT products may be unsuitable for air quality remote sensing retrieval due their low success rate.
5. Discussion
Satellite-based remote sensing techniques are powerful tools for monitoring aerosol properties and distribution, of which MODIS aerosol products have been widely used during the past decade due to their ability to provide continuous monitoring with relatively high accuracy [50,51]. The major method of validating MODIS data is through surface-deployed sun-photometers [52,53,54]. MODIS C5.1 aerosol products (mainly the 10 km DT product) have already been validated over China. The inter-comparison of MODIS, MISR, and GOCART (Goddard Global Ozone Chemistry Aerosol Radiation and Transport) aerosol products over Beijing from 2001 to 2010 suggested that only 40.95% of MODIS C5.1 retrievals fell within the EE envelope, while the corresponding values of MISR and GOCART were 70.90% and 32.40%, respectively [55]. However, the validation results may vary from place to place. The validation over Beijing and Xianghe (a small county near Beijing) show that MISR retrievals in Beijing were higher, but lower in Xianghe than MODIS retrievals when considering the correlation coefficients and root-mean-square errors [56]. The validations of MODIS C5.1 all demonstrated that the accuracy of MODIS AOD in China was lower than the global average accuracy of MODIS products. The validation of MODIS C5.1 also showed that MODIS had poor performance in extreme aerosol conditions—especially under dust events or heavy haze [57]. Since the release of MODIS C6 aerosol products, validation and evaluation of these products have been conducted. The validation of 3 km DT MODIS/Aqua data in 18 Asia AERONET stations suggested that only 55% of MODIS retrievals fell within the nominal EE (0.05 + 0.15τ) of the 3 km DT product. For Beijing, only 6.5% of MODIS retrievals fell within the nominal EE, suggesting that the 3 km DT product was less reliable than the 10 km DT product [49]. Furthermore, another validation work in Northern China from 2013 to 2015 suggested that only 53% of the 3 km DT AODS and 66% of the 10 km DT AODS were within the error range [51]. The overall evaluation of both MODIS DT and DB products showed that DT results tended to overestimate the aerosol loading over Northern China, while the DB product exhibited better performance [58]. The results given in Figure 2, Figure 3 and Figure 4 showed that the 10 km DB AODs had the highest accuracy (±(0.05 + 0.15τ)) of the three types of MODIS AOD products, while the 3 km DT AOD had the lowest accuracy (±(0.35 + 0.15τ)) in Beijing. The result may be surprising, but it is realistic and suggests that the DB AODs may be more accurate when the air quality is relatively poor, or for urban situations. One suggestion to overcome this problem is to identify a “clearest” day in a certain temporal window to obtain the surface reflectance and retrieve AOD during this temporal window [59].
The update from C5.1 to C6 products brought many improvements to the MODIS aerosol products: the DB algorithm was enhanced to cover more land regions with a higher accuracy, and a 3 km DT product was developed for air quality applications. Validation of the 10 km C6 DB product suggested the number within nominal EE (0.05 + 0.15τ) has increased from 56% to 76% in Beijing when compared with the C5.1 DB product [60]. Two years of validation for the C5.1 and C6 products over Beijing from 2012 to 2013 showed that the accuracy of the 10 km DB and 10 km DT have improved from 46% to 80% and 10% to 18%, respectively [61]. Furthermore, the new C6 DB product was expanded to cover regions like Northern China [62]. The validation of both C5.1 and C6 AOD in Pakistan over AERONET suggested that MODIS C6 DT AOD had significantly improved, but the DB products retained similar accuracies [63]. While the validation of MODIS data over a mountain sun–sky radiometer site suggested that DT products had a high accuracy, with more than 70% of retrievals falling within the nominal EE [52]. C6 AODs were systematically higher than C5.1 AODs over the Mediterranean ocean regions [64]. Despite these improvements, the performance of the C6 products over heavily polluted regions has yet to be deeply investigated. Three questions are germane: first, which dataset is more accurate in a frequently polluted region such as Beijing; second, which data can be more effectively retrieved at different particulate matter concentration conditions; and third, which dataset is more useful for air quality applications. For air quality monitoring applications with aerosol products on a large scale, sufficient successful retrievals must be made for different air quality situations. If one AOD algorithm cannot obtain enough successful retrievals on heavily polluted days, the satellite-retrieved PM2.5 concentrations may be biased and underestimate the actual situation.
Most validations of MODIS AOD are primarily focused on relatively low aerosol loads (e.g., an AOD of less than 2.0). These results may not be biased for an area such as Western Europe or North America, where air qualities are good. For example, the number of successful retrievals of 3 km DT was far more than those of 10 km DT and 10 km DB over Atlanta, USA [65]. In China, however—especially Northern China, which has frequent haze-fog events when PM2.5 concentrations are very high—most satellite-based aerosol retrieval schemes have difficulties in separating the surface and atmospheric contribution. Despite these shortcomings, the MODIS products have been widely used for monitoring particulate matter in Northern China using various algorithms that take surface particulate matter monitoring data, meteorological data, and satellite data into account [66]. To cover more regions, the DB products are also included in some studies as supplementary data, as the DT algorithm—despite its claims of high accuracy—has relatively low spatial coverage for urban areas with a large population [67].
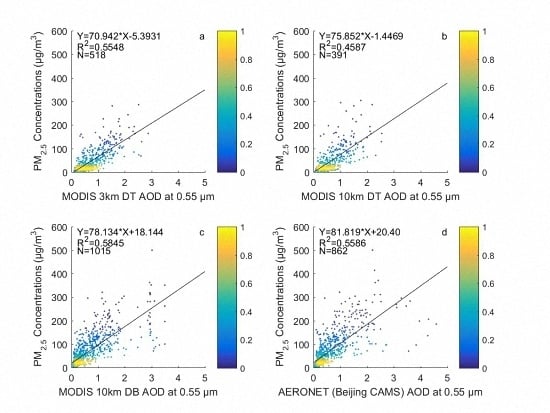
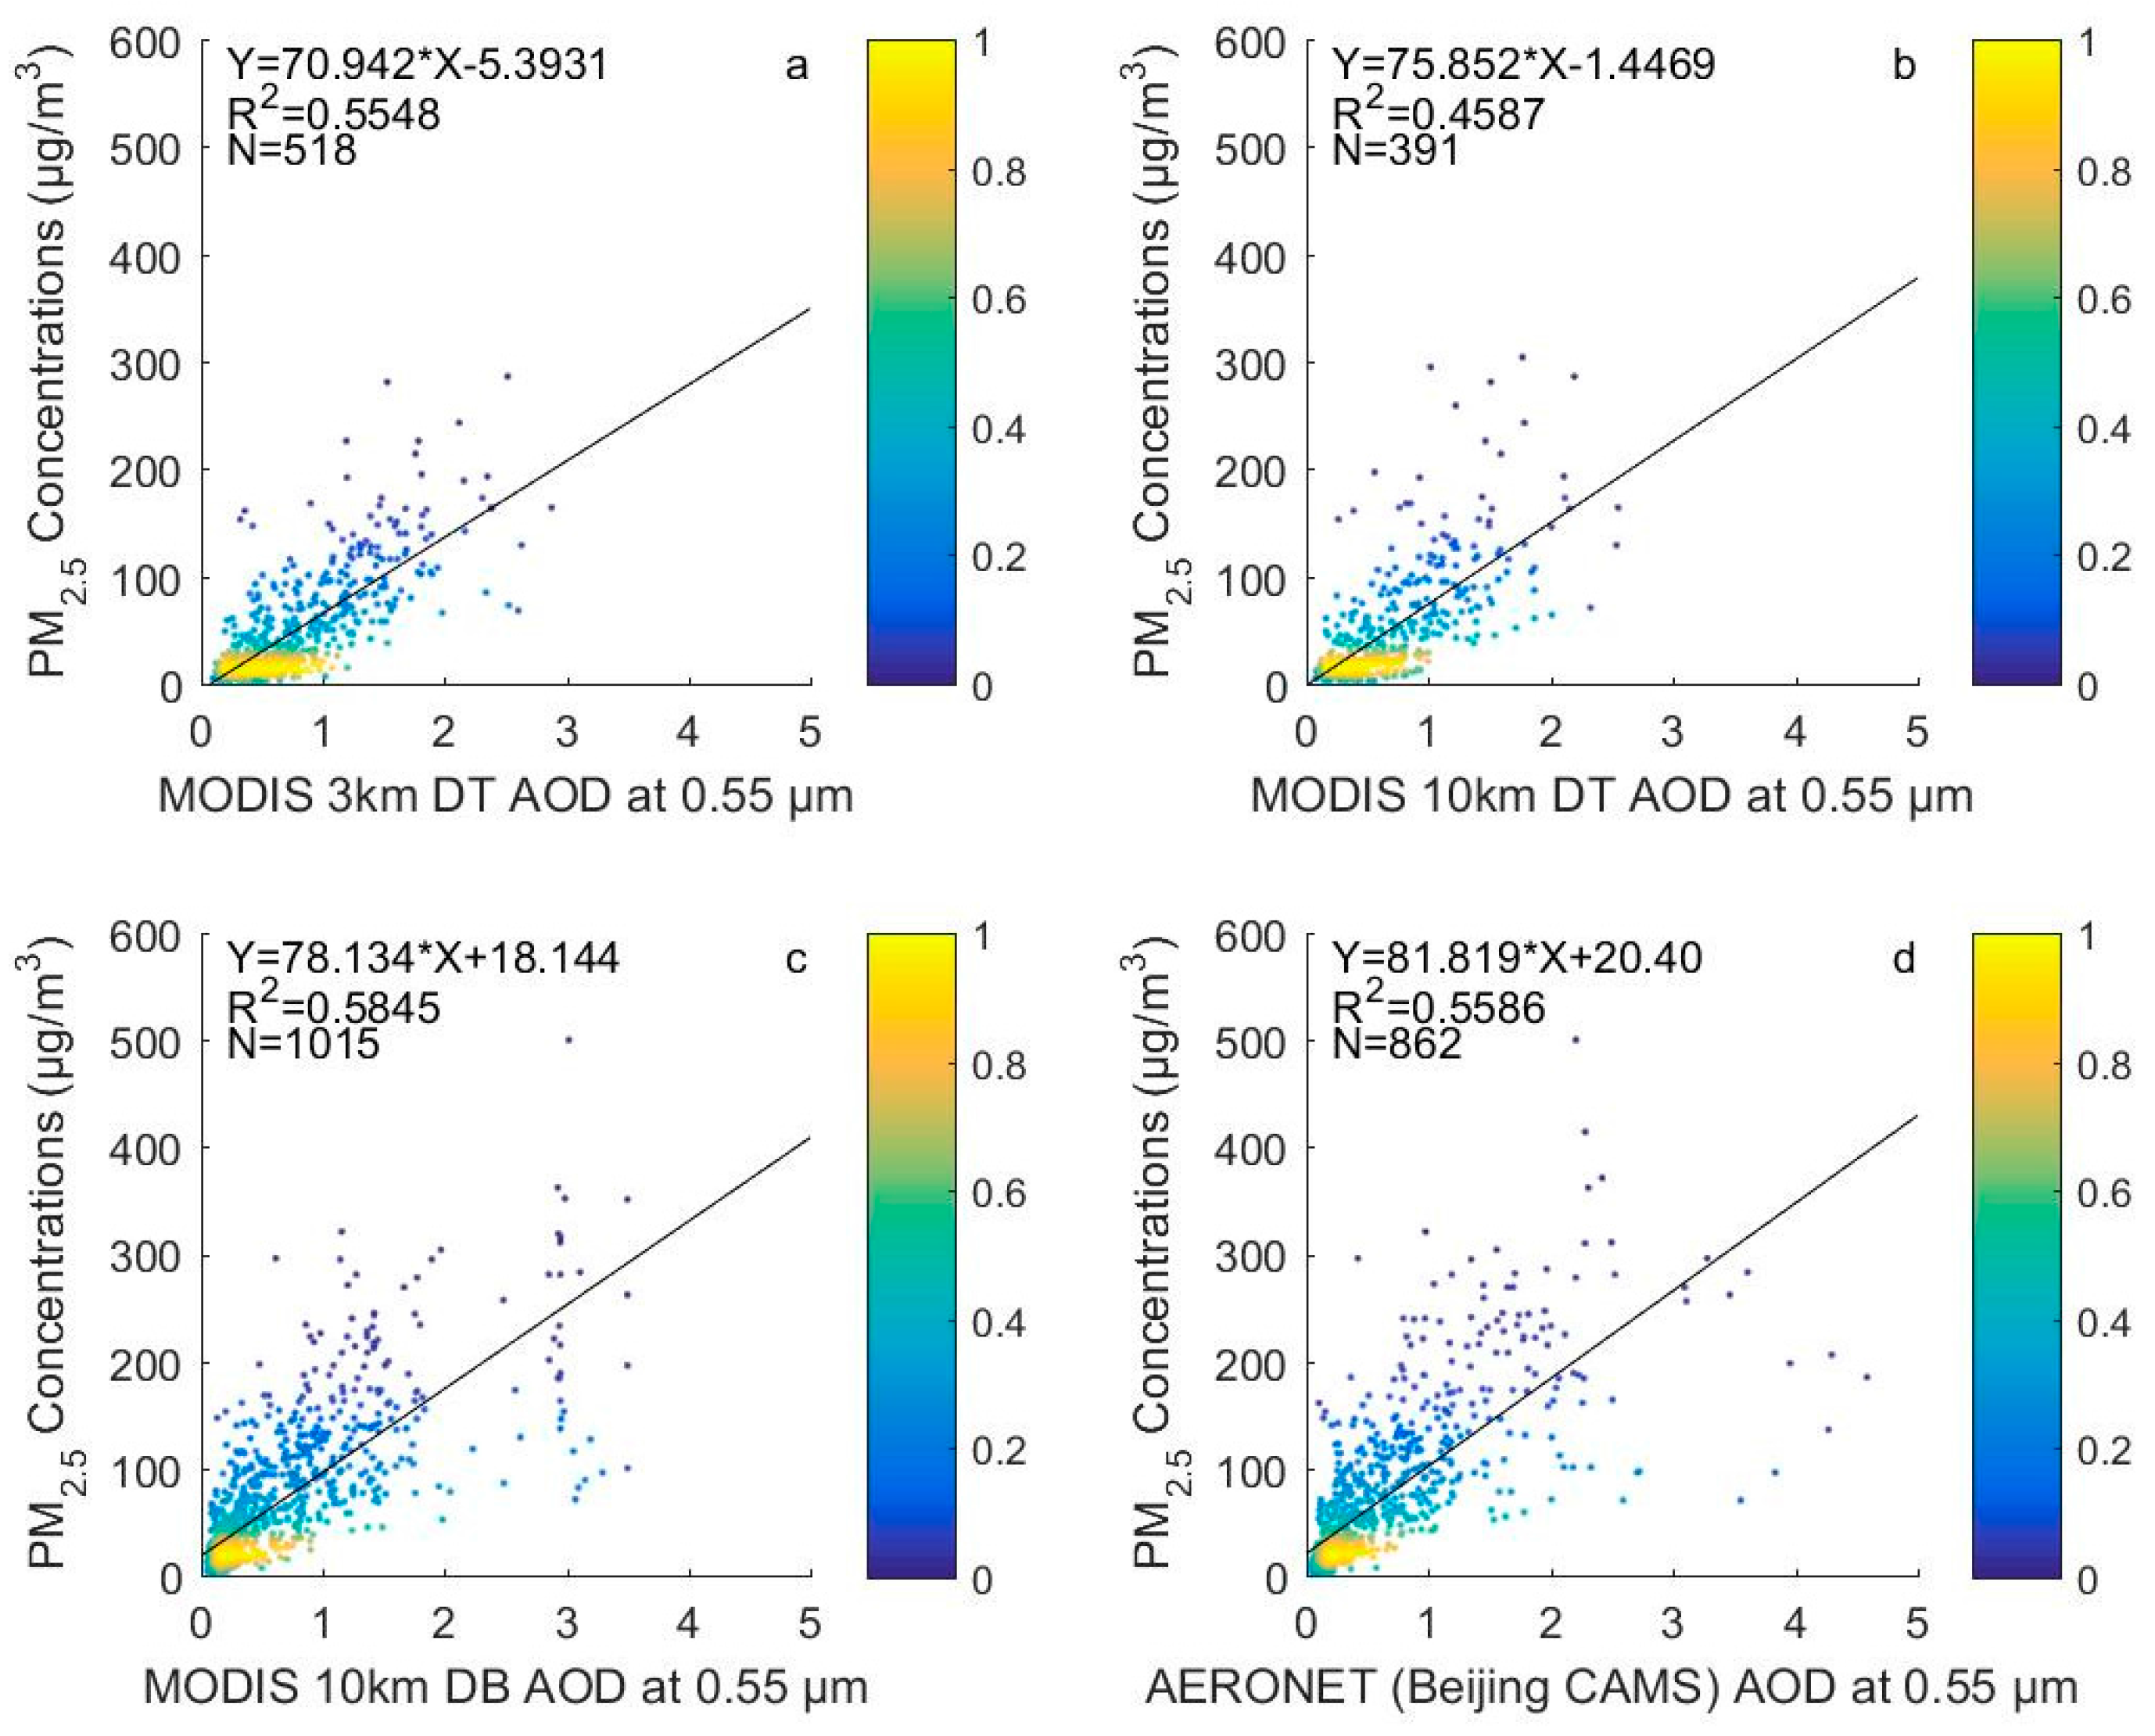
The results in Figure 6 and Table 1 show that the least number of MODIS 3 km DT AODs was retrieved on heavily polluted days, while the largest number was retrieved with the MODIS 10 km DB AODs. For the Beijing station (Figure 6a), most PM2.5 monitoring values (1346 of a total 1920 monitoring values) during the overpass of MODIS were less than 100 µg/m3. The monitoring counts gradually reduced as the PM2.5 concentrations increased. There were only 168 PM2.5 monitoring values greater than 200 µg/m3. For the 3 km DT AODs, 444 effective values were obtained when PM2.5 concentrations were less than 100 µg/m3, only six retrievals were obtained when PM2.5 concentrations were greater than 200 µg/m3, and no retrievals were obtained when PM2.5 concentrations were greater than 300 µg/m3. This result suggested that the satellite retrieval of PM2.5 from MODIS 3 km DT AOD may not be able to gain sufficiently high PM2.5 results [68]. Meanwhile, for the 10 km DB (DT) products, the corresponding numbers were 804 (480), 46 (11), and 9 (1). In the Beijing-CAMS station, only 37 PM2.5 values (in total 2028 effective PM2.5 monitoring data were obtained) greater than 300 µg/m3, and 1408 PM2.5 values less than 100 µg/m3 were observed. For the 3 km DT AODs, 393 effective values were obtained when PM2.5 concentrations were less than 100 µg/m3, and only eight values were greater than 200 µg/m3. None of the effective 3 km DT AODs were retrieved when PM2.5 concentrations were larger than 300 µg/m3. Only the 10 km DB product in the Beijing-CAMS station could obtain effective retrievals when PM2.5 concentrations were greater than 300 µg/m3. Therefore, some studies have utilized the DB product to retrieve surface PM2.5 concentrations. Nevertheless, these results demonstrate that all MODIS AOD products have a relatively low successful retrieval ratio on heavily polluted days, suggesting that satellite retrieval of PM2.5 concentration may underestimate the actual situation by failing to obtain sufficient successful retrievals when the air is heavily polluted. The correlation between the AODs and PM2.5 concentrations must be considered along with the number of retrievals and their accuracy against AERONET observations when deciding which dataset is more useful for air quality applications. Figure 7 and Figure 8 show the correlations between the PM2.5 concentrations during a MODIS fly-over and different AOD products for the Beijing-CAMS and Beijing stations. The MODIS 10 km DB AODs had higher determination coefficients (R2) and number of successful retrievals that correlated with the PM2.5 concentration in both stations. The correlation of the MODIS 3 km DT AODs with the PM2.5 concentrations was in second place, but had the lowest number of retrievals. Although the actual retrieval of the PM2.5 concentration requires more data than the AOD (e.g., pressure and relative humidity), the planetary boundary layer, and so on, the original correlation between the AOD and PM2.5 plays an important role in the final accuracy of the retrieval scheme. Therefore, despite being originally designed for air quality applications, the MODIS 3 km DT AOD did not seem to be accurate enough or have sufficient spatial coverage for air quality monitoring. In contrast, the MODIS 10 km DB AOD had surprisingly high accuracy and spatial coverage for highly polluted areas such as Beijing. The only limitation was that its spatial resolution is 10 km, which may restrict its application for air quality monitoring on a citywide scale.
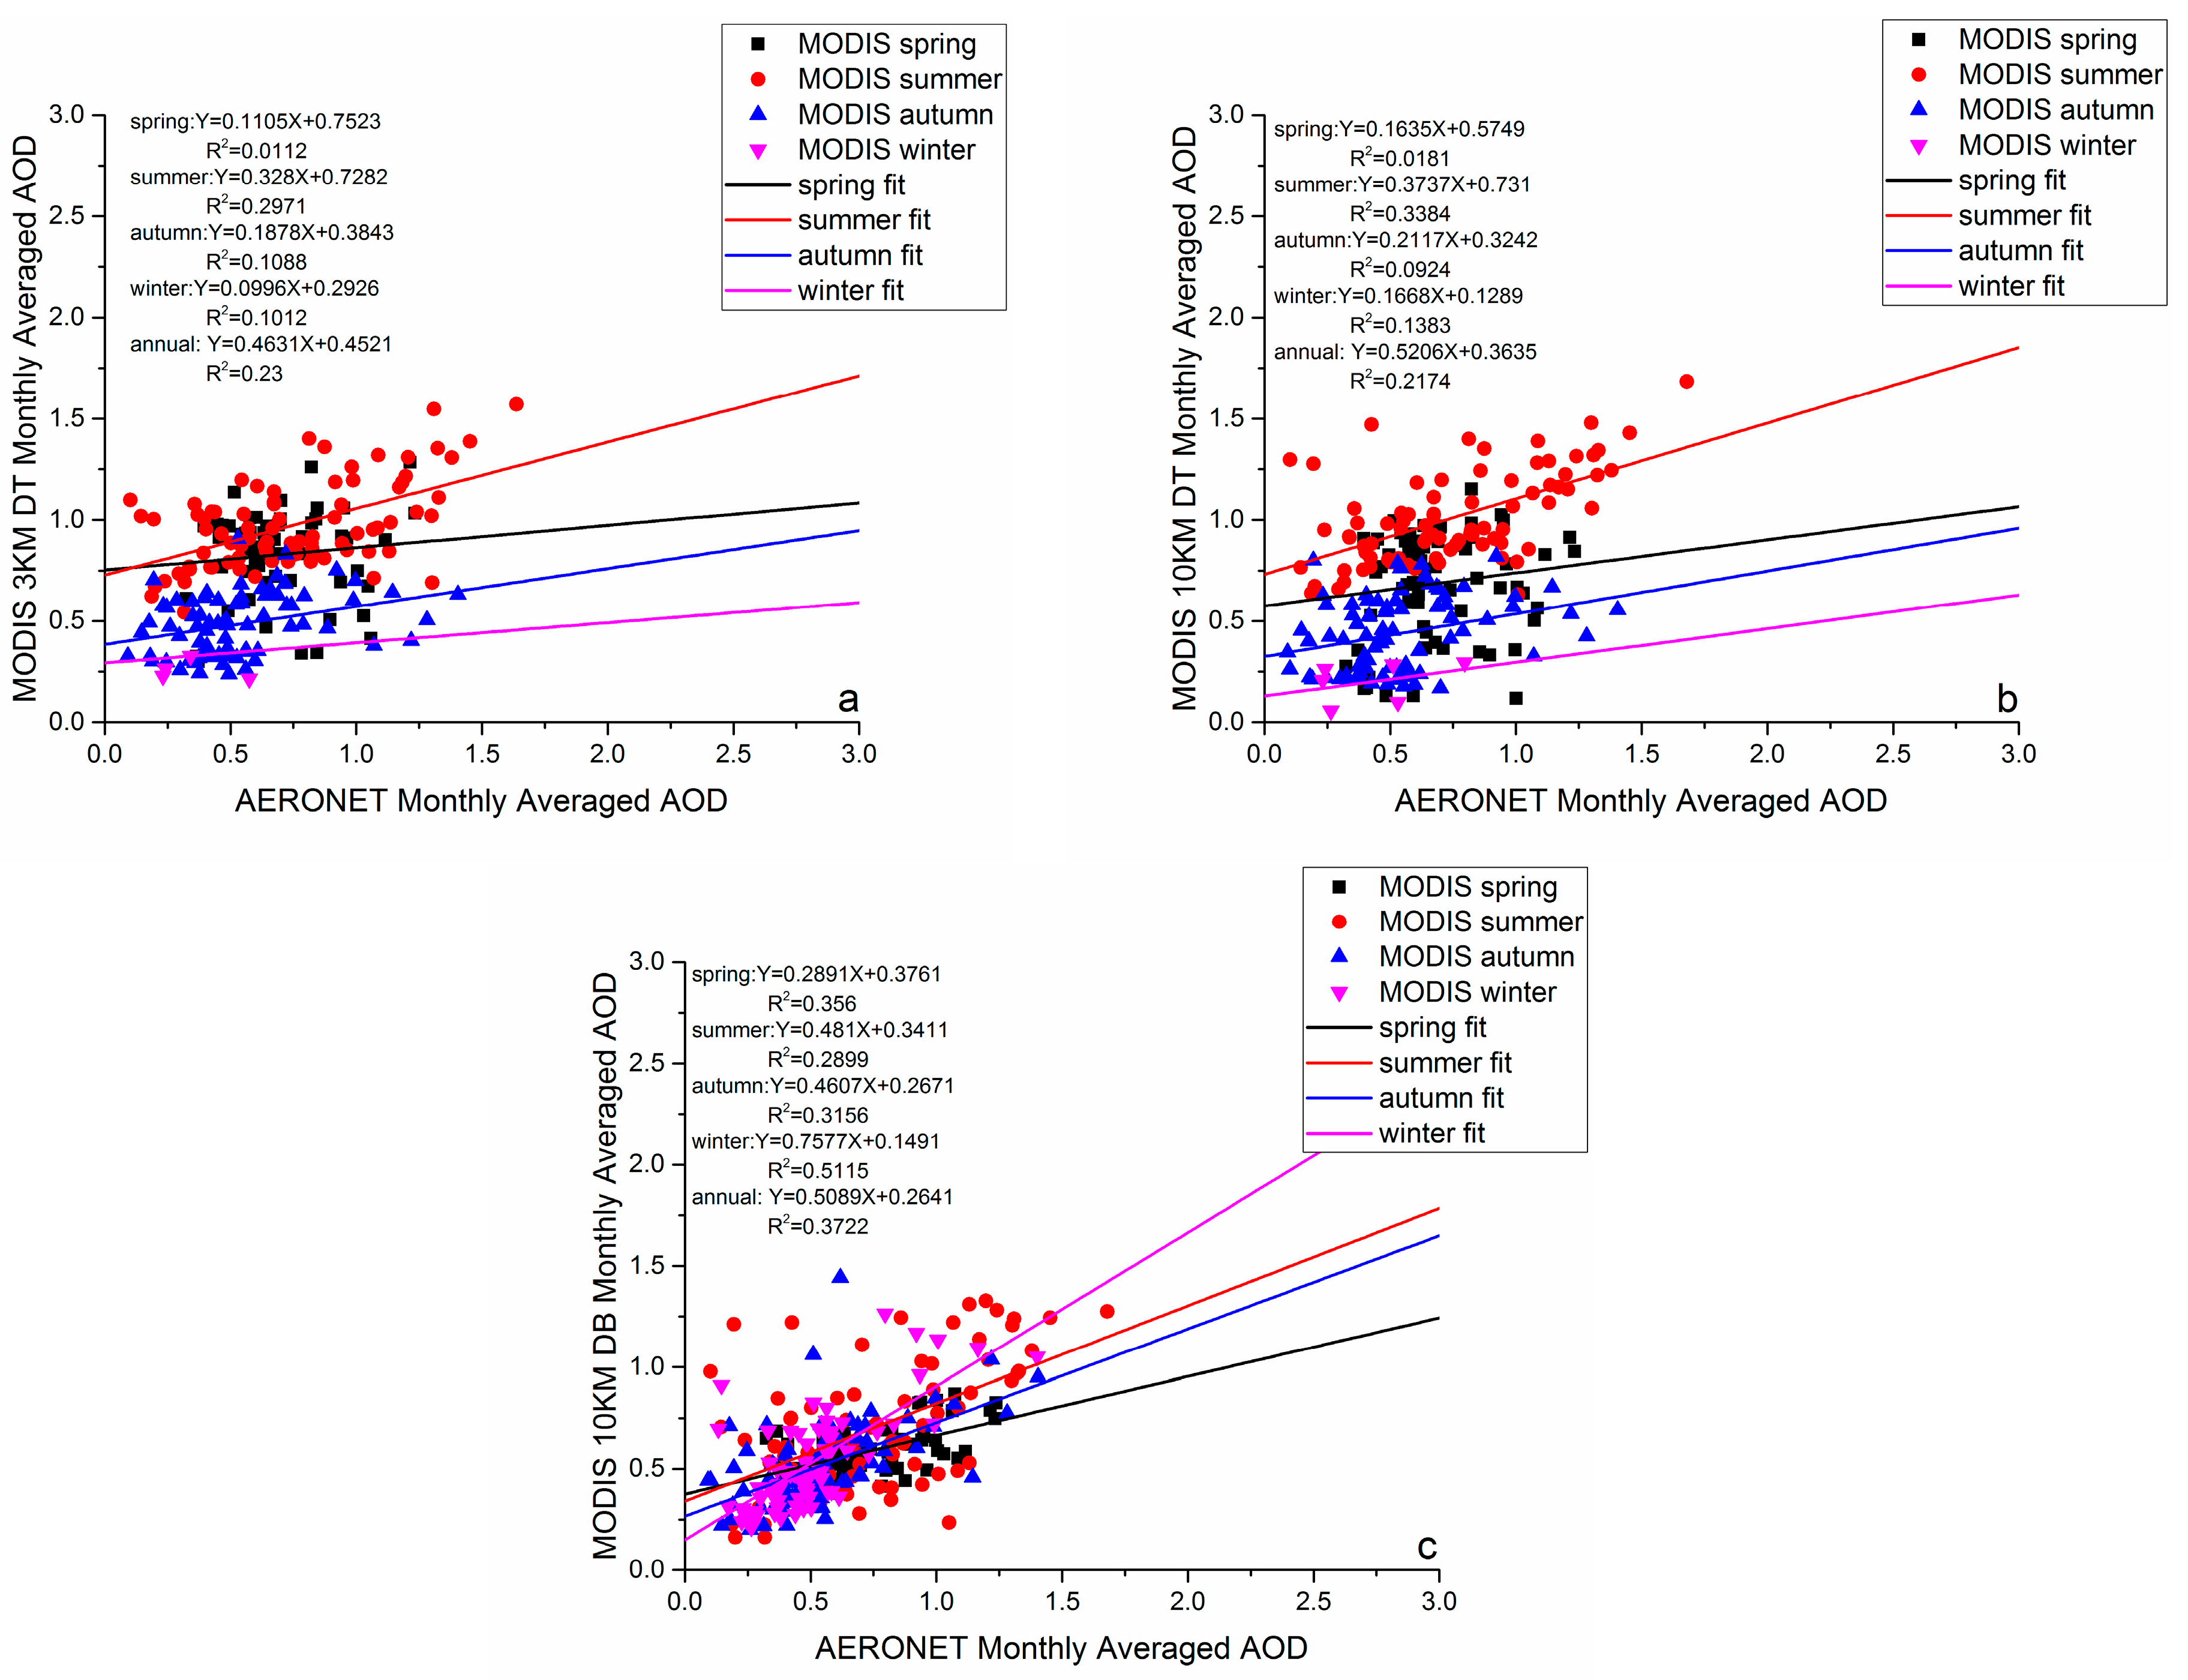
In addition to air quality monitoring, we calculated the monthly average AODs of the MODIS 3 km DT, MODIS 10 km DT, and MODIS 10 km DB, and compared them with the AERONET AODs for the Beijing and Beijing-CAMS stations from 2005. Figure 9 shows these monthly average AODs grouped by seasons. The monthly MODIS 3 km DT AODs had the lowest correlation with the AERONET monthly AODs, while the monthly MODIS 10 km DB AODs had the highest correlation. For the two DT products, the winter and spring seasons had the smallest number of successful retrievals and the lowest correlation with the AERONET retrievals. For the DB product, the difference between different seasons was as large as those of the two DT products. Furthermore, the correlation between the AERONET and MODIS products was not high, suggesting that a large difference existed between the satellite-retrieved AODs and the sun-photometer retrievals. Beijing is seriously affected by particulate matter, especially during the autumn and winter months [69], meaning that the satellite retrieval of PM2.5 concentrations in autumn and winter was more important than those in summer. However, the newly released 3 km MODIS DT products did not have enough retrievals during the heavily polluted seasons, making it unsuitable to efficiently evaluate the air quality in Beijing.
6. Conclusions
The air quality in Beijing varied greatly with PM2.5 concentrations ranging from 5.5 to 475.0 µg/m3, and over 40% of days had PM2.5 concentrations larger than 75 µg/m3. As the capital of China, station-based monitoring and satellite retrieval of PM2.5 concentrations have attracted much attention. Among various other satellite aerosol products, the MODIS aerosol products have been widely used to retrieve surface PM2.5 concentrations. The newly released MODIS C6 AOD products have improved the algorithms for the 10 km DT and 10 km DB products, and included a new 3 km DT product with a finer spatial resolution for the air quality community. One challenge in the satellite retrieval of PM2.5 concentration is to get sufficient samples when the real atmospheric environment has high PM2.5 concentrations. However, satellites often fail to obtain successful AOD retrievals when the aerosol loading is too high, or when surface reflectance is too high. Therefore, it poses the question of how well the MODIS C6 AOD products perform under different air quality situations, given that many studies focus on retrieving PM2.5 concentrations with satellite signals. The objective of this study was to evaluate the performances of different MODIS C6 AOD products under different air quality situations and understand whether these AOD products were suitable to retrieve surface PM2.5 concentrations in Beijing, given the frequent haze-fog events during winter and autumn. In this study, three MODIS AOD products (3 km DT, 10 km DT, and 10 km DB) were collected at two AERONET stations to validate these three types of AOD products. The results suggested that the 10 km DB AODs had the largest number of effective retrievals as well as the highest retrieval accuracy, followed by the 10 km DT and 3 km DT products. Although it is designed to provide a high spatial resolution aerosol product for air quality monitoring, the 3 km DT product did not perform well in the region of Beijing.
Due to the bright surface problem in urban Beijing and the high concentrations of particulate matter, the DT algorithm often failed to obtain effective results in the winter and autumn when frequent haze-fog events occur. Thus, the successful retrievals by the MODIS DT products mainly happened in the middle of the year, which poses a large challenge for the application of MODIS DT AODs for air quality monitoring, as they fail to obtain effective retrievals when the PM2.5 concentrations were high during autumn and winter. Therefore, it is highly possible that the satellite retrieval of PM2.5 concentrations MODIS DT AODs would underestimate real situations, especially during autumn and winter. The DB products—initially developed to provide a low accuracy AOD product for desert areas—were further enhanced in the C6 release and contained both high accuracy (±(0.05 + 0.15τ)) and spatial-temporal coverage for Beijing. The 10 km DB product also provided sufficient retrievals at high PM2.5 concentrations across all four seasons. These results suggest that the MODIS 10 km DB AOD product has high accuracy and temporal coverage for heavily polluted areas such as Beijing, and is a more suitable proxy for the estimation of aerosol loads in urban regions than the other two MODIS aerosol products. For regions like Beijing with frequent haze-fog events in autumn and winter, the MODIS 3 km DT and 10 km DT products may not be able to obtain effective and sufficient retrievals. Therefore, the satellite-based retrieval of PM2.5 concentrations with DT products may not reflect the real aerosol pollution situations in Beijing. Thus, for regions with frequent haze-fog events when PM2.5 concentrations are high, the newly developed 3 km DT product is recommended as a proxy for air quality monitoring. Furthermore, it is possible that a DB product with a finer space resolution (e.g., 3 km or even 1 km) may be more suitable for air quality monitoring applications.
Acknowledgments
This research was supported by the Fundamental Research Funds for the Central Universities under Grant 2014QD02, National Natural Science Foundation of China under Grant 41671383 and 61405204, the Open Fund of State Key Laboratory of Remote Sensing Science under Grant OFSLRSS201623, Open Fund of State Key Laboratory of Information Engineering in Surveying, Mapping and Remote Sensing under Grant 16R01, and the outstanding talent training project of Beijing under Grant 2014000020124G0441. We acknowledge the PIs of the Beijing Station (Hong-Bin Chen and Philippe Goloub) and the Beijing-CAMS station (Huizheng Che) for providing AERONET observation data.
Author Contributions
All authors have made significant contributions to the paper. Wei Chen designed and wrote the paper; Aiping Fan processed the data; and Lei Yan provided key data.
Conflicts of Interest
The authors declare no conflict of interest.
References
- Lynch, P.; Reid, J.S.; Westphal, D.L.; Zhang, J.L.; Hogan, T.F.; Hyer, E.J.; Curtis, C.A.; Hegg, D.A.; Shi, Y.X.; Campbell, J.R.; et al. An 11-year global gridded aerosol optical thickness reanalysis (v1.0) for atmospheric and climate sciences. Geosci. Model Dev. 2016, 9, 1489–1522. [Google Scholar] [CrossRef]
- Remer, L.A.; Kaufman, Y.J.; Tanre, D.; Mattoo, S.; Chu, D.A.; Martins, J.V.; Li, R.R.; Ichoku, C.; Levy, R.C.; Kleidman, R.G.; et al. The MODIS aerosol algorithm, products, and validation. J. Atmos. Sci. 2005, 62, 947–973. [Google Scholar] [CrossRef]
- Zhang, Z.B.; Meyer, K.; Yu, H.B.; Platnick, S.; Colarco, P.; Liu, Z.Y.; Oreopoulos, L. Shortwave direct radiative effects of above-cloud aerosols over global oceans derived from 8 years of CALIOP and MODIS observations. Atmos. Chem. Phys. 2016, 16, 2877–2900. [Google Scholar] [CrossRef]
- Zhou, M.G.; Liu, Y.N.; Wang, L.J.; Kuang, X.Y.; Xu, X.H.; Kan, H.D. Particulate air pollution and mortality in a cohort of Chinese men. Environ. Pollut. 2014, 186, 1–6. [Google Scholar] [CrossRef] [PubMed]
- Kahn, R.A.; Gaitley, B.J. An analysis of global aerosol type as retrieved by MISR. J. Geophys. Res. 2015, 120, 4248–4281. [Google Scholar] [CrossRef]
- Ghan, S.J.; Liu, X.; Easter, R.C.; Zaveri, R.; Rasch, P.J.; Yoon, J.H.; Eaton, B. Toward a Minimal Representation of Aerosols in Climate Models: Comparative Decomposition of Aerosol Direct, Semidirect, and Indirect Radiative Forcing. J. Clim. 2012, 25, 6461–6476. [Google Scholar] [CrossRef]
- Hsu, N.C.; Tsay, S.C.; King, M.D.; Herman, J.R. Aerosol properties over bright-reflecting source regions. IEEE Trans. Geosci. Remote Sens. 2004, 42, 557–569. [Google Scholar] [CrossRef]
- Levy, R.C.; Remer, L.A.; Kaufman, Y.J. Effects of neglecting polarization on the MODIS aerosol retrieval over land. IEEE Trans. Geosci. Remote Sens. 2004, 42, 2576–2583. [Google Scholar] [CrossRef]
- Hasekamp, O.P.; Litvinov, P.; Butz, A. Aerosol properties over the ocean from PARASOL multiangle photopolarimetric measurements. J. Geophys. Res. 2011, 116. [Google Scholar] [CrossRef]
- Diner, D.J.; Martonchik, J.V.; Kahn, R.A.; Pinty, B.; Gobron, N.; Nelson, D.L.; Holben, B.N. Using angular and spectral shape similarity constraints to improve MISR aerosol and surface retrievals over land. Remote Sens. Environ. 2005, 94, 155–171. [Google Scholar] [CrossRef]
- Sayer, A.M.; Munchak, L.A.; Hsu, N.C.; Levy, R.C.; Bettenhausen, C.; Jeong, M.J. MODIS Collection 6 aerosol products: Comparison between Aqua’s e-Deep Blue, Dark Target, and “merged” data sets, and usage recommendations. J. Geophys. Res. 2014, 119, 13965–13989. [Google Scholar] [CrossRef]
- Diner, D.J.; Abdou, W.A.; Bruegge, C.J.; Conel, J.E.; Crean, K.A.; Gaitley, B.J.; Helmlinger, M.C.; Kahn, R.A.; Martonchik, J.V.; Pilorz, S.H.; et al. MISR aerosol optical depth retrievals over southern Africa during the SAFARI-2000 dry season campaign. Geophys. Res. Lett. 2001, 28, 3127–3130. [Google Scholar] [CrossRef]
- Su, X.; Goloub, P.; Chiapello, I.; Chen, H.; Ducos, F.; Li, Z. Aerosol variability over East Asia as seen by POLDER space-borne sensors. J. Geophys. Res. 2010, 115, D24215. [Google Scholar] [CrossRef]
- Levy, R.C.; Mattoo, S.; Munchak, L.A.; Remer, L.A.; Sayer, A.M.; Patadia, F.; Hsu, N.C. The Collection 6 MODIS aerosol products over land and ocean. Atmos. Meas. Tech. 2013, 6, 2989–3034. [Google Scholar] [CrossRef]
- Yu, L.; Liu, T.; Cai, H.; Tang, J.; Bu, K.; Yan, F.; Yang, C.; Yang, J.; Zhang, S. Estimating land surface radiation balance using MODIS in northeastern China. J. Appl. Remote Sens. 2014, 8, 083523. [Google Scholar] [CrossRef]
- Payra, S.; Soni, M.; Kumar, A.; Prakash, D.; Verma, S. Intercomparison of Aerosol Optical Thickness Derived from MODIS and in Situ Ground Datasets over Jaipur, a Semi-arid Zone in India. Environ. Sci. Technol. 2015, 49, 9237–9246. [Google Scholar] [CrossRef] [PubMed]
- Misra, A.; Jayaraman, A.; Ganguly, D. Validation of Version 5.1 MODIS Aerosol Optical Depth (Deep Blue Algorithm and Dark Target Approach) over a Semi-Arid Location in Western India. Aerosol Air Qual. Res. 2015, 15, 252–262. [Google Scholar] [CrossRef]
- Xie, Y.; Li, Z.; Li, D.; Xu, H.; Li, K. Aerosol Optical and Microphysical Properties of Four Typical Sites of SONET in China Based on Remote Sensing Measurements. Remote Sens. 2015, 7, 9928. [Google Scholar] [CrossRef]
- Vermote, E.F.; Tanre, D.; Deuze, J.L.; Herman, M.; Morcrette, J.J. Second Simulation of the Satellite Signal in the Solar Spectrum, 6S: An overview. IEEE Trans. Geosci. Remote Sens. 1997, 35, 675–686. [Google Scholar] [CrossRef]
- Chen, W.; Tang, H.; Zhao, H. Diurnal, weekly and monthly spatial variations of air pollutants and air quality of Beijing. Atmos. Environ. 2015, 119, 21–34. [Google Scholar] [CrossRef]
- Che, H.; Shi, G.; Uchiyama, A.; Yamazaki, A.; Chen, H.; Goloub, P.; Zhang, X. Intercomparison between aerosol optical properties by a PREDE skyradiometer and CIMEL sunphotometer over Beijing, China. Atmos. Chem. Phys. 2008, 8, 3199–3214. [Google Scholar] [CrossRef]
- Eck, T.F.; Holben, B.N.; Dubovik, O.; Smirnov, A.; Goloub, P.; Chen, H.B.; Chatenet, B.; Gomes, L.; Zhang, X.Y.; Tsay, S.C.; et al. Columnar aerosol optical properties at AERONET sites in central eastern Asia and aerosol transport to the tropical mid-Pacific. J. Geophys. Res. 2005, 110. [Google Scholar] [CrossRef]
- Zhu, J.; Xia, X.; Che, H.; Wang, J.; Zhang, J.; Duan, Y. Study of aerosol optical properties at Kunming in southwest China and long-range transport of biomass burning aerosols from North Burma. Atmos. Res. 2016, 169, 237–247. [Google Scholar] [CrossRef]
- Xin, J.Y.; Wang, Y.S.; Li, Z.Q.; Wang, P.C.; Hao, W.M.; Nordgren, B.L.; Wang, S.G.; Liu, G.R.; Wang, L.L.; Wen, T.X.; et al. Aerosol optical depth (AOD) and Angstrom exponent of aerosols observed by the Chinese Sun Hazemeter Network from August 2004 to September 2005. J. Geophys. Res. 2007, 112, D05203. [Google Scholar] [CrossRef]
- Lee, K.H.; Kim, Y.J. Satellite remote sensing of Asian aerosols: A case study of clean, polluted, and Asian dust storm days. Atmos. Meas. Tech. 2010, 3, 1771–1784. [Google Scholar] [CrossRef]
- Xia, X.A.; Chen, H.B.; Wang, P.C.; Zong, X.M.; Qiu, J.H.; Gouloub, P. Aerosol properties and their spatial and temporal variations over North China in spring 2001. Tellus B 2005, 57, 28–39. [Google Scholar] [CrossRef]
- Zhang, A.; Qi, Q.; Jiang, L.; Zhou, F.; Wang, J. Population Exposure to PM2.5 in the Urban Area of Beijing. PLoS ONE 2013, 8, e63486. [Google Scholar] [CrossRef] [PubMed]
- Li, R.; Li, Z.; Gao, W.; Ding, W.; Xu, Q.; Song, X. Diurnal, seasonal, and spatial variation of PM2.5 in Beijing. Sci. Bull. 2015, 60, 387–395. [Google Scholar] [CrossRef]
- Kumar, K.R.; Yin, Y.; Sivakumar, V.; Kang, N.; Yu, X.; Diao, Y.; Adesina, A.J.; Reddy, R.R. Aerosol climatology and discrimination of aerosol types retrieved from MODIS, MISR and OMI over Durban (29.88°S, 31.02°E), South Africa. Atmos. Environ. 2015, 117, 9–18. [Google Scholar] [CrossRef]
- He, J.L.; Zha, Y.; Zhang, J.H.; Gao, J. Aerosol Indices Derived from MODIS Data for Indicating Aerosol-Induced Air Pollution. Remote Sens. 2014, 6, 1587–1604. [Google Scholar] [CrossRef]
- Wei, J.; Sun, L. Comparison and Evaluation of Different MODIS Aerosol Optical Depth Products Over the Beijing-Tianjin-Hebei Region in China. IEEE J. Sel. Top. Appl. Earth Obs. 2017, 10, 835–844. [Google Scholar] [CrossRef]
- Zhang, Y.; Li, Z.Q.; Zhang, Y.H.; Chen, Y.; Cuesta, J.; Ma, Y. Multi-peak accumulation and coarse modes observed from AERONET retrieved aerosol volume size distribution in Beijing. Meteorol. Atmos. Phys. 2016, 128, 537–544. [Google Scholar] [CrossRef]
- Hu, X.F.; Waller, L.A.; Al-Hamdan, M.Z.; Crosson, W.L.; Estes, M.G.; Estes, S.M.; Quattrochi, D.A.; Sarnat, J.A.; Liu, Y. Estimating ground-level PM2.5 concentrations in the southeastern US using geographically weighted regression. Environ. Res. 2013, 121, 1–10. [Google Scholar] [CrossRef] [PubMed]
- Lee, H.J.; Chatfield, R.B.; Strawa, A.W. Enhancing the Applicability of Satellite Remote Sensing for PM2.5 Estimation Using MODIS Deep Blue AOD and Land Use Regression in California, United States. Environ. Sci. Technol. 2016, 50, 6546–6555. [Google Scholar] [CrossRef] [PubMed]
- Song, Y.; Xu, D.D.; Chai, Z.F.; Ouyang, H.; Feng, W.Y.; Mao, X.Y. INAA study for characterization of PM10 and PM2.5 in Beijing and influence of dust storm. J. Radioanal. Nucl. Chem. 2006, 270, 29–33. [Google Scholar] [CrossRef]
- Chen, W.; Wang, F.; Xiao, G.; Wu, K.; Zhang, S. Air Quality of Beijing and Impacts of the New Ambient Air Quality Standard. Atmosphere 2015, 6, 1243. [Google Scholar] [CrossRef]
- Zhang, R.; Jing, J.; Tao, J.; Hsu, S.C.; Wang, G.; Cao, J.; Lee, C.S.L.; Zhu, L.; Chen, Z.; Zhao, Y.; et al. Chemical characterization and source apportionment of PM2.5 in Beijing: Seasonal perspective. Atmos. Chem. Phys. 2013, 13, 7053–7074. [Google Scholar] [CrossRef]
- Xia, X.G. Variability of aerosol optical depth and Angstrom wavelength exponent derived from AERONET observations in recent decades. Environ. Res. Lett. 2011, 6, 044011. [Google Scholar] [CrossRef]
- Che, H.; Xia, X.; Zhu, J.; Li, Z.; Dubovik, O.; Holben, B.; Goloub, P.; Chen, H.; Estelles, V.; Cuevas-Agullo, E.; et al. Column aerosol optical properties and aerosol radiative forcing during a serious haze-fog month over North China Plain in 2013 based on ground-based sunphotometer measurements. Atmos. Chem. Phys. 2014, 14, 2125–2138. [Google Scholar] [CrossRef]
- Smirnov, A.; Holben, B.N.; Eck, T.F.; Dubovik, O.; Slutsker, I. Cloud-screening and quality control algorithms for the AERONET database. Remote Sens. Environ. 2000, 73, 337–349. [Google Scholar] [CrossRef]
- Dubovik, O.; Smirnov, A.; Holben, B.N.; King, M.D.; Kaufman, Y.J.; Eck, T.F.; Slutsker, I. Accuracy assessments of aerosol optical properties retrieved from Aerosol Robotic Network (AERONET) Sun and sky radiance measurements. J. Geophys. Res. 2000, 105, 9791–9806. [Google Scholar] [CrossRef]
- Kaufman, Y.J.; Tanré, D.; Gordon, H.R.; Nakajima, T.; Lenoble, J.; Frouin, R.; Grassl, H.; Herman, B.M.; King, M.D.; Teillet, P.M. Passive remote sensing of tropospheric aerosol and atmospheric correction for the aerosol effect. J. Geophys. Res. 1997, 102, 16815–16830. [Google Scholar] [CrossRef]
- Levy, R.C.; Remer, L.A.; Mattoo, S.; Vermote, E.F.; Kaufman, Y.J. Second-generation operational algorithm: Retrieval of aerosol properties over land from inversion of Moderate Resolution Imaging Spectroradiometer spectral reflectance. J. Geophys. Res. 2007, 112. [Google Scholar] [CrossRef]
- Di Tomaso, E.; Schutgens, N.A.J.; Jorba, O.; Garcia-Pando, C.P. Assimilation of MODIS Dark Target and Deep Blue observations in the dust aerosol component of NMMB-MONARCH version 1.0. Geosci. Model Dev. 2017, 10, 1107–1129. [Google Scholar] [CrossRef]
- Distribution of Real Time Air Qulaity of China. Available online: http://113.108.142.147:20035/emcpublish/ (accessed on 15 May 2017).
- Petrenko, M.; Ichoku, C.; Leptoukh, G. Multi-sensor Aerosol Products Sampling System (MAPSS). Atmos. Meas. Tech. 2012, 5, 913–926. [Google Scholar] [CrossRef]
- Kuang, Y.; Zhao, C.S.; Tao, J.C.; Ma, N. Diurnal variations of aerosol optical properties in the North China Plain and their influences on the estimates of direct aerosol radiative effect. Atmos. Chem. Phys. 2015, 15, 5761–5772. [Google Scholar] [CrossRef]
- Remer, L.A.; Mattoo, S.; Levy, R.C.; Munchak, L.A. MODIS 3 km aerosol product: Algorithm and global perspective. Atmos. Meas. Tech. 2013, 6, 1829–1844. [Google Scholar] [CrossRef]
- Nichol, J.; Bilal, M. Validation of MODIS 3 km Resolution Aerosol Optical Depth Retrievals over Asia. Remote Sens. 2016, 8, 328. [Google Scholar] [CrossRef]
- Sanchez-Romero, A.; Gonzalez, J.A.; Calbo, J.; Sanchez-Lorenzo, A.; Michalsky, J. Aerosol optical depth in a western Mediterranean site: An assessment of different methods. Atmos. Res. 2016, 174, 70–84. [Google Scholar] [CrossRef]
- Yan, X.; Shi, W.; Luo, N.; Zhao, W. A new method of satellite-based haze aerosol monitoring over the North China Plain and a comparison with MODIS Collection 6 aerosol products. Atmos. Res. 2016, 171, 31–40. [Google Scholar] [CrossRef]
- Lee, H.J.; Son, Y.-S. Spatial Variability of AERONET Aerosol Optical Properties and Satellite Data in South Korea during NASA DRAGON-Asia Campaign. Environ. Sci. Technol. 2016, 50, 3954–3964. [Google Scholar] [CrossRef] [PubMed]
- Ma, Y.; Li, Z.; Li, Z.; Xie, Y.; Fu, Q.; Li, D.; Zhang, Y.; Xu, H.; Li, K. Validation of MODIS Aerosol Optical Depth Retrieval over Mountains in Central China Based on a Sun-Sky Radiometer Site of SONET. Remote Sens. 2016, 8, 111. [Google Scholar] [CrossRef]
- Witek, M.L.; Diner, D.J.; Garay, M.J. Satellite assessment of sea spray aerosol productivity: Southern Ocean case study. J. Geophys. Res. 2016, 121, 872–894. [Google Scholar] [CrossRef]
- Cheng, T.; Chen, H.; Gu, X.; Yu, T.; Guo, J.; Guo, H. The inter-comparison of MODIS, MISR and GOCART aerosol products against AERONET data over China. J. Quant. Spectrosc. Radiat. 2012, 113, 2135–2145. [Google Scholar] [CrossRef]
- Qi, Y.L.; Ge, J.M.; Huang, J.P. Spatial and temporal distribution of MODIS and MISR aerosol optical depth over northern China and comparison with AERONET. Sci. Bull. 2013, 58, 2497–2506. [Google Scholar] [CrossRef]
- Li, B.G.; Yuan, H.S.; Feng, N.; Tao, S. Comparing MODIS and AERONET aerosol optical depth over China. Int. J. Remote Sens. 2009, 30, 6519–6529. [Google Scholar] [CrossRef]
- Tao, M.; Chen, L.; Wang, Z.; Tao, J.; Che, H.; Wang, X.; Wang, Y. Comparison and evaluation of the MODIS Collection 6 aerosol data in China. J. Geophys. Res. 2015, 120, 6992–7005. [Google Scholar] [CrossRef]
- Huang, G.H.; Huang, C.L.; Li, Z.Q.; Chen, H. Development and Validation of a Robust Algorithm for Retrieving Aerosol Optical Depth over Land From MODIS Data. IEEE J. Sel. Top. Appl. Earth Obs. 2015, 8, 1152–1166. [Google Scholar] [CrossRef]
- Sayer, A.M.; Hsu, N.C.; Bettenhausen, C.; Jeong, M.J. Validation and uncertainty estimates for MODIS Collection 6 “Deep Blue” aerosol data. J. Geophys. Res. 2013, 118, 7864–7872. [Google Scholar] [CrossRef]
- Bilal, M.; Nichol, J.E. Evaluation of MODIS aerosol retrieval algorithms over the Beijing-Tianjin-Hebei region during low to very high pollution events. J. Geophys. Res. 2015, 120, 7941–7957. [Google Scholar] [CrossRef]
- Zhang, Q.; Xin, J.Y.; Yin, Y.; Wang, L.L.; Wang, Y.S. The Variations and Trends of MODIS C5 & C6 Products' Errors in the Recent Decade over the Background and Urban Areas of North China. Remote Sens. 2016, 8, 754. [Google Scholar] [CrossRef]
- Bilal, M.; Nichol, J.E.; Nazeer, M. Validation of Aqua-MODIS C051 and C006 Operational Aerosol Products Using AERONET Measurements over Pakistan. IEEE J. Sel. Top. Appl. Earth Obs. 2016, 9, 2074–2080. [Google Scholar] [CrossRef]
- Georgoulias, A.K.; Alexandri, G.; Kourtidis, K.A.; Lelieveld, J.; Zanis, P.; Amiridis, V. Differences between the MODIS Collection 6 and 5.1 aerosol datasets over the greater Mediterranean region. Atmos. Environ. 2016, 147, 310–319. [Google Scholar] [CrossRef]
- Belle, J.H.; Liu, Y. Evaluation of Aqua MODIS Collection 6 AOD Parameters for Air Quality Research over the Continental United States. Remote Sens. 2016, 8, 815. [Google Scholar] [CrossRef]
- Ma, Z.; Hu, X.; Sayer, A.M.; Levy, R.; Zhang, Q.; Xue, Y.; Tong, S.; Bi, J.; Huang, L.; Liu, Y. Satellite-Based Spatiotemporal Trends in PM2.5 Concentrations: China, 2004–2013. Environ. Health Perspect. 2016, 124, 184–192. [Google Scholar] [CrossRef] [PubMed]
- Sayer, A.M.; Hsu, N.C.; Bettenhausen, C.; Jeong, M.J.; Meister, G. Effect of MODIS Terra radiometric calibration improvements on Collection 6 Deep Blue aerosol products: Validation and Terra/Aqua consistency. J. Geophys. Res. 2015, 120, 12157–12174. [Google Scholar] [CrossRef]
- Xie, Y.; Wang, Y.; Zhang, K.; Dong, W.; Lv, B.; Bai, Y. Daily Estimation of Ground-Level PM2.5 Concentrations over Beijing Using 3 km Resolution MODIS AOD. Environ. Sci. Technol. 2015, 49, 12280–12288. [Google Scholar] [CrossRef] [PubMed]
- Zhou, Y.; Cheng, S.; Chen, D.; Lang, J.; Wang, G.; Xu, T.; Wang, X.; Yao, S. Temporal and Spatial Characteristics of Ambient Air Quality in Beijing, China. Aerosol Air Qual. Res. 2015, 15, 1868–1880. [Google Scholar] [CrossRef]
Figure 1.
Distributions of the two Aerosol RObotic NETwork (AERONET) stations and two air quality stations used in this study. The two AERONET stations are: Beijing-CAMS station (39.93°N, 116.32°E) and Beijing station (39.97°N, 116.38°E). The two air quality stations are Olympic Sports Center station (39.98°N, 116.40°E) and West Park Official station (39.93°N, 116.34°E).

Figure 2.
Validation of the Moderate Resolution Imaging Spectroradiometer (MODIS; both Terra and Aqua) 10 km Dark Target aerosol optical depth (DT AOD) against AERONET measurements at the Beijing station and Beijing-CAMS station. EE: expected error.
Figure 2.
Validation of the Moderate Resolution Imaging Spectroradiometer (MODIS; both Terra and Aqua) 10 km Dark Target aerosol optical depth (DT AOD) against AERONET measurements at the Beijing station and Beijing-CAMS station. EE: expected error.

Figure 3.
Validation of the MODIS (both Terra and Aqua) 10 km Deep Blue (DB) AOD against AERONET measurements at the Beijing station, and Beijing-CAMS station.
Figure 3.
Validation of the MODIS (both Terra and Aqua) 10 km Deep Blue (DB) AOD against AERONET measurements at the Beijing station, and Beijing-CAMS station.

Figure 4.
Validation of the MODIS (both Terra and Aqua) 3 km Dark Target AOD against AERONET measurements at the Beijing station, and Beijing-CAMS station.
Figure 4.
Validation of the MODIS (both Terra and Aqua) 3 km Dark Target AOD against AERONET measurements at the Beijing station, and Beijing-CAMS station.

Figure 5.
Monthly successfully retrieval counts of the MODIS 10 km Dark Target AOD, 10 km Deep Blue AOD, 3 km Dark Target AOD, and AERONET retrievals during the overpass of Terra and Aqua for the Beijing station.
Figure 5.
Monthly successfully retrieval counts of the MODIS 10 km Dark Target AOD, 10 km Deep Blue AOD, 3 km Dark Target AOD, and AERONET retrievals during the overpass of Terra and Aqua for the Beijing station.

Figure 6.
Retrieval number histograms of the MODIS 10 km Dark Target AOD, 10 km Deep Blue AOD, 3 km Dark Target AOD, AERONET retrievals, and total PM2.5 data during the overpass of Terra and Aqua for (a) Beijing and (b) Beijing-CAMS station.
Figure 6.
Retrieval number histograms of the MODIS 10 km Dark Target AOD, 10 km Deep Blue AOD, 3 km Dark Target AOD, AERONET retrievals, and total PM2.5 data during the overpass of Terra and Aqua for (a) Beijing and (b) Beijing-CAMS station.
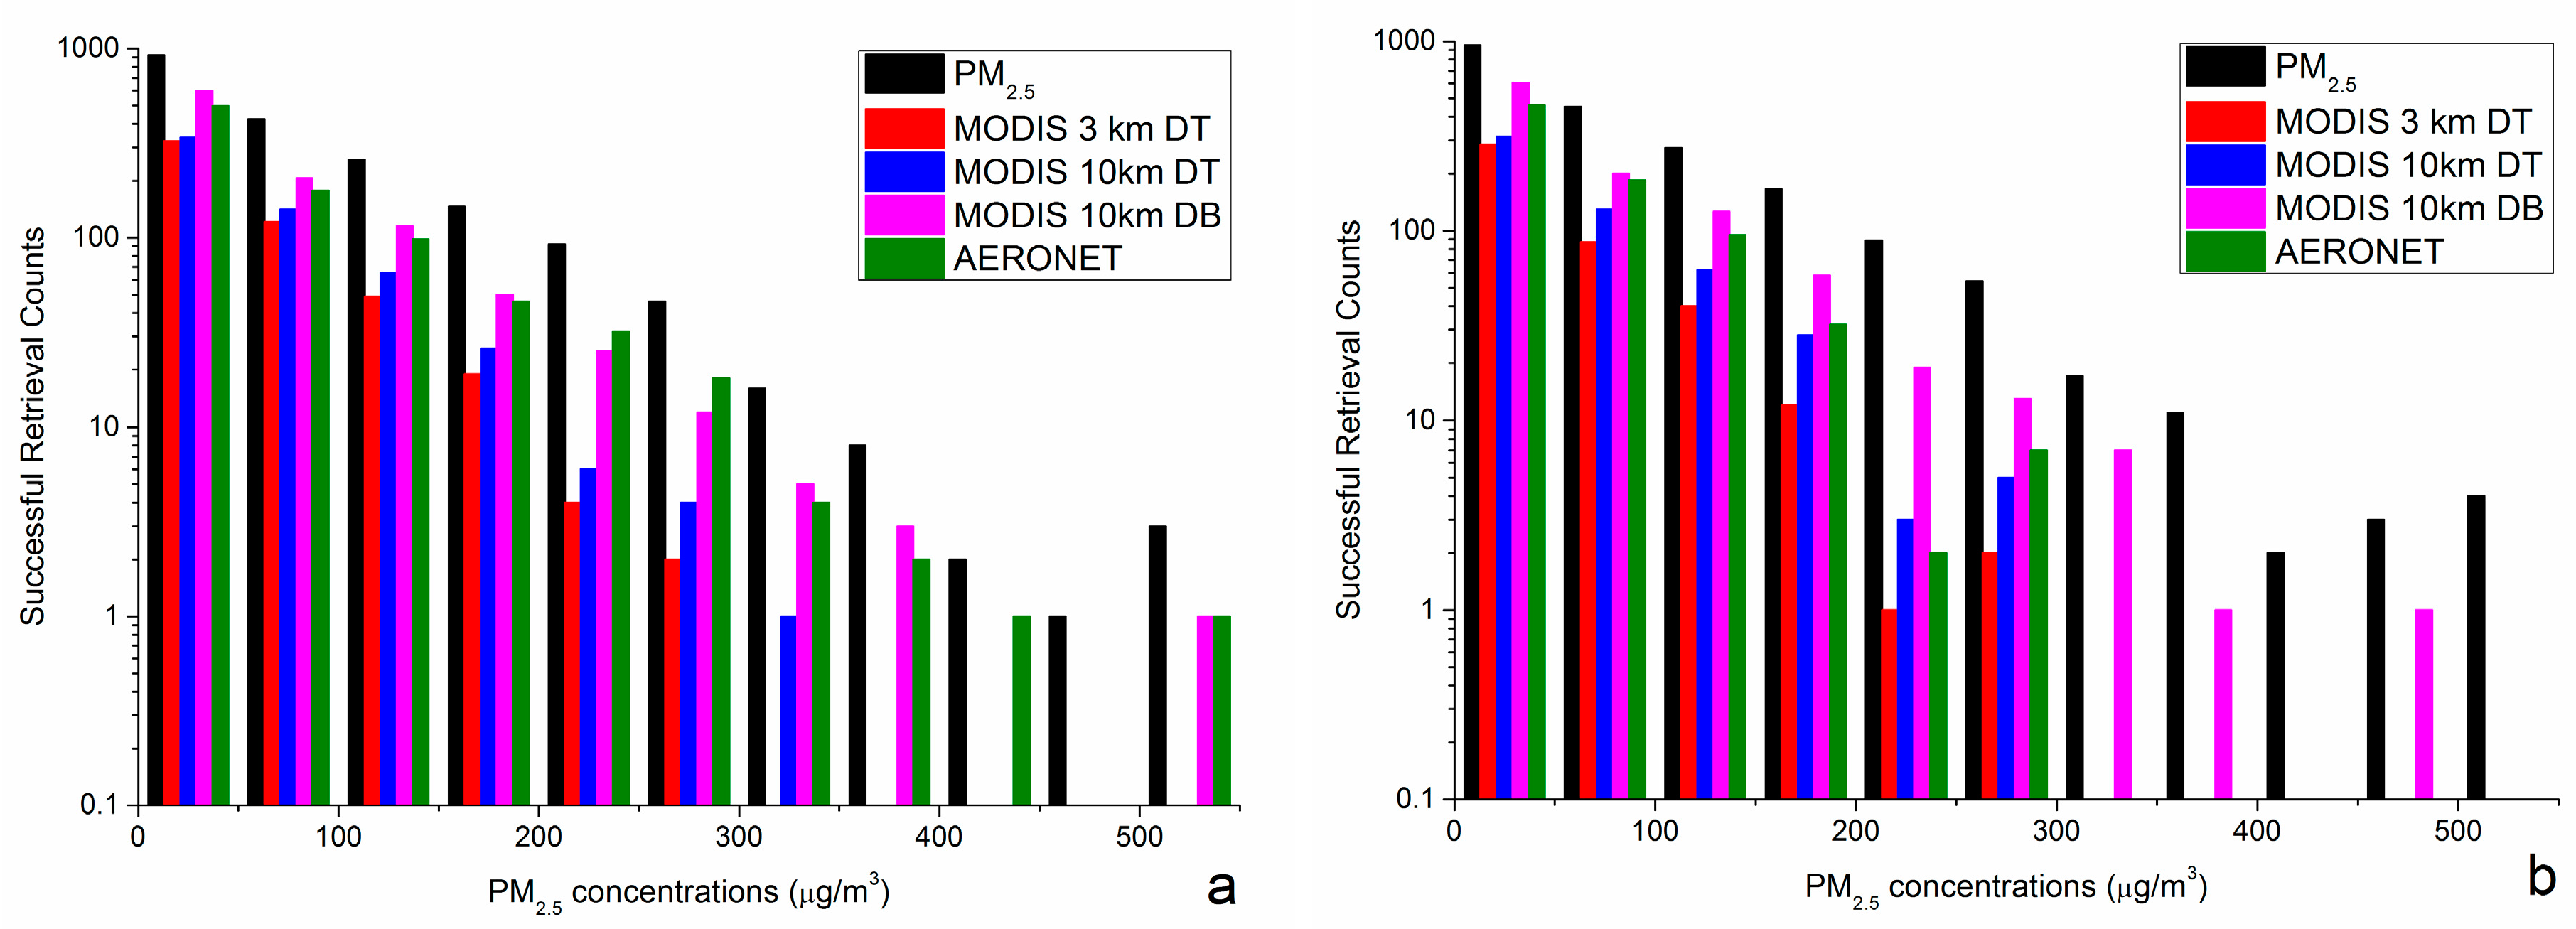
Figure 7.
Correlation of PM2.5 concentrations against the (a) MODIS 3 km DT AOD; (b) MODIS 10 km DT AOD; (c) MODIS 10 km DB AOD; and (d) AERONET AOD for the Beijing-CAMS station.
Figure 7.
Correlation of PM2.5 concentrations against the (a) MODIS 3 km DT AOD; (b) MODIS 10 km DT AOD; (c) MODIS 10 km DB AOD; and (d) AERONET AOD for the Beijing-CAMS station.
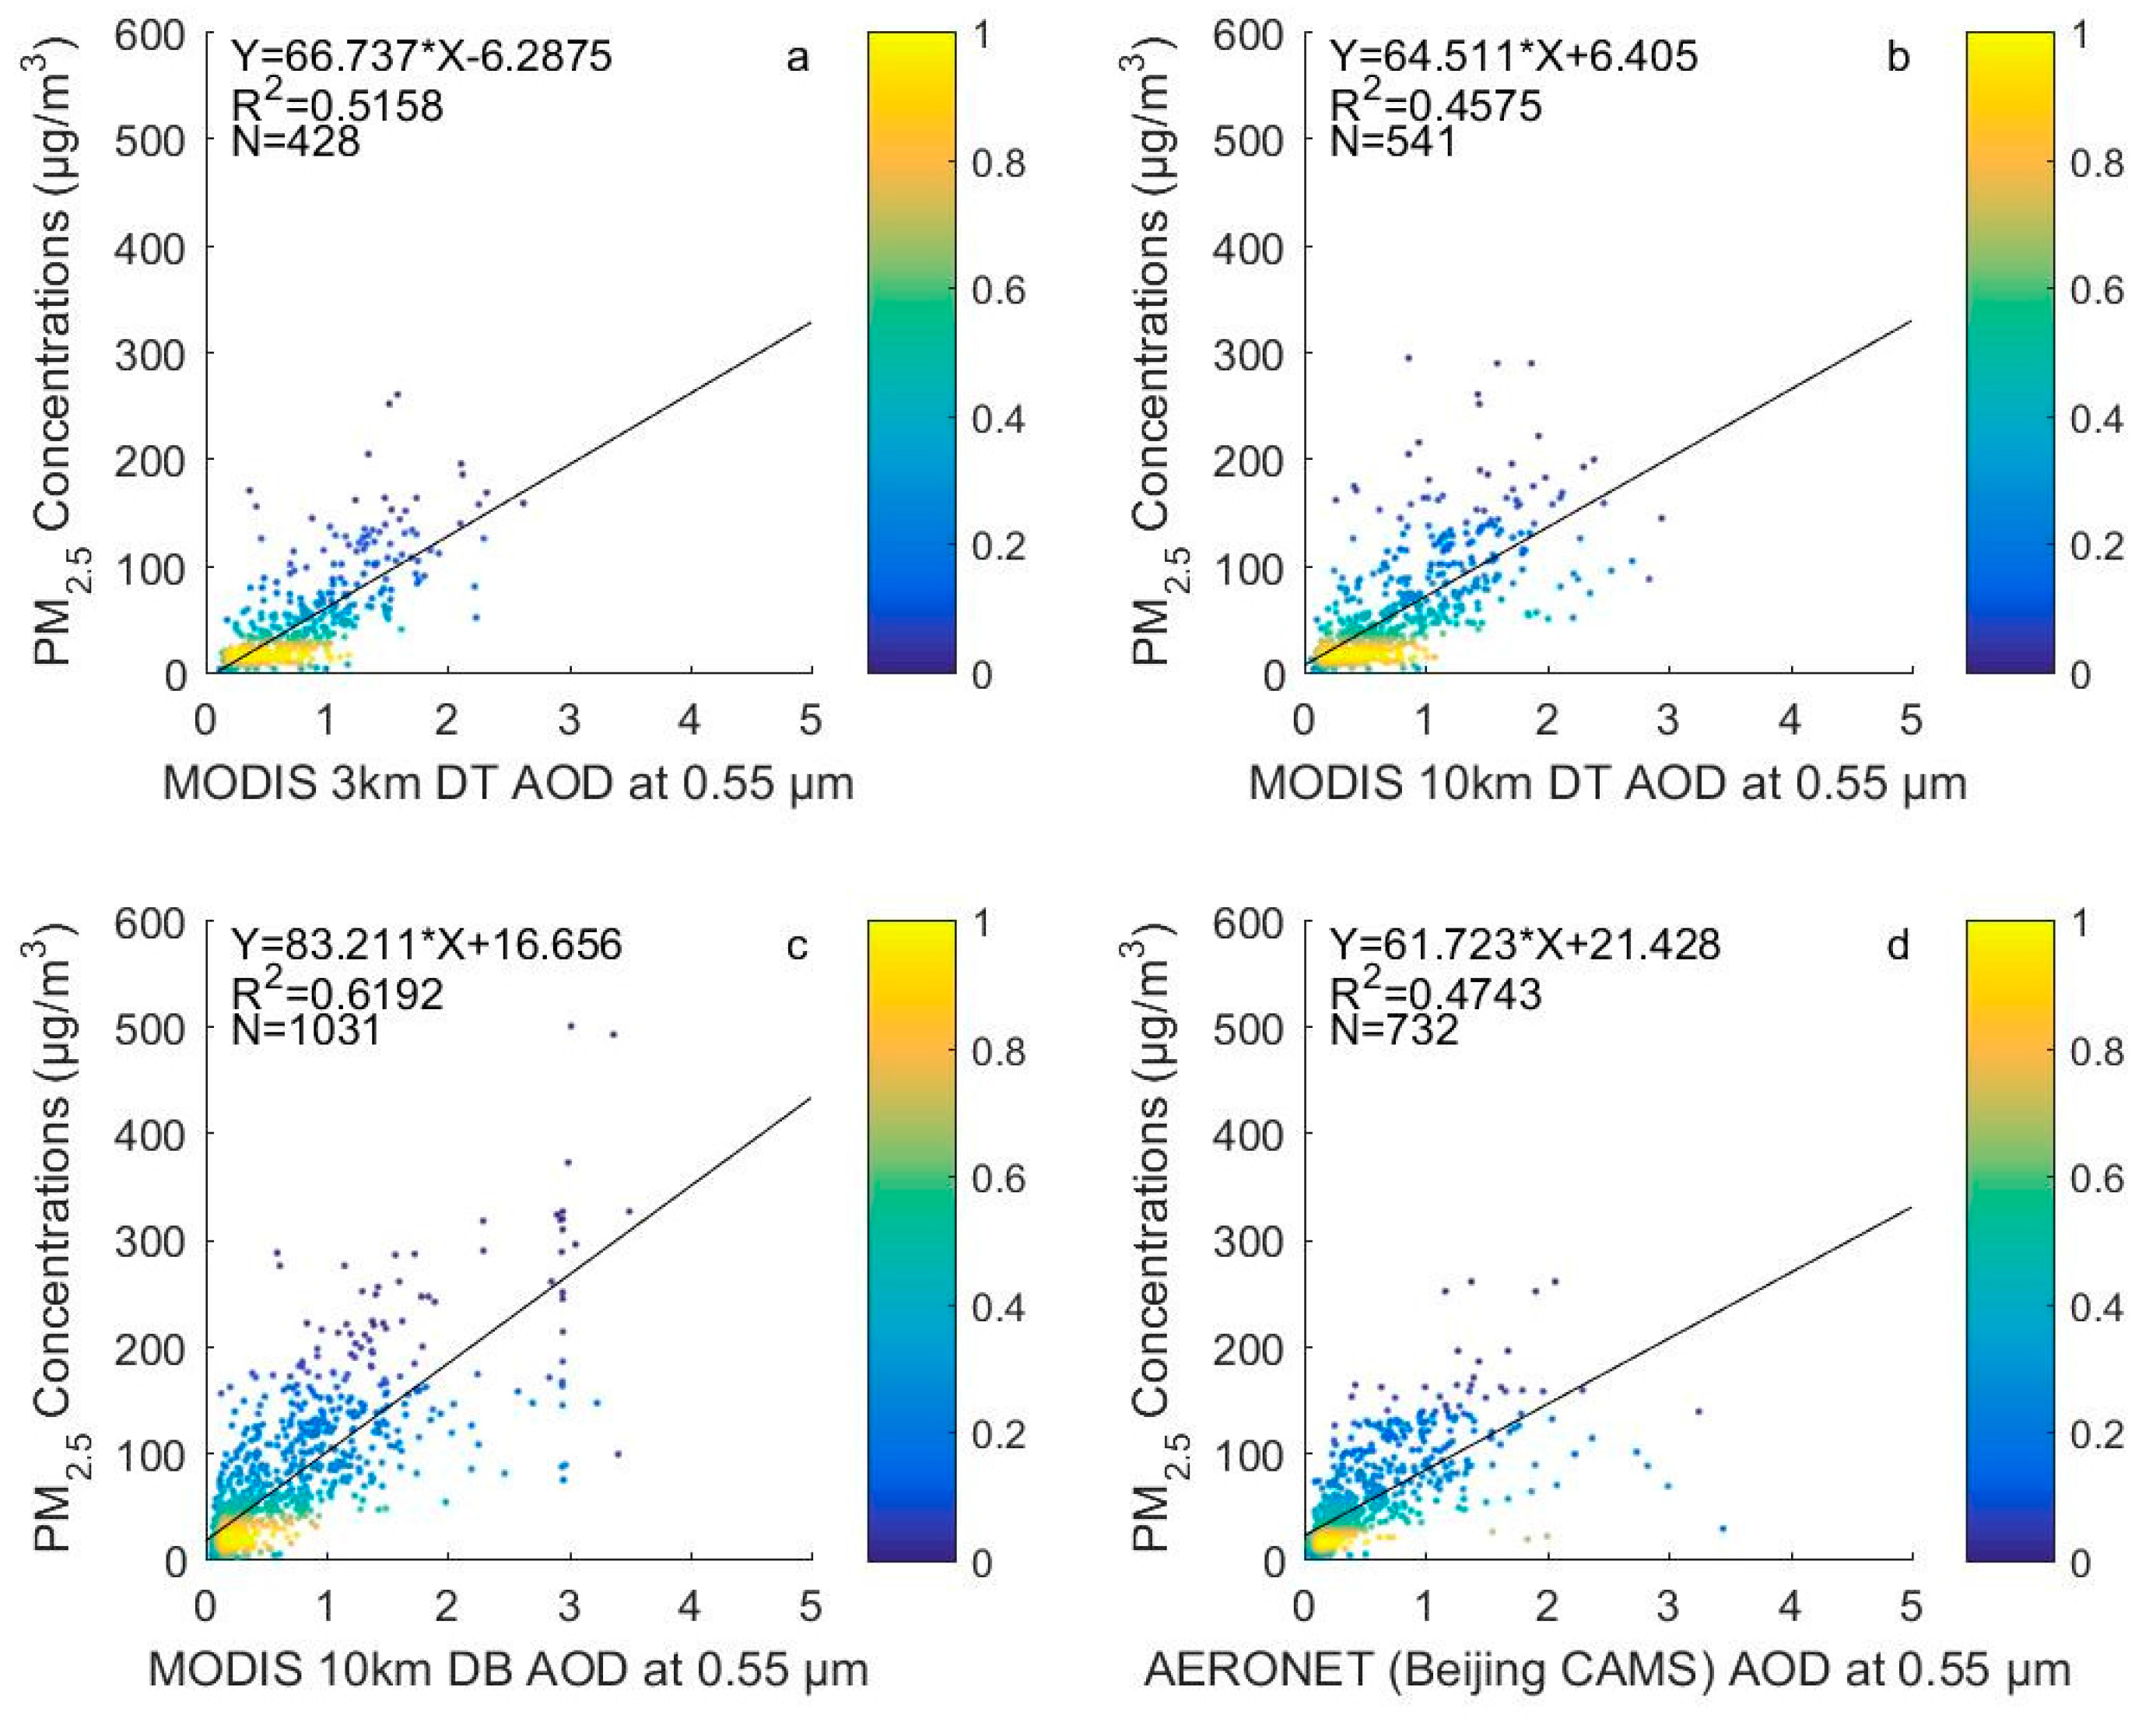
Figure 8.
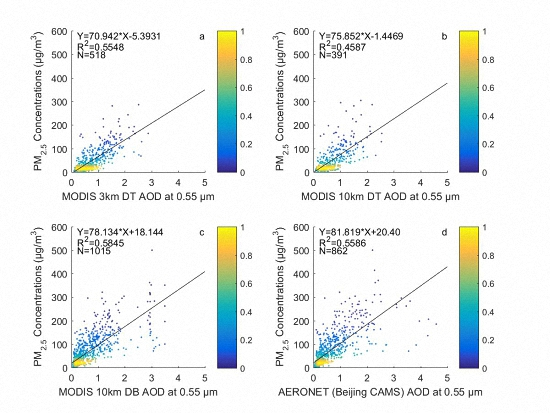
Correlation of PM2.5 concentrations against the (a) MODIS 3 km DT AOD; (b) MODIS 10 km DT AOD; (c) MODIS 10 km DB AOD; and (d) AERONET AOD for the Beijing station.
Figure 8.
Correlation of PM2.5 concentrations against the (a) MODIS 3 km DT AOD; (b) MODIS 10 km DT AOD; (c) MODIS 10 km DB AOD; and (d) AERONET AOD for the Beijing station.

Figure 9.
Comparisons of the monthly average AOD of (a) MODIS 3 km DT; (b) MODIS 10 km DT; and (c) MODIS 10 km DB with the AERONET retrieved monthly average AOD for the Beijing and Beijing-CAMS stations.
Figure 9.
Comparisons of the monthly average AOD of (a) MODIS 3 km DT; (b) MODIS 10 km DT; and (c) MODIS 10 km DB with the AERONET retrieved monthly average AOD for the Beijing and Beijing-CAMS stations.


Table 1.
Air qualities statistics of successful retrievals of different AOD products.
| Station | AOD Products/PM2.5 | PM2.5 Concentrations | Retrieval Counts (Percentage) |
|---|---|---|---|
| Beijing | MODIS 3 km DT | <75 µg/m3 | 396 (76.6%) |
| 75–150 µg/m3 | 97 (18.6%) | ||
| >150 µg/m3 | 25 (4.8%) | ||
| MODIS 10 km DT | <75 µg/m3 | 422 (72.5%) | |
| 75–150 µg/m3 | 123 (21.1%) | ||
| >150 µg/m3 | 37 (6.4%) | ||
| MODIS 10 km DB | <75 µg/m3 | 716 (70.5%) | |
| 75–150 µg/m3 | 203 (20.0%) | ||
| >150 µg/m3 | 96 (9.5%) | ||
| AERONET | <75 µg/m3 | 601 (68.6%) | |
| 75–150 µg/m3 | 171 (19.5%) | ||
| >150 µg/m3 | 104 (11.9%) | ||
| PM2.5 | <75 µg/m3 | 1151 (60.0%) | |
| 75–150 µg/m3 | 455 (23.7%) | ||
| >150 µg/m3 | 314 (16.3%) | ||
| Beijing-CAMS | MODIS 3 km DT | <75 µg/m3 | 352 (82.2%) |
| 75–150 µg/m3 | 61 (14.3%) | ||
| >150 µg/m3 | 15 (3.5%) | ||
| MODIS 10 km DT | <75 µg/m3 | 400 (73.8%) | |
| 75–150 µg/m3 | 106 (19.6%) | ||
| >150 µg/m3 | 36 (6.6%) | ||
| MODIS 10 km DB | <75 µg/m3 | 728 (70.7%) | |
| 75–150 µg/m3 | 203 (19.6%) | ||
| >150 µg/m3 | 100 (9.7%) | ||
| AERONET | <75 µg/m3 | 556 (76.0%) | |
| 75–150 µg/m3 | 153 (20.9%) | ||
| >150 µg/m3 | 23 (3.1%) | ||
| PM2.5 | <75 µg/m3 | 1203 (59.3%) | |
| 75–150 µg/m3 | 479 (23.6%) | ||
| >150 µg/m3 | 346 (17.1%) |
© 2017 by the authors. Licensee MDPI, Basel, Switzerland. This article is an open access article distributed under the terms and conditions of the Creative Commons Attribution (CC BY) license (http://creativecommons.org/licenses/by/4.0/).
Share and Cite
MDPI and ACS Style
Chen, W.; Fan, A.; Yan, L. Performance of MODIS C6 Aerosol Product during Frequent Haze-Fog Events: A Case Study of Beijing. Remote Sens. 2017, 9, 496. https://doi.org/10.3390/rs9050496
AMA Style
Chen W, Fan A, Yan L. Performance of MODIS C6 Aerosol Product during Frequent Haze-Fog Events: A Case Study of Beijing. Remote Sensing. 2017; 9(5):496. https://doi.org/10.3390/rs9050496
Chicago/Turabian StyleChen, Wei, Aiping Fan, and Lei Yan. 2017. "Performance of MODIS C6 Aerosol Product during Frequent Haze-Fog Events: A Case Study of Beijing" Remote Sensing 9, no. 5: 496. https://doi.org/10.3390/rs9050496
Note that from the first issue of 2016, this journal uses article numbers instead of page numbers. See further details here.