
Evaluation of Multiple Downscaled Microwave Soil Moisture Products over the Central Tibetan Plateau
by
 ,
,
Hongtao Jiang
1, 
Huanfeng Shen
1,*,
Huifang Li
1,
Fangni Lei
1,
Wenxia Gan
2 and
Liangpei Zhang
3 1
School of Resource and Environmental Science, Wuhan University, Wuhan 430079, China
2
School of Resource and Civil Engineering, Wuhan Institute of Technology, Wuhan 430205, China
3
State Key Laboratory of Information Engineering in Surveying, Mapping and Remote Sensing, Wuhan University, Wuhan 430079, China
*
Author to whom correspondence should be addressed.
Remote Sens. 2017, 9(5), 402; https://doi.org/10.3390/rs9050402
Submission received: 22 February 2017
/
Revised: 3 April 2017
/
Accepted: 21 April 2017
/
Published: 25 April 2017
Abstract
:Downscaled microwave soil moisture (SM) products with a fine resolution are of great importance for both local and regional studies. However, few studies have explored the merits of multiple downscaled microwave SM products. An evaluation of the different products could help to advance knowledge of the downscaled microwave SM products and help researchers to choose the appropriate downscaled SM products for use in further studies. In this research, five microwave SM products derived from Advanced Microwave Scanning Radiometer–Earth Observing System (AMSR-E), AMSR2, and Soil Moisture and Ocean Salinity (SMOS) data were downscaled via the back-propagation neural network (BPNN). The BPNN was chosen because it can effectively simulate the nonlinear relationship between SM and the land surface temperature (LST)/vegetation index (VI). The different downscaled SM products were evaluated with in-situ SM data from the central Tibetan Plateau Soil Moisture/Temperature Monitoring Network (SMTMN) during the period from 1 August 2010 to 31 December 2012. Compared with the regression technique, the downscaled correlation coefficient (r) is significantly improved by the BPNN. The downscaled root-mean-square error (RMSE) and bias are comparable for the two techniques. As expected, LST and enhanced VI (EVI) are physically related to SM, and this is the most suitable combination for SM downscaling. Except for the ascending node of SMOS and AMSR2, the downscaled r is closely related to the original RMSE, and a lower original RMSE for the SM product results in a higher downscaled r. The BPNN-downscaled SMOS product in descending node is the closest to the in-situ SM among the different downscaled microwave SM products. The temporal variations and ranges of the microwave SM products are well maintained by the BPNN downscaling. Furthermore, the evaluations against in-situ SM reveal that the overall accuracies of the BPNN-downscaled SM products are very close to the original microwave SM products.
1. Introduction
Over the past decades, various passive microwave satellites or sensors have been launched to measure soil moisture (SM) globally, with revisit cycles of two to three days, including the Advanced Microwave Scanning Radiometer–Earth Observing System (AMSR-E), the Soil Moisture and Ocean Salinity (SMOS) mission, the Advanced Microwave Scanning Radiometer-2 (AMSR2), and the Soil Moisture Active Passive (SMAP) mission. Except for the 9-km resolution of the SMAP SM product [1], which is obtained by merging radiometer with radar data, the other instruments are characterized by a coarse spatial resolution (~25-km) [2,3]. Unfortunately, the radar instrument of SMAP broke down on 7 July 2015, which resulted in the terminated transmission of satellite-based SM observations at a spatial resolution finer than 10-km. These SM products can be insufficient for local or regional studies due to their coarse spatial resolution, where SM observations at a 1–10-km resolution are commonly required [4]. Therefore, downscaling is needed to improve the spatial resolution for the effective application of passive microwave derived SM products. Different remote sensing data and auxiliary data are used for microwave SM product downscaling, such as optical/thermal infrared (OTI) remote sensing data [4,5,6,7,8,9,10,11,12,13], active microwave data [1,14,15], and topographic, vegetation, and soil data [16]. Among these supplementary datasets, OTI data are widely used for SM downscaling as they can be conveniently accessed and provide detailed land-surface contextual information [11].
Traditionally, SM downscaling methods using OTI data are built upon the triangle framework [17]. This framework is formed as a triangular or trapezoid distribution relating the land surface temperature (LST) and the normalized difference vegetation index (NDVI) within ‘wet’ and ‘dry’ edges, and the SM condition is a vital factor influencing the edges. Since Chauhan et al. [5] first proposed a regression equation for improving the spatial variability of the Special Sensor Microwave Imager (SSM/I) SM by integrating the triangle-based SM downscaling method proposed by Carlson [17] and the surface albedo, various microwave SM products (~25 km) have been downscaled using this method and revised versions [6,18,19]. Piles et al. [4] and Song et al. [10] included microwave brightness temperature (Tb) and LST/NDVI data within the regression method to downscale SMOS and AMSR-E SM, respectively. Soil evaporative efficiency [7,8] derived from LST and NDVI data has also been proposed for SMOS SM downscaling; however, the requirement for many field-measured biophysical parameters limits the wide application of this semi-empirical model. Chen et al. [12] proposed a new method based on OTI data to downscale SMAP SM from a 36-km to a 250-m scale and concluded that the method has a wide application scope through tests on SMAPEx-4/5 data.
To date, SM downscaling has mainly focused on the single microwave SM products derived from AMSR-E, SMOS, or SMAP products [6,10,12,20,21]. Microwave SM products derived from different satellites have varied accuracies, which has been confirmed in many studies [2,3,22,23]. However, the accuracy differences between the different downscaled SM products are still not clear. Characterizing the accuracies of the different downscaled SM products will be of great value for both local and regional studies. High-accuracy SM data with high spatial information is needed for the improvement of weather prediction forecasting, drought assessment, eco-system monitoring, and water resources management. The evaluation of the different downscaled microwave SM products will help us to understand the difference between the downscaled SM products and will help researchers to choose appropriate downscaled SM products for use in further studies.
Zhao et al. [24] and Wang et al. [11] compared different SM downscaling methods over Mqau on the Tibetan Plateau. This study revealed that the accuracies of the methods proposed by Merlin et al. [8] and Piles et al. [4] were comparable with triangle-based SM downscaling over the Tibetan Plateau. The triangle-based SM downscaling method is easy to implement, relying on the relationship between SM and LST/NDVI, and the downscaled SM has no blocky effect. However, the relationship between SM and LST/NDVI is primarily formulated via a regression equation, which may not be capable of fully revealing the complicated nonlinearity of the relationship. For strong nonlinear fitting, the back-propagation neural network (BPNN) can simulate the relationship effectively. In addition, remote sensing indexes (RSIs) [11,19] calculated by surface reflectance data can act as the NDVI for SM downscaling. Therefore, the utilization of the BPNN and an appropriate LST/RSI for SM downscaling may achieve better results.
In this research, multiple microwave SM products derived from AMSR-E, AMSR2 (together referred to as AMSR hereafter), and SMOS were downscaled by the BPNN and LST/RSI for the Tibetan Plateau. To choose the appropriate RSI for SM downscaling, five different RSIs derived from Moderate Resolution Imaging Spectro-radiometer (MODIS) surface reflectance data were investigated. In-situ SM data from the central Tibetan Plateau Soil Moisture/Temperature Monitoring Network (SMTMN), which is located at Naqu, were used to evaluate the multiple downscaled SM products. Therefore, the aims of this research were to evaluate the multiple BPNN-downscaled SM products over the SMTMN area from 1 August 2010 to 31 December 2012 and to examine the differences between microwave and downscaled SM products so as to analyze the discrepancies among the multiple downscaled SM products.
2. Data
2.1. In-Situ Measurement
The in-situ SM data used in this research were obtained from the SMTMN (http://dam.itpcas.ac.cn/rs/?q=data#CTP-SMTMN), which is a monitoring network deployed around the city of Naqu within an area of 1° × 1° (Figure 1) in the central Tibetan Plateau, China. Apart from a few rugged areas, the land surface of Naqu is relatively flat with rolling hills, and the elevation range of the stations is 4470–4953 m above sea level [25]. The land surface conditions are relatively homogeneous, with alpine meadow as the dominant land-cover type. Rainfall events mainly occur in summer, and the soil freezes in winter. Overall, this region can be considered representative for satellite-based SM observations and can provide beneficial geophysical conditions for SM downscaling over high elevations and a cold climatic zone. EC-TM and 5TM capacitance probes manufactured by Decagon Devices were used for the SM monitoring. The measuring time interval was set to 30 min, starting at 0:00 a.m., and each record reflects the average state of the SM over the past half-hour [26]. The monitoring network consists of 56 stations measuring SM at three spatial scales (1.0, 0.3, and 0.1 degrees) and four soil depths (0~5, 10, 20, and 40 cm) [27]. The measured SM is calibrated by considering the impact of soil texture and soil organic carbon content [28], and the valid range of the measured SM is 0–0.7 m3/m3. As intensive measurement sites, the dataset is adequate for evaluating and validating both the original and corresponding downscaled satellite-based SM products. The top layer of (0~5 cm) in-situ SM from 1 August 2010 to 31 December 2012, was used for the evaluation, as microwave signals can only penetrate several centimeters below surface soil.
2.2. Microwave Soil Moisture Products
2.2.1. AMSR-E
AMSR-E, which is onboard the National Aeronautics and Space Administration (NASA) Aqua satellite, is a passive microwave radiometer that has been applied for generating worldwide SM datasets with an expected accuracy of no less than 0.06 m3/m3 over sparsely to moderately vegetated land surfaces [29]. The spatial resolution of the typical AMSR-E SM product is about 25 km over the period from June 2002 to October 2011. The overpass times of the ascending and descending nodes are 01:30 p.m. and 01:30 a.m., respectively. To date, various algorithms have been routinely applied to retrieve SM from AMSR-E, and the three most widely used AMSR-E SM products were chosen in this research for downscaling; namely, (a) the NASA product [30]; (b) the Land Parameter Retrieval Model (LPRM) product developed by Vrije Universiteit, Amsterdam, in collaboration with NASA [31,32]; and (c) The Japan Aerospace Exploration Agency (JAXA) product [33]. In this research, the AMSR-E SM products covered the period from 1 August 2010 to 3 October 2011.
2.2.2. AMSR2
AMSR2, the successor to AMSR-E, which is onboard the Global Change Observation Mission Water 1 satellite, was launched in May 2012. The overpass time of AMSR2 is the same as that of AMSR-E, and the AMSR2 SM product obtained using the same retrieval algorithm as the JAXA product was chosen in this research. As a second-generation sensor, AMSR2 is expected to provide a better spatial resolution and a more accurate SM product. AMSR2 features a larger antenna diameter, and the footprint size of AMSR2 at 6.9 GHz is 35 km × 62 km, which is finer than the 43 × 75 km of AMSR-E [34]. Additionally, AMSR2 has an additional horizontally and vertically polarized channel at 7.3 GHz that was initially intended for radio frequency interference (RFI) mitigation [2]. In addition, AMSR2 has an improved thermal design and calibration system [2]. In this research, the AMSR2 SM product with a 25-km resolution covered the period from 5 July to 31 December 2012. The time span of AMSR2 covered only five months and was the shortest among the microwave SM products.
2.2.3. SMOS
SMOS is the first mission designed specifically for global SM monitoring. The satellite has an average 43-km resolution and a 1000-km swath width in the field-of-view. The revisit time is three days, and the ascending and descending overpasses across the equator are at 6:00 a.m. and 6:00 p.m., respectively. An L-band radiometer is deployed (1.4 GHz) to monitor surface SM, which is the most suitable space-borne band for SM retrieval, and the expected accuracy of the derived SM product is less than 0.04 m3/m3 over land. The L-band microwave emission of the biosphere model [35,36] is employed to retrieve SMOS SM. The SMOS Level 3 SM product (version 2.72, 25 km) delivered by the Centre Aval de Traitement des Données SMOS (CATDS) from 1 August 2010 to 31 December 2012 was used in this research.
2.3. MODIS
The MODIS instruments operate on the Terra (MOD) and Aqua (MYD) satellites, where the ascending and descending times are 10:30 p.m./10:30 a.m. and 1:30 p.m./1:30 a.m., respectively. The MODIS data used in this research were the 1-km daily LST (MOD11A1 and MYD11A1) products and the 500-m daily surface reflectance (MOD09GA and MYD09GA) products. The latter products were utilized for RSI calculation, namely, NDVI, enhanced vegetation index (EVI), and three kinds of normalized difference water index (NDWI) (Equations (1)–(3)):
where Bi (i = 1,…, 7) refers to the ith MODIS surface reflectance band, NDWIj refers to one of the three kinds of NDWI, and j starts from five for consistency with the MODIS surface reflectance band.
3. Method
3.1. Data Pre-Processing
L-band microwave observations endure much more serious RFI contamination than C- and X-band observations. Therefore, the effect of RFI on the AMSR SM products is negligible, and only the RFI-contaminated pixels of the SMOS data were removed. For SMOS, SM pixels with a data quality index (DQX) of greater than 0.06 were discarded [21]. The in-situ SM ranges from 0 to 0.7 m3/m3 within SMTMN; therefore, satellite-derived SM retrievals with values larger than 0.7 m3/m3 were excluded (Table 1). The MODIS products were extracted and resampled to 1 km. The MODIS data were then aggregated to a coarser resolution by each microwave SM pixel. The aggregated value was preserved if more than 80% of the MODIS pixels for each microwave SM pixel were not contaminated [24]. In addition to the above pre-processing, data filtering for RSI and LST was also taken into consideration. The filtering criteria for the microwave SM and MODIS products are summarized in Table 1. Note that the data exclusion criteria were not only applied to the aggregated MODIS data but were also applied to the MODIS data (1 km) for the acquisition of the high-quality downscaled SM products.
For the different satellite overpass times, the minimum time gap was taken as the matching criterion between the microwave products (SM) and MODIS data (LST/RSI). The ascending node of AMSR (1:30 p.m.) matches daytime Aqua (01:30 p.m. and 10:30 a.m.), LST (MYD_LST), and RSI (MYD_RSI). The aggregated MODIS LST values at night (01:30 a.m. and 10:30 p.m.) were almost all excluded because of the contaminated MODIS pixels and frozen soil. Therefore, the descending node of AMSR was not downscaled in this research. In addition, the ascending node of SMOS (A_SMOS) matches daytime Terra LST (MOD_LST) and RSI (MOD_RSI), while the descending node of SMOS (D_SMOS) matches daytime MYD_LST and MYD_RSI.
3.2. Microwave SM Product BPNN Downscaling
In the triangle-based SM downscaling method, the regression equation is used to simulate the relationship between SM and LST/RSI. In this research, the BPNN was used instead of regression for the relationship simulation for downscaling the microwave SM from 25 km to 1 km. The BPNN is a multi-layer neural network trained by an error back-propagation algorithm. As there is no data feedback in the network, the data workflow begins at an input layer and then consecutively moves into hidden layer(s) and an output layer with the corresponding output data. Errors between the calculated and reference output are back-propagated from the output layer to the input layer, thereby continuously updating the network weights and biases in the opposite direction so as to obtain the minimum squared errors of the network. In this research, a three-layer BPNN containing one hidden layer was used for the SM downscaling (Figure 2). The BPNN was trained by the Levenberg-Marquardt algorithm, taking the aggregated LST/RSI combination as the input and the corresponding SM at the microwave scale (~25 km) as the output. The well-trained BPNN was then applied at the MODIS scale (1 km), and thus the microwave SM products were downscaled from the coarse scale to the MODIS scale by the BPNN. The basic assumption of BPNN downscaling is that the relationship between SM and LST/RSI is scale-invariant for the both microwave- and MODIS-scale datasets. For strong nonlinear fitting, it is expected that BPNN downscaling should obtain a better result than regression downscaling. Therefore, first- and second-order regression of the triangle-based SM downscaling methods was implemented for comparison:
where a and b indicate the regression parameters and the LST and RSI are normalized to [0,1]. In addition, the SM downscaling method proposed by Choi and Hur [6] (Equation (6)) was also used for comparison:
where c indicates the regression parameter and A indicates the surface albedo, which is calculated by surface reflectance data using the equation proposed by Liang [37]. A is also normalized to [0,1].
The relationship between SM and OTI data, which is considered to be scale-invariant, is vital for SM downscaling. This is because BPNN downscaling can be implemented once the relationship is generated by the BPNN using the SM product and MODIS data at the microwave scale. As the BPNN is used to construct the relationship at the microwave scale, which is further applied at the MODIS scale, BPNN-downscaled SM products are generated by the relationship and are independent of the microwave SM products. Thus, BPNN downscaling can be conducted for days when the microwave SM products are absent and the MODIS data exists. To implement BPNN training at the microwave scale, the input and output data were divided into two parts, a training dataset (80%) and a validation dataset (20%), preventing the over-fitting problem of the BPNN. After the training phase, the BPNN was used to downscale the coarse microwave SM products to the MODIS scale. Table 2 lists the total number of training and validation samples for each microwave SM product.
3.3. Quantitative Evaluation
The evaluation between the in-situ SM and downscaled SM products was quantified in terms of correlation coefficient (r), root-mean-square error (RMSE), and bias (in-situ SM–downscaled SM). In addition, a Taylor diagram was also generated for result demonstration and analysis. The whole research period covered 884 days, including 274 days of frozen periods and 610 days of unfrozen periods. SM data during the frozen periods were excluded, and the evaluations were only implemented over the unfrozen periods. Firstly, the downscaled SM products were evaluated against the in-situ observations from all the stations. Comparisons were then conducted to examine the difference between the downscaling methods and to determine the most suitable RSI for SM BPNN downscaling. The different BPNN-downscaled SM products using the optimal RSI were then evaluated during the same temporal coverage so as to investigate the discrepancies. To further investigate the performance of SM BPNN downscaling, each microwave product and the corresponding downscaled SM product were evaluated and compared in the same time series at the SMTMN scale.
4. Results
4.1. Structure Optimization of the BPNN
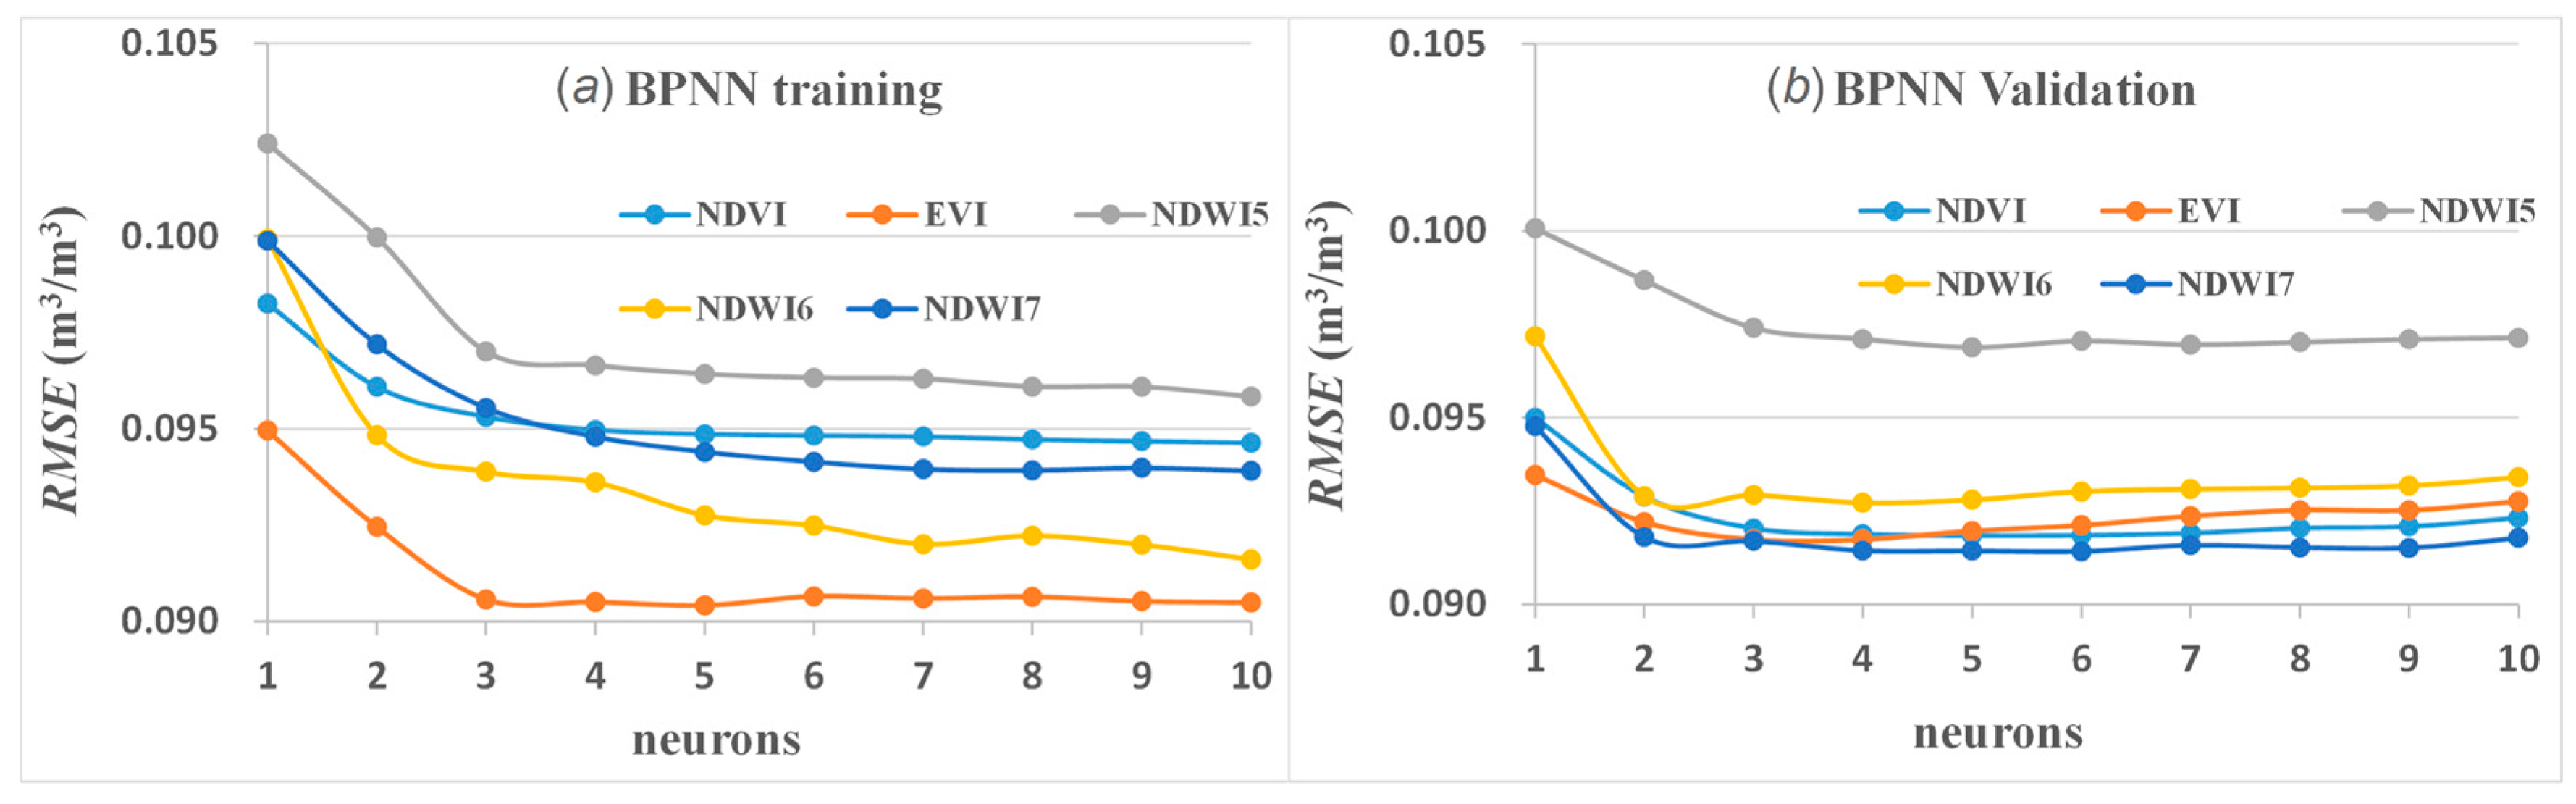
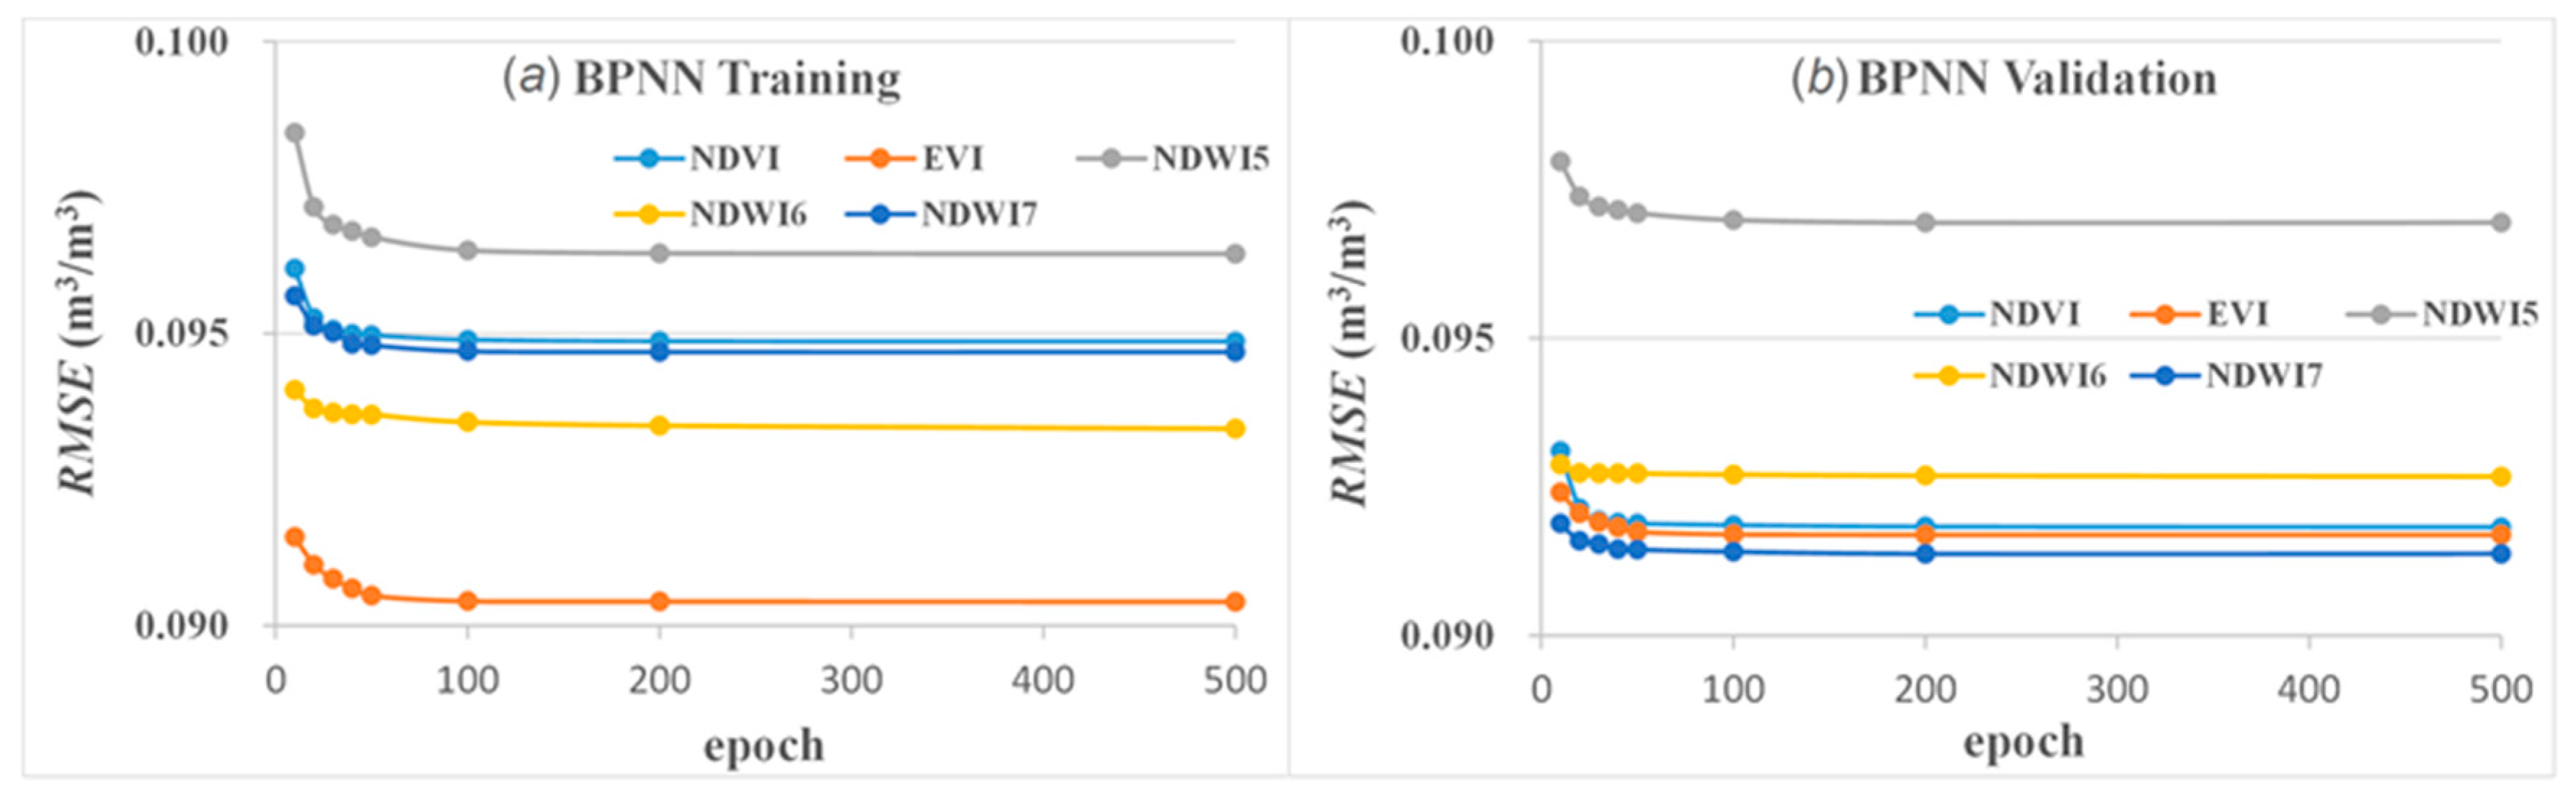
Before applying the BPNN for SM downscaling over the SMTMN area from 1 August 2010 to 31 December 2012, the network needed to be optimized. The aims of the optimization were to minimize the total error of the BPNN and to prevent over-fitting. The two vital parameters are the number of neurons in the hidden layer and the number of epochs (the maximum iterations for training), which were optimized by a trial-and-error approach. Here, A_SMOS downscaling is taken as an example to demonstrate the process of optimization. As shown in Figure 3, the RMSE drops quickly with the increase of neurons in the training phase, while the RMSE first decreases and then slightly climbs with the increase of neurons in the validation phase. Figure 4 shows the impact of the epochs, where the RMSE decreases with the increase of the epochs for both the BPNN training and validation phases and then becomes stable when the epochs are more than 100. Neurons and epochs with the minimal RMSE were chosen as the optimal setting for the SM downscaling, so four neurons and 100 epochs were defined for the microwave SM product BPNN downscaling (Figure 2).
4.2. Evaluation of Downscaled SM Products at the MODIS Scale
The multiple microwave SM products were downscaled from the coarse microwave scale (~25 km) to the fine MODIS scale (1 km). The downscaled SM products at the MODIS scale were evaluated against in-situ SM in the corresponding MODIS pixels. As shown in Figure 5, the first- and second-order regression downscaling approaches exhibit similar performances with regard to RMSE and bias and only moderate differences that exist with respect to r. As expected, the BPNN downscaling demonstrates a better performance than the regression methods, as indicated by the significantly increased r for each SM product and each LST/RSI combination. In addition, the differences of the downscaled RMSE and bias between the first and second-order regression and the BPNN models are small for each SM product (Figure 5). Choi and Hur downscaled performance is similar to the two regression method and is worse than the BPNN (Figure 5). This reveals the advantage of the BPNN, even if surface albedo is not taken into consideration for the BPNN. For the large difference of the downscaled r, a further detailed investigation of the advantage of BPNN downscaling based on r is shown in Table 3.
As shown in Table 3, optimal downscaling is achieved with the EVI, where the highest r is obtained for all the downscaled SM products using the different methods (in bold), with the exceptions of AMSR2 and A_SMOS for the second-order regression method and NASA and A_SMOS for the Choi and Hur method. These results suggest that LST/EVI for SM downscaling is more robust than the other LST/RSI combinations. The downscaled r of the Choi and Hur method is comparable with the regression methods but less so with the BPNN. Sorting the r values from high to low, the BPNN-downscaled SM products using the LST/EVI combination are D_SMOS (0.649), JAXA (0.582), LPRM (0.571), AMSR2 (0.558), NASA (0.547), and A_SMOS (0.531). The satisfying correlation coefficients between the BPNN-downscaled SM products and the in-situ SM data further confirm the advantage of the BPNN for SM downscaling. Therefore, the further evaluation of the BPNN-downscaled microwave SM products by the LST/EVI combination can be deemed to be credible.
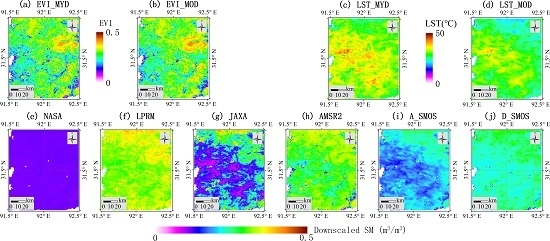
4.3. Spatial Maps of the BPNN-Downscaled SM Products by LST/EVI
To spatially visualize the differences between the multiple downscaled SM products, the cloud-free MODIS data on 9 September 2011 are selected, and the BPNN-downscaled SM products by MODIS LST/EVI are shown in Figure 6. Since SM BPNN downscaling depends on the relationship between SM and LST/EVI at the microwave scale, downscaled SM products are only available when good-quality MODIS data are accessible. The detailed spatial information on the SM maps is greatly improved via the downscaling, as there are no more than 20 SM pixels for the microwave products over the SMTMN area. However, the six downscaled SM maps appear rather divergent for the same date, despite the fact that the same LST/EVI combinations were used for the BPNN downscaling. Note that, in addition to A_SMOS (Figure 6i), the other SM products are BPNN downscaled by EVI_MYD (Figure 6a) and LST_MYD (Figure 6c). As there are great differences in accuracy among the various microwave SM products [3], the errors of the original SM products may be passed down to the downscaled SM products, resulting in the significant differences.
4.4. Temporal Evaluation of the BPNN-Downscaled SM Products by LST/EVI at the SMTMN Scale
Downscaled SM products are not available for every day because of the cloud contamination. In this research, if more than 13 in-situ SM in the corresponding MODIS pixels were not contaminated, the MODIS data were regarded as cloud-free data and the valid downscaled SM over the SMTMN area was area averaged. The reason for this is that the areal mean SM of the SMTMN area can be well estimated by 13 randomly distributed in-situ SM [26]. The station-averaged in-situ SM (at 6:00 a.m.) and the area-averaged downscaled SM products at the SMTMN scale during unfrozen periods are shown in Figure 7. The temporal coverage for each downscaled SM product is shown in Table 4. Apart from A_SMOS, the other downscaled SM products have the same temporal coverage, as the same Aqua MODIS LST/EVI was used for the SM downscaling. The downscaled NASA product is generally stable, and all the SM values are around 0.12 m3/m3. The RMSE (0.134 m3/m3) and bias (0.109 m3/m3) of the downscaled NASA product are quite high, which shows that significant errors exist in the downscaled NASA product. Both the time series analysis (Figure 7) and the statistical assessment of the negative bias indicate that the SM value is significantly overestimated by the downscaled LPRM product. Nevertheless, the downscaled LPRM product has a higher r (0.777) and lower RMSE (0.124 m3/m3) than the downscaled NASA product. The downscaled JAXA and AMSR2 products show similar temporal variations. The downscaled AMSR2 product has a lower RMSE (0.076 m3/m3) and is slightly better than the downscaled JAXA product, which contains some spurious high SM points during the summer period. As for SMOS, the downscaled A_SMOS product is generally underestimated, and the downscaled D_SMOS product is closer to the in-situ SM observations. The fact that the downscaled D_SMOS product is better than the downscaled A_SMOS product has also been noted in previous studies [4,19].
The discrete distribution of the downscaled SM products is also illustrated in Taylor diagrams (Figure 8). The downscaled SMOS products are quite close to the in-situ observation and have a lower RMSE than the downscaled AMSR product (Table 4). The downscaled D_SMOS product has the highest r among the downscaled microwave products. SMOS is designed specifically for SM observation and deploys the L-band, which is better than the C- or X-band for SM retrieval [35]. Thereby, the downscaled SMOS product generated from the SMOS microwave-scale SM product can achieve a better result. The variability of the downscaled D_SMOS product is the closest to the in-situ SM data, with the best result (r = 0.859, RMSE = 0.052 m3/m3, and bias = −0.011 m3/m3) at the SMTMN scale among the downscaled SM products (Figure 8 and Table 4).
4.5. Comparison between the Microwave and Downscaled SM Products at the SMTMN Scale
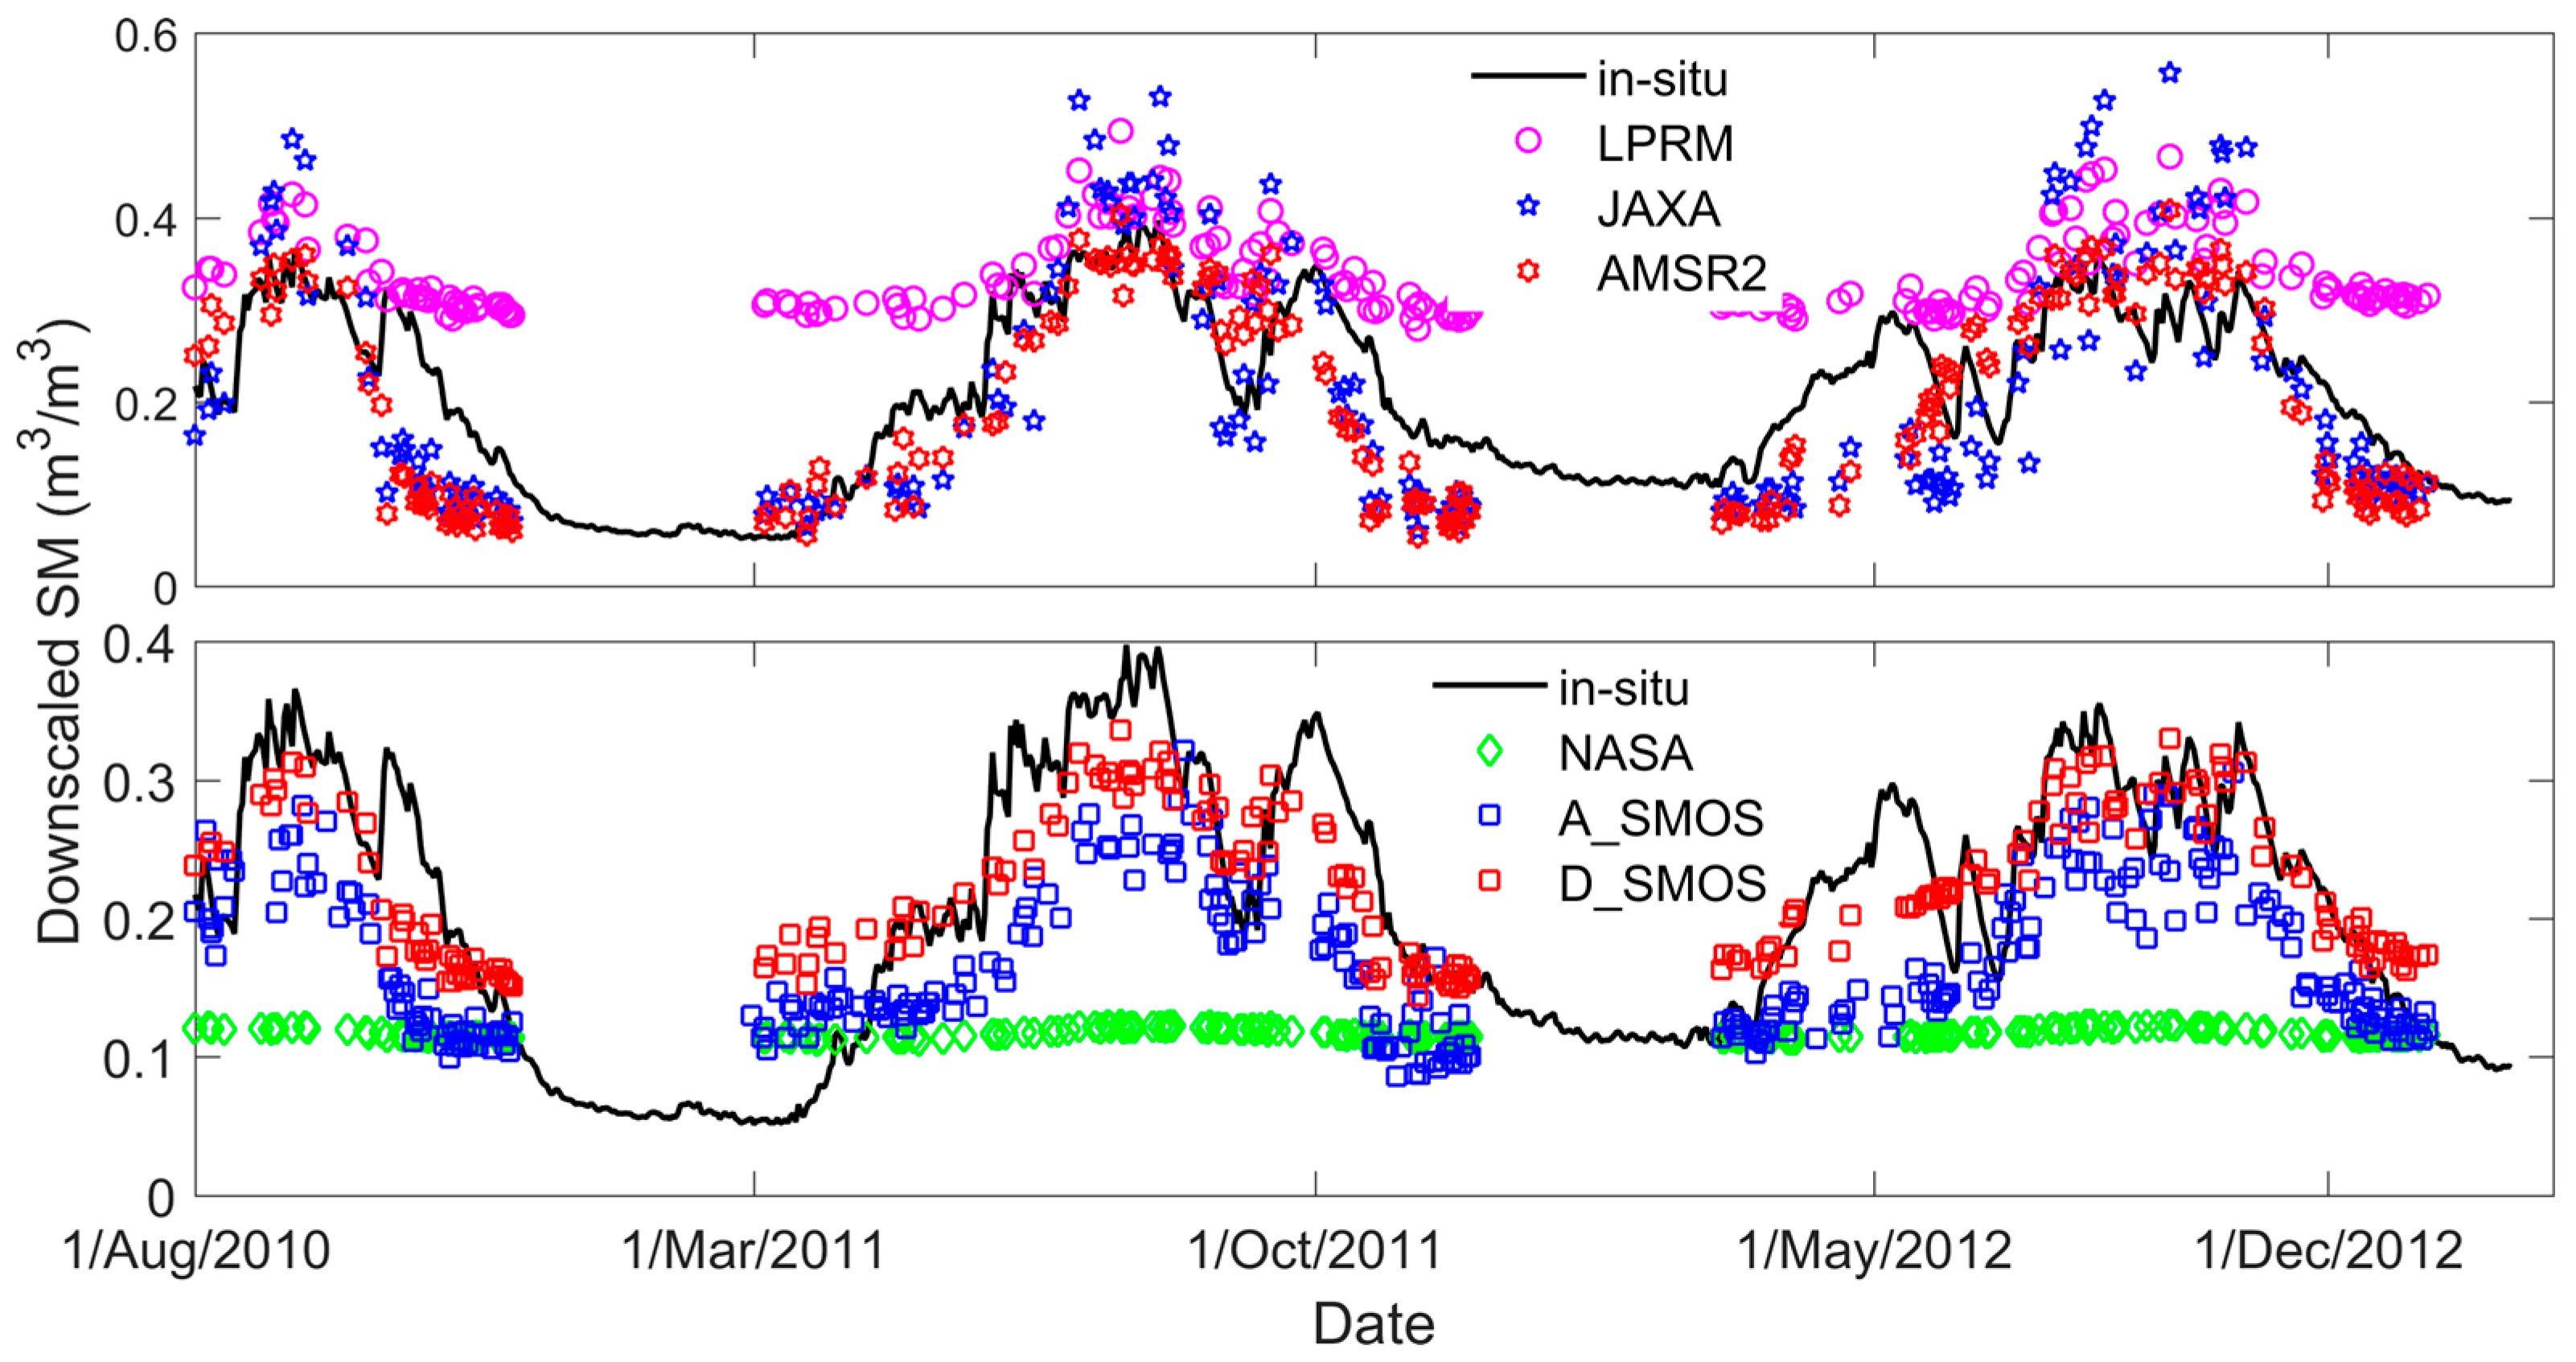
To demonstrate the capability of the BPNN approach in preserving temporal dynamic variability, the differences between the downscaled and microwave SM products were examined. Both the valid microwave and downscaled SM products were area averaged and then compared over the same time series at the SMTMN scale, eliminating the disparity originating from the inconsistent time series (Figure 9 and Table 5).
The range of the downscaled NASA product (0.110–0.124 m3/m3) is much smaller than the range of the microwave NASA product (0.081–0.195 m3/m3). Moreover, the downscaled NASA product appears temporally constant and looks like a straight line (Figure 9), explicitly indicating that the downscaled NASA product has a quite poor quality. The downscaled LPRM and JAXA products show similar temporal evolutions to the original LPRM and JAXA products. However, the temporal variations of the downscaled LPRM and JAXA products are not as close to the in-situ SM as the LPRM and JAXA microwave products. Meanwhile, the downscaled AMSR2 product is in good agreement with the in-situ SM, as is the original AMSR2 product. For both overpasses of the SMOS SM products, the temporal variations of the downscaled SMOS product are closer to the in-situ SM than the original SMOS, where some outlier points exist. Generally speaking, the downscaled SM products with fewer outliers are smoother than the corresponding microwave SM products, especially for the downscaled SMOS products. Furthermore, the BPNN-downscaled SM products are greatly dependent on the original microwave SM products, and the ranges of the downscaled SM products are within the ranges of the microwave SM products.
Statistical evaluations of the BPNN-downscaled products and the corresponding microwave SM products are shown in Table 5. For the NASA product, the RMSE and bias increase slightly, and the r is also increased from 0.614 to 0.742 after the BPNN downscaling. For the LPRM and JAXA products, the accuracies of the downscaled LPRM and JAXA time series slightly degenerate after downscaling. However, downscaling improves the accuracy of AMSR2 (Table 5), and the RMSE is also greatly decreased. However, the temporal availability of the AMSR2 product is limited to only five months, which might have led to a less robust evaluation. Additionally, the accuracy of the downscaled A_SMOS time series is improved, which is also observed for D_SMOS. Except for the greatly decreased RMSE of the AMSR2 product and the slightly increased RMSE of the NASA and LPRM products, the other RMSEs are only slightly decreased by the downscaling. Moreover, the bias between the downscaled and microwave SM products is almost equivalent for each SM product. Overall, the accuracies of the downscaled and microwave SM products are very close (Table 5). Nevertheless, the temporal correlations of the downscaled SM products are improved after downscaling, except for the LPRM and JAXA products. Even though the LPRM and JAXA products have a reduced r, the temporal variation of the in-situ SM can still be well captured by the downscaled products (Table 5). Therefore, the BPNN-downscaled SM products could be used for regional or local research at a fine resolution (1 km) and will provide comparable accuracies to the corresponding microwave SM products.
5. Discussion
In this research, we found that the EVI is the optimal RSI for SM downscaling. To investigate the reason for this, the r between the RSI and SM at the microwave scale (microwave SM) and MODIS scale (in-situ SM) was calculated (Table 6). The relationship between SM and LST/RSI is better simulated by the BPNN, with a higher r between the SM and RSI at the microwave scale because of the reduced interference for training. Meanwhile, the BPNN-downscaled SM products obtain good results, with a higher r between the SM and RSI at the MODIS scale, because of the higher-quality data for BPNN prediction. As shown in Table 6, the r of NDWI7 and NDWI6 is slightly higher than the r of EVI and NDVI for the AMSR products at the microwave scale, and the r of EVI is the highest for the SMOS products at both the microwave and MODIS scales (in bold). Overall, the relationship simulated by the BPNN with various RSIs is similar at the microwave scale because of the close r between NDVI, EVI, and the three kinds of NDWI. For optimal results, the EVI should be chosen for the SM downscaling because the r of the EVI is significantly higher than the r of the other RSIs at the MODIS scale (Table 6). As shown in Figure 5, the first- and second-order regression downscaling based on LST/RSI obtains a comparable performance to the Choi and Hur method [6], indicating the slight contribution of surface albedo to SM downscaling over the Tibetan Plateau. This is mainly a result of the very weak correlation between SM and surface albedo at the microwave and MODIS scales (Table 6). Nevertheless, surface albedo added into the BPNN could further increase the downscaled performance, which will be tested in our future study.
Even though the original errors of the microwave SM products cannot be reduced by SM downscaling [24], the temporal variations of the in-situ SM are well characterized by the downscaling, as indicated by the high r between the BPNN-downscaled SM and the in-situ SM (>0.72) (Table 4). In addition, the r values of the downscaled SM products are less than 0.86 (Table 4). This suggests that the SM downscaling using the BPNN and LST/EVI may have reached the limits of the method, as the method only takes into account the surface temperature and vegetation index [38], without considering the soil temperature, evapotranspiration, surface roughness, vegetation structure, and other factors. The variability in SM is impacted by the variability in atmospheric conditions and land surface characteristics at different spatial scales. The relationship between SM and LST/RSI was assumed scale-invariant for SM downscaling at the microwave and MODIS scales. The scale effect for SM downscaling should be investigated in future studies.
It can be seen from Figure 9 and Table 5 that the SMOS points with a lower RMSE are closer to the in-situ curve, and the AMSR points with a higher RMSE deviate more from the in-situ curve, despite the good temporal variation (r). As a result of the limited anti-interference ability of the BPNN, the BPNN cannot be well trained when there is a large RMSE around the observations. The less the RMSE, the more robust the trained BPNN. Therefore, a lower original RMSE for the SM products results in a higher downscaled r (Table 5) with the same MODIS inputs (LST/EVI) for AMSR (except AMSR2) and D_SMOS downscaling. It should be noted that the MODIS inputs are MYD_LST and MYD_EVI for AMSR and D_SMOS, while the MODIS inputs are MOD_LST and MOD_EVI for A_SMOS. Due to the lower RMSE of the SMOS products, the downscaled r of SMOS should be higher than the downscaled r of AMSR. However, the downscaled r of A_SMOS is the poorest (Figure 9 and Table 5), which is mainly because the surface energy balance is more likely to be water-limited in the afternoon (AMSR and D_SMOS) and the LST is more tightly coupled to the SM than in the morning (A_SMOS) [4]. Therefore, the SM downscaling relationship simulated by the BPNN and LST/EVI using morning MODIS LST would be worse than that using afternoon MODIS LST.
6. Conclusions
The evaluation of the multiple downscaled microwave SM products is of vital importance for both regional- and local-scale studies and applications. In this study, the BPNN was utilized for the SM downscaling as the BPNN can sufficiently simulate the nonlinear relationship between SM and LST/RSI. The SM products of three passive microwave satellites, i.e., AMSR-E, AMSR2, and SMOS, were downscaled from the microwave scale (25 km) to the MODIS scale (1 km). To select an appropriate RSI for the SM downscaling, various RSIs, including NDVI, EVI, and three kinds of NDWI, were investigated in this research. SM downscaling was implemented from 1 August 2010 to 31 December 2012, and the in-situ SM data from 56 stations of the SMTMN were used to evaluate the microwave and downscaled SM products over Naqu in the Central Tibetan Plateau.
The downscaling shows a number of differences between the different microwave SM products and LST/RSI combinations. The correlation coefficient (r) of the BPNN-downscaled SM is better than the regression-downscaled SM. However, the downscaled RMSE and bias are comparable between the BPNN downscaling and the regression downscaling for each microwave SM product. LST/EVI is the most suitable combination for SM downscaling, obtaining the maximum downscaled r among the LST/RSI combinations for the BPNN and most of the regression downscaling approaches. Based on the optimal SM downscaling combination, the differences between the various BPNN-downscaled SM products and the discrepancies between the microwave and BPNN-downscaled SM products were further investigated. The temporal variations of the multiple BPNN-downscaled SM products show a good consistency with the in-situ SM (r > 0.72). For the AMSR products (except AMSR2) and the descending node of SMOS, the original RMSE of each SM product results in a higher downscaled r. Among the six BPNN-downscaled SM products, the performance of the downscaled D_SMOS product is the best, with r = 0.859, RMSE = 0.052 m3/m3, and bias = −0.011 m3/m3. The BPNN-downscaled SM products are greatly dependent on the original microwave SM products, and the difference in temporal accuracy between the downscaled and microwave SM products is marginal. We conclude that the BPNN-downscaled SM products with a fine resolution could be widely used for both regional and local research.
Acknowledgments
This work was supported by the National Natural Science Foundation of China (grant no. 41422108), the Natural Science Foundation of Hubei Province (grant no. 2015CFA002), and the Cross-disciplinary Collaborative Teams Program for Science, Technology, and Innovation of the Chinese Academy of Sciences.
Author Contributions
The research topic was designed by H.J. and H.S. H.J. performed the research and wrote the manuscript. H.S., H.L., F.L., W.G., and L.Z. checked the experimental data, examined the experimental results, and participated in the revision of the manuscript.
Conflicts of Interest
The authors declare no conflict of interest.
References
- Das, N.N.; Entekhabi, D.; Njoku, E.G. An algorithm for merging SMAP radiometer and radar data for high-resolution soil-moisture retrieval. IEEE Trans. Geosci. Remote Sens. 2011, 49, 1504–1512. [Google Scholar] [CrossRef]
- Kim, S.; Liu, Y.Y.; Johnson, F.M.; Parinussa, R.M.; Sharma, A. A global comparison of alternate AMSR2 soil moisture products: Why do they differ? Remote Sens. Environ. 2015, 161, 43–62. [Google Scholar] [CrossRef]
- Al-Yaari, A.; Wigneron, J.P.; Ducharne, A.; Kerr, Y.; de Rosnay, P.; de Jeu, R.; Govind, A.; Al Bitar, A.; Albergel, C.; Muñoz-Sabater, J.; et al. Global-scale evaluation of two satellite-based passive microwave soil moisture datasets (SMOS and AMSR-E) with respect to land data assimilation system estimates. Remote Sens. Environ. 2014, 149, 181–195. [Google Scholar] [CrossRef]
- Piles, M.; Sanchez, N.; Vall-llossera, M.; Camps, A.; Martinez-Fernandez, J.; Martinez, J.; Gonzalez-Gambau, V. A downscaling approach for SMOS land observations: Evaluation of high-resolution soil moisture maps over the Iberian Peninsula. IEEE J. Sel. Top. Appl. Earth Obs. Remote Sens. 2014, 7, 3845–3857. [Google Scholar] [CrossRef]
- Chauhan, N.S.; Miller, S.; Ardanuy, P. Spaceborne soil moisture estimation at high resolution: A microwave-optical/IR synergistic approach. Int. J. Remote Sens. 2003, 24, 4599–4622. [Google Scholar] [CrossRef]
- Choi, M.; Hur, Y. A microwave-optical/infrared disaggregation for improving spatial representation of soil moisture using AMSR-E and MODIS products. Remote Sens. Environ. 2012, 124, 259–269. [Google Scholar] [CrossRef]
- Merlin, O.; Al Bitar, A.; Walker, J.P.; Kerr, Y. An improved algorithm for disaggregating microwave-derived soil moisture based on red, near-infrared and thermal-infrared data. Remote Sens. Environ. 2010, 114, 2305–2316. [Google Scholar] [CrossRef]
- Merlin, O.; Walker, J.P.; Chehbouni, A.; Kerr, Y. Towards deterministic downscaling of SMOS soil moisture using MODIS derived soil evaporative efficiency. Remote Sens. Environ. 2008, 112, 3935–3946. [Google Scholar] [CrossRef]
- Peng, J.; Loew, A.; Zhang, S.; Wang, J. Spatial downscaling of satellite soil moisture data using a vegetation temperature condition index. IEEE Trans. Geosci. Remote Sens. 2016, 54, 1–9. [Google Scholar] [CrossRef]
- Song, C.; Jia, L.; Menenti, M. Retrieving high-resolution surface soil moisture by downscaling AMSR-E brightness temperature using MODIS LST and NDVI data. IEEE J. Sel. Top. Appl. Earth Obs. Remote Sens. 2014, 7, 935–942. [Google Scholar] [CrossRef]
- Wang, J.; Ling, Z.; Wang, Y.; Zeng, H. Improving spatial representation of soil moisture by integration of microwave observations and the temperature–vegetation–drought index derived from MODIS products. ISPRS J. Photogramm. Remote Sens. 2016, 113, 144–154. [Google Scholar] [CrossRef]
- Chen, N.; He, Y.; Zhang, X. Nir-red spectra-based disaggregation of SMAP soil moisture to 250 m resolution based on smapex-4/5 in southeastern Australia. Remote Sens. 2017, 9. [Google Scholar] [CrossRef]
- Kim, J.; Hogue, T.S. Improving spatial soil moisture representation through integration of AMSR-E and MODIS products. IEEE Trans. Geosci. Remote Sens. 2012, 50, 446–460. [Google Scholar] [CrossRef]
- Liu, Y.Y.; Dorigo, W.A.; Parinussa, R.M.; de Jeu, R.A.M.; Wagner, W.; McCabe, M.F.; Evans, J.P.; van Dijk, A.I.J.M. Trend-preserving blending of passive and active microwave soil moisture retrievals. Remote Sens. Environ. 2012, 123, 280–297. [Google Scholar] [CrossRef]
- Tomer, S.; Al Bitar, A.; Sekhar, M.; Zribi, M.; Bandyopadhyay, S.; Kerr, Y. MAPSM: A spatio-temporal algorithm for merging soil moisture from active and passive microwave remote sensing. Remote Sens. 2016, 8. [Google Scholar] [CrossRef]
- Ranney, K.J.; Niemann, J.D.; Lehman, B.M.; Green, T.R.; Jones, A.S. A method to downscale soil moisture to fine resolutions using topographic, vegetation, and soil data. Adv. Water Resour. 2015, 76, 81–96. [Google Scholar] [CrossRef]
- Carlson, T.N.; Gillies, R.R.; Perry, E.M. A method to make use of thermal infrared temperature and NDVI measurements to infer surface soil water content and fractional vegetation cover. Remote Sens. Rev. 1994, 9, 161–173. [Google Scholar] [CrossRef]
- Ray, R.L.; Jacobs, J.M.; Cosh, M.H. Landslide susceptibility mapping using downscaled AMSR-E soil moisture: A case study from Cleveland corral, California, US. Remote Sens. Environ. 2010, 114, 2624–2636. [Google Scholar] [CrossRef]
- Sánchez-Ruiz, S.; Piles, M.; Sánchez, N.; Martínez-Fernández, J.; Vall-Llossera, M.; Camps, A. Combining SMOS with visible and near/shortwave/thermal infrared satellite data for high resolution soil moisture estimates. J. Hydrol. 2014, 516, 273–283. [Google Scholar] [CrossRef]
- Merlin, O.; Rudiger, C.; Al Bitar, A.; Richaume, P.; Walker, J.P.; Kerr, Y.H. Disaggregation of SMOS soil moisture in southeastern Australia. IEEE Trans. Geosci. Remote Sens. 2012, 50, 1556–1571. [Google Scholar] [CrossRef]
- Piles, M.; Petropoulos, G.P.; Sánchez, N.; González-Zamora, Á.; Ireland, G. Towards improved spatio-temporal resolution soil moisture retrievals from the synergy of SMOS and MSG SEVIRI spaceborne observations. Remote Sens. Environ. 2016, 180, 403–417. [Google Scholar] [CrossRef]
- Lei, F.; Crow, W.; Shen, H.; Parinussa, R.; Holmes, T. The impact of local acquisition time on the accuracy of microwave surface soil moisture retrievals over the contiguous United States. Remote Sens. 2015, 7, 13448–13465. [Google Scholar] [CrossRef]
- Zeng, J.; Li, Z.; Chen, Q.; Bi, H.; Qiu, J.; Zou, P. Evaluation of remotely sensed and reanalysis soil moisture products over the Tibetan plateau using in-situ observations. Remote Sens. Environ. 2015, 163, 91–110. [Google Scholar] [CrossRef]
- Zhao, W.; Li, A. A comparison study on empirical microwave soil moisture downscaling methods based on the integration of microwave-optical/IR data on the Tibetan plateau. Int. J. Remote Sens. 2015, 36, 4986–5002. [Google Scholar] [CrossRef]
- Qin, J.; Yang, K.; Lu, N.; Chen, Y.; Zhao, L.; Han, M. Spatial upscaling of in-situ soil moisture measurements based on MODIS-derived apparent thermal inertia. Remote Sens. Environ. 2013, 138, 1–9. [Google Scholar] [CrossRef]
- Zhao, L.; Yang, K.; Qin, J.; Chen, Y.; Tang, W.; Montzka, C.; Wu, H.; Lin, C.; Han, M.; Vereecken, H. Spatiotemporal analysis of soil moisture observations within a Tibetan mesoscale area and its implication to regional soil moisture measurements. J. Hydrol. 2013, 482, 92–104. [Google Scholar] [CrossRef]
- Zhao, L.; Yang, K.; Qin, J.; Chen, Y.; Tang, W.; Lu, H.; Yang, Z.-L. The scale-dependence of SMOS soil moisture accuracy and its improvement through land data assimilation in the central Tibetan plateau. Remote Sens. Environ. 2014, 152, 345–355. [Google Scholar] [CrossRef]
- Yang, K.; Qin, J.; Zhao, L.; Chen, Y.; Han, M. A multi-scale soil moisture and freeze-thaw monitoring network on the third pole. Bull. Am. Meteorol. Soc. 2013, 94, 1907–1916. [Google Scholar] [CrossRef]
- Jackson, T.J.; Cosh, M.H.; Bindlish, R.; Starks, P.J.; Bosch, D.D.; Seyfried, M.; Goodrich, D.C.; Moran, M.S.; Du, J. Validation of advanced microwave scanning radiometer soil moisture products. IEEE Trans. Geosci. Remote Sens. 2010, 48, 4256–4272. [Google Scholar] [CrossRef]
- Njoku, E.G.; Chan, S.K. Vegetation and surface roughness effects on AMSR-E land observations. Remote Sens. Environ. 2006, 100, 190–199. [Google Scholar] [CrossRef]
- Owe, M.; de Jeu, R.; Walker, J. A methodology for surface soil moisture and vegetation optical depth retrieval using the microwave polarization difference index. IEEE Trans. Geosci. Remote Sens. 2001, 39, 1643–1654. [Google Scholar] [CrossRef]
- Owe, M.; de Jeu, R.; Holmes, T. Multisensor historical climatology of satellite-derived global land surface moisture. J. Geophys. Res. 2008, 113. [Google Scholar] [CrossRef]
- Lu, H.; Koike, T.; Fujii, H.; Ohta, T.; Tamagawa, K. Development of a physically-based soil moisture retrieval algorithm for spaceborne passive microwave radiometers and its application to AMSR-E. J. Remote Sens. Soc. Jpn. 2009, 29, 253–262. [Google Scholar]
- Mai, M.R.; Zhang, B.; Li, X.F.; Hwang, P.A.; Zhang, J.A. Application of AMSR-E and AMSR2 low-frequency channel brightness temperature data for hurricane wind retrievals. IEEE Trans. Geosci. Remote Sens. 2016, 54, 4501–4512. [Google Scholar] [CrossRef]
- Kerr, Y.H.; Waldteufel, P.; Richaume, P.; Wigneron, J.P.; Ferrazzoli, P.; Mahmoodi, A.; Al Bitar, A.; Cabot, F.; Gruhier, C.; Juglea, S.E.; et al. The SMOS soil moisture retrieval algorithm. IEEE Trans. Geosci. Remote Sens. 2012, 50, 1384–1403. [Google Scholar] [CrossRef]
- Mo, T.; Choudhury, B.J.; Schmugge, T.J.; Wang, J.R.; Jackson, T.J. A model for microwave emission from vegetation-covered fields. J. Geophys. Res. Oceans Atmos. 1982, 87, 1229–1237. [Google Scholar] [CrossRef]
- Liang, S. Narrowband to broadband conversions of land surface albedo I: Algorithms. Remote Sens. Environ. 2001, 76, 213–238. [Google Scholar] [CrossRef]
- Carlson, T. An overview of the “triangle method” for estimating surface evapotranspiration and soil moisture from satellite imagery. Sensors 2007, 7, 1612–1629. [Google Scholar] [CrossRef]
Figure 1.
Location of the central Tibetan Plateau Soil Moisture/Temperature Monitoring Network (SMTMN) at Naqu. The black triangles indicate the in-situ soil moisture (SM) stations.
Figure 1.
Location of the central Tibetan Plateau Soil Moisture/Temperature Monitoring Network (SMTMN) at Naqu. The black triangles indicate the in-situ soil moisture (SM) stations.
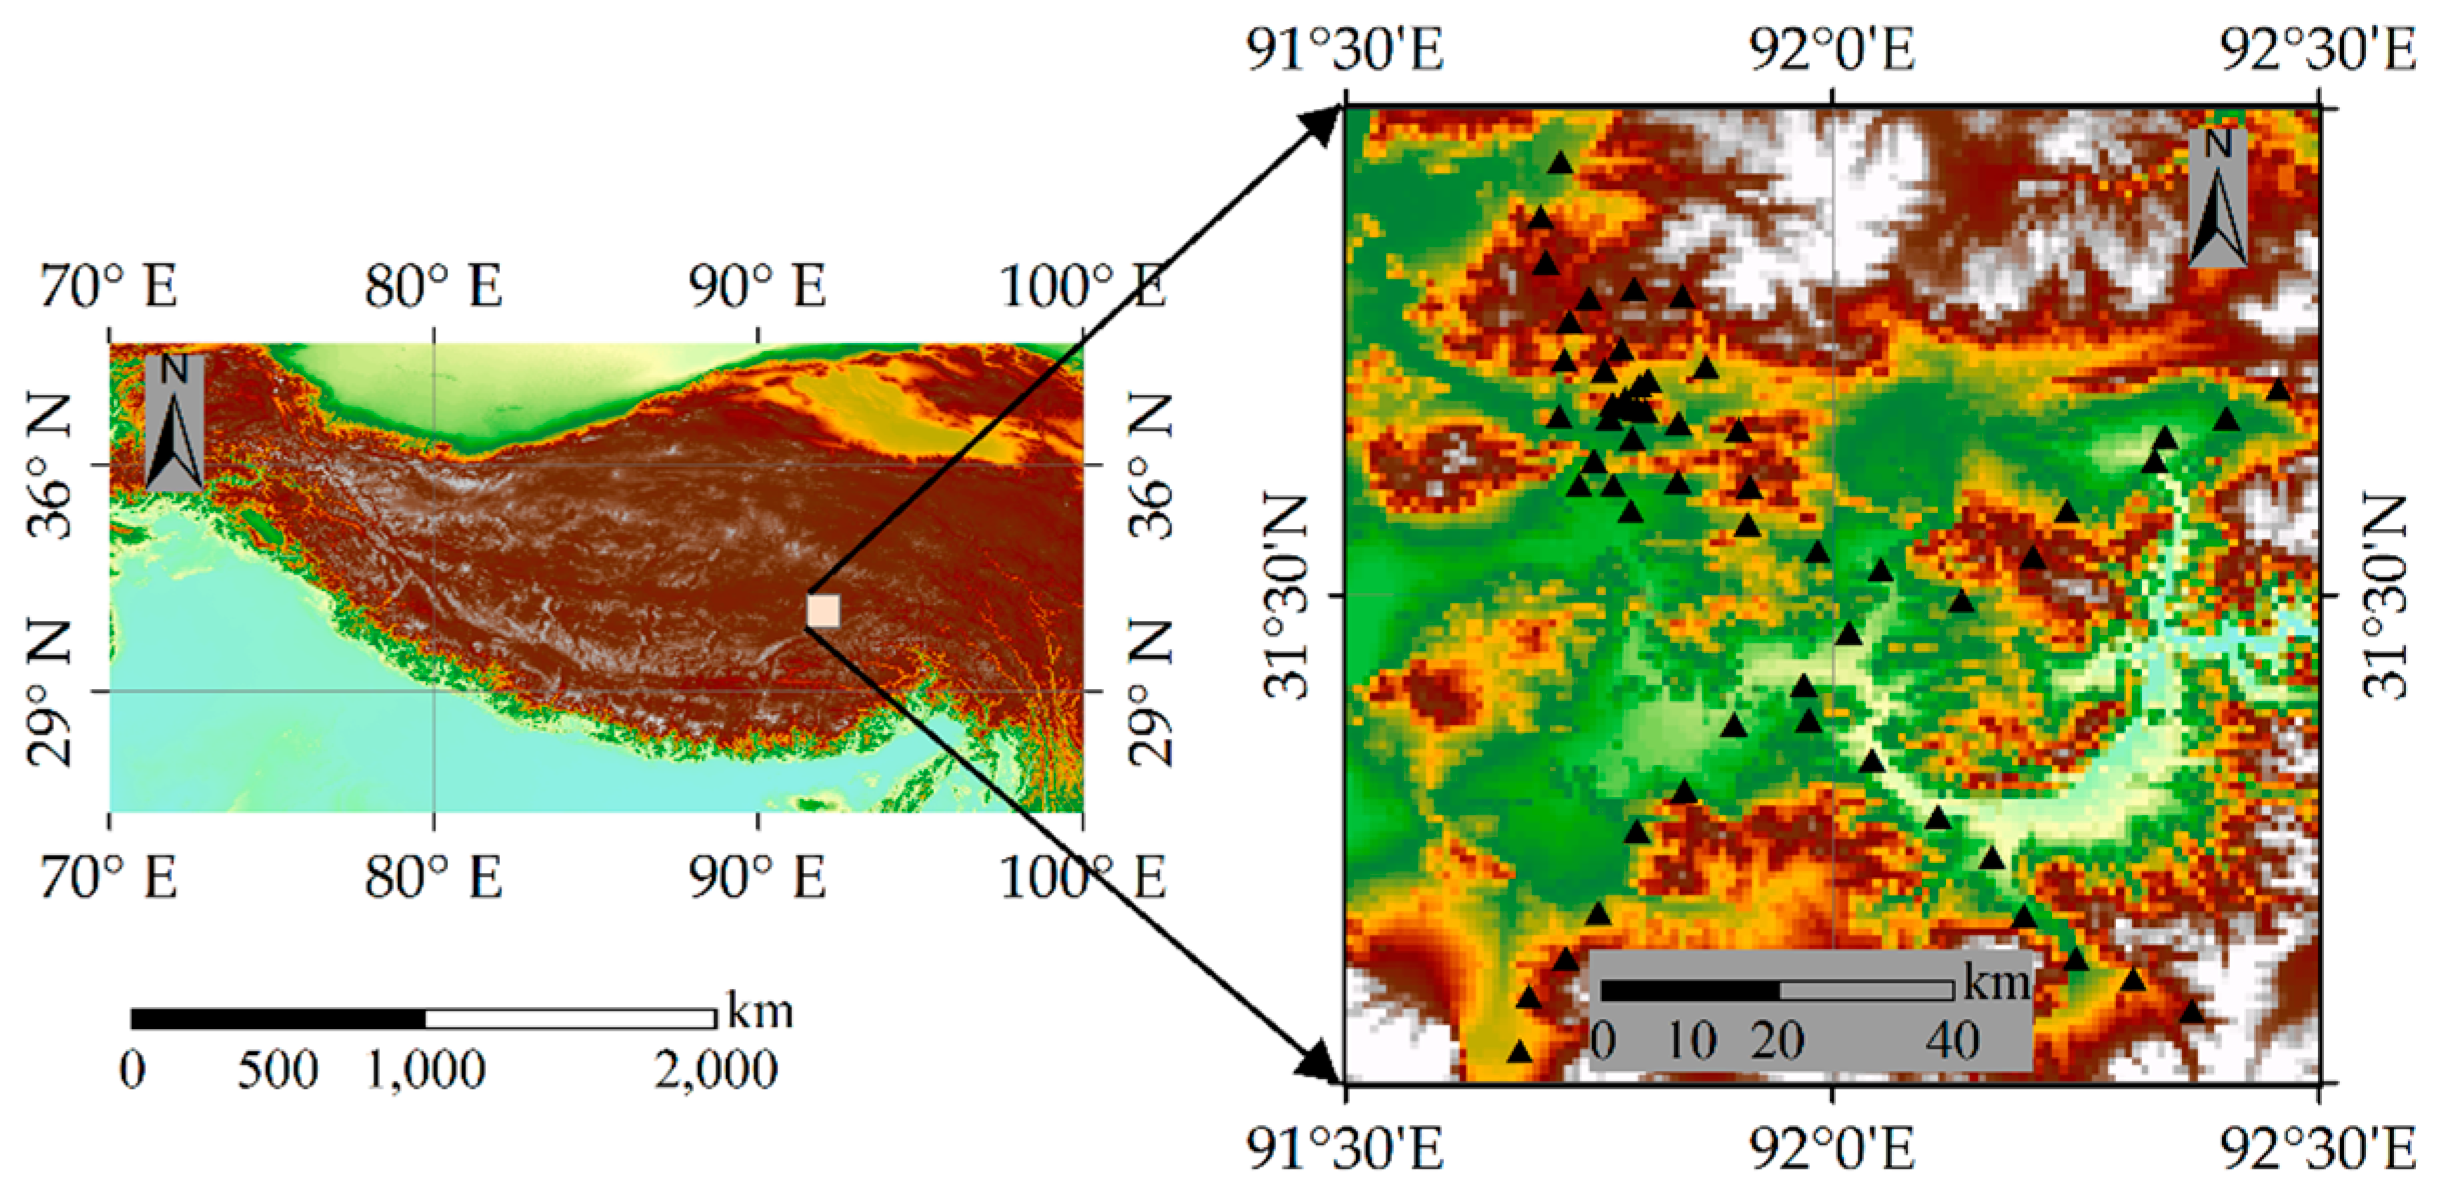
Figure 2.
Schematic structure of back-propagation neural network (BPNN) downscaling. The hidden layer is shown in the red box.
Figure 2.
Schematic structure of back-propagation neural network (BPNN) downscaling. The hidden layer is shown in the red box.
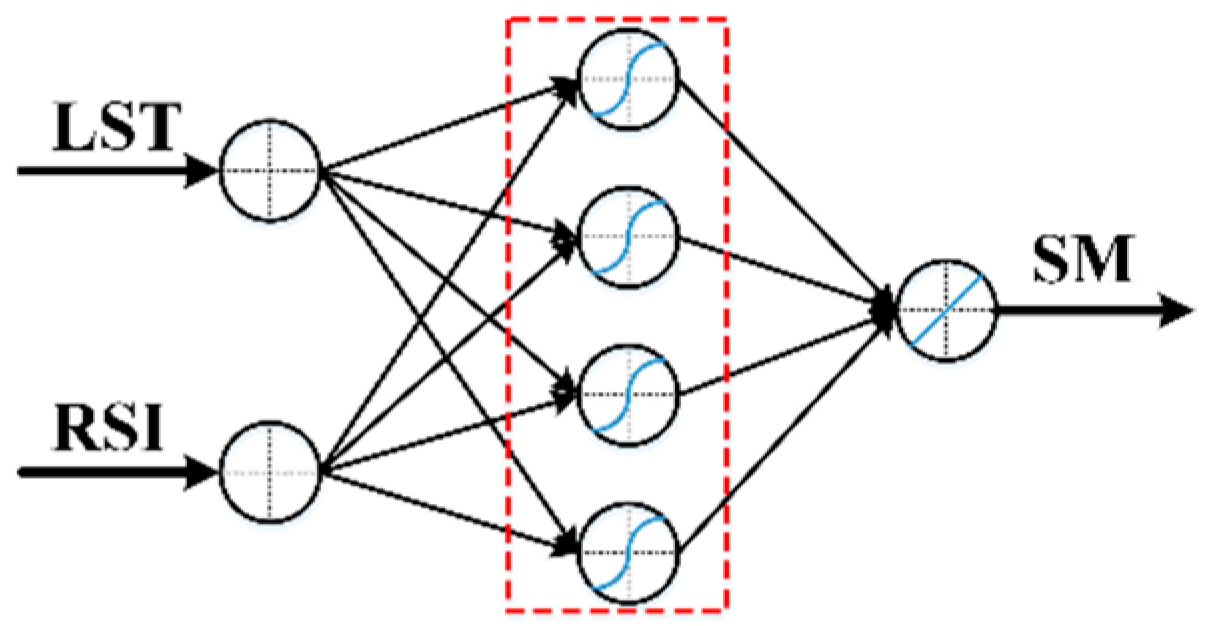
Figure 3.
BPNN training (a) and validation (b) with various numbers of neurons. Remote sensing indexes (RSIs) indicates the land surface temperature (LST)/RSI combination.
Figure 3.
BPNN training (a) and validation (b) with various numbers of neurons. Remote sensing indexes (RSIs) indicates the land surface temperature (LST)/RSI combination.

Figure 4.
BPNN training (a) and validation (b) with various numbers of epochs. RSI indicates the LST/RSI combination.
Figure 4.
BPNN training (a) and validation (b) with various numbers of epochs. RSI indicates the LST/RSI combination.

Figure 5.
Statistical evaluations of the downscaled SM products at the MODIS scale.
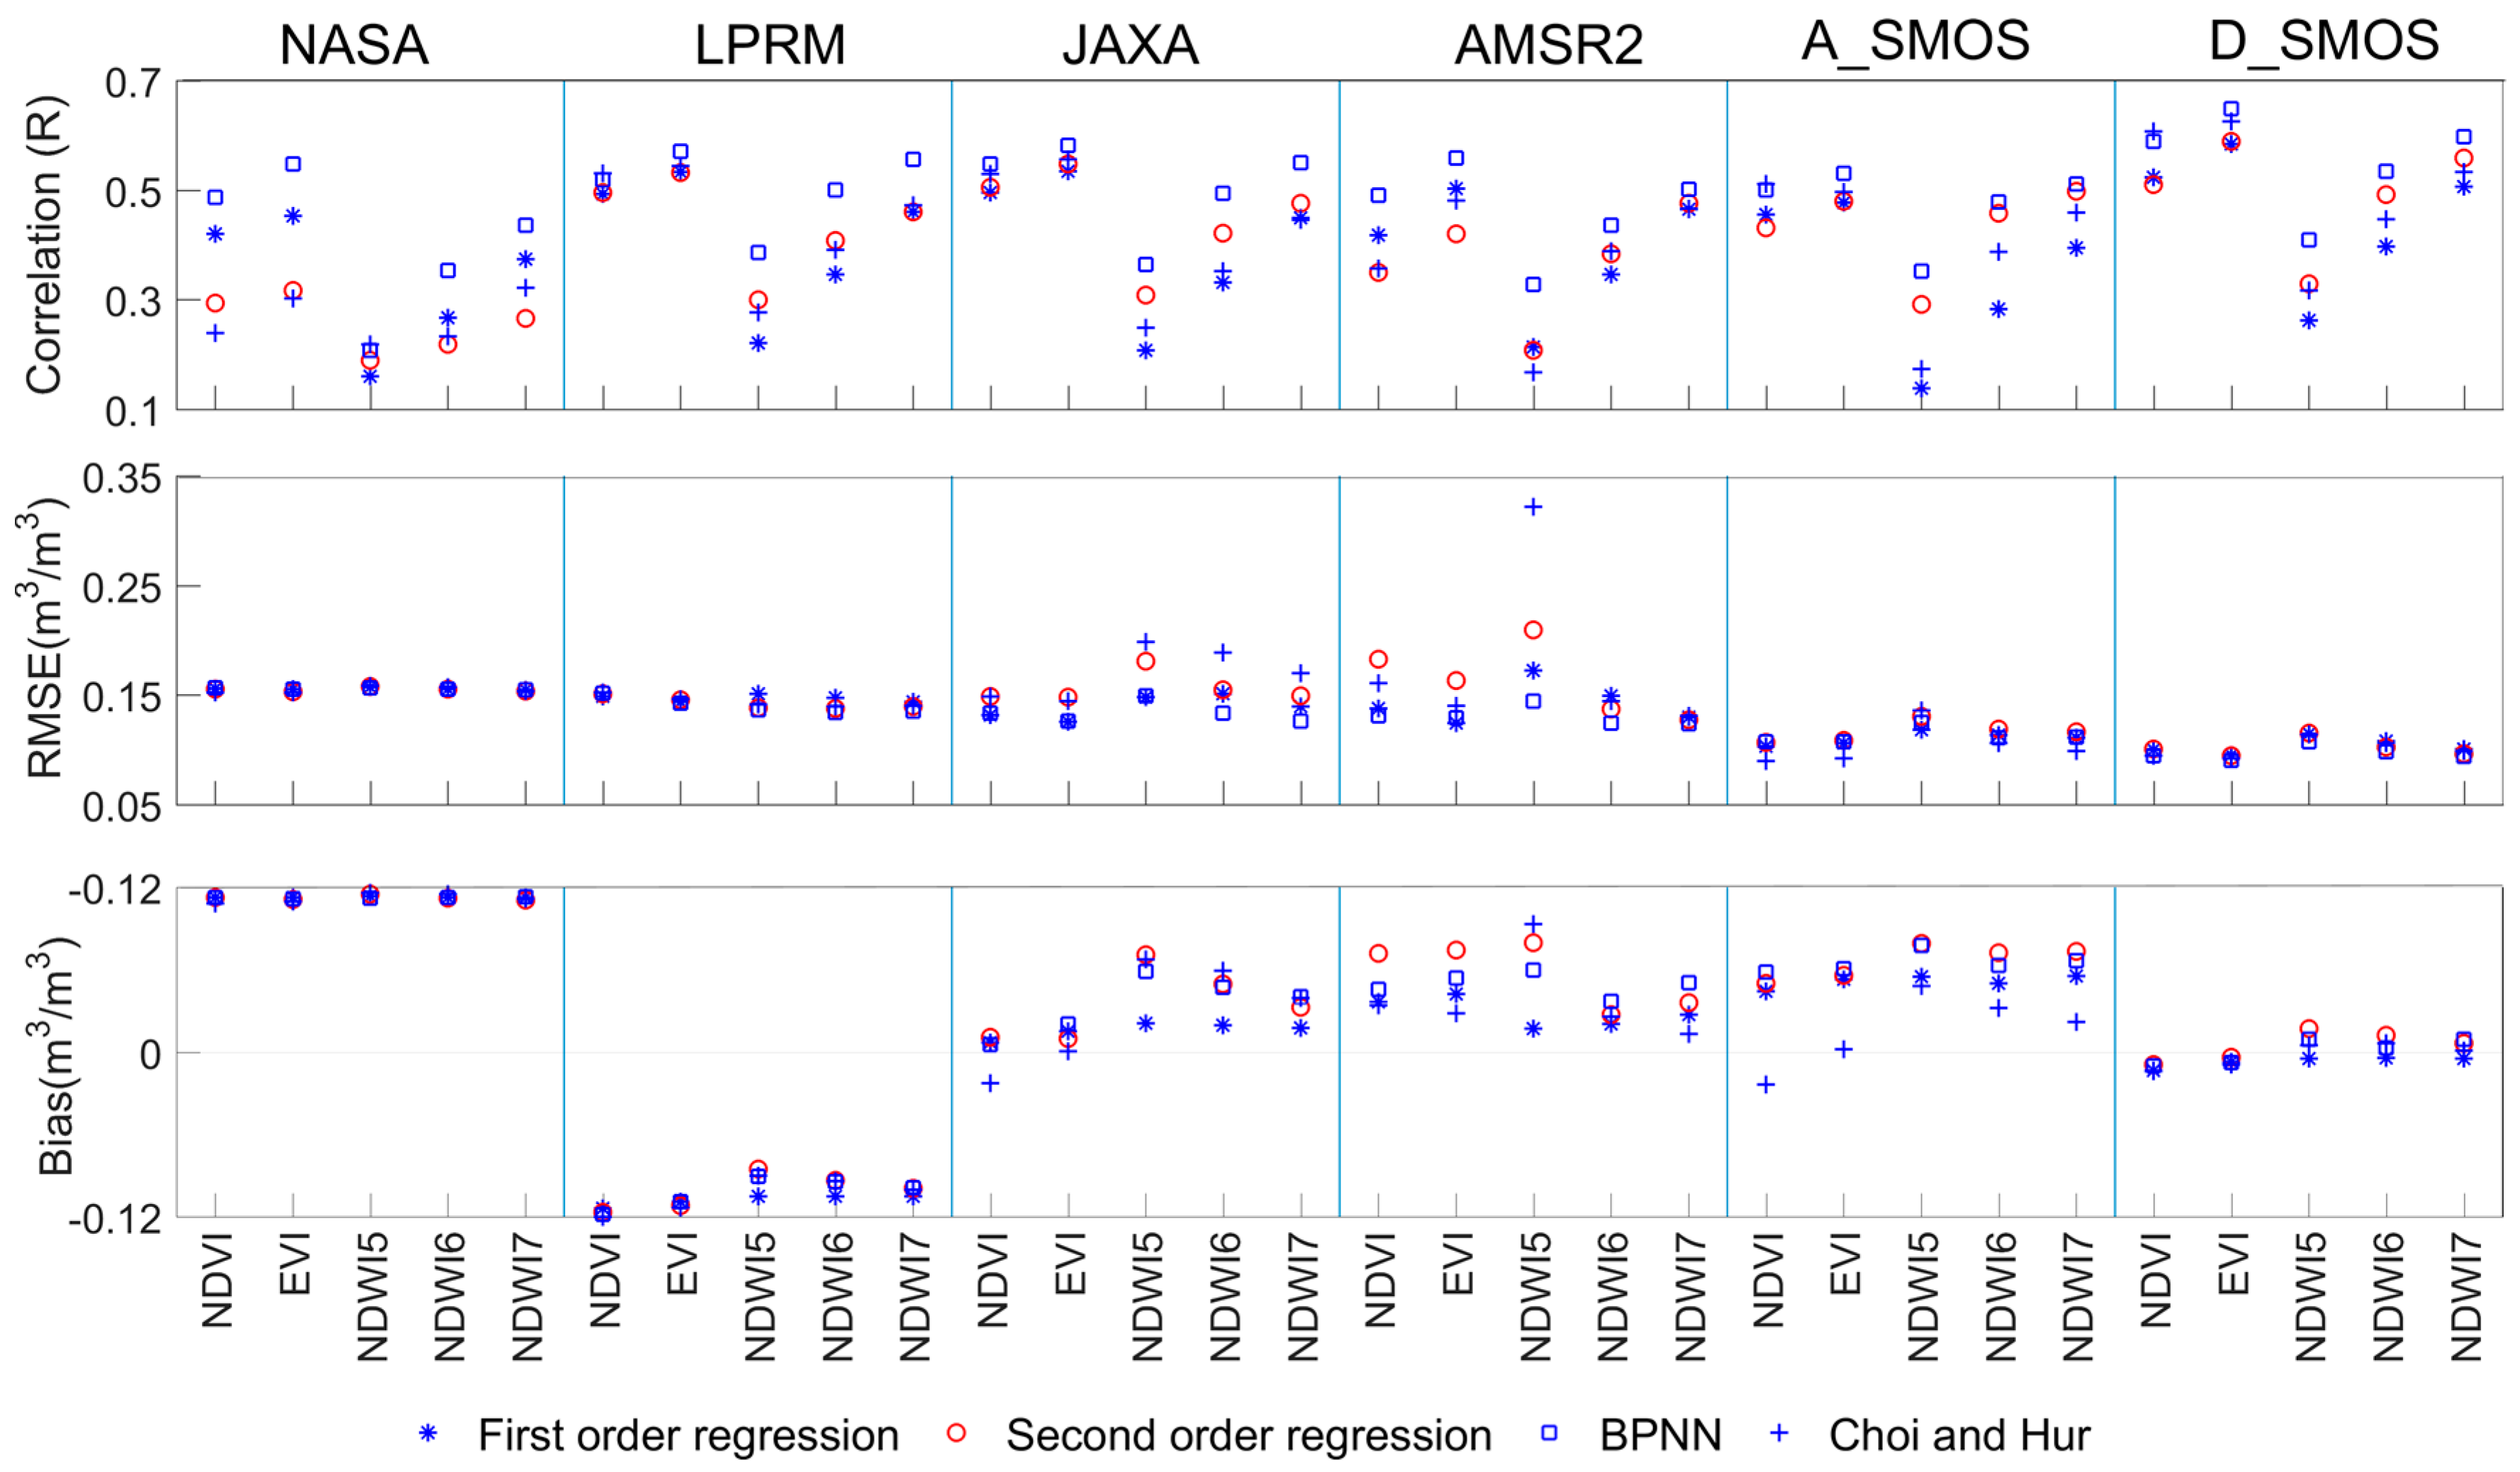
Figure 6.
Maps of the MODIS enhanced vegetation index (EVI). /LST (a–d) and the multiple downscaled SM products (e–j) with a 1-km resolution for 9 September 2011.
Figure 6.
Maps of the MODIS enhanced vegetation index (EVI). /LST (a–d) and the multiple downscaled SM products (e–j) with a 1-km resolution for 9 September 2011.
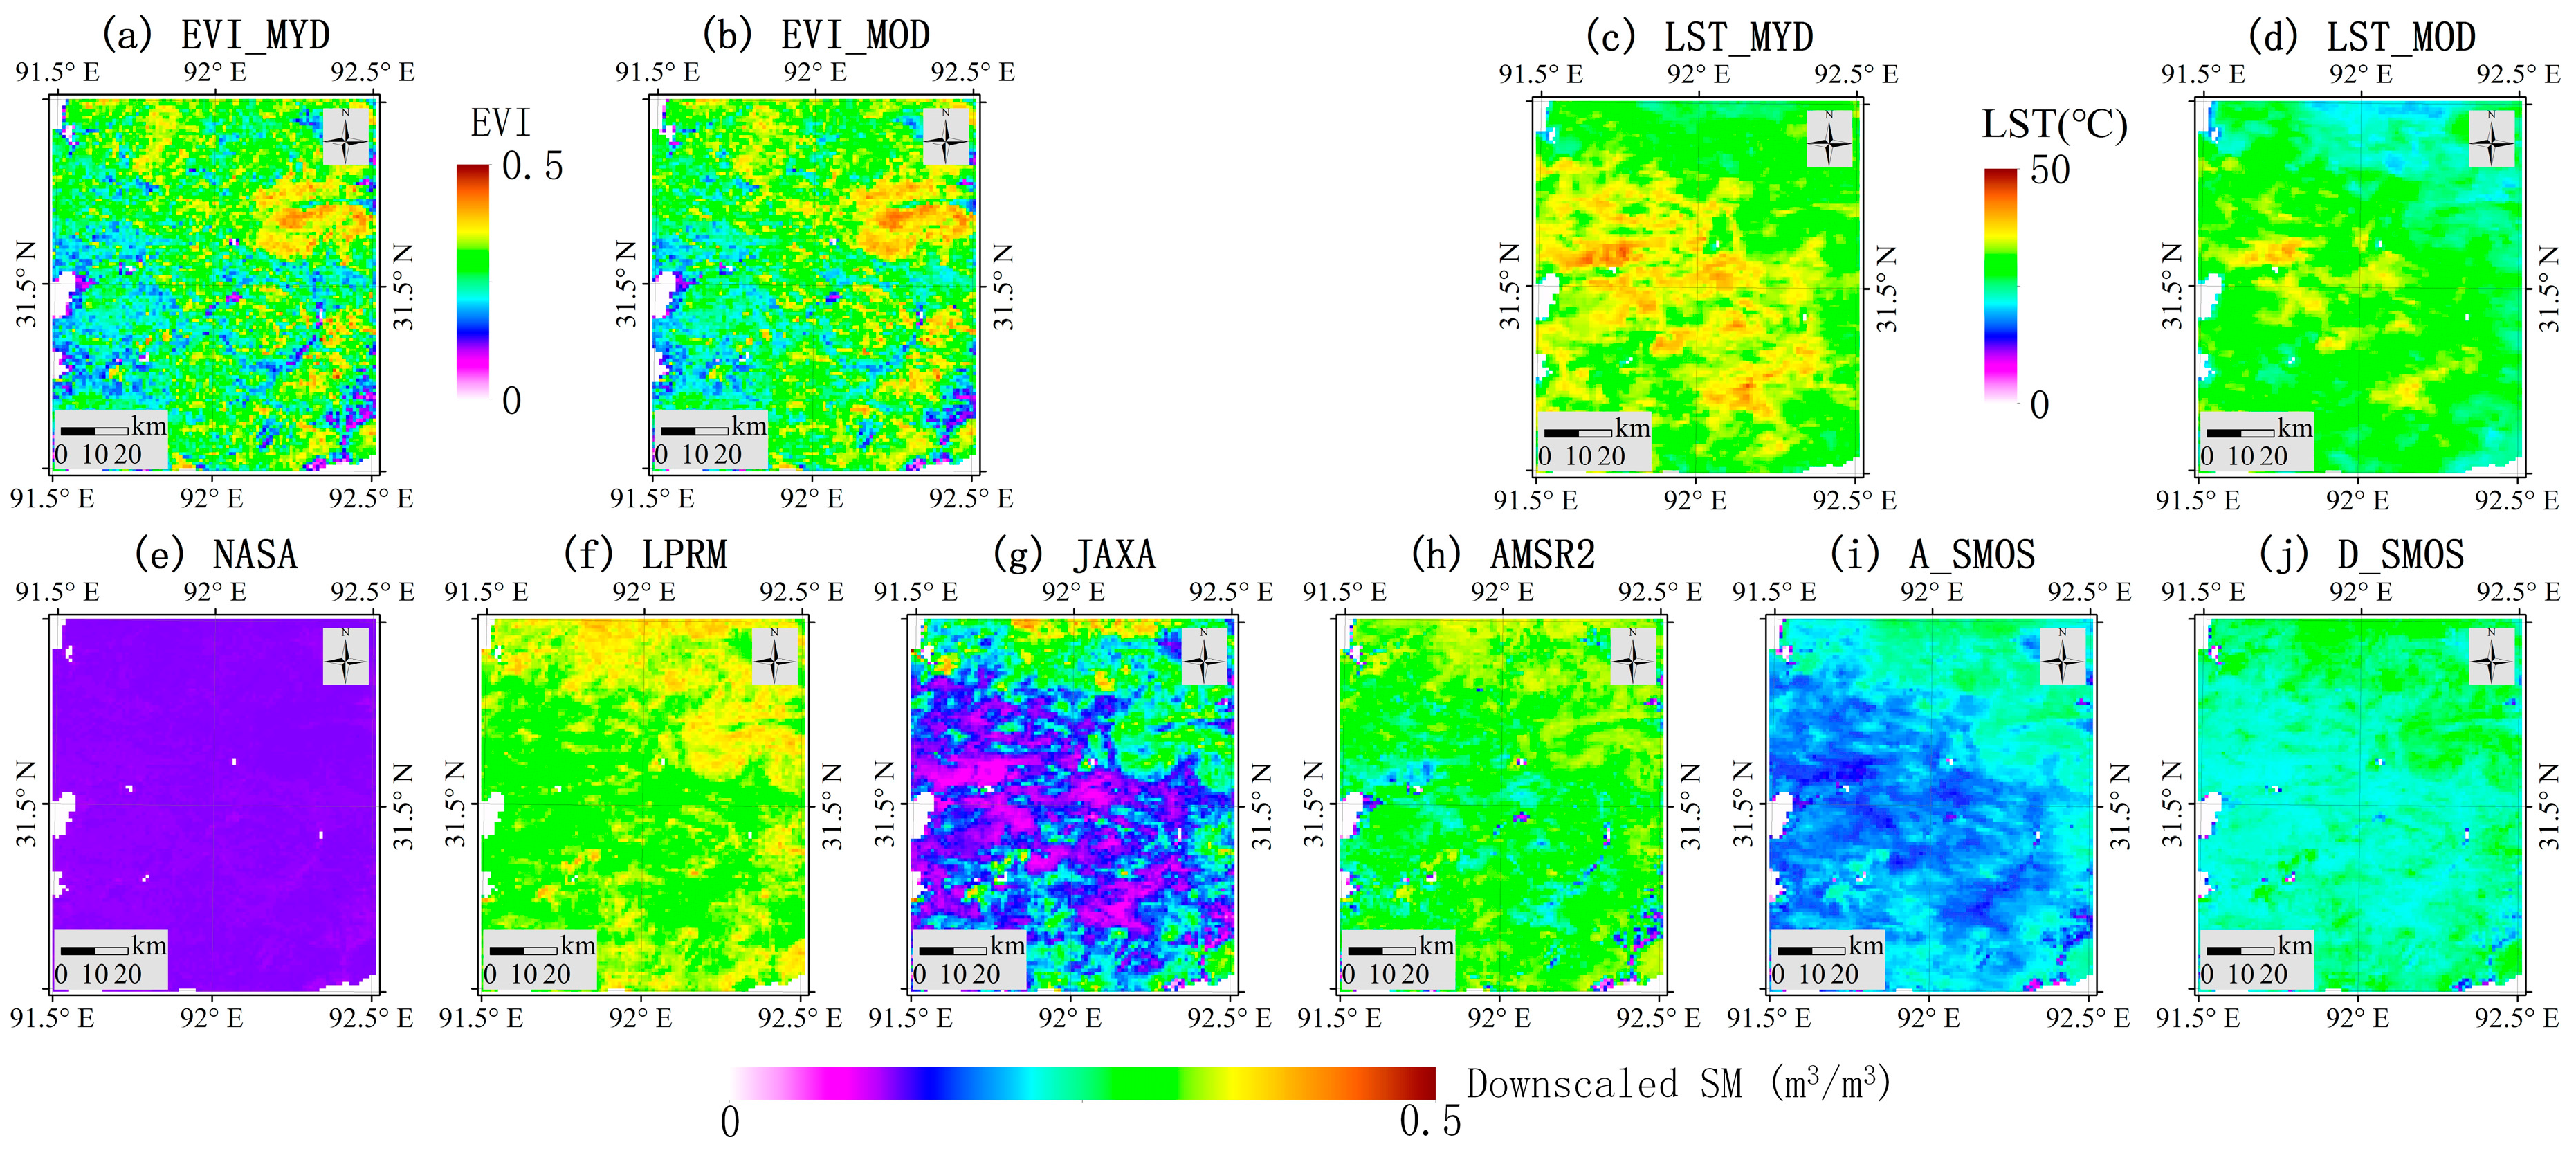
Figure 7.
The station-averaged in-situ SM (at 6:00 a.m.) and area-averaged downscaled SM products at the SMTMN scale during unfrozen periods.
Figure 7.
The station-averaged in-situ SM (at 6:00 a.m.) and area-averaged downscaled SM products at the SMTMN scale during unfrozen periods.

Figure 8.
Taylor diagram displaying a statistical comparison of the different BPNN-downscaled SM products against in-situ SM at the SMTMN scale. cRMSE indicates the normalized centered RMSE by dividing the standard deviation of the in-situ SM.
Figure 8.
Taylor diagram displaying a statistical comparison of the different BPNN-downscaled SM products against in-situ SM at the SMTMN scale. cRMSE indicates the normalized centered RMSE by dividing the standard deviation of the in-situ SM.
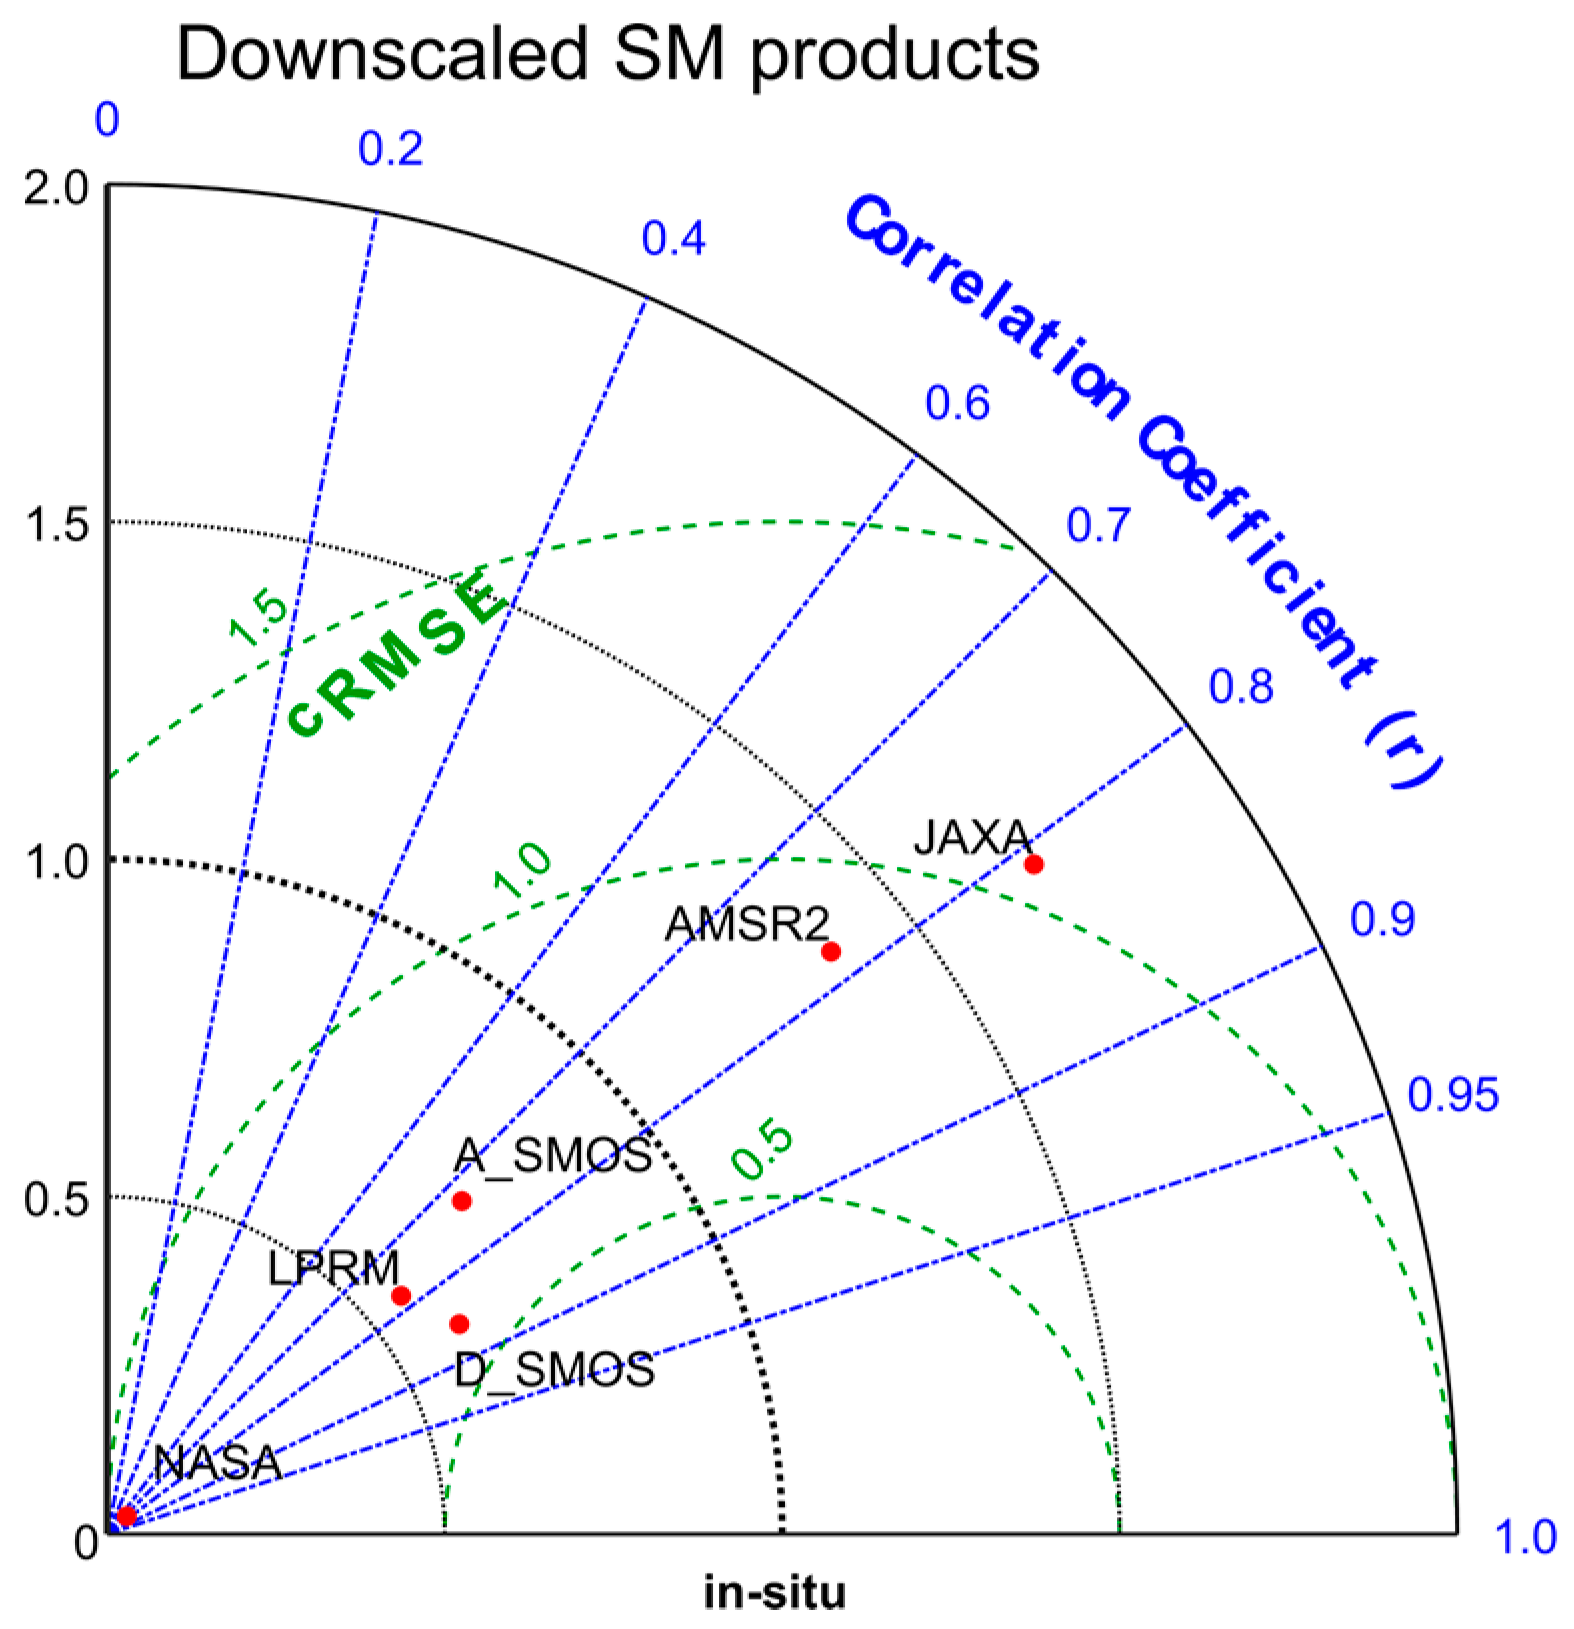
Figure 9.
Temporal comparison between microwave and downscaled SM products at the SMTMN scale.


Table 1.
Filtering criteria for the microwave SM and Moderate Resolution Imaging Spectro-radiometer (MODIS) products.
Table 1.
Filtering criteria for the microwave SM and Moderate Resolution Imaging Spectro-radiometer (MODIS) products.
| Filtering Criteria | |
|---|---|
| SM | SM > 0.7 m3/m3 was excluded; and SMOS SM pixels with a DQX of greater than 0.06 were also excluded |
| LST | LST < 0 was excluded |
| NDVI | NDVI < 0 was excluded as a negative NDVI indicates an invalid SM |
| NDWI | NDWI > 1 or NDWI < −1 were excluded as they are out of the valid range of the NDWI |
| Date | SM and MODIS products in frozen periods (1 December to 31 March next year) were excluded |
Table 2.
The total number of samples for BPNN training (microwave scale) and downscaling (MODIS scale).
Table 2.
The total number of samples for BPNN training (microwave scale) and downscaling (MODIS scale).
| Microwave Scale (Training) | MODIS Scale (Downscaling) | ||
|---|---|---|---|
| Training Dataset (80%) | Validation Dataset (20%) | MODIS Dataset | |
| NASA | 574 | 143 | 5499 |
| JAXA | 365 | 92 | 5499 |
| LPRM | 632 | 158 | 5499 |
| AMSR2 | 230 | 58 | 5499 |
| A_SMOS | 751 | 188 | 8010 |
| D_SMOS | 447 | 112 | 5434 |
Table 3.
Downscaled r at the MODIS scale. The maximum values for each method and each RSI are in bold.
Table 3.
Downscaled r at the MODIS scale. The maximum values for each method and each RSI are in bold.
| NASA | LPRM | JAXA | AMSR2 | A_SMOS | D_SMOS | ||
|---|---|---|---|---|---|---|---|
| First-order regression | NDVI | 0.420 | 0.493 | 0.495 | 0.418 | 0.455 | 0.523 |
| EVI | 0.453 | 0.533 | 0.535 | 0.502 | 0.477 | 0.584 | |
| NDWI5 | 0.161 | 0.221 | 0.208 | 0.214 | 0.138 | 0.262 | |
| NDWI6 | 0.267 | 0.347 | 0.331 | 0.346 | 0.283 | 0.397 | |
| NDWI7 | 0.374 | 0.460 | 0.449 | 0.465 | 0.394 | 0.507 | |
| Second-order regression | NDVI | 0.293 | 0.495 | 0.505 | 0.350 | 0.431 | 0.510 |
| EVI | 0.316 | 0.532 | 0.548 | 0.420 | 0.480 | 0.589 | |
| NDWI5 | 0.190 | 0.300 | 0.308 | 0.207 | 0.291 | 0.329 | |
| NDWI6 | 0.218 | 0.408 | 0.421 | 0.383 | 0.458 | 0.491 | |
| NDWI7 | 0.265 | 0.461 | 0.476 | 0.475 | 0.498 | 0.559 | |
| Choi and Hur | NDVI | 0.239 | 0.531 | 0.529 | 0.357 | 0.511 | 0.608 |
| EVI | 0.302 | 0.544 | 0.556 | 0.481 | 0.497 | 0.625 | |
| NDWI5 | 0.218 | 0.276 | 0.249 | 0.165 | 0.173 | 0.317 | |
| NDWI6 | 0.233 | 0.391 | 0.351 | 0.388 | 0.387 | 0.447 | |
| NDWI7 | 0.322 | 0.472 | 0.445 | 0.466 | 0.459 | 0.533 | |
| BPNN | NDVI | 0.487 | 0.519 | 0.548 | 0.490 | 0.500 | 0.589 |
| EVI | 0.547 | 0.571 | 0.582 | 0.558 | 0.531 | 0.649 | |
| NDWI5 | 0.208 | 0.386 | 0.365 | 0.328 | 0.352 | 0.409 | |
| NDWI6 | 0.354 | 0.500 | 0.494 | 0.436 | 0.479 | 0.534 | |
| NDWI7 | 0.436 | 0.556 | 0.550 | 0.501 | 0.512 | 0.597 | |
Table 4.
Statistical evaluation of the different BPNN-downscaled SM products during unfrozen periods at the SMTMN scale.
Table 4.
Statistical evaluation of the different BPNN-downscaled SM products during unfrozen periods at the SMTMN scale.
| NASA | LPRM | JAXA | AMSR2 | A_SMOS | D_SMOS | |
|---|---|---|---|---|---|---|
| r | 0.747 | 0.777 | 0.811 | 0.779 | 0.729 | 0.859 |
| RMSE | 0.134 | 0.124 | 0.087 | 0.076 | 0.074 | 0.052 |
| bias | 0.109 | −0.112 | 0.019 | 0.031 | 0.054 | −0.011 |
| number | 214 | 214 | 213 | 214 | 315 | 214 |
Table 5.
Statistical evaluations of the different BPNN-downscaled products and the corresponding microwave SM products at the SMTMN scale.
Table 5.
Statistical evaluations of the different BPNN-downscaled products and the corresponding microwave SM products at the SMTMN scale.
| Downscaled | Microwave | Number | |||||
|---|---|---|---|---|---|---|---|
| r | RMSE | bias | r | RMSE | bias | ||
| NASA | 0.742 | 0.150 | 0.122 | 0.614 | 0.138 | 0.114 | 84 |
| LPRM | 0.827 | 0.119 | −0.104 | 0.842 | 0.119 | −0.108 | 84 |
| JAXA | 0.851 | 0.081 | −0.023 | 0.877 | 0.118 | −0.012 | 70 |
| AMSR2 | 0.927 | 0.055 | 0.013 | 0.866 | 0.126 | 0.010 | 40 |
| A_SMOS | 0.635 | 0.081 | 0.064 | 0.556 | 0.091 | 0.053 | 106 |
| D_SMOS | 0.884 | 0.047 | −0.009 | 0.830 | 0.051 | −0.010 | 81 |
Table 6.
The correlation (r) between optical/thermal infrared (OTI) data and SM at the microwave scale (microwave SM) and MODIS scale (in-situ SM) for each SM product.
Table 6.
The correlation (r) between optical/thermal infrared (OTI) data and SM at the microwave scale (microwave SM) and MODIS scale (in-situ SM) for each SM product.
| Microwave Scale (Microwave SM) | MODIS Scale (In-Situ SM) | ||||||||
|---|---|---|---|---|---|---|---|---|---|
| NASA | LPRM | JAXA | AMSR2 | A_SMOS | D_SMOS | AMSR | A_SMOS | D_SMOS | |
| LST | −0.021 | 0.181 | 0.182 | 0.503 | 0.147 | 0.217 | 0.1115 | 0.0706 | 0.142 |
| NDVI | 0.116 | 0.560 | 0.648 | 0.591 | 0.375 | 0.389 | 0.482 | 0.442 | 0.526 |
| EVI | 0.144 | 0.619 | 0.699 | 0.627 | 0.495 | 0.426 | 0.540 | 0.475 | 0.591 |
| NDWI5 | 0.312 | 0.342 | 0.455 | 0.607 | 0.226 | 0.164 | 0.166 | 0.095 | 0.186 |
| NDWI6 | 0.336 | 0.536 | 0.656 | 0.657 | 0.268 | 0.319 | 0.316 | 0.243 | 0.351 |
| NDWI7 | 0.333 | 0.635 | 0.719 | 0.655 | 0.307 | 0.384 | 0.447 | 0.375 | 0.487 |
| Albedo | 0.013 | −0.118 | −0.080 | −0.298 | −0.131 | −0.131 | −0.073 | −0.095 | −0.068 |
| number | 717 | 790 | 457 | 288 | 939 | 559 | 5499 | 8010 | 5434 |
© 2017 by the authors. Licensee MDPI, Basel, Switzerland. This article is an open access article distributed under the terms and conditions of the Creative Commons Attribution (CC BY) license (http://creativecommons.org/licenses/by/4.0/).
Share and Cite
MDPI and ACS Style
Jiang, H.; Shen, H.; Li, H.; Lei, F.; Gan, W.; Zhang, L. Evaluation of Multiple Downscaled Microwave Soil Moisture Products over the Central Tibetan Plateau. Remote Sens. 2017, 9, 402. https://doi.org/10.3390/rs9050402
AMA Style
Jiang H, Shen H, Li H, Lei F, Gan W, Zhang L. Evaluation of Multiple Downscaled Microwave Soil Moisture Products over the Central Tibetan Plateau. Remote Sensing. 2017; 9(5):402. https://doi.org/10.3390/rs9050402
Chicago/Turabian StyleJiang, Hongtao, Huanfeng Shen, Huifang Li, Fangni Lei, Wenxia Gan, and Liangpei Zhang. 2017. "Evaluation of Multiple Downscaled Microwave Soil Moisture Products over the Central Tibetan Plateau" Remote Sensing 9, no. 5: 402. https://doi.org/10.3390/rs9050402
Note that from the first issue of 2016, this journal uses article numbers instead of page numbers. See further details here.