Article

Multi-Stack Persistent Scatterer Interferometry Analysis in Wider Athens, Greece

by
Ioannis Papoutsis
1,*,
Charalampos Kontoes
1 and
Demitrios Paradissis
2
1
National Observatory of Athens, Institute for Astronomy, Astrophysics, Space Applications and Remote Sensing, Vas. Pavlou & I. Metaxa, 15236 Penteli, Greece
2
School of Rural and Surveying Engineering, National Technical University of Athens, Iroon Polytechniou 9, 15780 Zografou, Athens, Greece
*
Author to whom correspondence should be addressed.
Remote Sens. 2017, 9(3), 276; https://doi.org/10.3390/rs9030276
Submission received: 18 November 2016 / Revised: 12 February 2017 / Accepted: 8 March 2017 / Published: 21 March 2017

Abstract

:
The wider Athens metropolitan area serves as an interesting setting for conducting geodetic studies. On the one hand, it has a complex regional geotectonic characteristic with several active and blind faults, one of which gave the deadly M w 5.9 Athens earthquake on September 1999. On the other hand, the Greek capital is heavily urbanized, and construction activities have been taking place in the last few decades to address the city’s needs for advanced infrastructures. This work focuses on estimating ground velocities for the wider Athens area in a period spanning two decades, with an extended spatial coverage, increased spatial sampling of the measurements and at high precision. The aim is to deliver to the community a reference geodetic database containing consistent and robust velocity estimates to support further studies for modeling and multi-hazard assessment. The analysis employs advanced persistent scatterer interferometry methods, covering Athens with both ascending and descending ERS-1, ERS-2 and Envisat Synthetic Aperture Radar data, forming six independent interferometric stacks. A methodology is developed and applied to exploit track diversity for decomposing the actual surface velocity field to its vertical and horizontal components and coping with the post-processing of the multi-track big data. Results of the time series analysis reveal that a large area containing the Kifisia municipality experienced non-linear motion; while it had been subsiding in the period 1992–1995 (−12 mm/year), the same area has been uplifting since 2005 (+4 mm/year). This behavior is speculated to have its origin on the regional water extraction activities, which when halted, led to a physical restoration phase of the municipality. In addition, a zoom in the area inflicted by the 1999 earthquake shows that there were zones of counter-force horizontal movement prior to the event. Further analysis is suggested to investigate the source and tectonic implications of this observation.

Graphical Abstract

1. Introduction

The aim of this paper is to employ state-of-the-art Persistent Scatter Interferometry (PSI) techniques to seamlessly monitor surface deformation in the wider Athens metropolitan area. Athens is a densely-populated urban metropolis, covering about 200 km 2 (Figure 1). The socio-economic and cultural importance of the city is well known. Intense construction works have taken place in the city during the last few decades. Indicatively, in the wide frame of the preparation of the Olympic Games 2004 in Athens, several major infrastructure projects, like the Eleftherios Venizelos International Airport, the Athens sub-way, new tram lines and highways, were realized. This construction activity together with old mining works, metro tunneling and the geophysical phenomena reported (e.g., earthquakes, possible subsidence due to extended water pumping, shrink and swell of geological formations) constitute a complex setting, dictating the city monitoring with geodetic tools over the years.
According to the Greek Earthquake Planning and Protection Organization, Athens lays on the border between Seismic Hazard Zone I and Seismic Hazard Zone II [1], which correspond to a ground acceleration of 0.16 g and 0.24 g, respectively. The most severe recent event that hit the city was the 7 September 1999 normal faulting earthquake ( M w 5.9, strike: 114 , dip: 45 , rake: 73 , following the Harvard focal parameter solution [2]) with a large number of damages and human casualties.
Differential Interferometry (DInSAR) has been extensively used as a space-based geodetic tool for monitoring deformation linked to natural phenomena like earthquakes, volcanoes, landslides and ground subsidence, along with surface deformation induced from man-made activities. It relies on the processing of two Synthetic Aperture Radar (SAR) images gathered at different times over the same target area [3,4,5] to generate an interferogram that relates to the surface deformations occurring between the two acquisitions.
Advances in data processing algorithms [6] have introduced new tools for monitoring deformation over wide areas with millimetric precision, using multi-interferogram techniques. PSI is based on the use of a long series of co-registered, multi-temporal SAR imagery, analyzing the radar echoes from a network of phase coherent physical targets, in order to distinguish the phase shift related to ground motions from the phase component due to atmosphere, topography (or the relative building heights) and noise [7]. Among others, the most prominent PSI techniques are the Permanent Scatterers InSAR by Ferretti et al. [6] and its more recent variation SqueeSAR by Ferretti et al. [8], the Stanford Method for Persistent Scatterers (StaMPS) by Hooper et al. [9] and the Interferometric Point Target Analysis (IPTA) by Werner et al. [10]. A well-established interferometric time series analysis method is also the Small BAseline Subset (SBAS) by Berardino et al. [11].
There are previous, but fragmented interferometric studies for the city of Athens. The TERRAFIRMA (Pan-European Ground Motion Hazard Information Service) project [12] employed the patented PSInSAR™technique to estimate Line-Of-Sight (LOS) ground velocities for the 1992–1999 period, for roughly 25% of the AOI (Area Of Interest) of Figure 1. Papoutsis et al. [13] used the IPTA technique for the same period. Both studies are able to provide velocity estimates in the urban fabric, while the spatial velocity pattern is undersampled in non-built-up areas where interferometric coherence drops. Parcharidis et al. [14] adopted interferometric stacking to estimate the surface displacement rates, an approach that allows retrieving denser velocity estimates at the expense of geodetic measurement precision. A singular value decomposition approach was used by Foumelis [15] to study ground deformation for the period 1992–2007 focusing on Kifisia municipality in the northern suburbs of the city. None of these studies provide ground velocity estimates in Mount Parnitha where the catastrophic Athens earthquake took place.
Given the background, the overarching objective of the work presented herein is the creation of a benchmark database of LOS ground velocities in the wider Athens Metropolitan area. These estimates cumulatively relate to an increased temporal coverage spanning from 1992–2010, a wider spatial coverage (Figure 1), an improved spatial sampling of the observed velocity field considering the spatial correlation of deformation as exploited by the StaMPS method and the enhanced geodetic measurement precision of the PSI methodology, of the order of 1 mm/year [16]. In addition, velocity estimates are derived for the vertical and horizontal directions via multi-track analysis. As a secondary objective, this work discusses two interesting deformation use cases within the AOI, one potentially related to man-made activity and one to tectonic activity.
The manuscript is structured as follows: Section 2 provides an overview of the key geodynamic characteristics of the study area. Section 3 provides a concise description of the SAR stacks used and the PSI methodology adopted, while Section 4 delivers the LOS velocity estimates for the different interferometric stacks processed; Section 4.1 covers the 1992–1999 period, and Section 4.2 covers the 2002–2010 period. Next, Section 5 presents a methodology that considers the availability of multi-angle velocity measurements, sampled at an irregular grid, to decompose the actual three-dimensional velocity field into its vertical and east-west components. The results derived through this multi-track approach are briefly discussed in Section 6 in a geotechnical and tectonic framework.

2. Geodynamic Setting

The Athens plane lies in a piece of crust under extension. The wider area is characterized by successive tectonic structures, namely neotectonic grabens and horsts, while Attica prefecture (Figure 2) in particular contains major tectonic striking zones in the NNE-SSW direction [17]. These zones separate the mountains of Parnitha and Aegaleo on the west from the mountains of Penteli and Imittos on the east (Figure 2). Furthermore, the region of NE Attica forms a tilted tectonic block bounded by the Afidnai fault to the south and the Oropos fault to the north that rotates to the S-SW. This tilt produces southern trending flow directions, draining the footwall within the block. This block is divided by a NNE-SSW detachment fault that separates the metamorphic units to the east from the unmetamorphic units to the west [18]. This detachment passes from the Athens plain approximately along the Kifissos River [19].
The seismic history of Athens spans over 25 centuries. Following data from historical times and the more recent local seismicity measurements in the wider Athens metropolitan area, Attica was considered to be located at a low to medium seismic risk zone [20]. Apart from the 1999 Athens earthquake, no other major events have been recorded in the area [21]. The co-seismic [22] and post-seismic [23] displacement patterns associated with the Athens 1999 earthquake have been mapped and validated using DInSAR and in situ leveling data [24]. Satellite interferometry revealed maximum LOS subsidence of approximately 6 cm [22]. This observation was used in earthquake modeling and fault location mapping [25,26,27,28,29,30,31] in Parnitha Mountain.

3. Datasets and Processing Strategy

A total of 146 SAR images were acquired from the European Space Agency (ESA). Data from two descending and adjacent tracks and one ascending track from both ERS and Envisat satellites were archived. Figure 1 shows the footprints of the available tracks, along with the study area in Athens. The total area processed was more than 2350 km 2 . The wide spatial extent of the area was challenging to analyze with SAR time series techniques considering memory and storage requirements, as well as processing times.
Two distinct temporal sets were studied, namely the 1992–1999 period consisting exclusively of ERS-1 and -2 images, prior to (i) the 1999 Athens earthquake that induced an abrupt non-linear deformation and to (ii) the 2002 failure of several on-board gyro systems in ERS-2; and the 2002–2010 period consisting exclusively of Envisat data. For each of the three single tracks and for each time period, a master scene was selected using the expected coherence of the interferometric stack [32]. A total number of six completely independent stacks was analyzed, summarized in Table 1. The temporal coverage of the stacks is shown in Figure 3.
At a pre-processing phase, the raw data were focused to single look complex images using ROI_PAC software, without multi-looking to preserve the full spatial resolution of the source data (20 m in range and 4 m in azimuth). The focused images were oversampled by a factor of two in the range and azimuth directions to avoid aliasing of the complex interferometric signal and increase the spatial density of the coherent pixels [33]. Differential interferograms were formed within the DORIS (Delft object-oriented radar interferometric software) environment [34] using ESA’s DORIS and Delft’s University of Technology orbit state vectors [35], as well as a Shuttle Radar Topography Mission V3 Digital Elevation Model [36]. More than 500 separate differential interferograms were generated, at the SAR sensing geometry (Figure S1).
For our time series processing of the coregistered interferometric stacks, latitude and longitude (WGS84) geocoded coordinates were estimated for each pixel. We used the open-source StaMPS approach [9] that selects persistent scatterers (PS) based mainly on the correlation of their phase in space. We adopted a more recent extension of StaMPS, which additionally implements the SBAS technique, applied on slowly-decorrelating filtered phase pixels by minimizing the perpendicular, temporal and Doppler interferometric baselines [37]. While oversampling has proven its suitability for the PSI technique in the literature, in this work, oversampling was applied for the SBAS technique, as well, by slightly modifying StaMPS. Results presented in Section 4 reveal the high spatial density of the measurements achieved, at the cost of storage and processing time overhead. The converged PS and the slowly-decorrelating pixels were combined to further increase the spatial sampling of the deformation signal and aid the phase unwrapping process towards increasing estimation precision. Considering interferometric stacks with less than 20 scenes, the careful tuning of the various processing parameters was crucial, including the maximum expected topographic error, the number of patches in the cropped area and patch overlapping length, the phase noise standard deviation thresholds, the dimensions of the phase unwrapping grid and thorough quality control for phase unwrapping errors.

4. Time Series Analysis Results

The main outcomes of the PSI time series analysis are the deformation histories for selected persistent scatterers. These measurements are relative to a reference point in the processed area, experiencing on average insignificant surface movement. However, the latter is difficult to ensure for a single point, due to the prevalent complex displacements that take place in the study area. Alternatively, a reference area (the roughly 1 . 3 × 1 . 4 km black box of Figure 4) has been identified within the urban fabric, which is expected to be stable. The velocities within this area where averaged; all other velocity estimates were referenced to this average value.
LOS ground velocities are estimated assuming a linear temporal velocity model and fitting this to the deformation histories estimated. Figure 4 presents the analysis results for the all of the stacks of Table 1. The velocity fields estimated for the overlapping areas of adjacent descending tracks have a similar pattern. This is a cross-validation indication, based on the generation of added-value products from independent observations.
Coherent targets were identified for all six stacks with high spatial density. This is mainly attributed to the urban and peri-urban land cover environment within the study area, which includes rooftops and concrete corner reflectors that dominate over the background scatterers (high signal to clutter ratio). However, the StaMPS methodology that models the spatial correlation of deformation, coupled with the oversampling of the input SAR data led to the identification of several coherent target events in non-urban areas, including agricultural zones and semi-vegetated slopes. In general, more than 20 coherent   pixels / km 2 were available, which is considered sufficient for robust phase unwrapping. Even better, for most parts of Athens, the point spatial density exceeded 1000 pixels / km 2 .
The mean velocity values for Stacks I, II, III, IV, V and VI are −0.87, −0.85, −0.18, −0.32, −0.06 and 0.27 mm/year, respectively, serving as consistency and precision measures. All offsets lay within the ∼1 mm/year precision margin of the PSI technique and can be attributed: (i) to the different LOS directions to which the displacement field is projected; (ii) to the non-fully-overlapping field of view of the processed tracks; and (iii) to potential biases introduced by the reference point velocity estimate. These bias cannot be retrieved without exploiting in situ measurements (GPS or leveling). Such measurements were not available, but even if GPS data were provided, they would not be sensitive enough in the vertical direction.
The mean values for the velocity standard deviations (std) for Stacks I, II III, IV, V and VI are 1.42, 2.00, 1.4, 1.61, 1.38 and 2.42 mm/year, respectively. High values for the std (>2 mm/year) do not necessarily correspond to scatterers with a low signal-to-noise-ratio, as non-linear deformation could also be pushing up the std values. In our case, however, the std for all three stacks are at a reasonable level, indicating that there is no extensive non-linear motion in the study area. Stack VI is a special case with somewhat increased std values in spatially-correlated regions. This can be associated with the reduced temporal sampling due to the limited number of available SAR scenes for the specific stack. We expect that for all stacks, seasonal effects should have too low a magnitude (<5 mm per measurement) to be robustly modeled, largely due to the lack of a strong driving mechanism (e.g., extensive water pumping for agricultural applications).

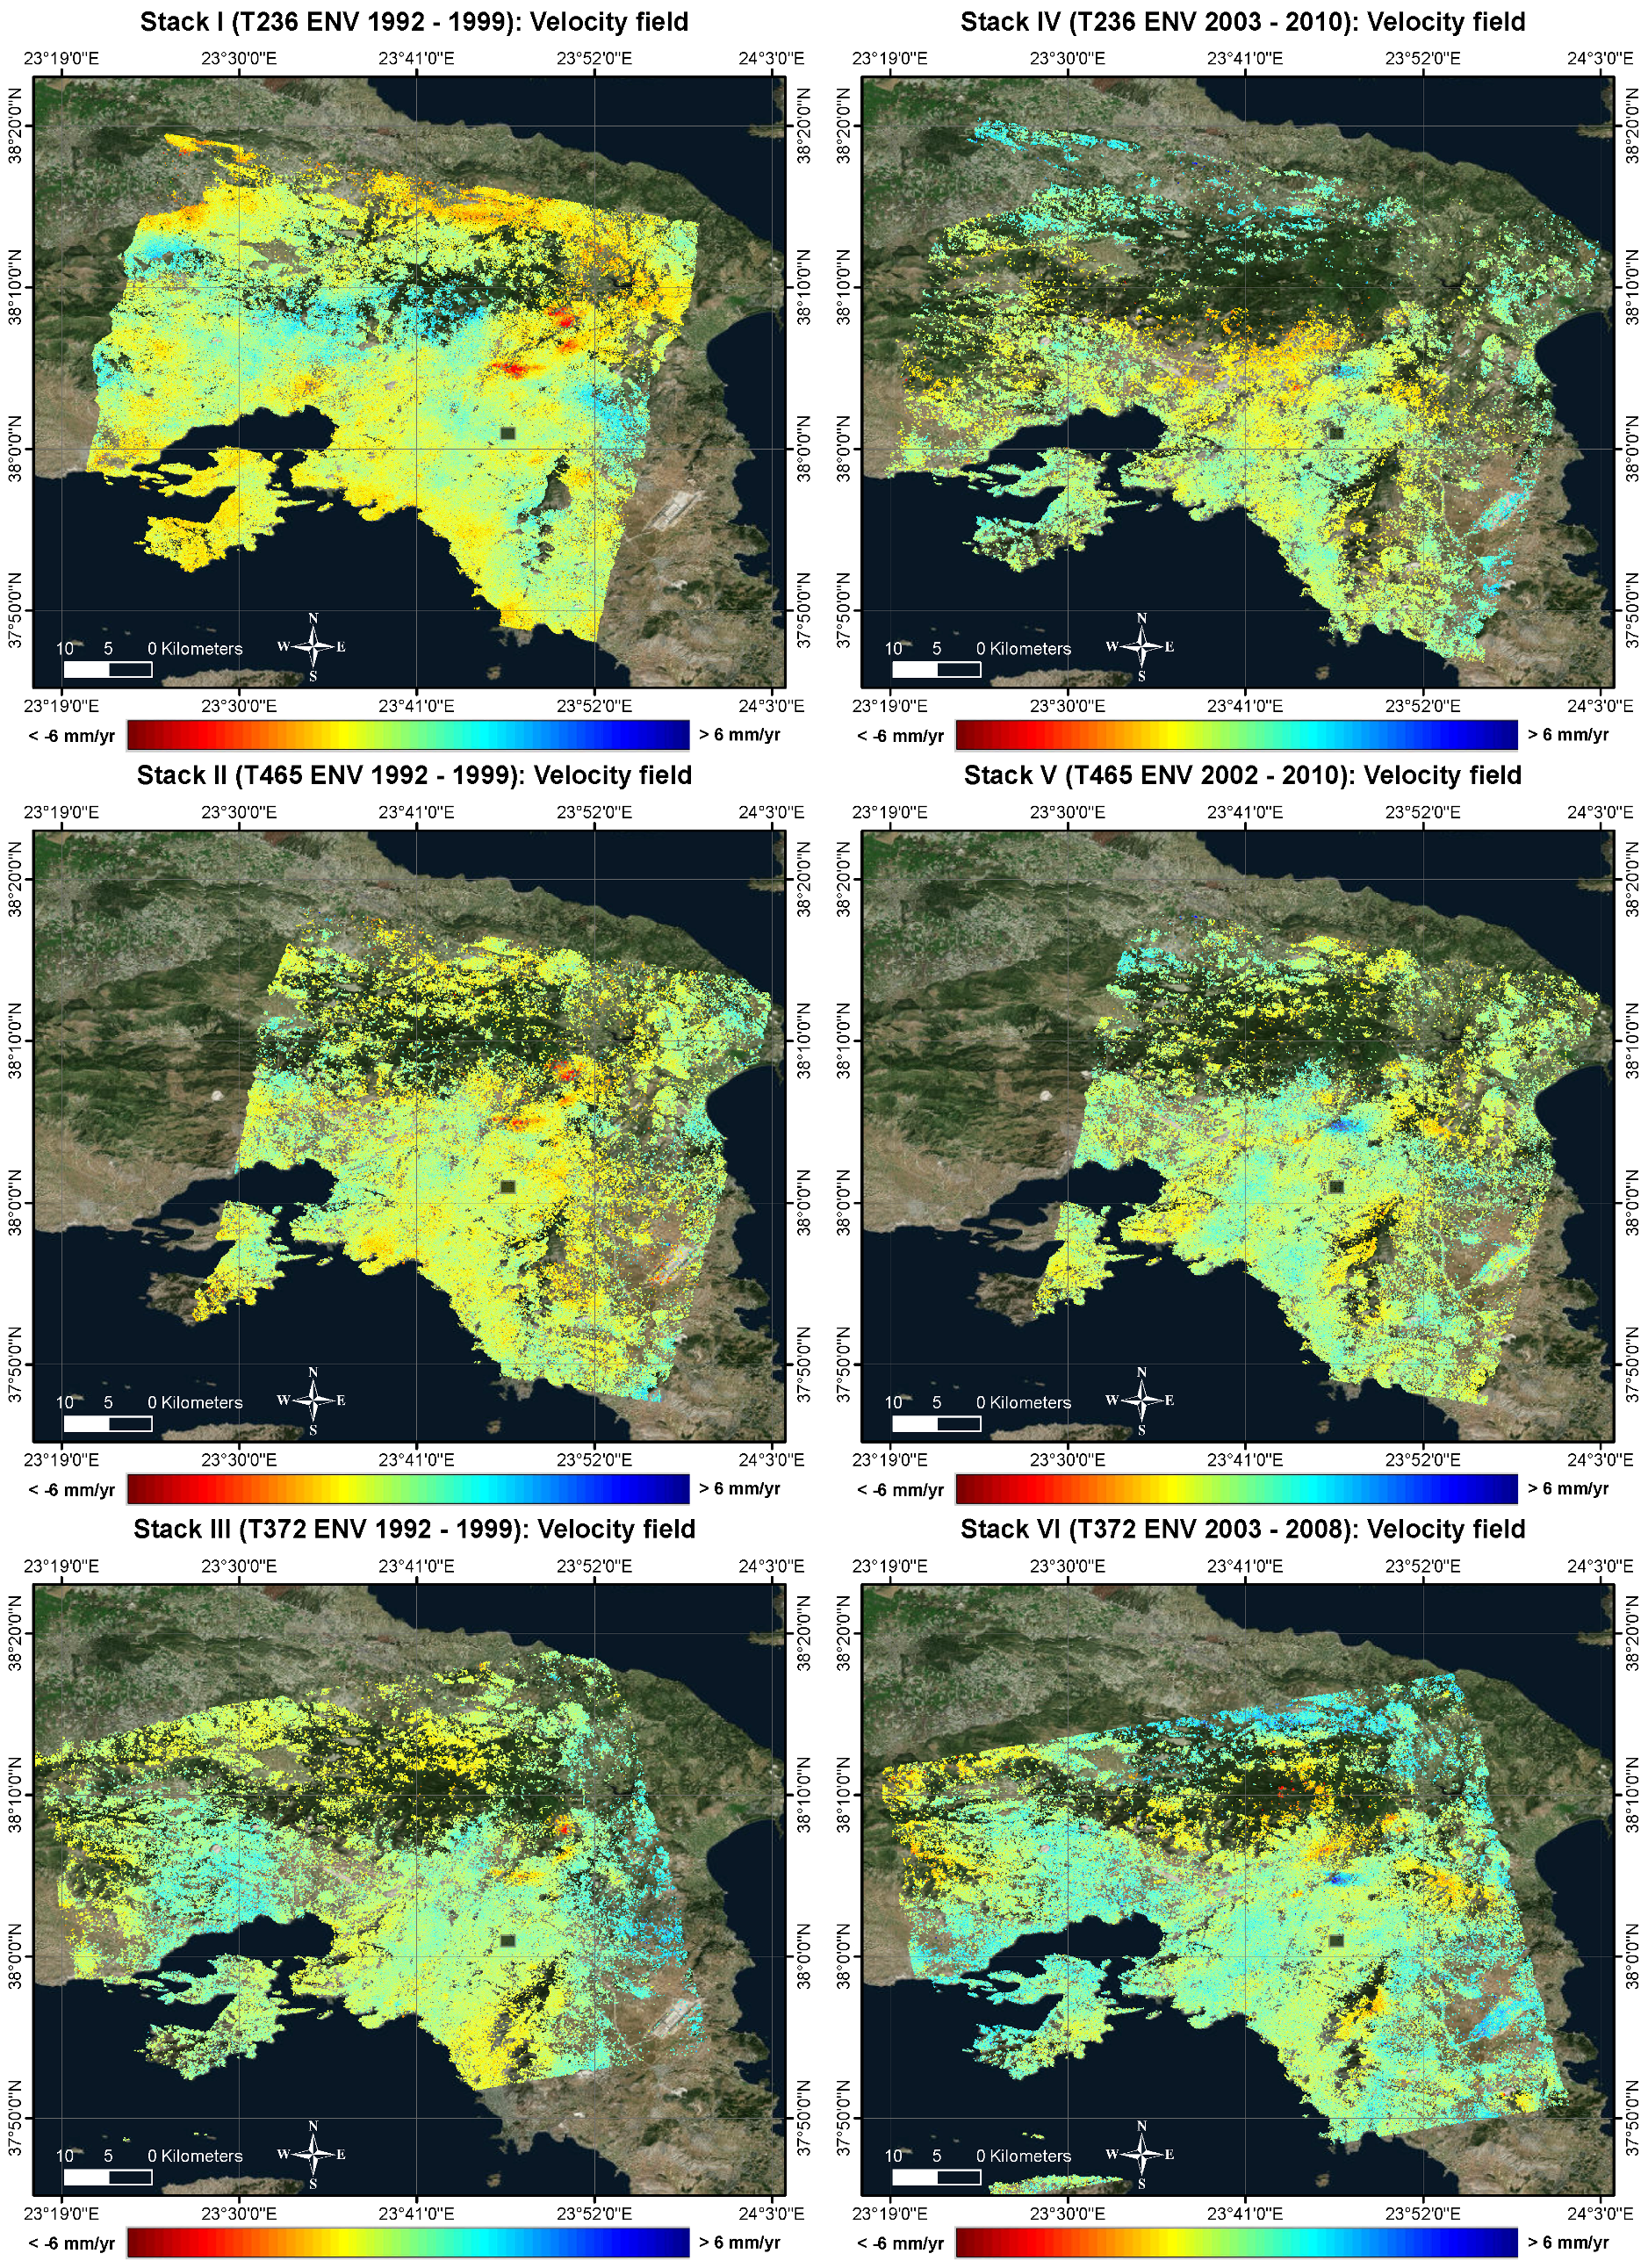
4.1. The 1992–1999 ERS Period

Most parts of Attica (Figure 1) are relatively stable, and there is no evidence for large-scale deformation signals. However, there is a variety of local scale characteristics in the observed velocity fields. These AOIs are shown in Figure 5, along with the deformation history for selected scatterers.
AOI1 contains the southern part of Athens, including the port of Piraeus and the key transport axis, such as Leoforos Sygrou, which acts as an escape route from Syntagma square in the center of Athens to the sea, and Leoforos Piraeus, which connects the historic Athens sites with the city of Piraeus. While the area is more or less stable, in Moschato and in isolated locations, we observe subsidence of the order of 2–3 mm/year. For the Moschato area, as indicated by Parcharidis et al. [14], the measured deformation may be attributed to the existing lithology of the region, while point P1 corresponds to a pier, which exhibited subsidence >5 mm/year (Figure 5).
AOI2 is located in the northern suburbs of urban Athens, including the municipalities of Kifisia, Ekali, Anoixi and Kryoneri. These areas show a local deformation pattern with a notable spatial extent and relatively high magnitude. Point P2, detected on the national highway, experiences subsidence at a rate of 9 mm/year, i.e., about 6 cm total deformation in the observation period. As shown in Figure 5D, the linear velocity model for this scatterer is a good fit.
The linear model is not however a good fit when we move south to Kifisia region, where P3 is located. The estimated linear velocity for this scatterer is ∼−7 mm/year. Inspection of the deformation history (Figure 5D) reveals that in the 1992–1999 period, there are two distinct phases with respect to the target’s movement pattern. From 1992 up until the end of 1995, the subsidence has a higher magnitude than the one estimated for the entire observation period, around 12 mm/year. Since then and until August 1999, the scatterer remains relatively stable (∼−2 mm/year). This is a characteristic example of non-linear persistent scatter motion, and therefore, a second order polynomial fits the observation data better.

4.2. The 2002–2010 Envisat Period

Similarly to what was observed for the previous period, there is no large-scale/high magnitude movement occurring. The northern suburbs of Athens entail again special characteristics as there is a central uplift area in Kifisia, surrounded by three subsidizing regions in Thrakomakedones, where the Olympic Village for the 2004 Olympic Games was developed, Mount Penteli at 1.1 km in height and Anoixi municipality (Figure 6). Following the pattern of the 1992–1999 period, Ekali and Anoixi have been moderately subsidizing, with lower velocity values however. Indicatively, scatterers P4, P5 and P6 shown in Figure 6B have experienced linear LOS subsidence rates of the order of 2.7 mm/year (with some non-linear trends from the end of 2008 onwards), 3.5 mm/year and 2.4 mm/year, respectively.
Kifisia region is a more interesting case to study; the previously subsidizing region reversed the signs of its motion to uplift in the period 2002–2010. Point P3 of Figure 6B is the same persistent scatterer P3 of Figure 5C. For this scatterer, the PSI analysis has estimated an average uplift rate of the order of 4 mm/year with slight non-linear characteristics. This non-linearity of deformation for P3 is clearer in Figure 6C, where its deformation history is recorded for the entire observation period 1992–2010. An assumption for stitching the results of the ERS and Envisat analyses in Figure 6C is that the initial deformation estimate in early 2002 is the same as the late 1999 deformation estimate. From the end of 2002 till mid-2005, the region is rather stable (1 mm/year), while from mid-2005 until the end of 2010, the uplift magnitude rises up to 7 mm/year. Overall, for the entire time span, a second degree polynomial fits the measurements quite well. This is not an isolated example; the same motion behavior is observed for most scatterers of Kifisia municipality, indicating that there is a larger scale regional physical driver. This is further discussed in Section 6.

5. Multi-Track Joint Analysis

A common problem met in the products generated from interferometric techniques is the correct geodetic interpretation of the observed deformation, in terms of the dominant motion direction in the Earth’s surface. When subsidence is observed (or generally motion in the vertical direction), then the LOS change is in the direction far from the satellite, i.e., by convention, negative deformation, for both heading passes. On the other hand, when the motion is predominantly in the eastward direction, then the LOS change in the ascending track would occur away from the satellite (negative), while for the ascending track, it would change towards the satellite (positive). Thus, a general rule of thumb would be that when motion with the same sign is detected by both descending and ascending tracks, then displacement in the up direction is dominant, while when opposite signs are encountered, horizontal movement is more likely to be occurring.
In this context and considering the distinct imaging geometries (descending and ascending tracks) and for two time periods (1992–1999 and 2002–2010), there is some added value that can be extracted from the integration of products that basically map the same physical quantity, surface deformation. In this section, we describe, therefore, our strategy for exploiting track diversity, for the decomposition of the observed LOS displacement to its vertical and horizontal components.

5.1. Methodology

Physically identical targets correspond to the same deformation rate, provided that the reflection type is the same (mirror, dihedral, etc.), while the detected scatterers in overlapping tracks clearly follow man-made structures in the terrain. Additionally, the shorter the distance between the PSs, the higher the likelihood that they represent the same ground motion regime [38]. Therefore, in the subsequent analysis, the hypothesis that clusters of neighboring PSs belong to the same deformation regime is adopted.
The methodology developed is as follows: initially, for each PS and for each stack, the corresponding incidence and satellite heading angles were estimated. Then, a rectangular reference grid was created to accommodate the subsequent calculations. The selected grid extended [23.25 24.10 ] in longitude and [37.70 38.35 ] in latitude, and the corresponding bin dimension was 0.001 and 0.002 , i.e., ∼100×200 m. The irregularly-spaced interferometric estimates (velocities and std) were averaged in each bin, resampling therefore the initial estimates to a coarser, but fixed grid. This process aimed at moving the weight from the single scatterer characteristics, which vary across the resolution cells of the different stacks, to the local deformation patterns by generating a synthetic persistent scatter. At the heart of the selection of the size of the grid cells is an accuracy trade-off between detecting smoothly varying spatially-correlated deformation versus more noisy, but detailed mapping.
The incidence and heading angles were interpolated using splines to find the corresponding values at the bin centers of the rectangular grid. Finally, a routine was launched to find the union and the spatial intersection of synthetic scatterers across the interferometric stacks for the two time periods. Between 50,000 and 80,000, synthetic scatterers were identified for all six stacks. For the 1992–1999 period, 35,181 common points were identified, while the corresponding number for the 2002–2010 period was 30,070, achieving sufficient spatial sampling of the deformation signal.

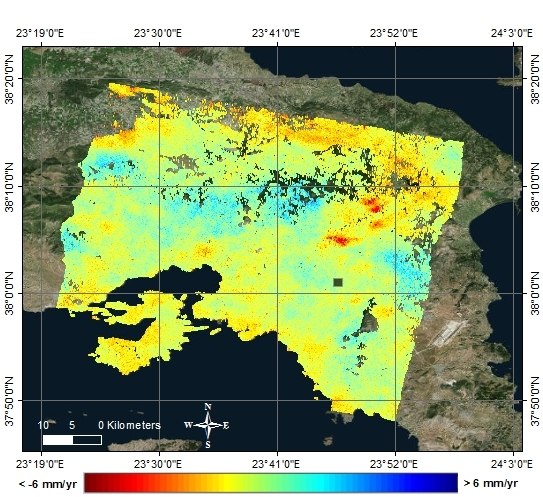
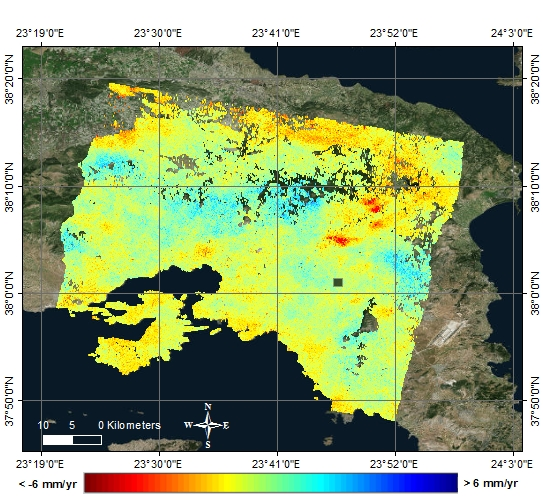
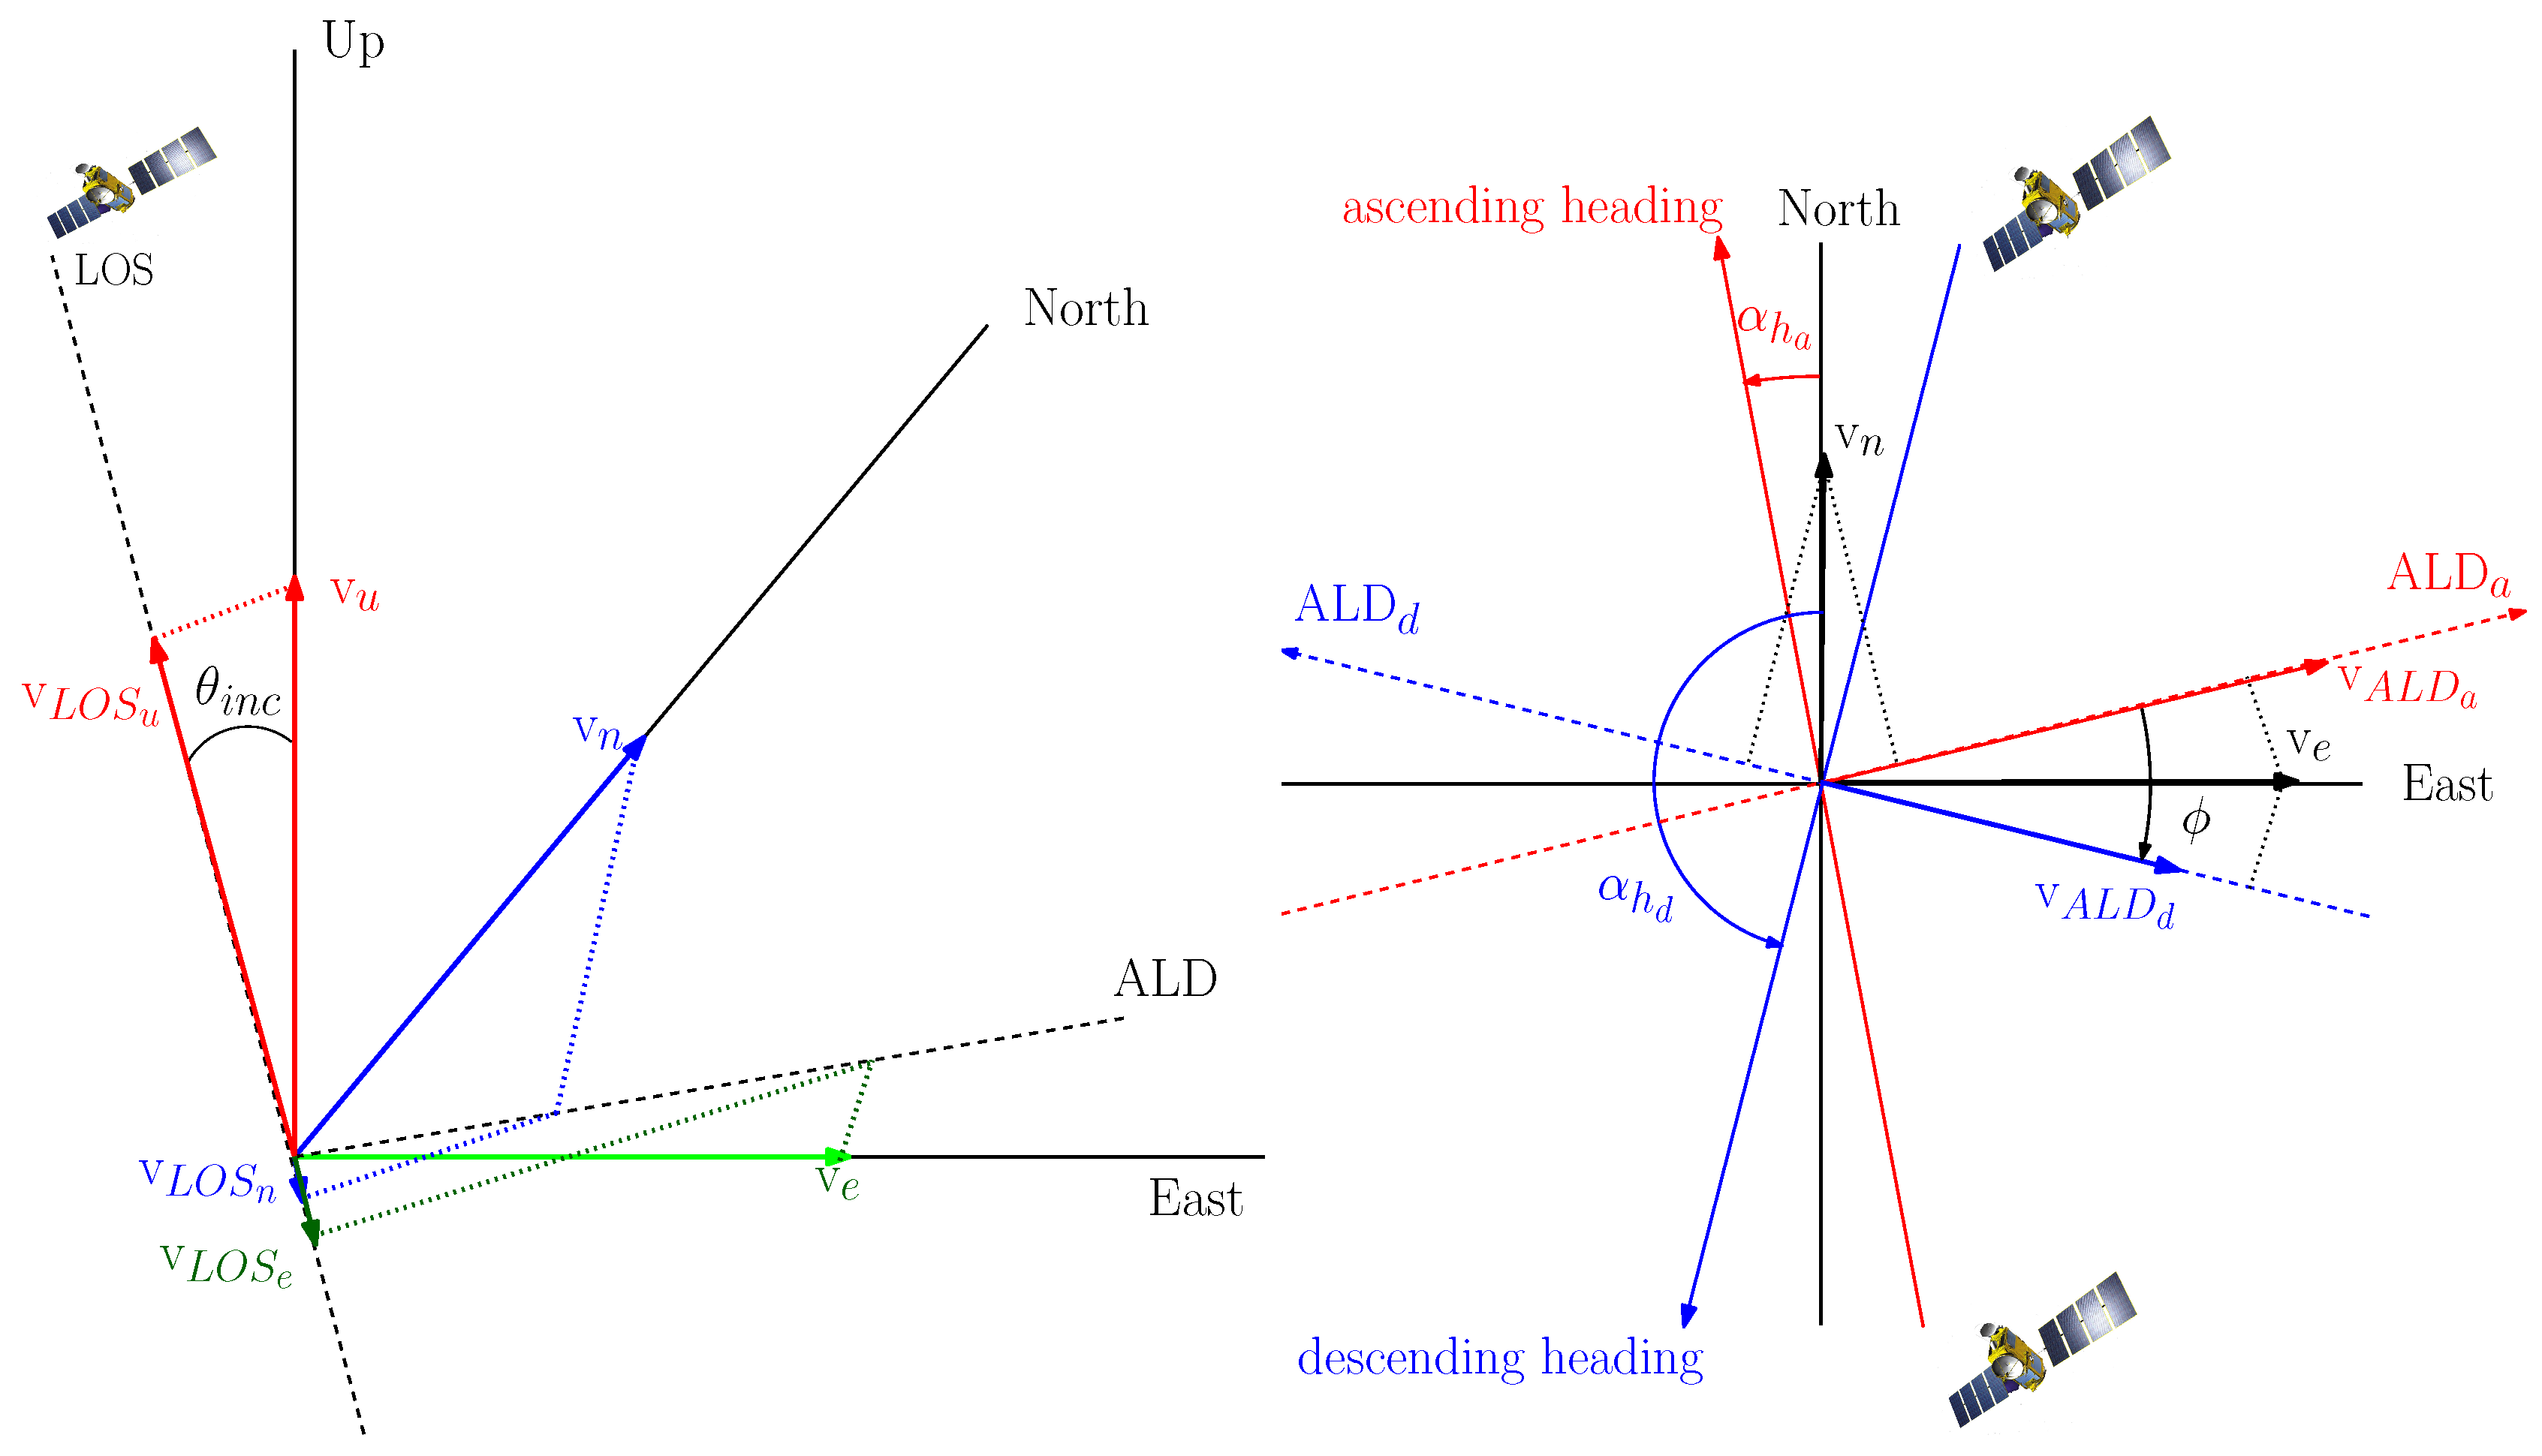
5.2. Velocity Decomposition

In DInSAR, only one component of the surface deformation is measured, in the satellite’s line-of-sight. Mapping surface deformation in other directions by using multiple interferograms is a challenging task and is highly dependent on the available datasets and their interferometric quality. The north component is always the most difficult to determine [39], and it can only be retrieved by either using multiple aperture interferometry [40] or combining the radar amplitude with phase measurements [41]. These techniques are applicable though for the case of abrupt phenomena like earthquakes, rather than for subtle deformation signals similar to those encountered in the Athens metropolitan study area.
The LOS displacement rates v L O S generated by the time series techniques on the measured LOS displacements d L O S represent a projection of the three-dimensional (3D) velocity vector v onto the satellite look vector. Considering that the 3D vector has components in the up, east and north directions, i.e., v u , v e and v n , respectively, then the left sketch of Figure 7 shows the contribution of these three velocity components to the v L O S estimate. Following this geometry setting, it applies that v L O S = v L O S u + v L O S e + v L O S n . In our analysis however, we do not have three independent LOS measurements to resolve the three orthogonal velocity components. Instead, descending and ascending measurements from a right-looking radar are available. Hence, we need to simplify our analysis into a two-dimensional velocity estimation problem that provides better intuition on the physical processes observed, than the one currently provided from the two LOS measurements.
In Figure 7, the Azimuth Look Direction (ALD) is drawn for an ascending satellite passing. ALD is always perpendicular to the satellite heading (or simply azimuth direction), and it incorporates primarily contributions from the east-west component, plus a contribution from the north-south component. On the right of Figure 7, a top-view geometry is shown for both ascending and descending satellite passes, focusing only on the horizontal components of the velocity estimates. It is clear that the sensitivity of the SAR imaging system to the north components is much smaller than the sensitivity to the east components, attributed mainly to the associated heading angles (∼−13 for ascending and ∼− 166 for descending). In the following, we keep the ALD notation for reasons of preciseness; however, in practice, due to the small heading angles of the ERS and Envisat orbits, one could safely substitute the ALD direction with the east-west direction.
Following the methodology for the definition of the common intra-track synthetic scatter and using the notation approach by Samieie-Esfahany et al. [42], which provides a 2D decomposition solution for the 3D problem presented by Hu et al. [43], a system of equations can be solved for the decomposition to the vertical and the horizontal components in the descending ALD (blue vector ALD d in the right of Figure 7, arbitrarily selected instead of ascending ALD):
v L O S a s c v L O S d e s c = A · v u v A L D d
where:
A = cos θ i n c a s c sin θ i n c a s c cos Δ α cos θ i n c d e s c sin θ i n c d e s c
with v A L D d the projection of the horizontal velocity displacement ( v n and v e ) in the descending ALD, θ i n c the incidence angle and Δ α = α h a α h d the satellite heading difference between the ascending and descending mode.
The above system of linear equations was solved for every common synthetic scatterer with LU (lower-upper) decomposition with partial pivoting and checking that the rank of matrix A is always nonzero. Reformulation of Equations (1) and (2) to include also velocity estimates from an adjacent descending track (e.g., using Stacks I, II and III) and aiming at solving for all three components of the 3D displacement field does not lead to linearly independent rows in matrix A, degenerating therefore its rank.
For the 1992–1999 period, Stacks I and III were used to maximize the spatial overlap between descending and ascending tracks. For 2002–2010, Stacks V and VI were preferred to increase the robustness of the calculations, considering that Stack IV was generated with a limited number of images, at the expense of spatial coverage. Figure 8 contains the decomposed velocity estimates for 1992–1999, overlaid with the mapped fault network in the wider area, while Figure 9 presents the corresponding results for the 2002–2010 period. Any reference to horizontal movement implies mainly motion in the east-west direction. The sensitivity to the north-south components is too low to extract reliable estimates; motion in this direction might exist, but the sensing geometry cannot resolve it.
The theoretical precision of the PSI techniques employed in this work are in the range of 1 mm/year of the LOS velocities [16]. Using these precision levels as a benchmark, an error propagation analysis was conducted based on Equations (1) and (2), aiming at estimating the precision levels for the new components v u and v A L D d . Assuming that the descending and ascending velocity estimation errors are uncorrelated (considering the variable atmospheric and noise conditions of the different data stacks) and that the incidence angle is constant at 23 , the precision for v u is 0.8 mm/year and for v A L D d is 1.7 mm/year. An improvement is achieved via the exploitation of descending/ascending angle diversity; for a single LOS velocity estimation, the precision in the vertical is roughly 1.1 mm/year ( p r e c i s i o n L O S / cos θ i n c if we assume that the observed LOS deformation is due to motion in the vertical axis only) and in the east-west 2.5 mm/year ( p r e c i s i o n L O S / sin θ i n c if we assume that the observed LOS deformation is due to motion in the east-west axis only). Figure 8 and Figure 9 highlight also this inherent precision difference: the horizontal velocity estimates seem to be noisier than the vertical estimates, a direct consequence of the imaging geometry and the ill-conditioned estimation problem. In fact, the signal-to-noise-ratio for the horizontal components is lower than that of the vertical components by a factor of cos θ i n c / sin θ i n c 2 . 35 . Typical error sources include atmospheric modeling and DEM correction residuals. In addition, the noisier horizontal velocity estimates imply variable north-south components in some parts of the AOI and a more complex horizontal motion pattern.
There is only one permanent GPS station operating within the study area to check the precision of our results. The station, named DION and maintained by Dionysos Satellite Observatory, has been seamlessly operating since 2000 and is located in the eastern part of the study area ( 38 . 078534 latitude, 23 . 932648 longitude and at a height of 514.539 m; location at about the middle epoch of the observation period). The velocities estimated for DION station, by fitting a linear model to the GPS measurements in a least squares approach, are v u p D I O N = 0 . 35 mm/year, v e a s t D I O N = 7 . 88 mm/year and v n o r t h D I O N = 11.63 mm/year. The velocity values are provided with respect to the International GNSS Service reference frame (IGS08) and can be, therefore, considered as absolute values. The strong south-east motion of DION is related to the general large-scale tectonic motion of the entire region and cannot be used to check the local displacement pattern measured through PSI. This is feasible by comparing the vertical estimates. In the up direction, the estimated velocity is nearly zero (0.35 mm/yr). Based on the synthetic scatterer analysis, we averaged the vertical velocities of the scatterers that lay within a circle of 200 m in radius from DION, where the deformation is expected to be spatially correlated. The average vertical velocity of the scatterers is 0.05 mm/yr with a standard deviation of 0.3 mm/yr. This negligible discrepancy with the v u p D I O N is well below the precision margin of the method (0.8 mm/yr), estimated previously.

6. Discussion

The multi-track analysis has led to the estimation of ground velocities in the vertical and east-west directions. The geo-database of ground movements reveal numerous local small-scale displacement patterns; some of them can be correlated with construction works, e.g., subsidence along a central highway, while others require further analysis. This section focuses though on the discussion of the two most significant observations, namely the vertical motion change observed in Kifisia municipality and the horizontal motion zonation near the Thriasio fault.

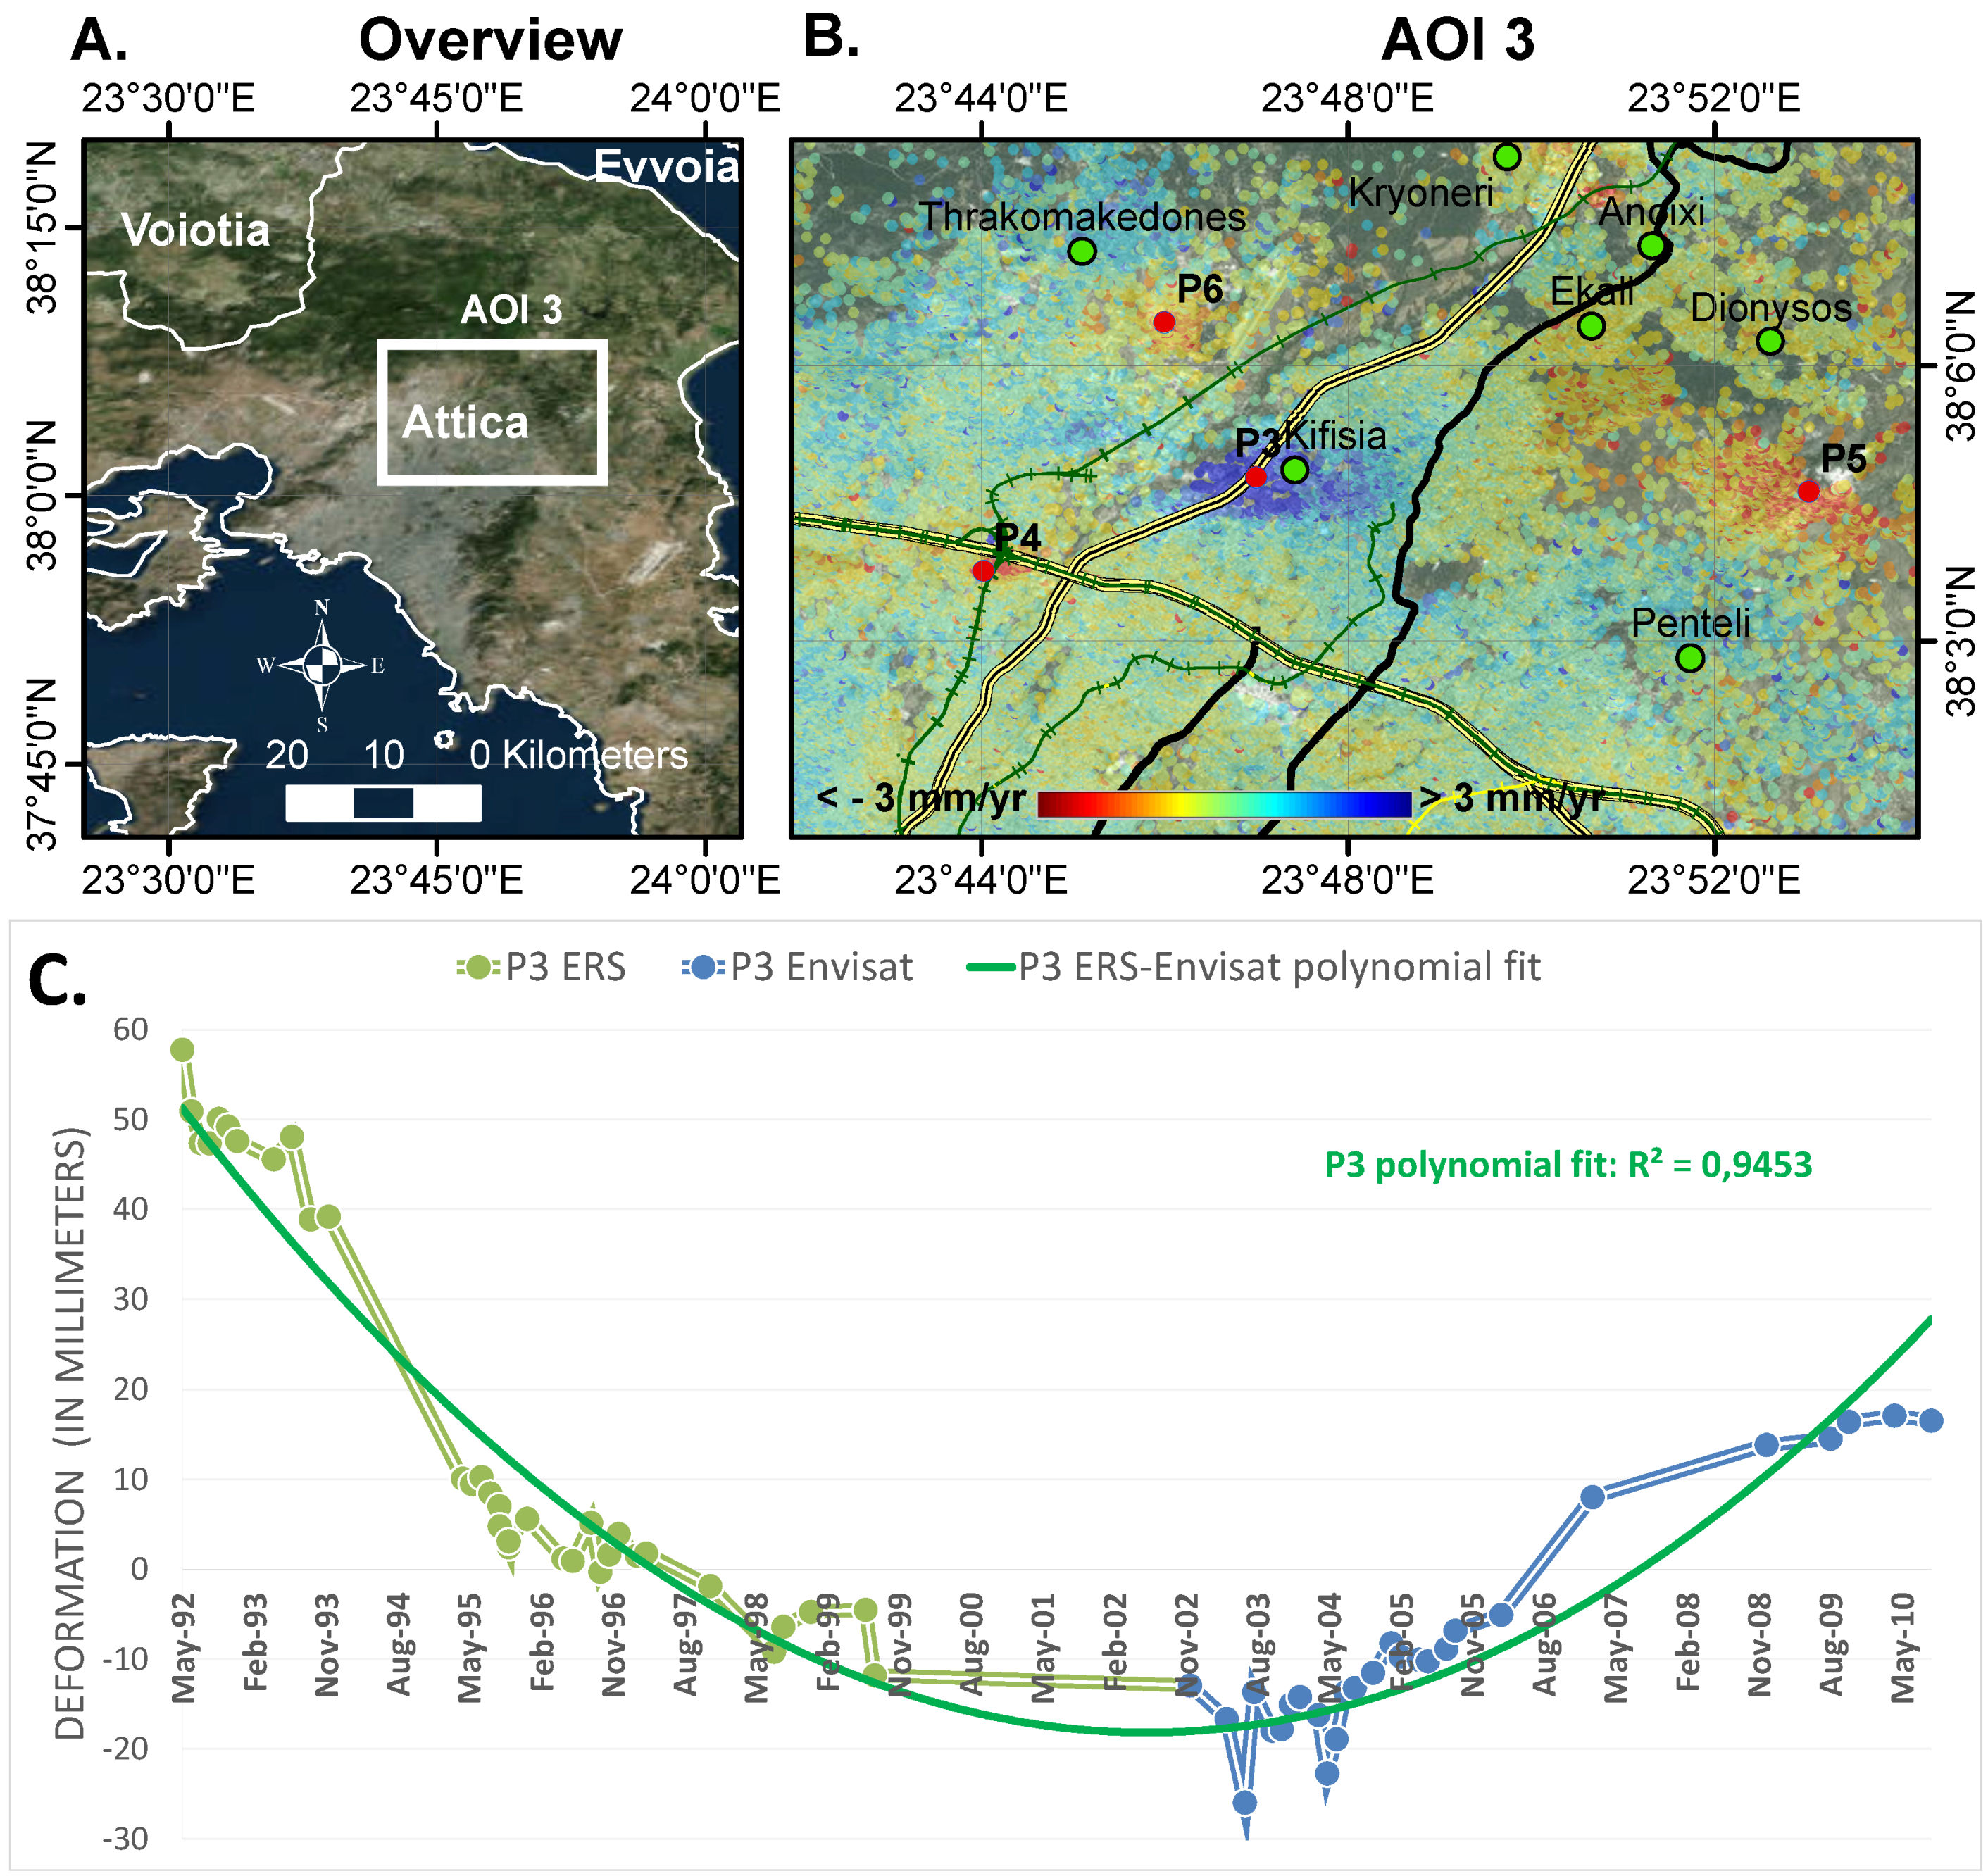
6.1. Aquifers Overexploitation

In the municipality of Kifisia, following the deformation histories of the respective scatterers shown in Figure 5 and Figure 6 and the local vertical motion trend depicted in Figure 8 and Figure 9, it is clear that the region has changed its motion pattern during the 1992–2010 observation period, from subsidence to uplift. The driver for this rebound mechanism is not straightforward to identify and is not in the scope of this work. We can only assume though that although phenomena, such as natural compaction and soil oxidation, cannot be excluded, the detected rebound is predominantly attributed to water over-pumping in Kifisia.
The urban expansion and the economic activities related with everyday life affect the natural evolution of the landscape and the physical processes. Kifisia is a northern suburb where the wealthier strata are housed. The region enjoyed a sudden growth in the late 1980s, which resulted in increased water consumption. Coupled with the 1989–1993 drought crisis in Athens, numerous new wells were constructed, which in turn led to ground water depletion [44]. Foumelis [15] refers to a declination of the groundwater table by at least 20 m within a decade. The overexploitation of the aquifer can be therefore assumed to be the main cause of the observed subsidence for the period 1992–1995. Unfortunately, only a very small percentage of the water abstraction works that took place prior to 1995 is registered; hence, quantification of the direct impact of water over-exploitation is not feasible.
According to the Athens Water Supply and Sewerage Company, the country’s historical low of ∼170 million·m 3 water reservoir at the end of 1993 gradually increased to ∼1200 million·m 3 in 1999, followed by a drop at ∼400 million·m 3 in 2002. At the same time, the municipalities in the northern suburbs of Athens abandoned the use of local wells. The change on the water extraction regime in Kifisia and the country-level physical water level restoration probably led to the aquifers’ recharge. This is registered as a post-2005 uplift in our interferometric measurements, while the different geotechnical characteristics and the stratigraphy variations of the area affect this uplift ratio. The manifestation of a physical rebound motion, also identified by Foumelis [15], is not observed for the first time in Greece. Svigkas et al. [45] use PSI with hydrogeological data to correlate the geodetic motion change from subsidence to uplift with corresponding changes to the aquifer level in the broader Kalochori village region, at the west side of Thessaloniki, Greece.

6.2. Aseismic Creep

In a zoom at Thriasio Pedio for the 1992–1999 period, i.e., prior to the Athens earthquake, the LOS velocities as depicted in Figure 4 do not disclose any tectonic movement that could potentially be a warning signal for the upcoming earthquake. The same applies for the decomposed vertical component (Figure 8A). However, the picture is different for the decomposed horizontal components (along the ALD direction). North-northeast of the Thriasio fault where Parnitha Mountain is, the synthesized scatterers of the common grid show an eastwards trend, or at least the projection of the north and east components of the motion along ALD are negative ( [ 2 5 ] mm/yr). On the contrary, south of the Thriasio fault, the prevailing trend is moderately westward, i.e., has a positive sign in the ALD direction ( [ 1 3 ] mm/yr).
In the absence of additional independent evidence, such as GPS and leveling measurements, these observations cannot be directly linked with aseismic processes. It could be speculated however that this horizontal motion zonation is a manifestation of tectonic stress loading on a normal fault. An argument in favor of this is that the horizontal motion zonation is absent in the 2002–2010 period, implying stress release during the 1999 Athens earthquake that occurred in between the two study periods. Particularly, in Figure 9B, all velocities in the vicinity of Thriasio fault are close to zero ( [ 1 + 1 ] mm/yr on either side of the fault trace), indicating relative ground stability. An argument that contrasts the tectonic loading origin of the observed signal is that normal faults produce primarily vertical displacements and not horizontal ones. In addition, the observed motion pattern on both sides of the fault would suggest that the 1999 Athens earthquake had a dextral component, which is not supported by the focal mechanism solutions. In any case, this potentially aseismic process was only revealed following the signal decomposition strategy implemented. Further analysis with additional in situ multi-source measurements is suggested though to gain a better understanding of the driving mechanism behind this ground motion pattern and its implications for the city’s tectonic regime. In practice, driven by the geodetic data, one would have to use an appropriate model to describe the tectonic creep process (e.g., as by Hetland et al. [46]).
No other major correlation of the horizontal velocities with the mapped faults is observed, including the major Kifisos thrust that basically splits Athens city in east and west regions. Only limited boundaries that coincide with some faults can be delineated, indicatively in the zone defined west of the Thriasio fault (Figure 8B). However, for both time periods, the northern part of the study area exhibits westward motion, while for the central part of the study area, where the city of Athens lies, the horizontal motion pattern remains relatively unchanged, as well.

7. Conclusions

In this work, several interferometric products were generated covering the wider Athens metropolitan area for two time periods: 1992–1999 and 2002–2010. Using descending and ascending ERS and Envisat satellite tracks, the LOS velocity field was estimated using state-of-the-art PSI techniques. A methodology was developed that exploits multi-track angle diversity to decompose LOS estimates into their vertical and horizontal components. The legacy is a benchmark geo-database that provides ground displacements rates for the complex setting of Athens, with extended spatial and temporal coverage, increased spatial resolution to reveal local scale displacement patterns and with unprecedented precision. The reference geodetic database contains consistent and robust vertical and east-west velocity estimates, along with LOS deformation histories for the detected scatterers, to support modeling studies that consider tectonic and anthropogenic activity.
Two key findings are further elaborated; first, Kifisia municipality, which has been subsiding in the 1992–1999 period, reversed its motion sign to uplift in the 2002–2010 period. This is mainly attributed to water over-exploitation that took place up until 1995, and then, the area experienced a physical rebound phase. Second, counter-force horizontal movements are detected close to the Thriassio fault prior to the 1999 Athens earthquake. It is argued that in the absence of ground-truth data, satellite interferometry can alarm about the evolution of potentially threatening natural processes, even in low seismic hazard regions. However, the tectonic implications of this observation need to be further analyzed. In this context, the space-based geodetic monitoring of wider Athens is imperative, and hence, the seamless acquisition of Sentinel-1 imagery over the area is critical.

Supplementary Materials

The following are available online at www.mdpi.com/2072-4292/9/3/276/s1, Figure S1: The SBAS interferometric pair networks processed for each stack, following the parameters defined in Table 1 of the manuscript. Red circles correspond to the SAR imagery, while the green lines to interferometric pairs. All computed pairs are part of the same network and no isolated interferograms are formed. The distribution of the perpendicular baselines is marked in the vertical axis.

Acknowledgments

ERS-1, -2 and Envisat data used in this work have been provided in the framework of ESA-Greece Announcement of Opportunity project 1489OD/11-2003/72. The research leading to the presented results has received funding from the European Union Seventh Framework Programme (FP7-REGPOT-2012-2013-1) under Grant Agreement No. 316210 (BEYOND - Building Capacity for a Center of Excellence for EO-based monitoring of Natural Disasters).

Author Contributions

Ioannis Papoutsis developed the methodology for the multi-track joint analysis and performed the time-series processing. Ioannis Papoutsis, Charalampos Kontoes and Demitrios Paradissis analyzed and interpreted the surface deformation results. Ioannis Papoutsis and Charalampos Kontoes drafted the article. All authors contributed to the finalization of this paper.

Conflicts of Interest

The authors declare no conflict of interest.

References

  1. Andrianakis, V.; Voulgaris, N. New Seismic Hazard Map for Greece; Technical Report; Earthquake Planning and Protection Organization: Neo Psichiko, Greece, 2003. (In Greek) [Google Scholar]
  2. Tselentis, G.A.; Zahradnik, J. The Athens Earthquake of 7 September 1999. Bull. Seismol. Soc. Am. 2000, 90, 1143–1160. [Google Scholar] [CrossRef]
  3. Zebker, H.A.; Goldstein, R.M. Topographic mapping from interferometric synthetic aperture radar observations. J. Geophys. Res. Solid Earth 1986, 91, 4993–4999. [Google Scholar] [CrossRef]
  4. Gabriel, A.K.; Goldstein, R.M.; Zebker, H.A. Mapping small elevation changes over large areas: Differential radar interferometry. J. Geophys. Res. Solid Earth 1989, 94, 9183–9191. [Google Scholar] [CrossRef]
  5. Massonnet, D.; Feigl, K.L. Radar interferometry and its application to changes in the Earth’s surface. Rev. Geophys. 1998, 36, 441–500. [Google Scholar] [CrossRef]
  6. Ferretti, A.; Prati, C.; Rocca, F. Permanent scatterers in SAR interferometry. IEEE Trans. Geosci. Remote Sens. 2001, 39, 8–20. [Google Scholar] [CrossRef]
  7. Tofani, V.; Raspini, F.; Catani, F.; Casagli, N. Persistent Scatterer Interferometry (PSI) Technique for Landslide Characterization and Monitoring. Remote Sens. 2013, 5, 1045–1065. [Google Scholar] [CrossRef]
  8. Ferretti, A.; Fumagalli, A.; Novali, F.; Prati, C.; Rocca, F.; Rucci, A. A New Algorithm for Processing Interferometric Data-Stacks: SqueeSAR. IEEE Trans. Geosci. Remote Sens. 2011, 49, 3460–3470. [Google Scholar] [CrossRef]
  9. Hooper, A.; Segall, P.; Zebker, H. Persistent scatterer interferometric synthetic aperture radar for crustal deformation analysis, with application to Volcán Alcedo, Galápagos. J. Geophys. Res. 2007, 112, B07407. [Google Scholar] [CrossRef]
  10. Werner, C.; Wegmuller, U.; Strozzi, T.; Wiesmann, A. Interferometric point target analysis for deformation mapping. In Proceedings of the 2003 IEEE International Geoscience and Remote Sensing Symposium (IGARSS ’03), Toulouse, France, 21–25 July 2003; Volume 7, pp. 4362–4364.
  11. Berardino, P.; Fornaro, G.; Lanari, R.; Sansosti, E. A new algorithm for surface deformation monitoring based on small baseline differential SAR interferograms. IEEE Trans. Geosci. Remote Sens. 2002, 40, 2375–2383. [Google Scholar] [CrossRef]
  12. Terrafirma. Stage 1 Results: Athens Greece; Technical Report; Terrafirma EC Project; Terrafirma: Athens, Greece, 2004. [Google Scholar]
  13. Papoutsis, I.; Kontoes, C.; Massinas, B.; Paradissis, D.; Frangos, P. Assessing the pre-seismic and post-seismic displacement in the Athens metropolitan area by SAR Interferometric Point Target Analysis, using ERS and Envisat datasets. In Proceedings of the Workshop Fringe 2009, Frascati, Italy, 30 November–4 December 2009.
  14. Parcharidis, I.; Lagios, E.; Sakkas, V.; Raucoules, D.; Feurer, D.; Mouelic, S.L.; King, C.; Carnec, C.; Novali, F.; Ferretti, A.; et al. Subsidence monitoring within the Athens Basin (Greece) using space radar interferometric techniques. Earth Planets Space 2006, 58, 505–513. [Google Scholar] [CrossRef]
  15. Foumelis, M. Human induced groundwater level declination and physical rebound in northern Athens Basin (Greece) observed by multi-reference DInSAR techniques. In Proceedings of the 2012 IEEE International Geoscience and Remote Sensing Symposium (IGARSS), Munich, Germany, 22–27 July 2012; pp. 820–823.
  16. Crosetto, M.; Monserrat, O.; Cuevas-González, M.; Devanthéry, N.; Crippa, B. Persistent Scatterer Interferometry: A review. ISPRS J. Photogram. Remote Sens. 2016, 115, 78–89. [Google Scholar] [CrossRef]
  17. Lekkas, E. The Athens earthquake (7 September 1999): Intensity distribution and controlling factors. Eng. Geol. 2001, 59, 297–311. [Google Scholar] [CrossRef]
  18. Papanikolaou, D.; Papanikolaou, I. Geological, geomorphological and tectonic structure of NE Attica and seismic hazard implications for the northern edge of the Athens Plain. Bull. Geol. Soc. Greece 2007, 40, 425–438. [Google Scholar]
  19. Xypolias, P.; Kokkalas, S.; Skourlis, K. Upward extrusion and subsequent transpression as a possible mechanism for the exhumation of HP/LT rocks in Evia Island (Aegean Sea, Greece). J. Geodyn. 2003, 35, 303–332. [Google Scholar] [CrossRef]
  20. Galanopoulos, D. Plate tectonics in the area of Greece as reflected in the deep focus seismicity. Bull. Geol. Soc. Greece 1972, IX/2, 266–285. [Google Scholar]
  21. Papazachos, V.; Papazachos, B.; Papazachou, C.; Papazachou, K. The Earthquakes of Greece; Editions Ziti: Thessaloniki, Greece, 1997. [Google Scholar]
  22. Kontoes, C.; Elias, P.; Sykioti, O.; Briole, P.; Remy, D.; Sachpazi, M.; Veis, G.; Kotsis, I. Displacement field and fault model for the September 7, 1999 Athens Earthquake inferred from ERS2 Satellite radar interferometry. Geophys. Res. Lett. 2000, 27, 3989–3992. [Google Scholar] [CrossRef]
  23. Foumelis, M.; Parcharidis, I.; Lagios, E.; Voulgaris, N. Evolution of post-seismic ground deformation of the Athens 1999 earthquake observed by SAR interferometry. J. Appl. Geophys. 2009, 69, 16–23. [Google Scholar] [CrossRef]
  24. Kotsis, I.; Kontoes, C.; Paradissis, D.; Karamitsos, S.; Elias, P.; Papoutsis, I. A Methodology to Validate the InSAR Derived Displacement Field of the September 7th, 1999 Athens Earthquake Using Terrestrial Surveying. Improvement of the Assessed Deformation Field by Interferometric Stacking. Sensors 2008, 8, 4119–4134. [Google Scholar] [CrossRef] [PubMed]
  25. Roumelioti, Z.; Dreger, D.; Kiratzi, A.; Theodoulidis, N. Slip Distribution of the 7 September 1999 Athens Earthquake Inferred from an Empirical Green’s Function Study. Bull. Seismol. Soc. Am. 2003, 93, 775–782. [Google Scholar] [CrossRef]
  26. Baumont, D.; Courboulex, F.; Scotti, O.; Melis, N.S.; Stavrakakis, G. Slip distribution of the Mw 5.9, 1999 Athens earthquake inverted from regional seismological data. Geophys. Res. Lett. 2002, 29, 15-1–15-4. [Google Scholar] [CrossRef]
  27. Papadimitriou, P.; Voulgaris, N.; Kassaras, I.; Kaviris, G.; Delibasis, N.; Makropoulos, K. The Mw = 6.0, 7 September 1999 Athens earthquake. Nat. Hazards 2002, 27, 15–33. [Google Scholar] [CrossRef]
  28. Pavlides, S.; Papadopoulos, G.; Ganas, A. The Fault that Caused the Athens September 1999 Ms = 5.9 Earthquake: Field Observations. Nat. Hazards 2002, 27, 61–84. [Google Scholar] [CrossRef]
  29. Goldsworthy, M.; Jackson, J.; Haines, J. The continuity of active fault systems in Greece. Geophys. J. Int. 2002, 148, 596–618. [Google Scholar] [CrossRef]
  30. Bouckovalas, G.; Kouretzis, G. Stiff soil amplification effects in the 7 September 1999 Athens (Greece) earthquake. Soil Dyn. Earthq. Eng. 2001, 21, 671–687. [Google Scholar] [CrossRef]
  31. Eftaxias, K.; Kapiris, P.; Polygiannakis, J.; Bogris, N.; Kopanas, J.; Antonopoulos, G.; Peratzakis, A.; Hadjicontis, V. Signature of pending earthquake from electromagnetic anomalies. Geophys. Res. Lett. 2001, 28, 3321–3324. [Google Scholar] [CrossRef]
  32. Kampes, B. Radar Interferometry: Persistent Scatterer Technique; Remote Sensing and Digital Image Processing Series; Springer: London, UK, 2006. [Google Scholar]
  33. Sousa, J.; Hooper, A.; Hanssen, R.; Bastos, L. Comparative Study of Two Different PS-INSAR Approaches: DEPSI vs. STAMPS. In Proceedings of the Workshop Fringe 2009, Frascati, Italy, 30 November–4 December 2009; Volume 677.
  34. Kampes, B.; Usai, S. Delft Object oriented radar interferometric software. In Proceedings of the 2nd International Symposium on Operationalization of Remote Sensing, Enschede, The Netherlands, 16–20 August 1999.
  35. Scharroo, R.; Visser, P. Precise orbit determination and gravity field improvement for the ERS satellites. J. Geophys. Res. Oceans 1998, 103, 8113–8127. [Google Scholar] [CrossRef]
  36. Farr, T.G.; Kobrick, M. Shuttle radar topography mission produces a wealth of data. Eos Trans. AGU 2000, 81, 583–585. [Google Scholar] [CrossRef]
  37. Hooper, A. A multi-temporal InSAR method incorporating both persistent scatterer and small baseline approaches. Geophys. Res. Lett. 2008, 35, L16302. [Google Scholar] [CrossRef]
  38. Ketelaar, G.; van Leijen, F.; Marinkovic, P.; Hanssen, R. Multi-track PS-InSAR datum connection. In Proceedings of the 2007 IEEE International Geoscience and Remote Sensing Symposium (IGARSS 2007), Barcelona, Spain, 23–28 July 2007; pp. 2481–2484.
  39. Wright, T.J.; Parsons, B.E.; Lu, Z. Toward mapping surface deformation in three dimensions using InSAR. Geophys. Res. Lett. 2004, 31. [Google Scholar] [CrossRef]
  40. Bechor, N.B.D.; Zebker, H.A. Measuring two-dimensional movements using a single InSAR pair. Geophys. Res. Lett. 2006, 33. [Google Scholar] [CrossRef]
  41. Fialko, Y.; Simons, M.; Agnew, D. The complete (3-D) surface displacement field in the epicentral area of the 1999 MW7.1 Hector Mine Earthquake, California, from space geodetic observations. Geophys. Res. Lett. 2001, 28, 3063–3066. [Google Scholar] [CrossRef]
  42. Samieie-Esfahany, S.; Hanssen, R.; van Thienen-Visser, K.; Muntendam-Bos, A. On the effect of horizontal deformation on InSAR subsidence estimates. In Proceedings of the Workshop Fringe 2009, Frascati, Italy, 30 November–4 December 2009.
  43. Hu, J.; Li, Z.; Ding, X.; Zhu, J.; Zhang, L.; Sun, Q. Resolving three-dimensional surface displacements from InSAR measurements: A review. Earth-Sci. Rev. 2014, 133, 1–17. [Google Scholar] [CrossRef]
  44. Kallis, G.; Coccossis, H. Managing Water for Athens: From the Hydraulic to the Rational Growth Paradigm. Eur. Plan. Stud. 2003, 11, 245–261. [Google Scholar] [CrossRef]
  45. Svigkas, N.; Papoutsis, I.; Loupasakis, C.; Tsangaratos, P.; Kiratzi, A.; Kontoes, C. Land subsidence rebound detected via multi-temporal InSAR and ground truth data in Kalochori and Sindos regions, Northern Greece. Eng. Geol. 2016, 209, 175–186. [Google Scholar]
  46. Hetland, E.A.; Simons, M.; Dunham, E.M. Post-seismic and interseismic fault creep I: Model description. Geophys. J. Int. 2010, 181, 81–98. [Google Scholar] [CrossRef]
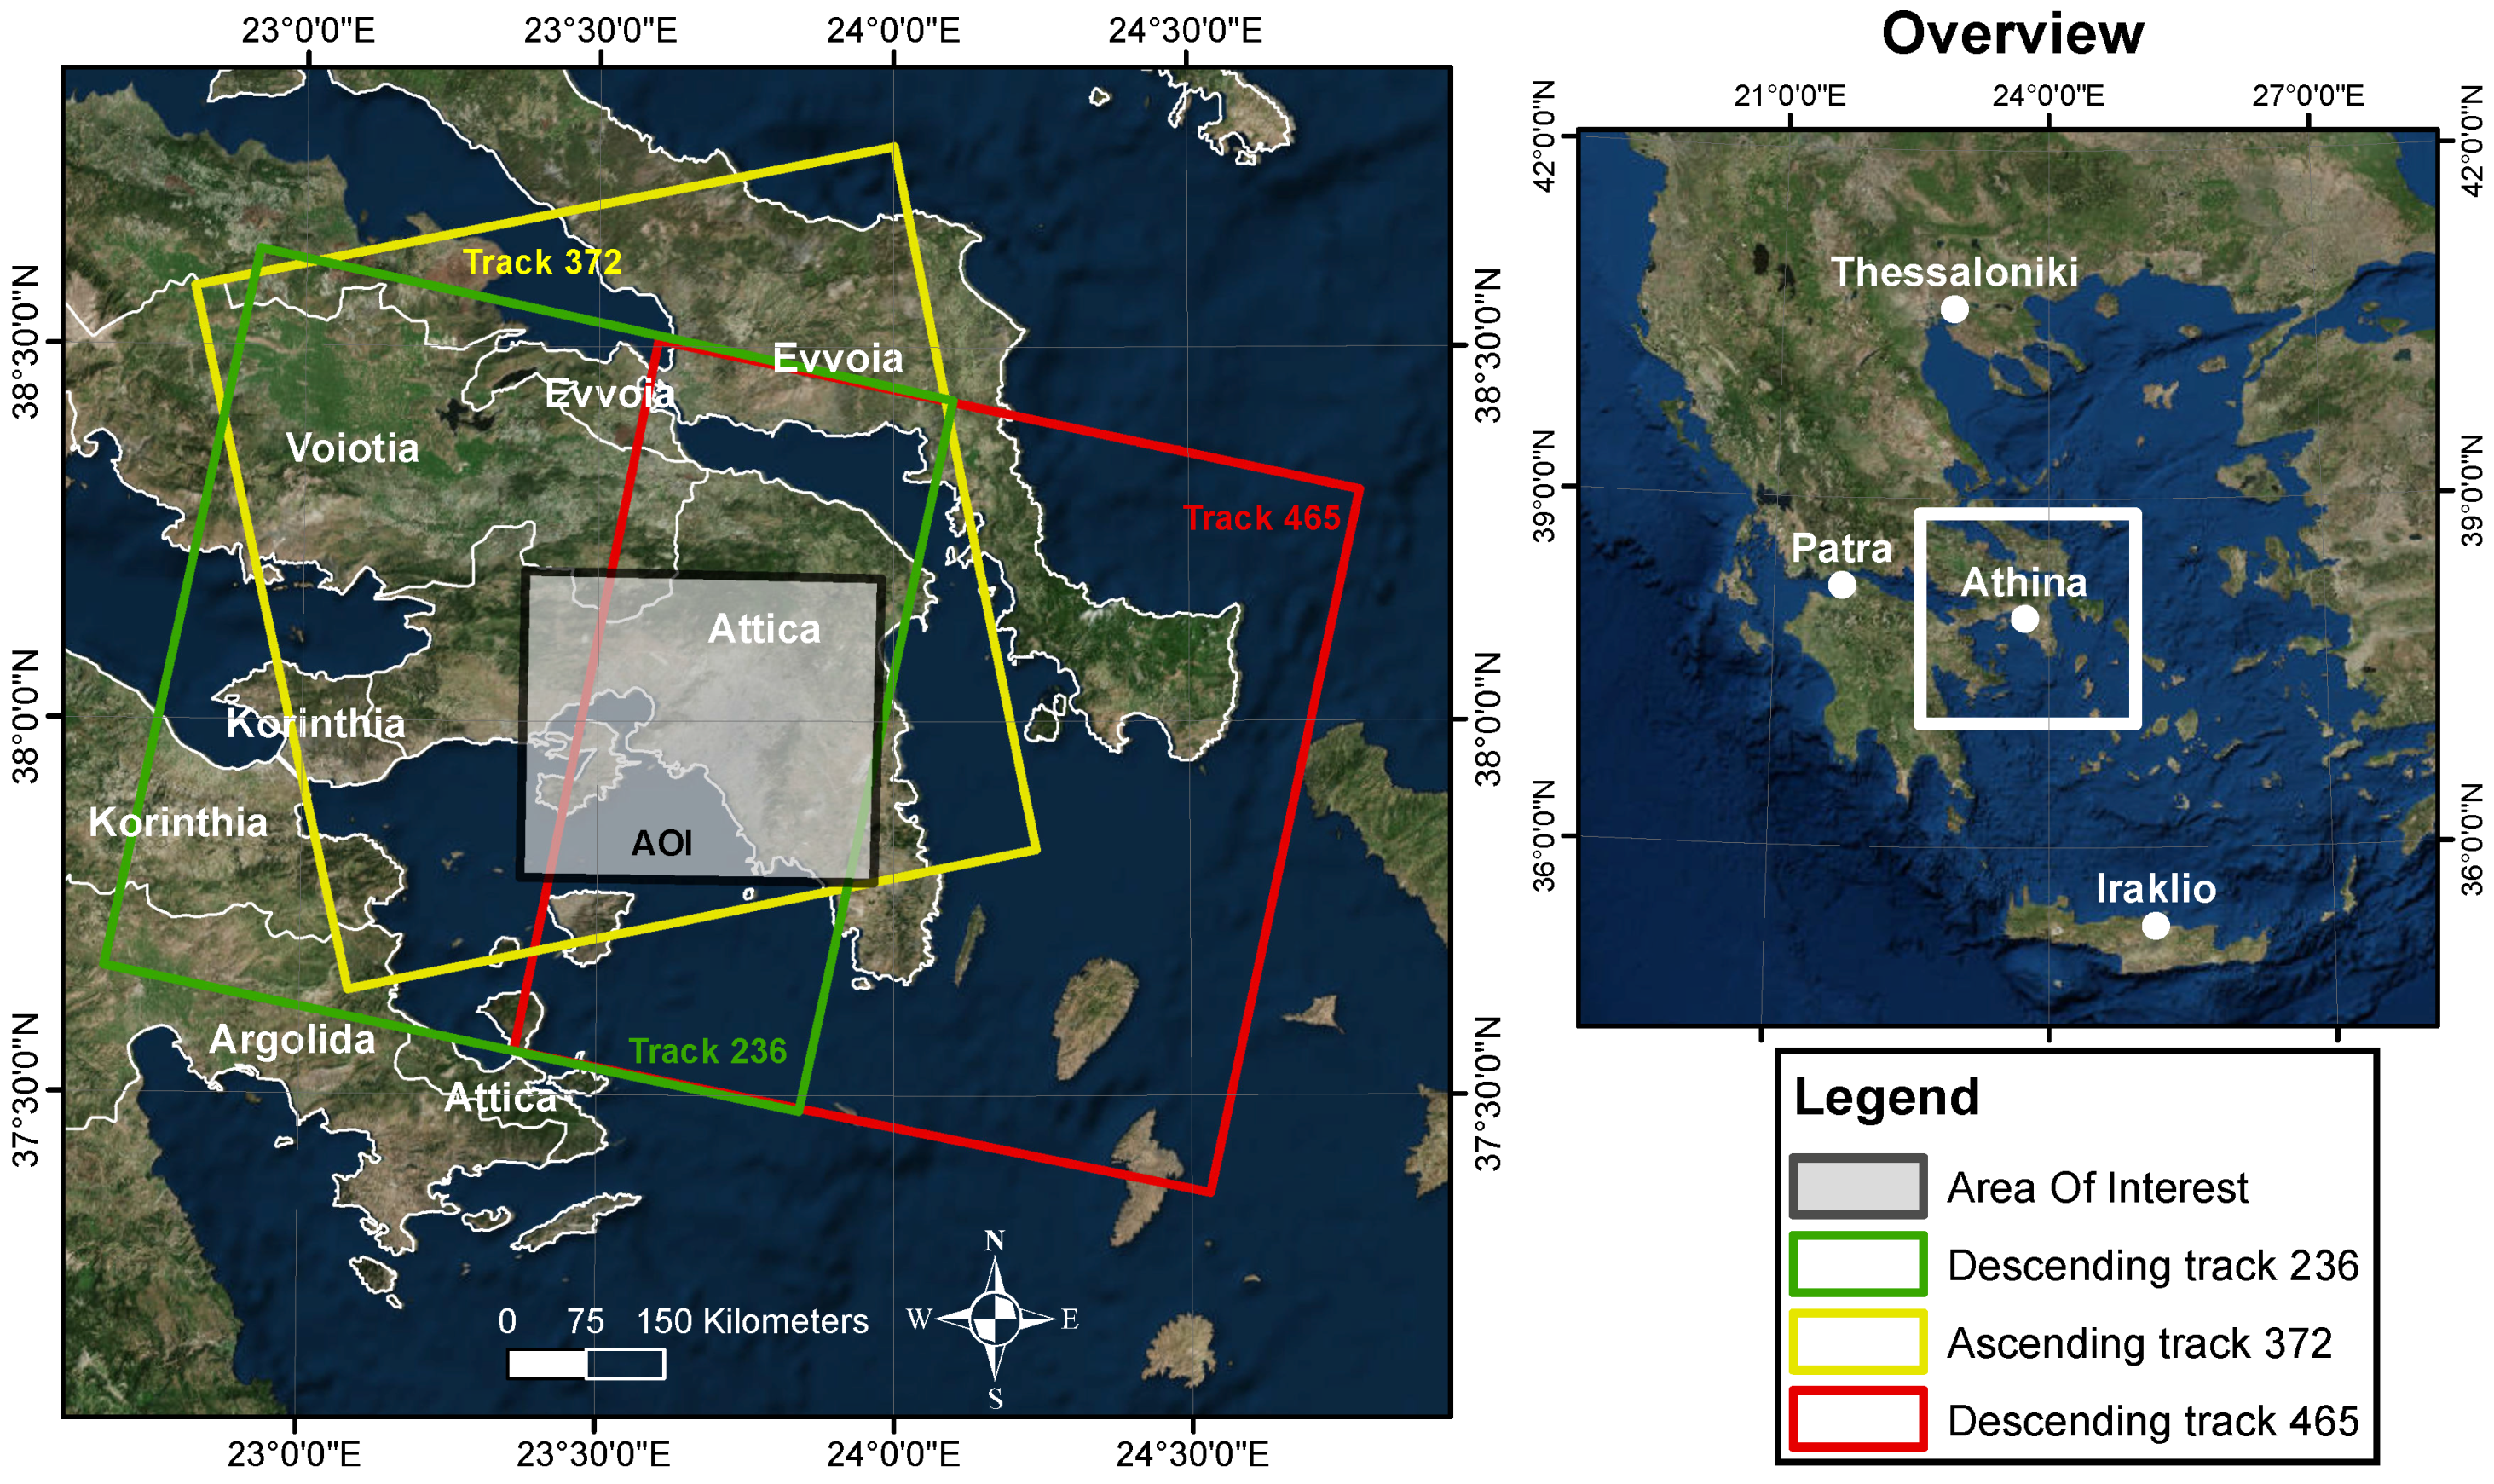
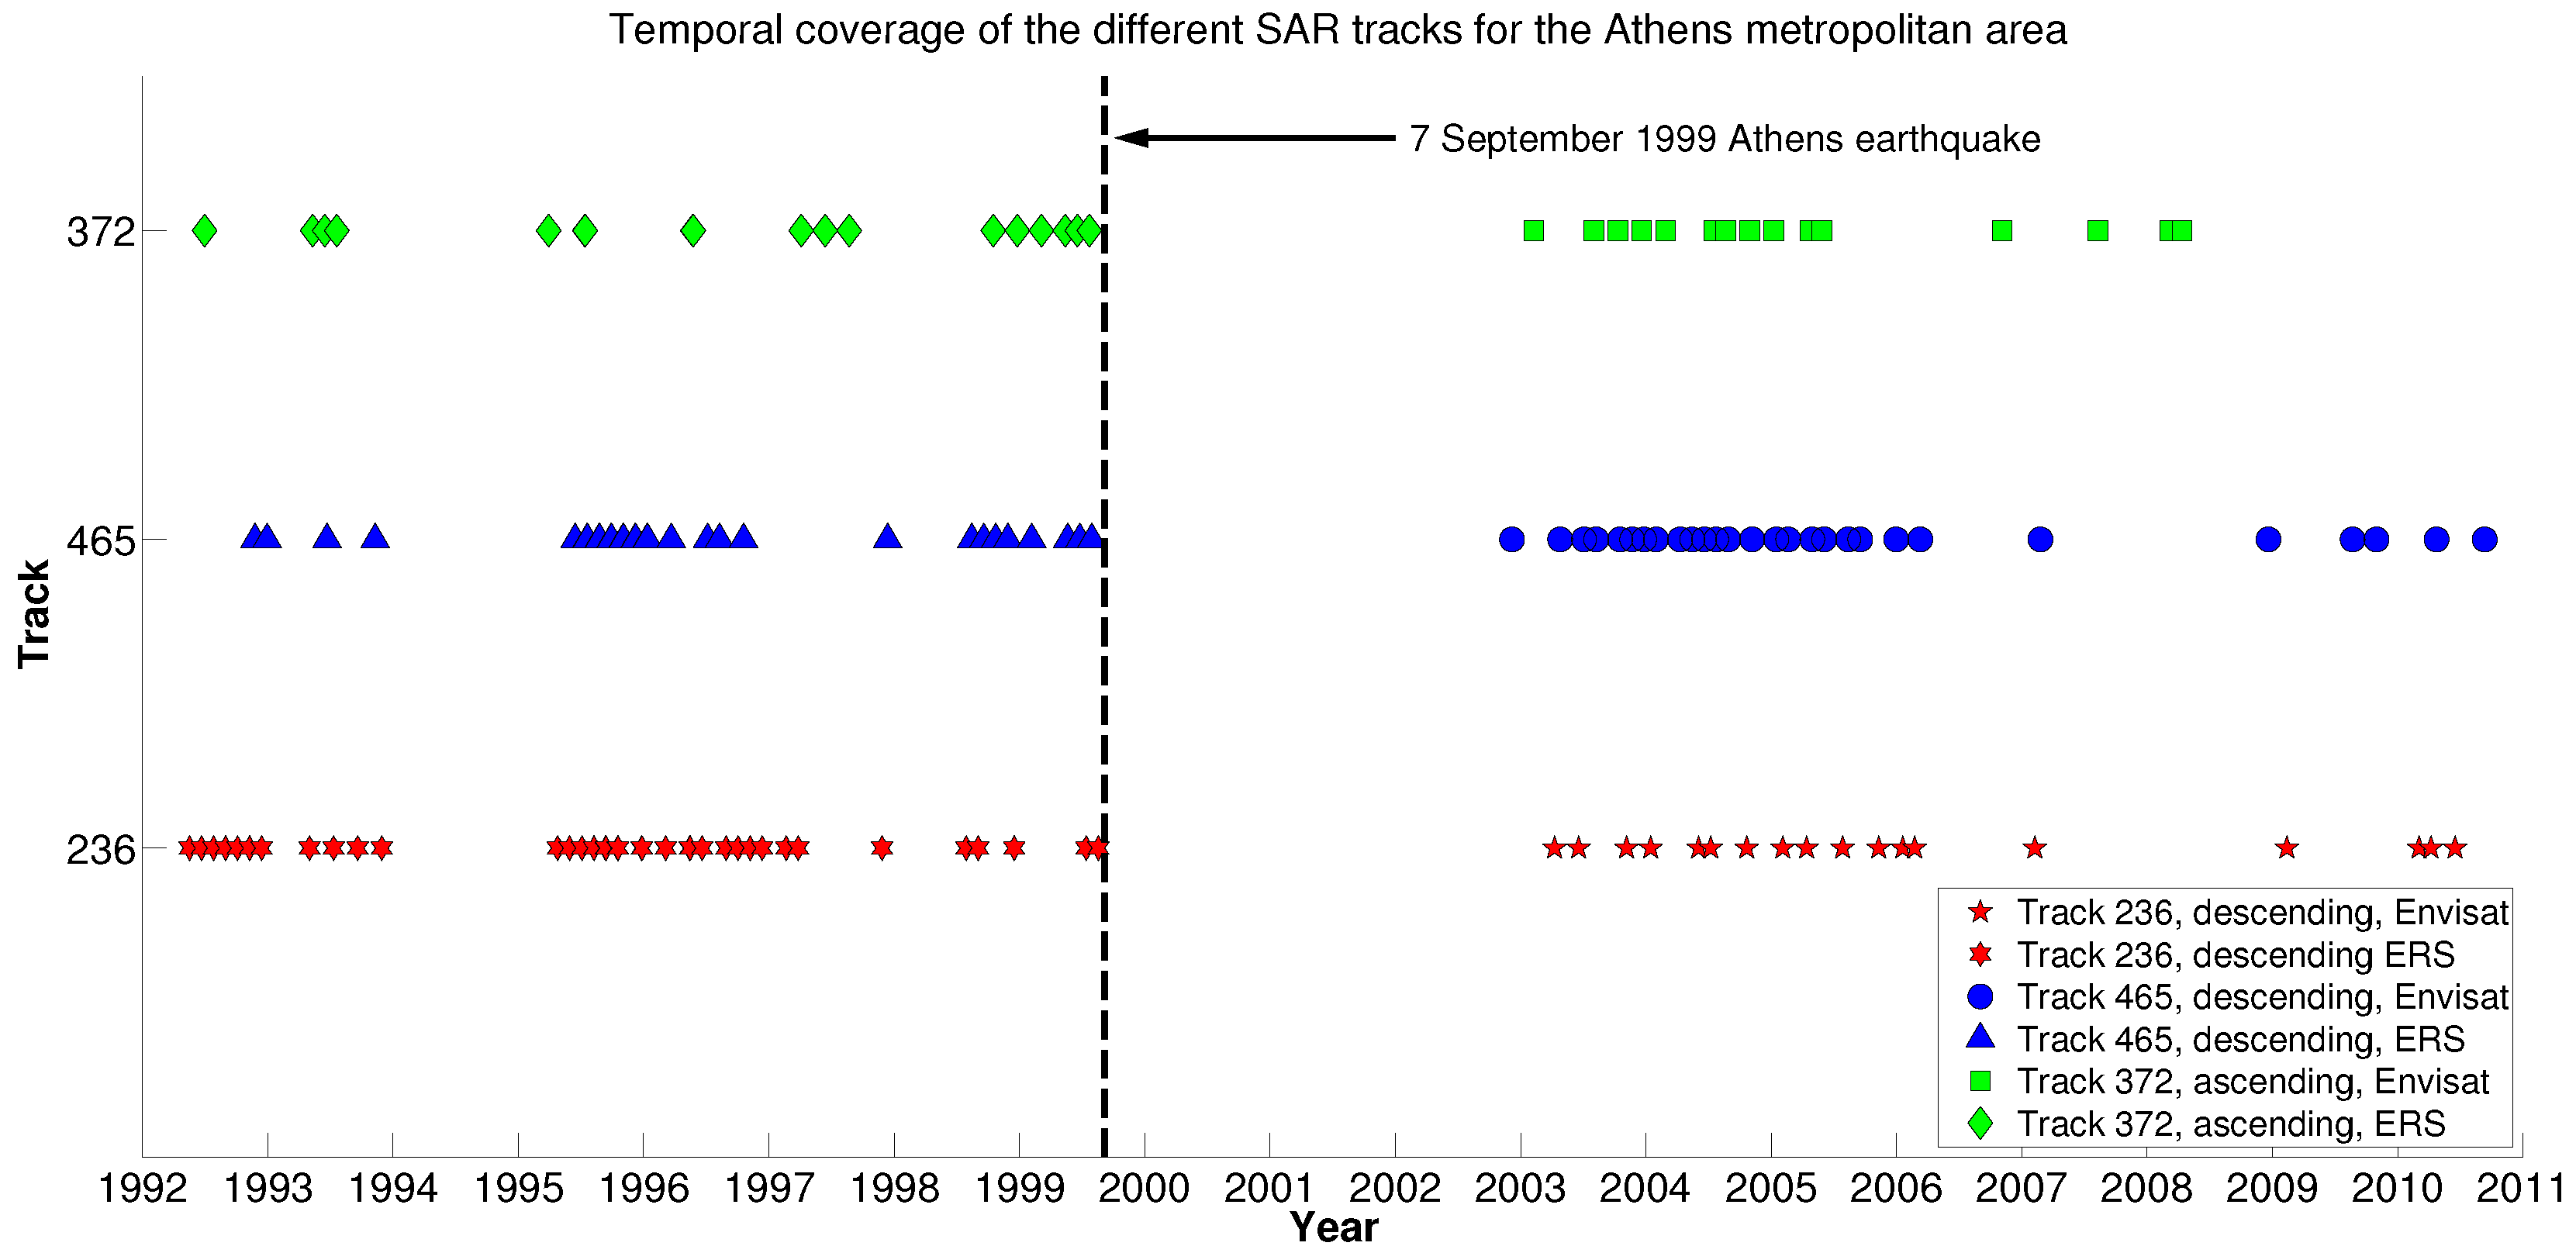
Figure 1. Location of the area of interest, the Athens metropolitan study area in Greece, and the corresponding footprints of the two adjacent descending and the one ascending satellite tracks. The same tracks were used for both ERS and Envisat datasets. Attica prefecture is also shown on this reference map.
Remotesensing 09 00276 g001
Figure 2. Major tectonic structures and geological map of the study area, reproduced from Lekkas [17]. The epicenter of the 1999 Athens earthquake is marked. 1. Alluvials; 2. fluvial deposits and terraces; 3. scree; 4. Pliocene deposits; 5. Neogene formations; 6. alpine formations; 7. fault.
Remotesensing 09 00276 g002
Figure 3. Temporal coverage of the six interferometric stacks. The vertical dashed line corresponds to the timing of the 1999 Athens earthquake. Two adjacent descending tracks and one ascending track were used for the 1992–1999 and 2002–2010 periods that were studied.
Remotesensing 09 00276 g003
Figure 4. LOS velocity field for all six interferometric stacks. The black box is the reference area. The left column contains ground velocity maps under different viewing angles for the period 1992–1999, while the right column contains the corresponding maps for the period 2002–2010. The displacement patterns for the adjacent descending tracks processed are quite similar, providing intra-track cross-validation based on independent datasets. Discrepancies observed between descending and ascending tracks of the same observation period are further analyzed to estimate vertical and horizontal ground velocity contributions.
Remotesensing 09 00276 g004
Figure 5. Zoom in selected AOIs (Areas of Interest) for the 1992–1999 time series analysis. (A) Overview of the study area and selected AOIs; (B) the velocity field for AOI1, in the wider region around the city of Piraeus; (C) AOI2 in the northern suburbs of Kifisia, Ekali and Kryoneri. For both AOIs, local displacement patterns emerge and are mapped in great detail. For the selected scatterers P1, P2 and P3, (D) shows their deformation histories. A linear velocity model is fit to P1 and P2, linear (P1) and linear (P2) correspondingly, while a second degree polynomial model, Poly.(P3), fits better the data for P3. The latter is an indication that the region of Kifisia has been experiencing non-linear motion.
Remotesensing 09 00276 g005
Figure 6. Zoom in the northern suburbs of Athens for the 2002–2010 time series analysis. (A) Overview of the study area and selected AOI; (B) the velocity field in AOI3 based on descending track T465 data, since it contains the most image acquisitions; scatterers P3, P4, P5 and P6 mentioned in the text are also shown; (C) deformation history of scatterer P3 in Kifisia, plotting the 1992–1999 period, as well (Figure 5D). In the period 2002–2010, a change in the LOS motion direction is observed with respect to the 1992–1999 period, moving from subsidence to uplift. For the entire analysis period, spanning from 1992–2010, a polynomial function fits the estimates best, consistent with our non-linear motion assumption for Kifisia.
Remotesensing 09 00276 g006
Figure 7. Geometry of the velocity decomposition to vertical and horizontal components. (Left) Projection of the up, east and north components of the 3D velocity vector to the ascending satellite LOS and (Right) different contribution of the horizontal components of the descending and ascending satellite passes. ALD a and ALD d vectors correspond to the descending and ascending azimuth look angle directions, respectively. Similar sketches can be generated for the descending imaging geometry.
Remotesensing 09 00276 g007
Figure 8. (A) Vertical and (B) horizontal velocities overlaid with the fault network in wider Athens for the 1992–1999 period. Among others, Kifisos thrust, the Fyli fault and the Thriasio fault, close to the Athens 1999 earthquake (star), are marked. Negative values in the up direction correspond to subsidence, while positive values in the horizontal direction correspond to westward motion. Kifisia, Kryoneri and Ekali municipalities experience primarily subsidence, while in the vicinity of the Thriasio fault, there are indications of zones with counter-force movement.
Remotesensing 09 00276 g008
Figure 9. (A) Vertical and (B) horizontal velocities overlaid with the fault network in wider Athens for the 2002–2010 period. Negative values in the up direction correspond to subsidence, while positive values in the horizontal direction correspond to westward motion. Kifisia, previously subsiding, is now in uplift. The counter-force zones present in Figure 8B have disappeared, i.e., the 1992–1999 eastward motion of Parnitha Mountain has halted in the post-earthquake analysis.
Remotesensing 09 00276 g009
Table 1. The six distinct interferometric stacks processed, consisting of ERS-1/-2 and Envisat, descending and ascending tracks, for the 1992–2010 time span.
StackIntervalTrackSatelliteModeScenes
I1992–1999236ERSDescending37
II1992–1999465ERSDescending30
III1992–1999372ERSAscending18
IV2003–2010236EnvisatDescending18
V2002–2010465EnvisatDescending28
VI2003–2008372EnvisatAscending15

