Article

An Improved Combination of Spectral and Spatial Features for Vegetation Classification in Hyperspectral Images

1
Beijing Research Center for Information Technology in Agriculture, Beijing Academy of Agriculture and Forestry Sciences, Beijing 100097, China
2
National Engineering Research Center for Information Technology in Agriculture, Beijing 100097, China
3
Key Laboratory of Agri-informatics, Ministry of Agriculture, Beijing 100097, China
4
Beijing Engineering Research Center of Agriculture Internet of Things, Beijing 100097, China
5
Beijing Research Center for Agricultural Standards and Testing, Beijing Academy of Agriculture and Forestry Sciences, Beijing 100097, China
6
School of Engineering and Information Technology, University of New South Wales at Canberra, Canberra 2600, ACT, Australia
*
Author to whom correspondence should be addressed.
Remote Sens. 2017, 9(3), 261; https://doi.org/10.3390/rs9030261
Submission received: 29 December 2016 / Revised: 3 March 2017 / Accepted: 8 March 2017 / Published: 12 March 2017
(This article belongs to the Special Issue Earth Observations for Precision Farming in China (EO4PFiC))

Abstract

:
Due to the advances in hyperspectral sensor technology, hyperspectral images have gained great attention in precision agriculture. In practical applications, vegetation classification is usually required to be conducted first and then the vegetation of interest is discriminated from the others. This study proposes an integrated scheme (SpeSpaVS_ClassPair_ScatterMatrix) for vegetation classification by simultaneously exploiting image spectral and spatial information to improve vegetation classification accuracy. In the scheme, spectral features are selected by the proposed scatter-matrix-based feature selection method (ClassPair_ScatterMatrix). In this method, the scatter-matrix-based class separability measure is calculated for each pair of classes and then averaged as final selection criterion to alleviate the problem of mutual redundancy among the selected features, based on the conventional scatter-matrix-based class separability measure (AllClass_ScatterMatrix). The feature subset search is performed by the sequential floating forward search method. Considering the high spectral similarity among different green vegetation types, Gabor features are extracted from the top two principal components to provide complementary spatial features for spectral features. The spectral features and Gabor features are stacked into a feature vector and then the ClassPair_ScatterMatrix method is used on the formed vector to overcome the over-dimensionality problem and select discriminative features for vegetation classification. The final features are fed into support vector machine classifier for classification. To verify whether the ClassPair_ScatterMatrix method could well avoid selecting mutually redundant features, the mean square correlation coefficients were calculated for the ClassPair_ScatterMatrix method and AllClass_ScatterMatrix method. The experiments were conducted on a widely used agricultural hyperspectral image. The experimental results showed that (1) the The proposed ClassPair_ScatterMatrix method could better alleviate the problem of selecting mutually redundant features, compared to the AllClass_ScatterMatrix method; (2) compared with the representative mutual information-based feature selection methods, the scatter-matrix-based feature selection methods generally achieved higher classification accuracies, and the ClassPair_ScatterMatrix method especially, produced the highest classification accuracies with respect to both data sets (87.2% and 90.1%); and (3) the proposed integrated scheme produced higher classification accuracy, compared with the decision fusion of spectral and spatial features and the methods only involving spectral features or spatial features. The comparative experiments demonstrate the effectiveness of the proposed scheme.

Graphical Abstract

1. Introduction

Recently, hyperspectral remotely-sensed image has gained popularity in precision agriculture applications. Compared to multispectral images, e.g., Landsat TM and Moderate Resolution Imaging Spectroradiometer (MODIS) images, hyperspectral images have higher spectral resolution and provide a more contiguous spectrum [1]. Thus, hyperspectral images are expected to have good capability in quantifying the biophysical and biochemical attributes of vegetation, which can reflect crop growth status and guide site-specific agricultural management [2,3,4,5]. In practical applications, the first step required is to discriminate the crop of interest from the other objects and determine its planting area. Usually, it is easy to distinguish vegetated areas from other surface types by setting a threshold of normalized difference vegetation index (NDVI) [6,7]. As to the discrimination of different vegetation types using hyperspectral images, this is a typical hyperspectral image classification problem. With the increase in the number of spectral bands, theoretical and practical problems may arise, and traditional techniques that are applied on multispectral images are no longer applicable for processing of hyperspectral images. A well-known problem in hyperspectral image classification is the curse of dimensionality, which shows that the supervised classification accuracy actually decreases as the number of features increases after a few features when keeping the number of training samples constant [8]. It is also worth mentioning that only a small number of these numerous features are really informative for the classification problem at hand [9]. Therefore, feature selection and feature extraction are widely used to reduce the dimensionality of features before hyperspectral image classification [10]. Feature extraction aims to project the data into a new feature space with lower dimension than before through a mathematical transformation [11]. These methods can well eliminate the correlations among features. However, the new features generated by these methods are often not interpretable with physical meanings. Feature selection falls into two categories which are the filter approach and wrapper approach. Due to its independence from the classifier, the filter approach is widely used in computer vision and pattern recognition, and aims at selecting a feature subset from the original feature set according to a selection criterion and the feature subset search algorithm [10]. Compared to feature extraction methods, feature selection methods can retain well the physical nature of features and thus the features selected have good interpretability [10,12]. However, the correlations between features are often unavoidable in feature selection methods and how to select the features with fewer correlations and better class separability is a key issue in constructing new feature selection criteria. Although either feature extraction or feature selection methods have their own advantages and disadvantages, we restrict our algorithm to supervised filter feature selection in this paper.
The construction of feature selection criterion is a critical component in filter feature selection method. At present, commonly used feature selection criteria are mutual information (MI)-based criteria and class separability-based criteria. Selection criteria based on MI theory have the advantages in terms of distribution-free, nonlinear and low computational load for multiclass cases [13]. The minimal-redundancy-maximal-relevance (mRMR) [14], joint mutual information (JMI) [15], conditional mutual information maximization (CMIM) [16] and double input symmetrical relevance (DISR) [17] are representative MI-based feature selection methods. The main goal of class separability-based feature selection methods is to maximize the separability described as divergence and its variations or distance measures such as spectral angle mapper, Jeffries–Matusita (JM) distance, Bhattacharyya distance, and scatter-matrix-based measures [18]. An overview of various feature mining approaches and techniques is given in [10], which include both feature extraction and feature selection using either wrapper approach or filter approach. Among these class separability measures, the scatter-matrix-based class separability measure is often favored and chosen as a selection criterion in feature selection due to its simplicity and robustness [19]. The scatter-matrix-based class separability measure is constructed by using two of three scatter matrices which are within-class scatter matrix, between-class scatter matrix and total scatter matrix [18]. Traditionally, these scatter matrices are calculated from the perspective of all classes. However, direct optimization of this measure tends to select a set of discriminative but mutually redundant features [20]. To alleviate this problem, this study tries to calculate the scatter-matrix-based class separability value for each pair of classes and then take the average of all the pairwise class separability value as the final selection criterion. Feature selection is performed by maximizing the criterion using sequential floating forward search (SFFS) [21]. Moreover, a comparative analysis of MI-based feature selection methods and class separability measure-based feature selection methods is also conducted from an experimental point of view for vegetation classification. To our knowledge, there has been no work to date that has compared their capabilities for vegetation classification.
It is well acknowledged that there exist great spectral similarities among different green vegetation types. Although hyperspectral images allow a better discrimination among similar ground objects than traditional multispectral sensors, the ability for discriminating different vegetation types is limited only based on spectral features. There are many studies that have reported that properly combining multiple features always results in good classification performance [22,23,24,25]. Therefore, this study proposes an integrated scheme for vegetation classification by simultaneously exploiting image spectral and spatial information to improve vegetation classification accuracy. The spectral features are selected by the proposed scatter-matrix-based feature selection method. Gabor features [26] are extracted to provide spatial features. The selected spectral features and Gabor spatial features are stacked and then the proposed feature selection method is conducted on the stacked feature vector to form the final feature vector for classification. In order to explore the proper method in combination of spectral and spatial features for vegetation classification, decision-level fusion of spectral and spatial features is also investigated and compared with the proposed integrated scheme in the study. The rest of this paper is organized as follows. In Section 2, we provide the proposed integrated scheme in details, including the description of the proposed scatter-matrix-based feature selection method, Gabor feature extraction and the combination method of spectral and spatial features. Section 3 reports the experimental results on a widely used agricultural hyperspectral image. The discussion and conclusions are given in Section 4 and Section 5, respectively.

2. Methods

2.1. Scatter-Matrix-Based Feature Selection

Class separability, which can be represented by divergence, transformed divergence, Bhattacharyya distance, JM distance, and scatter-matrix-based measures, is a widely used concept in feature selection criteria construction. In this study, we mainly focus on the scatter-matrix-based class separability measure due to its simplicity and rich physical meaning [19]. Conventional scatter-matrix-based class separability measures are constructed by the combination of two of three scatter matrices which are the within-class scatter matrix (SW), between-class scatter matrix (SB) and total scatter matrix (ST). Let ( x , y ) ( R n × y ) represent a sample, where R n denotes an n-dimensional feature space and y = { 1 , 2 , , M } is the set of class labels. N i is the number of samples in the ith class. Let x ij be the jth sample in the ith class, μ i be the mean vector for the ith class and μ be the mean vector for all classes. The three scatter matrices mentioned above are defined as
SW = i = 1 M [ j = 1 N i ( x ij μ i ) ( x ij μ i ) T ] ,   SB = i = 1 M N i ( μ i μ ) ( μ i μ ) T ST = i = 1 M [ j = 1 N i ( x ij μ ) ( x ij μ ) T ] = SW + SB
In contrast to the conventional calculation of the three scatter matrices, we make our calculations for each pair of classes first in the study. Thus, the scatter-matrix-based class separability measure for each pair of classes can be formulated as Equation (2):
S ij = trace { SW ij 1 ( SB ij + SW ij ) }
where S ij is the class separability value between class i and class j; and SW ij and SB ij are the within-class scatter matrix and between-class scatter matrix for class i and class j, respectively. They can be formulated as follows:
SW ij = P i Σ i + P j Σ j
SB ij = P i ( μ i μ 0 ) ( μ i μ 0 ) T + P j ( μ j μ 0 ) ( μ j μ 0 ) T
μ 0 = P i μ i + P j μ j
where P i and P j   are prior probabilities of class i and class j, respectively; Σ i and Σ j are covariance matrices of class i and class j; μ i , μ j and μ 0 are mean vectors of class i, class j and these two classes, respectively.
The larger value of S ij means smaller within-class scattering and larger between-class scattering for class i and class j. It indicates that it is easier to discriminate class i from class j. This measure can be extended from two classes to M (M > 2) classes by averaging the separability value of each pair of classes, as seen in Equation (6).
S ave = i = 1 M j > i M P i P j S ij
It can be observed that the scatter-matrix-based class separability measure used here is different from the conventional one in which the within-class scatter matrix and between-class scatter matrix are calculated for all classes at a time, while the proposed one first focuses on each pair of classes and then averages all pairwise S ij as the final class separability S ave . Zhou et al. has proven that directly optimizing the conventional scatter-matrix-based class separability measure tends to select a set of discriminative but mutually redundant features and then result in missing other discriminative and complementary features [20]. Consequently, the further improvement in classification accuracy for subsequent classification will be hindered. Several studies have pointed out that the feature subset that can best describe the discriminants may vary for different pairs of classes [27,28,29]. Therefore, calculating for each pair, the class separability value might increase the scattering extent of selected features in the process of maximizing the averaged pairwise class separability value. This is the main motivation of the proposed feature selection criterion.
An efficient search strategy is critical in a feature selection method since it is a combinatorial problem to find an optimal feature subset achieving the largest class separability S ave under the predefined number of selected features. In practice, suboptimal search methods such as best individual N [19], and sequential forward selection (SFS) and its variations are widely used rather than an exhaustive search which has high computational cost, especially when the number of candidate features is large. It has been reported that best individual N cannot produce a suitable solution when there exist high correlations among candidate features which always happens in hyperspectral imaging [1]. Thus, SFFS, which has been proven to be superior to the SFS method, is chosen to find suboptimal feature subset in the proposed feature selection method. The SFFS method is characterized by dynamically changing the number of features inclusion or exclusion at each step that avoids the nesting problem. It includes new features by applying the basic SFS method and successively excludes the worst features in the newly-updated feature set, provided a further improvement can be made on the previous sets [21].
It is worth mentioning that the proposed feature selection method (hereafter referred to as ClassPair_ScatterMatrix) still seeks one feature subset to distinguish among all the classes although it calculates the class separability value for each pair of classes. In order to explicitly evaluate the effectiveness of the proposed feature selection criterion, the mean square correlation coefficient for each pair of selected features is calculated to measure the redundancy among the selected features. The higher mean square correlation coefficient indicates higher redundancy among the selected features. The conventional scatter-matrix-based feature selection method (hereafter referred to as AllClass_ScatterMatrix), also follows the class separability construction mode as shown in Equation (2), using the SFFS method to search the feature subset, and is used in the comparison of redundancy of selected features with the proposed feature selection method.

2.2. GaborSpatial Features Extraction

Nowadays, a wide range of techniques is used to extract spatial features of hyperspectral image, such as spatial features based on gray-level co-occurrence matrix (GLCM) [30], morphological profiles [31] and the two-dimensional Gabor wavelet [26]. Considering that the conventional two-dimensional Gabor wavelet has already been proven superior for representing the spatial features in the natural scene and aerial photographs [23], the two-dimensional Gabor wavelet is used in this paper. The top two principal components (PCs) of the hyperspectral image which account for about 90% variance of image are used as base images for the Gabor features extraction. A two-dimensional Gabor wavelet function Ψ μ , v ( z ) is an elliptical Gaussian envelope modulated by a complex plane wave as defined in Equation (7).
Ψ μ , v ( z ) = k μ , v 2 σ 2 e ( k μ , v 2 z 2 / 2 σ 2 ) [ e izk μ , v e σ 2 / 2 ]
where z = (x, y) is the spatial domain variable; . denotes the norm operator; and μ and v define the orientation and scale of Gabor kernel. k μ , v is the frequency vector and is equal to k v e i μ in which k v = k max / f v , μ = π μ / 8 ; k max is maximal frequency and f is the spacing factor between kernels in frequency domain; σ is the ratio of Gaussian window width and wavelength, and determines the number of oscillations under the Gaussian envelope.
The Gabor wavelet representation of a grayscale image could be obtained by convoluting the image with a set of Gabor kernels as defined in Equation (7). The convolution of image Img (z) and a Gabor kernel Ψ μ , v ( z ) is defined as Equation (8).
G μ , v ( z ) = Img ( z ) Ψ μ , v ( z )
where denotes convolution operator; and G μ , v ( z ) is the convolution result using Gabor kernel with orientation μ and scale v . It could be also defined as G μ , v ( z ) = M μ , v ( z ) . exp ( i θ μ , v ( z ) ) in which M μ , v ( z ) and θ μ , v ( z ) represent magnitude and real part, respectively. The magnitude part contains the local energy change of image and is used as texture feature image for subsequent analyses. In practice, Gabor transformation of a grayscale image could be conducted in m scales and n orientations. Therefore, each pixel of an image could have a corresponding feature vector with m*n dimensions.

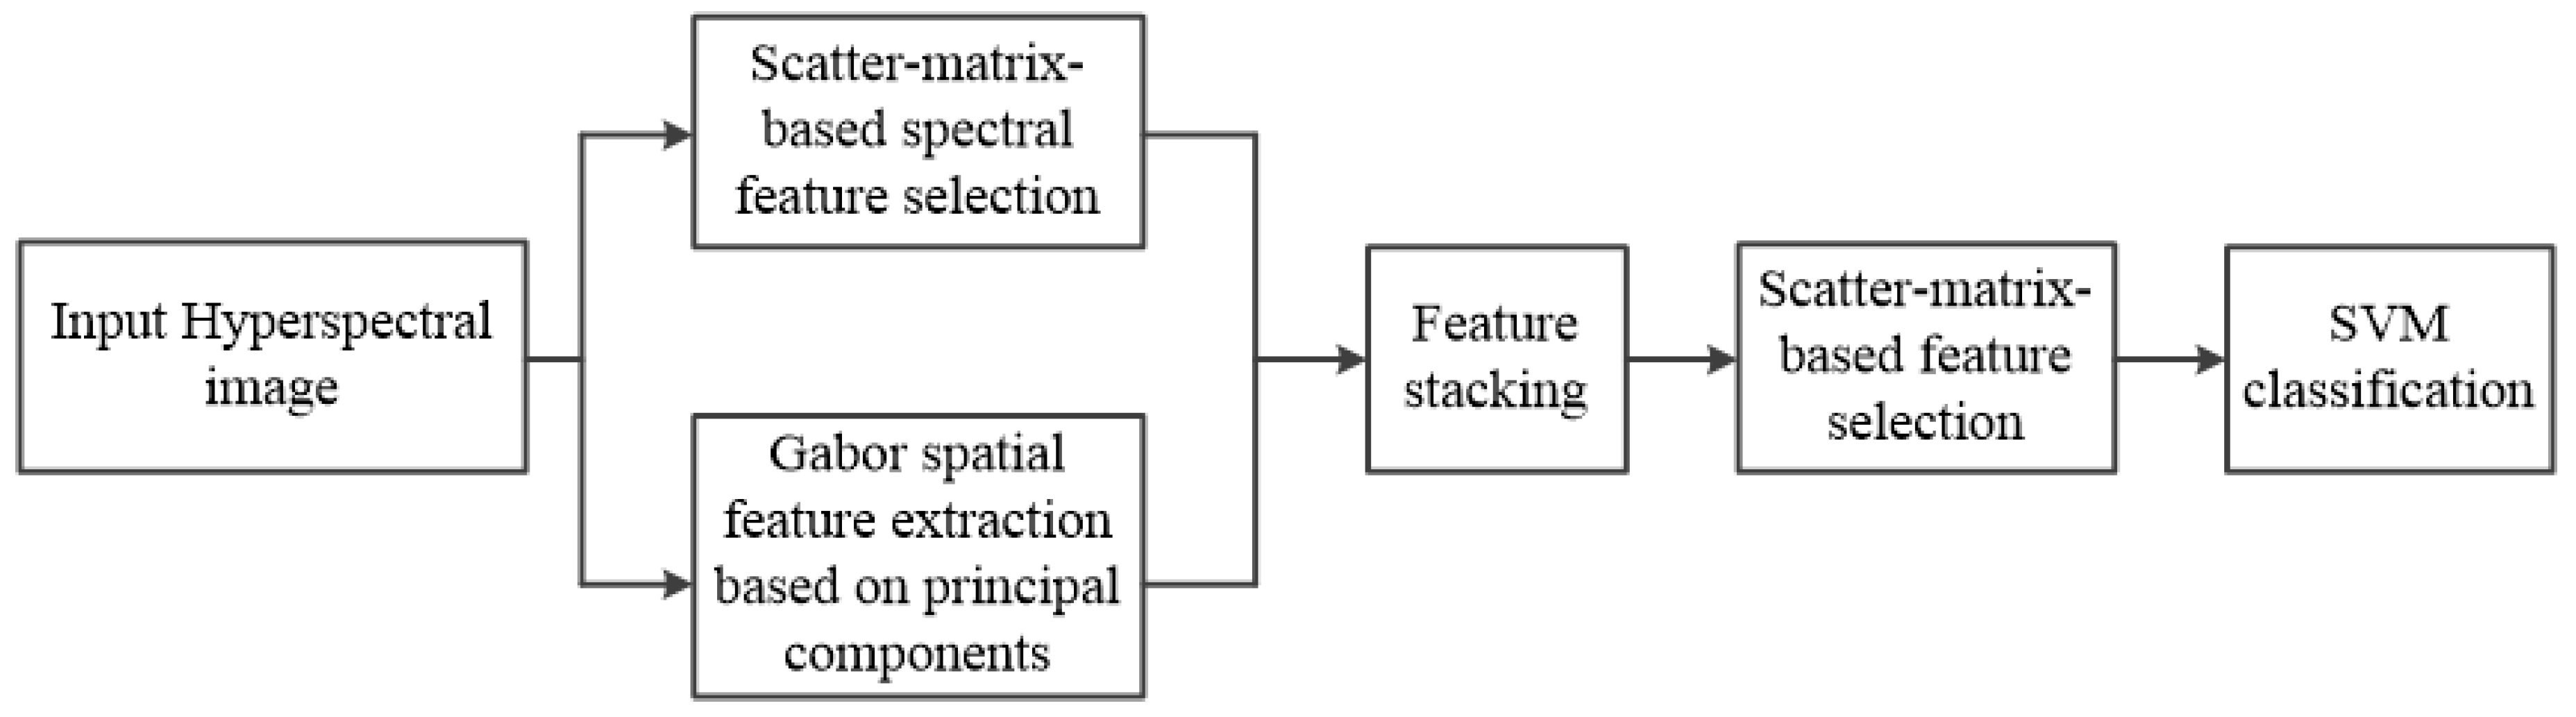
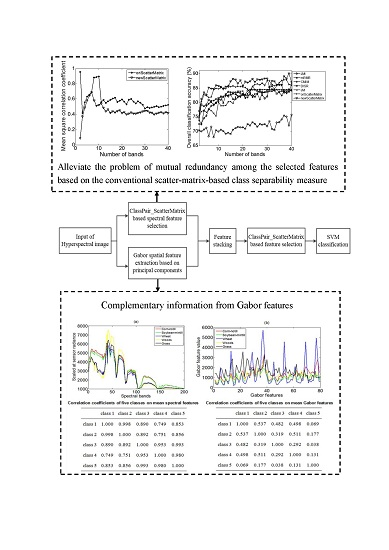
2.3. An Integrated Scheme for Vegetation Classification

Considering that the spectra of different vegetation types have high spectral similarities, it is necessary to involve spatial features in vegetation classification for providing complementary information to spectral features. However, as in all classification problems, it should be noticed that increasing the number of features used does not produce an endless improvement in classification accuracy due to the well-known curse-of-dimensionality problem. Moreover, not all features are useful for a specific classification problem at hand. Therefore, the proposed scatter-matrix-based feature selection is also conducted on the newly formed feature vector which consists of the spectral bands selected by the scatter-matrix-based feature selection and Gabor spatial features. Figure 1 shows the flowchart of the proposed integrated scheme (hereafter referred to as the SpeSpaVS_ClassPair_ScatterMatrix).

3. Experiments and Analysis

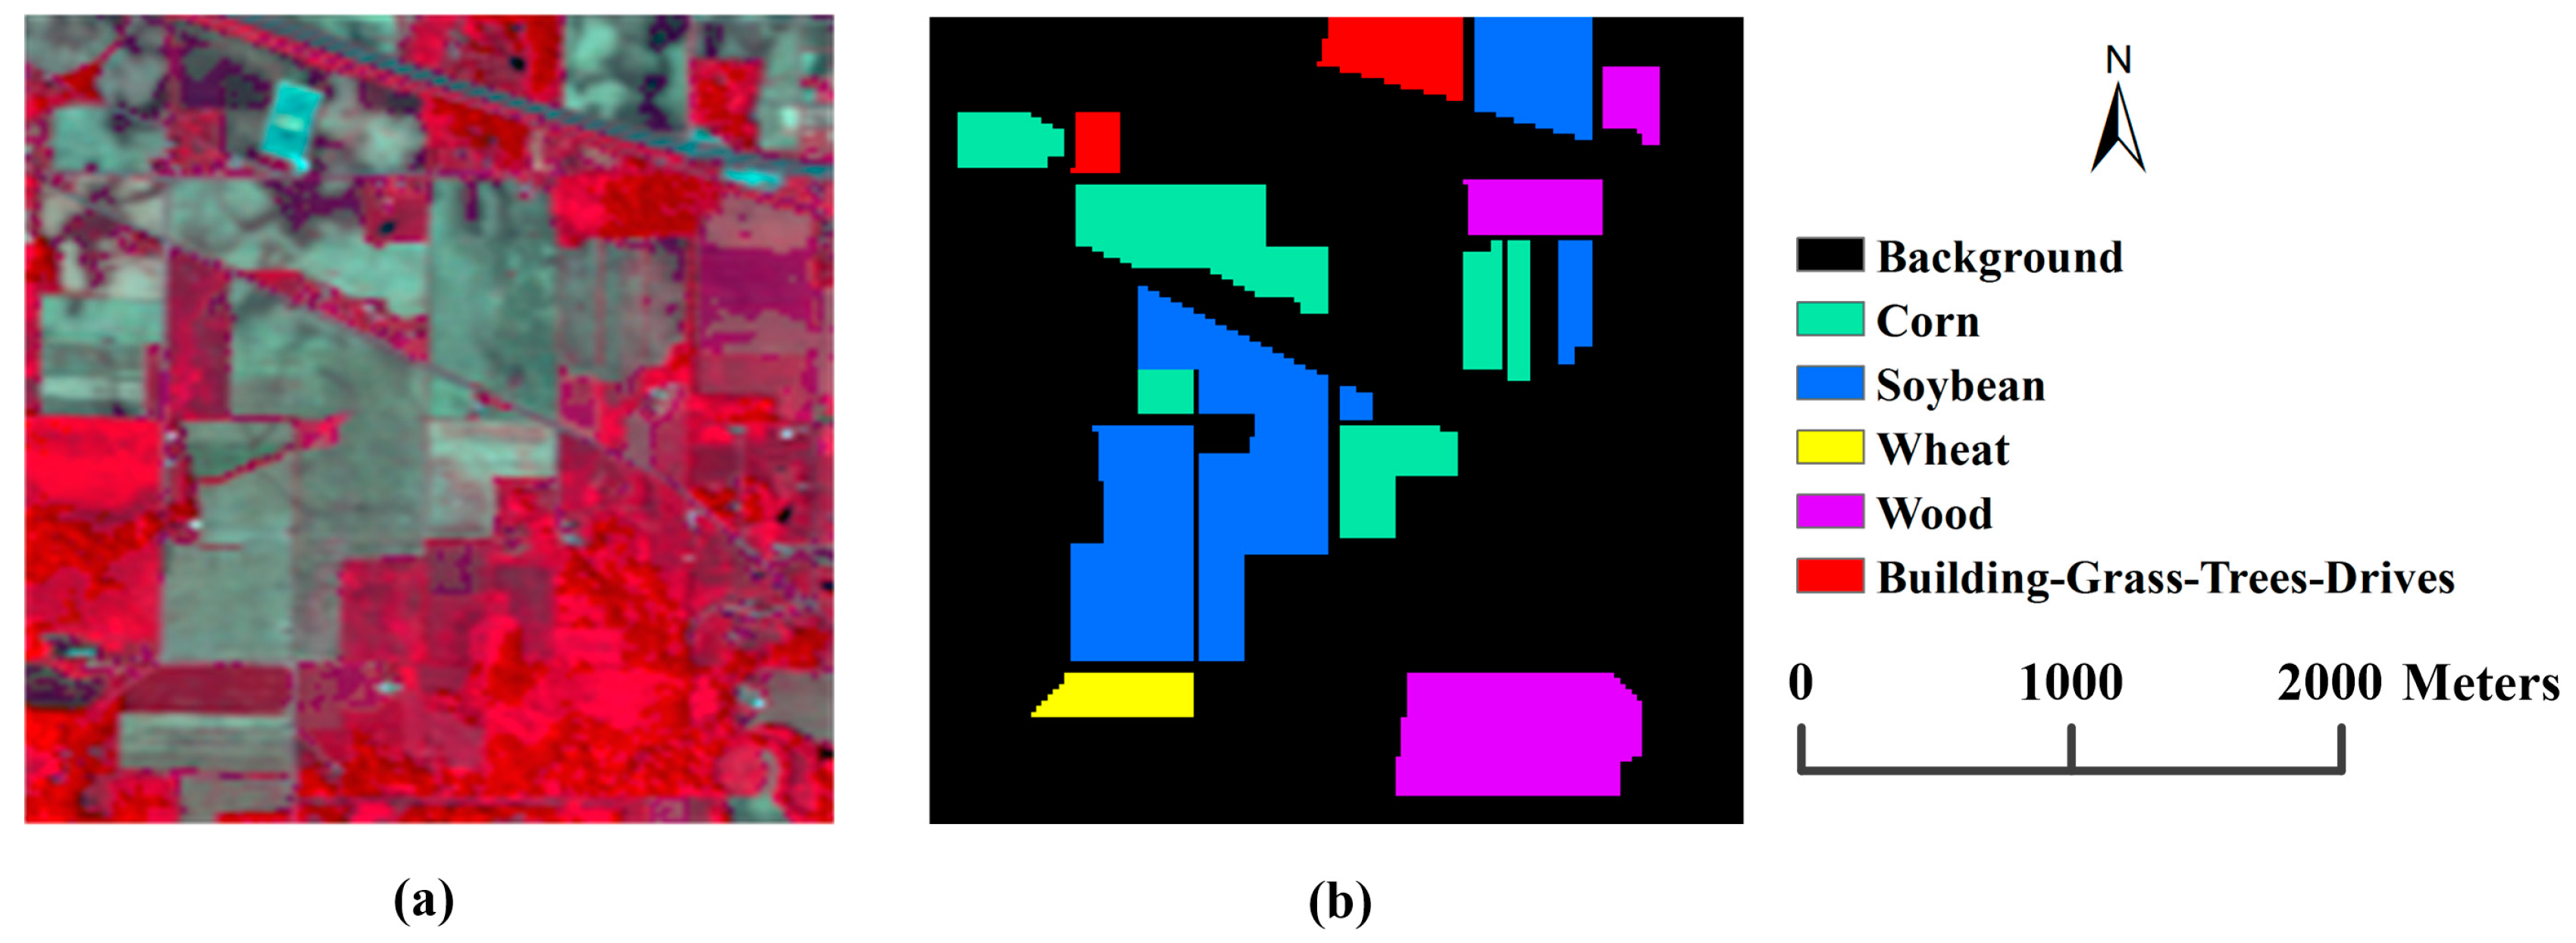
3.1. Data Set Description

The experiments and comparative analyses were conducted on the widely used Indian Pine hyperspectral image which was collected by the Airborne Visible/Infrared Imaging Spectrometer (AVIRIS) over the agriculture area of Indian Pines test site in northwestern Indiana, USA in 1992 [32,33]. The spatial size of this image is 145 × 145 pixels and the spatial resolution is 20 m per pixel. Water absorption bands and bands with low signal to noise ratio were removed, leaving 200 bands to use for the experiments. Figure 2 shows the three-band color composite of this hyperspectral image and the corresponding ground truth. This image has high complexity and the corresponding ground truth image is available, so it is appropriate to use it for the evaluation of the proposed methods in the paper. Five vegetation classes are considered and their details are shown in Table 1. The reason for choosing these classes is that corn, soybean and wheat are widely planted crops in China, and meanwhile woods and grass/trees around buildings or roads are common to appear nearby croplands in practical scenes.

3.2. Experimental Settings

In the experiments, two data sets were generated based on the Indian Pine hyperspectral image and each data set consisted of independent training data set and testing data set. In the two data sets, the number of training samples for each class was 100 and 150, respectively, and the rest of them were formed into testing data sets. The training samples for each class were selected randomly. The two data sets were respectively referred to as data set 1 and data set 2 in order to facilitate description. The multiclass, one versus one, support vector machine (SVM) classifier was chosen to classify different classes, due to its good performance in the classification of hyper-dimensional feature sets. The LIBSVM (A Library for Support Vector Machines) package [34] was used for the implementation of the soft-margin SVM with radial basis function (RBF) kernel which has been proven superior in a large amount of different classification problems. Two important parameters C and σ of SVM with RBF kernel were determined by grid-search using fivefold cross-validation. The overall classification accuracy (OA), Kappa coefficient (KC) and producer accuracy (PA) were used to evaluate the performance of methods investigated in the paper.

3.3. Results

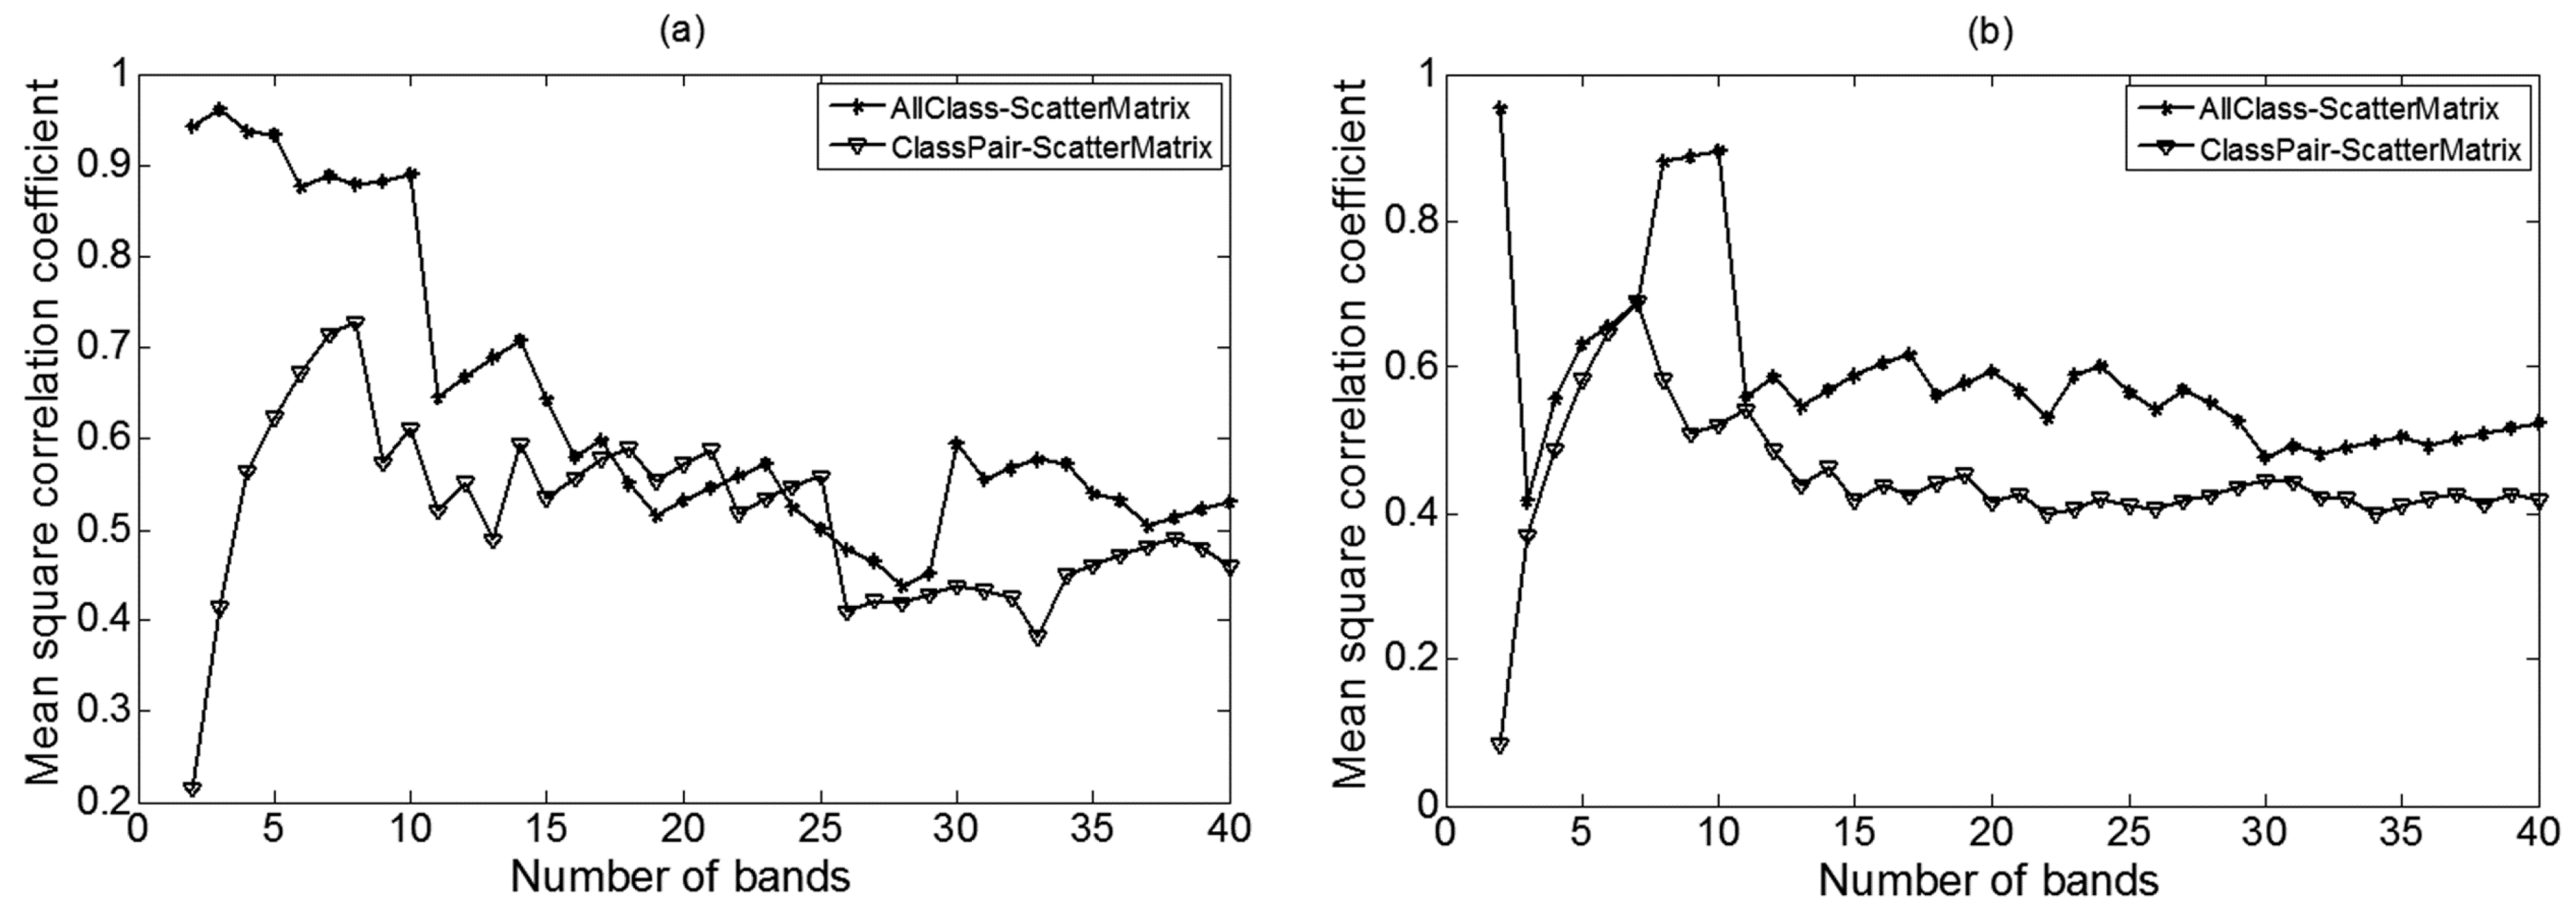
3.3.1. Performance of the Scatter-Matrix-Based Feature Selection Method

To validate whether the proposed ClassPair_ScatterMatrix method can better avoid selecting mutually redundant features than the AllClass_ScatterMatrix method, the mean square correlation coefficients of all pairwise spectral bands selected by the two methods were calculated and compared. The higher mean square correlation coefficient indicates higher redundancy among the selected spectral bands. Figure 3 shows the mean square correlation coefficient versus the number of selected spectral bands for the ClassPair_ScatterMatrix and AllClass_ScatterMatrix methods on the two data sets. It can be obviously found that the mean square correlation coefficient for the AllClass_ScatterMatrix method was always higher (or close) than (or to) that for the ClassPair_ScatterMatrix method under each number of selected spectral bands (Figure 3a,b). The results indicated that the proposed ClassPair_ScatterMatrix method performed better in avoiding selecting mutually redundant features compared to the AllClass_ScatterMatrix method.
A comparative analysis of the ClassPair_ScatterMatrix, AllClass_ScatterMatrix, JM-based feature selection method and four typical MI-based feature selection methods including JMI, mRMR, CMIM and DISR was conducted from the perspective of classification accuracy. Figure 4 shows the performance of each method, in terms of overall classification accuracy, as a function of the number of selected spectral bands, using different training sets. As expected, with the increase in the number of selected bands, the overall classification accuracy of each method first increases and then approaches a saturation value generally. With increasing the number of training samples, the highest overall classification accuracy of each method increases. The performance of each method on the data set 1 and data set 2 shows the similar trend. As can be observed in Figure 4a,b, the proposed ClassPair_ScatterMatrix method produced better results than the other methods in most cases. Of these methods, mRMR performs the worst and the overall classification accuracy of this method had the strongest fluctuation when the number of selected bands was less than 10.
In order to clearly compare the performance of each feature selection method, the best results of seven feature selection methods and the corresponding number of selected bands on data set 2 are shown in Table 2. In the experiment, the classification result using all bands was considered as a benchmark. As can be observed in Table 2, the classification result using all bands was better than those of the other methods except the AllClass_ScatterMatrix method and the proposed ClassPair_ScatterMatrix method. It indicates that the feature selection methods based on the scatter-matrix-based class separability measure are more effective than those based on MI for vegetation classification. Meanwhile, it also supports that the SVM classifier has good capability in the classification of hyper-dimensional feature sets since the curse of dimensionality does not appear when using all the bands in the classification. Among the seven feature selection methods, the ClassPair_ScatterMatrix method achieved the highest overall accuracy. The ClassPair_ScatterMatrix method increased the overall accuracy by 4.5% and 14.1%, compared to the JM method the mRMR method, respectively. The JMI method and JM-based feature selection method produced better overall accuracies than the CMIM method and DISR method. The mRMR method yielded the lowest overall accuracy. The ClassPair_ScatterMatrix method selected more spectral bands when achieving the highest overall accuracy, relative to the DISR method, JM-based feature selection method and CMIM method. However, it can be observed that the proposed ClassPair_ScatterMatrix method can still obtain the higher overall accuracy when using the same number of spectral bands with the DISR method than the other methods (Figure 4b). Comparing the producer accuracy of each class, it can be found that class 3 (wheat) and class 4 (wood) are much more easily classified than the other classes. The proposed ClassPair_ScatterMatrix method improves the producer accuracy for each class, compared with the other methods. It indicates that the proposed ClassPair_ScatterMatrix method can well capture useful bands for the discrimination of different vegetation types.

3.3.2. Complementary Information from Gabor Spatial Features

Different green vegetation types have very similar spectral curves (Figure 5a). It is necessary to extract spatial features to provide complementary information for better discrimination among these different vegetation types. In order to give a straightforward view that the Gabor spatial features can provide complementary information for vegetation spectral features, mean spectra and mean Gabor features were calculated for each class, and then the correlation coefficient for each pair of mean spectra and the correlation coefficient for each pair of mean Gabor features were calculated based on data set 2. Figure 5 shows the mean spectral and mean spatial feature curves for the five classes investigated in the paper and the corresponding correlation coefficient tables. As seen from the correlation coefficient tables, the correlation coefficient for each pair of mean spectra was higher than that for each pair of mean Gabor features. It suggests that the Gabor features may provide useful information to well discriminate different vegetation types which have high spectral similarities. For example, corn (class 1) and soybean (class 2) have a very similar spectral feature curve and a high correlation coefficient 0.998; however, we might distinguish them because they have a low correlation coefficient 0.537 on Gabor features.

3.3.3. Performance of the Proposed Integrated Scheme

The Gabor spatial features are integrated with spectral features selected by the ClassPair_ScatterMatrix method to improve the overall accuracy of vegetation classification. In order to demonstrate the effectiveness of Gabor features for characterizing vegetation spatial information, Gabor features are compared with GLCM-based features and morphological features, which are two widely used spatial features. The most widely used GLCM-based spatial measures, which are angular second moment (energy), entropy, contrast and homogeneity (inverse difference moment) [35], are used in the study. These spatial features were all extracted from the first two principal components which accounted for over 90% variance of the image. The sizes of moving windows were respectively set to 17 and 31 for GLCM-based spatial feature extraction and Gabor spatial feature extraction after several trails. The disk-shaped structuring element was used and its size was set to 2, 4, 6, 8 and 10 in turn for conducting sequential morphological operations. It can be observed that Gabor features got higher overall accuracy than GLCM-based features (GLCM) and morphological features (Morph) (Table 3 and Table 4). The Gabor features increased overall accuracy by 4.1%, compared to the morphological features (Table 4). The overall accuracy obtained by morphological features was improved by 5.2% relative to the GLCM-based features (Table 4). It is worth noticing that the Gabor features yielded higher overall accuracy than the spectral features selected by the proposed ClassPair_ScatterMatrix method (Table 3 and Table 4). It indicates that spatial features play a more important role than spectral features for vegetation classification.
To testify the effectiveness of the proposed integrated scheme (SpeSpaVS_ClassPair_ScatterMatrix), the decision-level fusion [23] of spectral features selected by the ClassPair_ScatterMatrix method and Gabor spatial features was conducted for comparison. This decision-level fusion method is referred to as SpeSpaDF hereafter. It has been reported that nonparametric weighted feature extraction (NWFE) has good capability in feature extraction [36]. In order to further prove the effectiveness of the proposed ClassPair_ScatterMatrix method, NWFE was used to reduce the dimensionality of the formed feature vector consisting of spectral features selected by the ClassPair_ScatterMatrix method and Gabor spatial features. This method is referred to as SpeSpaVS_NWFE later. The best classification results of each method on two data sets are shown in Table 3 and Table 4. On both data sets, the proposed integrated scheme (SpeSpaVS_ClassPair_ScatterMatrix) produced higher overall accuracy, compared to the SpeSpaDF method and SpeSpaVS_NWFE method. The SpeSpaVS_NWFE method achieved higher overall accuracy than the SpeSpaDF method. The overall classification accuracy of the proposed integrated scheme (SpeSpaVS_ClassPair_ScatterMatrix) was improved by 5.4% and 1.3%, compared to the SpeSpaDF method and SpeSpaVS_NWFE method, respectively (Table 4). It can be clearly observed from Table 3 and Table 4 that the overall accuracy of the proposed scheme (SpeSpaVS_ClassPair_ScatterMatrix) is higher than those of the methods using only spectral features or spatial features. The experimental results demonstrate that the proposed scheme can well exploit spectral and spatial features for vegetation classification. The results also suggest that it is more effective to stack spectral features with spatial features than to fuse spectral features with spatial features in decision level for vegetation classification. As mentioned before, Gabor spatial features have better capability than spectral features in discriminating different vegetation types. Therefore, it will not exert the advantage of spatial features when performing equally decision-level fusion of spectral features and spatial features. It is worth noticing that the SpeSpaDF method decreases the overall classification accuracy by 3.7%, compared to only using Gabor spatial features (Table 4). It further suggests that the overall classification accuracy could not be improved unless the spectral and spatial features are integrated in an appropriate way.
Using the training samples on data set 2, Figure 6 shows the classification maps of seven different methods including ClassPair_ScatterMatrix, AllClass_ScatterMatrix, JM, JMI, Gabor, SpeSpaDF and SpeSpaVS_ClassPair_ScatterMatrix. In can be clearly observed that the methods involving Gabor spatial features achieved better results in both accuracy and visual interpretation compared to the methods only using spectral features. After involving Gabor spatial features, the “salt and pepper” phenomenon was significantly reduced and the spatial continuity of each class was increased in Figure 6f–h. In these maps, the most spectrally similar class pair (corn and soybean) is focused on. It can be seen that corn exists in the soybean in all of the classification maps because corn and soybean have similar spectra. However, with the help of Gabor spatial features, Figure 6f–h show fewer misclassifications than Figure 6b–e for corn and soybean. In Figure 6f–h, the main misclassifications occurred among corn, soybean and wood. The proposed integrated scheme (Figure 6h) obviously decreased these misclassifications and achieved the best classification result among three methods involving Gabor spatial features.

4. Discussions

In the comparison of redundancy among the selected features, the proposed feature selection criterion, which calculates the pairwise scatter-matrix-based class separability values and then averages them, shows its superiority to the conventional scatter-matrix-based feature selection criterion in which within-class scatter matrix and between-class scatter matrix are calculated from the perspective of all classes. The lower mean square correlation coefficients for the proposed feature selection method indicate that the newly constructed selection criterion can better alleviate selecting mutually redundant features, relative to the conventional one (Figure 3). As seen in the comparative analysis of MI-based feature selection methods and class separability measure-based feature selection methods, class separability measure-based feature selection methods generally got higher overall accuracy for vegetation classification, especially scatter-matrix-based feature selection methods. This demonstrates the effectiveness of the proposed ClassPair_ScatterMatrix method in the vegetation classification. It can be observed that the optimal number of features to be selected in the proposed ClassPair_ScatterMatrix method could not be determined automatically. Actually, it is still an open issue in many feature selection methods and worth further study. Among the MI-based feature selection methods, the JMI, DISR and CMIM methods obtained higher classification accuracies and had higher stability, compared to the mRMR method. The results are consistent with that observed in Gavin et al. [15]. The results of this study also confirmed that the JMI, DISR and CMIM had better trade-off of accuracy and stability, especially the JMI method. It is also worth noting that the comparison of MI-based feature selection methods and class separability measure-based feature selection methods is only conducted from the perspective of experiment in the study, further theoretical comparison of them is necessary for constructing more effective feature selection criteria. A possible direction for future research is to reduce the mutual redundancy among the features selected by the scatter-matrix-based class separability measure-based feature selection methods.
In the exploration whether the Gabor spatial features could provide complementary information for the discrimination among different green vegetation types which have high similar spectral feature curves (Figure 5a), the lower correlation coefficients among the mean Gabor features of different vegetation types indicate that the Gabor spatial features can provide more discriminative information for vegetation classification compared to spectral features. In the following comparison of classification accuracies for different spectral feature selection methods and spatial feature extraction methods, the Gabor method produced the highest overall accuracies of 0.955 and 0.967 on both data sets, respectively. The experimental results also support that the Gabor spatial features are more capable of discriminating different vegetation types, compared to spectral features. This finding was similar with that observed in [24]. In [24], the misclassifications occurring in the most spectrally similar class pair (roof and road) were significantly reduced with the help of Gabor texture and shape features.
The proposed integrated scheme simultaneously exploring spectral and spatial features obtained the highest classification accuracy on both data sets among the investigated methods which employ either spectral features or spatial features. As to the visual interpretation, the classification map of the proposed scheme had less “salt and pepper” noise and better spatial continuity compared to those of the other methods (Figure 6). Generally, the classification maps of the methods involving spatial features had better spatial continuity, compared to those of the methods just using spectral features. The results were consistent with those observed in [24,25]. The main reason for it is that the within-class difference becomes smaller and the inter-class difference becomes larger after involving spatial features, compared to just using spectral features since different vegetation types have similar spectra. To determine the proper way for combining spectral features and spatial features, decision-level fusion of the spectral features selected by the ClassPair_ScatterMatrix method and the Gabor spatial features is also investigated in the study. It can be obviously seen that the decision-level fusion method obtained lower overall classification than the Gabor method. The experimental results indicate that equal decision-level fusion of spectral and spatial features cannot exploit the complementary information from the spatial features for vegetation classification. The vector stacking method and decision-level fusion method are widely used in integrating different types of features in hyperspectral classification. Kalluri et al. [23] proposed an effective approach for the decision-level fusion of the spectral reflectance information with the spectral derivative information for robust land cover classification. Zhang et al. [24] introduced the patch alignment framework to linearly combine multiple features and obtained a unified low-dimensional representation of these multiple features for hyperspectral image classification. This suggests that the optimal way for integrating different kinds of features is determined by the types of multiple features and the specific classification problem at hand. It has been mentioned above that the Gabor spatial features play a more important role in vegetation classification than the spectral features in the study. Further study is necessary to verify the weighted decision-level fusion of spectral and spatial features, and compare different integration methods of multiple features for vegetation classification of hyperspectral images.

5. Conclusions

This study mainly focuses on vegetation classification for precision agriculture applications using hyperspectral images. This study proposes a new feature selection method ClassPair_ScatterMatrix which calculates scatter-matrix-based class separability measure for each pair of classes and takes average of them as feature selection criterion in order to alleviate the problem of selecting mutually redundant features appearing in the feature selection method based on conventional scatter-matrix-based class separability measure. The SFFS is used to realize the feature subset search. As experimentally demonstrated, the proposed feature selection method gives the overall best feature selection performance among those compared. In order to provide complementary information to spectral features and further improve overall classification accuracy, an integrated scheme called SpeSpaVS_ClassPair_ScatterMatrix, is proposed. In this method, the spectral features selected by the ClassPair_ScatterMatrix method and Gabor spatial features are stacked to form a new feature vector and then the ClassPair_ScatterMatrix method is conducted on the formed feature vector to select informative features for subsequent classification. The experimental results indicate that the proposed SpeSpaVS_ClassPair_ScatterMatrix method can well exploit spectral features and spatial features simultaneously, and can further improve the vegetation classification accuracy. The experimental results also suggest that spatial features play a more important role than spectral features for vegetation classification, especially when there are high spectral similarities among different vegetation types. The comparison of the proposed integrated scheme with the decision-level fusion of spectral and Gabor spatial features further demonstrates that good classification performance cannot be achieved unless the spectral and spatial features are integrated in an appropriate way.

Acknowledgments

This study was supported by the Natural Science Foundation of China (61661136003, 41471285, 41471351, 41371349, 41601346), the National Key Research and Development Program (2016YFD0300602), and the Special Funds for Technology innovation capacity building sponsored by the Beijing Academy of Agriculture and Forestry Sciences (KJCX20170423). The authors would like to thank the Purdue University and MultiSpec project for providing the AVIRIS data set. The authors would also like to thank editors and three anonymous reviewers for their valuable comments in improving the quality of this paper.

Author Contributions

Yuanyuan Fu proposed the idea of the method, completed the programming and experiments, and drafted the paper. Chunjiang Zhao, Jihua Wang, Xiuping Jia, Guijun Yang and Xiaoyu Song gave comments and suggestions to the paper. Haikuan Feng checked the writing of the paper.

Conflicts of Interest

The authors declare no conflict of interest.

References

  1. Richards, J.A.; Jia, X. Remote Sensing Digital Image Analysis, 4th ed.; Springer: Berlin, Germany, 2006. [Google Scholar]
  2. Lelong, C.C.; Pinet, P.C.; Poilvé, H. Hyperspectral imaging and stress mapping in agriculture: A case study on wheat in Beauce (France). Remote Sens. Environ. 1998, 66, 179–191. [Google Scholar] [CrossRef]
  3. Thenkabail, P.S.; Enclona, E.A.; Ashton, M.S.; Van Der Meer, B. Accuracy assessments of hyperspectral waveband performance for vegetation analysis applications. Remote Sens. Environ. 2004, 91, 354–376. [Google Scholar] [CrossRef]
  4. Huang, W.; Lamb, D.W.; Niu, Z.; Zhang, Y.; Liu, L.; Wang, J. Identification of yellow rust in wheat using in-situ spectral reflectance measurements and airborne hyperspectral imaging. Precis. Agric. 2007, 8, 187–197. [Google Scholar] [CrossRef]
  5. Mahesh, S.; Manickavasagan, A.; Jayas, D.S.; Paliwal, J.; White, N.D.G. Feasibility of near-infrared hyperspectral imaging to differentiate Canadian wheat classes. Biosyst. Eng. 2008, 101, 50–57. [Google Scholar] [CrossRef]
  6. Cheng, W.C.; Chang, J.C.; Chang, C.P.; Su, Y.; Tu, T.M. A fixed-threshold approach to generate high-resolution vegetation maps for IKONOS imagery. Sensors 2008, 8, 4308–4317. [Google Scholar] [CrossRef] [PubMed]
  7. Tu, T.M.; Lu, H.T.; Chang, Y.C.; Chang, J.C.; Chang, C.P. A new vegetation enhancement/extraction technique for IKONOS and QuickBird imagery. IEEE Geosci. Remote Sens. 2009, 6, 349–353. [Google Scholar]
  8. Plaza, A.; Martinez, P.; Plaza, J.; Pérez, R. Dimensionality reduction and classification of hyperspectral image data using sequences of extended morphological transformations. IEEE Trans. Geosci. Remote Sens. 2005, 43, 466–479. [Google Scholar] [CrossRef]
  9. De Backer, S.; Kempeneers, P.; Debruyn, W.; Scheunders, P. A band selection technique for spectral classification. IEEE Geosci. Remote Sens. 2005, 2, 319–323. [Google Scholar] [CrossRef]
  10. Jia, X.; Kuo, B.C.; Crawford, M.M. Feature mining for hyperspectral image classification. Proc. IEEE 2013, 101, 676–697. [Google Scholar] [CrossRef]
  11. Harsanyi, J.C.; Chang, C.I. Hyperspectral image classification and dimensionality reduction: An orthogonal subspace projection approach. IEEE Trans. Geosci. Remote Sens. 1994, 32, 779–785. [Google Scholar] [CrossRef]
  12. Pal, M. Multinomial logistic regression-based feature selection for hyperspectral data. Int. J. Appl. Earth Obs. Geoinform. 2012, 14, 214–220. [Google Scholar] [CrossRef]
  13. Hossain, M.A.; Jia, X.; Pickering, M. Subspace detection using a mutual information measure for hyperspectral image classification. IEEE Geosci. Remote Sens. 2014, 11, 424–428. [Google Scholar] [CrossRef]
  14. Peng, H.; Long, F.; Ding, C. Feature selection based on mutual information criteria of max-dependency, max-relevance, and min-redundancy. IEEE Trans. Pattern Anal. Mach. Intell. 2005, 27, 1226–1238. [Google Scholar] [CrossRef] [PubMed]
  15. Brown, G.; Pocock, A.; Zhao, M.J.; Luján, M. Conditional likelihood maximisation: A unifying framework for information theoretic feature selection. J. Mach. Learn Res. 2012, 13, 27–66. [Google Scholar]
  16. Fleuret, F. Fast binary feature selection with conditional mutual information. J. Mach. Learn Res. 2004, 5, 1531–1555. [Google Scholar]
  17. Meyer, P.E.; Schretter, C.; Bontempi, G. Information-theoretic feature selection in microarray data using variable complementarity. IEEE J. Sel. Top. Signal Process. 2008, 2, 261–274. [Google Scholar] [CrossRef]
  18. Fukunaga, K. Introduction to Statistical Pattern Recognition; Academic Press: Cambridge, MA, USA, 2013. [Google Scholar]
  19. Wang, L. Feature selection with kernel class separability. IEEE Trans. Pattern Anal. Mach. Intell. 2008, 30, 1534–1546. [Google Scholar] [CrossRef] [PubMed]
  20. Zhou, L.; Wang, L.; Shen, C. Feature selection with redundancy-constrained class separability. IEEE Trans. Neural Netw. 2010, 21, 853–858. [Google Scholar] [CrossRef] [PubMed]
  21. Pudil, P.; Novovičová, J.; Kittler, J. Floating search methods in feature selection. Pattern Recognit. Lett. 1994, 15, 1119–1125. [Google Scholar] [CrossRef]
  22. Jiménez, L.O.; Rivera-Medina, J.L.; Rodríguez-Díaz, E.; Arzuaga-Cruz, E.; Ramírez-Vélez, M. Integration of spatial and spectral information by means of unsupervised extraction and classification for homogenous objects applied to multispectral and hyperspectral data. IEEE Trans. Geosci. Remote Sens. 2005, 43, 844–851. [Google Scholar] [CrossRef]
  23. Kalluri, H.R.; Prasad, S.; Bruce, L.M. Decision-level fusion of spectral reflectance and derivative information for robust hyperspectral land cover classification. IEEE Trans. Geosci. Remote Sens. 2010, 48, 4047–4058. [Google Scholar] [CrossRef]
  24. Zhang, L.; Zhang, L.; Tao, D.; Huang, X. On combining multiple features for hyperspectral remote sensing image classification. IEEE Trans. Geosci. Remote Sens. 2012, 50, 879–893. [Google Scholar] [CrossRef]
  25. Fauvel, M.; Chanussot, J.; Benediktsson, J.A. A spatial–spectral kernel-based approach for the classification of remote-sensing images. Pattern Recognit. 2012, 45, 381–392. [Google Scholar] [CrossRef]
  26. Daugman, J.G. Complete discrete 2-D Gabor transforms by neural networks for image analysis and compression. IEEE Trans. Acoust. Speech. Signal Process. 1988, 36, 1169–1179. [Google Scholar] [CrossRef]
  27. Kumar, S.; Ghosh, J.; Crawford, M.M. Best-bases feature extraction algorithms for classification of hyperspectral data. IEEE Trans. Geosci. Remote Sens. 2001, 39, 1368–1379. [Google Scholar] [CrossRef]
  28. Maghsoudi, Y.; Valadan Zoej, M.J.; Collins, M. Using class-based feature selection for the classification of hyperspectral data. INT. J. Remote Sens. 2011, 32, 4311–4326. [Google Scholar] [CrossRef]
  29. Bai, J.; Xiang, S.; Shi, L.; Pan, C. Semisupervised Pair-Wise Band Selection for Hyperspectral Images. IEEE J. Sel. Top. Appl. Earth Obs. Remote Sens. 2015, 8, 2798–2813. [Google Scholar] [CrossRef]
  30. Haralick, R.M.; Shanmugam, K. Textural features for image classification. IEEE Trans. Syst. Man Cybern. 1973, 6, 610–621. [Google Scholar] [CrossRef]
  31. Benediktsson, J.A.; Palmason, J.A.; Sveinsson, J.R. Classification of hyperspectral data from urban areas based on extended morphological profiles. IEEE Trans. Geosci. Remote Sens. 2005, 43, 480–491. [Google Scholar] [CrossRef]
  32. D. A. Landgrebe. Available online: https://engineering.purdue.edu/~biehl/MultiSpec/hyperspectral.html (accessed on 20 March 2014).
  33. Tarabalka, Y.; Benediktsson, J.A.; Chanussot, J. Spectral–spatial classification of hyperspectral imagery based on partitional clustering techniques. IEEE Trans. Geosci. Remote Sens. 2009, 47, 2973–2987. [Google Scholar] [CrossRef]
  34. Chang, C.C.; Lin, C.J. LIBSVM: A library for support vector machines. ACM Trans. Intell. Syst. Technol. 2011, 2, 1–27. [Google Scholar] [CrossRef]
  35. Huang, X.; Liu, X.; Zhang, L. A multichannel gray level co-occurrence matrix for multi/hyperspectral image texture representation. Remote Sens. 2014, 6, 8424–8445. [Google Scholar] [CrossRef]
  36. Kuo, B.C.; Landgrebe, D.A. Nonparametric weighted feature extraction for classification. IEEE Trans. Geosci. Remote Sens. 2004, 42, 1096–1105. [Google Scholar]
Figure 1. Flowchart of combining spectral features and spatial features for vegetation classification. SVM: support vector machine
Remotesensing 09 00261 g001
Figure 2. Airborne Visible/Infrared Imaging Spectrometer (AVIRIS) hyperspectral image. (a) Three-band color composite image (band 50, 27 and 17); (b) Ground truth.
Remotesensing 09 00261 g002
Figure 3. Mean square correlation coefficient for the ClassPair_ScatterMatrix method and AllClass_ScatterMatrix method versus the number of selected spectral bands on (a) data set 1; (b) data set 2.
Remotesensing 09 00261 g003
Figure 4. Overall classification accuracies of each method versus the number of selected bands using (a) data set 1; (b) data set 2. JMI: joint mutual information; mRMR: minimal-redundancy-maximal-relevance; CMIM: conditional mutual information maximization; DISR: double input symmetrical relevance; JM: Jeffries–Matusita.
Remotesensing 09 00261 g004
Figure 5. Mean spectra (a) and mean Gabor feature curves (b) for five classes investigated in the paper, and the corresponding correlation coefficient tables based on data set 2.
Remotesensing 09 00261 g005
Figure 6. Classification maps of the Indian Pines data set. (a) Reference data; (b) ClassPair_ScatterMatrix; (c) AllClass_ScatterMatrix; (d) JM; (e) JMI; (f) Gabor; (g) SpeSpaDF; (h) SpeSpaVS_ClassPair_ScatterMatrix.
Remotesensing 09 00261 g006
Table 1. Ground truth classes for AVIRIS Indian Pines image used in the study and their respective number of samples.
Class LabelClass NameSamples
class 1Corn-notill1428
class 2Soybean-mintill2455
class 3Wheat205
class 4Wood1265
class 5Building–Grass–Trees–Drives386
Table 2. Performance of the feature selection methods investigated in the paper on data set 2. PA: producer accuracy; OA: overall classification accuracy; KC: Kappa coefficient.
MethodNum. of BandsOAKCPA
Class 1Class 2Class 3Class 4Class 5
JMI400.8630.7980.8230.8610.9820.9130.839
mRMR400.7570.6440.7080.7320.9450.8830.623
CMIM320.8460.7730.7840.8440.9820.9170.839
DISR230.8440.7680.7600.8520.9820.9380.750
JM240.8560.7880.8430.8431.0000.8990.818
AllClass_ScatterMatrix380.8790.8210.8540.8711.0000.9300.822
ClassPair_ScatterMatrix390.9010.8530.8910.8851.0000.9480.856
All bands2000.8740.8140.8510.8801.0000.8880.856
Table 3. Performance of the methods investigated in the paper on data set 1. GLCM: gray-level co-occurrence matrix; NWFE: nonparametric weighted feature extraction.
MethodNum. of Fea.OAKCPA
Class 1Class 2Class 3Class 4Class 5
ClassPair_ScatterMatrix310.8720.8140.8730.8620.9900.9000.780
GLCM80.8570.7980.8640.8031.0000.9150.990
Gabor800.9550.9350.9800.9181.0000.9861.000
Morph200.9040.8600.8700.8840.9900.9670.941
SpeSpaDF31/800.9160.8790.9890.8230.9900.9970.979
SpeSpaVS_NWFE290.9640.9480.9720.9371.0000.9991.000
SpeSpaVS_ClassPair_ScatterMatrix230.9760.9640.9770.9591.0000.9980.990
Table 4. Performance of the methods investigated in the paper on data set 2.
MethodNum. of Fea.OAKCPA
Class 1Class 2Class 3Class 4Class 5
ClassPair_ScatterMatrix390.9010.8530.8910.8851.0000.9480.856
GLCM80.8740.8180.8940.8251.0000.9210.987
Gabor800.9670.9510.9840.9441.0000.9871.000
Morph200.9260.8900.8710.9281.0000.9700.987
SpeSpaDF39/800.9300.8970.9910.8581.0000.9960.979
SpeSpaVS_NWFE290.9740.9610.9860.9511.0000.9951.000
SpeSpaVS_ClassPair_ScatterMatrix240.9860.9800.9910.9791.0000.9931.000

