Article

Automatic Assessment of Green Space Ratio in Urban Areas from Mobile Scanning Data

1
Graduate School of Engineering, Kyoto University, C1-1-206, Kyotodaigaku-Katsura, Nishikyo-ku, Kyoto 615-8540, Japan
2
Graduate School of Engineering, Kyoto University, C1-1-209, Kyotodaigaku-Katsura, Nishikyo-ku, Kyoto 615-8540, Japan
*
Author to whom correspondence should be addressed.
Remote Sens. 2017, 9(3), 215; https://doi.org/10.3390/rs9030215
Submission received: 12 December 2016 / Revised: 17 February 2017 / Accepted: 23 February 2017 / Published: 27 February 2017

Abstract

:
In this paper, we propose a method for using mobile laser-scanning data to estimate the green space ratio (GSR), a landscape index that represents the proportion of green area to the whole-view area. The proposed method first classifies and segments vegetation using voxel-based and shape-based approaches. Vertical planar-surface objects are excluded, and randomly distributed objects are extracted as vegetation via multi-spatial-scale analysis. Then, the method generates a map representing occlusion by vegetation, and estimates GSR at an arbitrary location. We applied the method to a data set collected in a residential area in Kyoto, Japan. We compared the results with the ground truth data and obtained a root mean squared error of approximately 4.1%. Although some non-vegetation with rough surfaces was falsely extracted as vegetation, our method seems to estimate GSR to an acceptable accuracy.

Graphical Abstract

1. Introduction

In urban planning, provision of green space (GS) in urban areas is one of the most challenging issues, whereas urban green space (UGS) provides valuable direct and indirect services to the surrounding areas [1]. For example, Nishinomiya City in Hyogo Prefecture, Japan is promoting improvement and maintenance of its landscapes. It enacted a regulation for one residential area to the effect that newly constructed houses should have a green space ratio (proportion of vegetation to visible area: GSR) of at least 15%. The regulation specifies a simple formula for calculating the green space ratio [2]. Local governments assess landscape quality from the perspective of aesthetics before approving new construction. The landscape index is calculated through ground surveys by local government officials. However, such surveys are time-consuming and expensive when applied over wide areas, making it difficult to apply the regulation to the entire city and consequently promote more UGS.
Automatic measures of UGS come mainly from geographic information system (GIS) data and remotely sensed data [3]. For example, Tian et al. [4] used high-quality digital maps with a spatial resolution of 0.5 m × 0.5 m to analyze the landscape pattern of UGS for ecological quality. Gupta et al. [5] calculated an urban neighborhood green index to quantify homogenous greenness from multi-temporal satellite images. The periodically obtained remotely sensed imagery is suitable for updating the spatial distribution patterns of GS, but it is limited in that the three-dimensional (3D) distribution is not directly obtained.
As a tool for directly measuring 3D coordinate values, light detection and ranging (LiDAR) measures laser light reflected from the surfaces of objects. The discrete LiDAR data are used to model the 3D surfaces of objects and derive their attributes. Now, airborne and terrestrial LiDAR are of operational use. Terrestrial LiDAR is stationary or mobile by vehicle. Applications of LiDAR data to landscape analysis require the extraction of vegetation via classification and segmentation of point clouds. In the case of airborne LiDAR, vegetation returns the light in various ways—from the surface, middle and bottom—whereas buildings return the light mainly from the surface. This unique feature of multiple returns is a challenge to applying LiDAR data to vegetation extraction. It is well known that the first and last pulses of the light reflected from vegetation correspond to the top (canopies) and bottom (ground) of the vegetation, respectively, which allows the heights of the vegetation surface and ground to be estimated. Thus, we can derive the heights of vegetation by subtracting the ground height from the vegetation surface height. Over the last decade, full-waveform airborne LiDAR has been examined [6,7], which can provide more detailed patterns of reflected light and has the potential to estimate the structure of forests.
In a complex urban area, the automatic extraction of vegetation requires the classification of man-made and natural objects. This is another challenge to applying LiDAR data to urban vegetation. One of the most promising approaches is to process the LiDAR data on multiple scales [8,9,10]. For example, Brodu and Lague [11] presented a method to monitor the local cloud geometry behavior across several scales by changing the diameter of the sphere for representing local features. Wakita and Susaki [12] proposed a multi-scale and shape-based method to extract vegetation in complex urban areas from terrestrial LiDAR data.
Landscape indices related to GS can be calculated from the vegetation extracted from point clouds or other sources. Susaki and Komiya [13] proposed a method to estimate the green space ratio (GSR) in urban areas from airborne LiDAR and aerial images intended for the quantitative assessment of local landscapes. The GSR is defined as the ratio of the area occluded by vegetation to the entire visible area at a height of a person on the ground. Following Wakita and Susaki [12], Wakita et al. [14] developed a method to estimate GSR from terrestrial LiDAR data. Huang et al. [15] extracted urban vegetation using point clouds and remote sensing image. Individual tree crowns were extracted using the normalized digital surface model from airborne LiDAR data and the normalized vegetation index (NDVI) from near-infrared image. Yang et al. [16] estimated Green View index using field survey data and photographs. Yu et al. [17] presented the Floor Green View Index, an indicator defined as the area of visible vegetation on a particular floor of a building. This index is calculated from airborne LiDAR data and aerial near-infrared photographs to calculate NDVI. Because of occlusion, more accurate extraction of vegetation can be achieved using terrestrial LiDAR data. In addition to terrestrial stationary LiDAR, mobile (or vehicle-based) LiDAR has been examined for this purpose because it is capable of rapidly measuring the data in a large area [18]. Yang and Dong [19] proposed a method to segment mobile LiDAR data into objects using shape information derived from the data. However, mobile LiDAR data have a wide range of point density, and thus the estimation of vegetation may tend to be unstable when there is vegetation in the far distance. Therefore, in this research, we present a method to extract vegetation in complex urban areas and estimate a GSR from mobile LiDAR data.

2. Data Used and Study Area

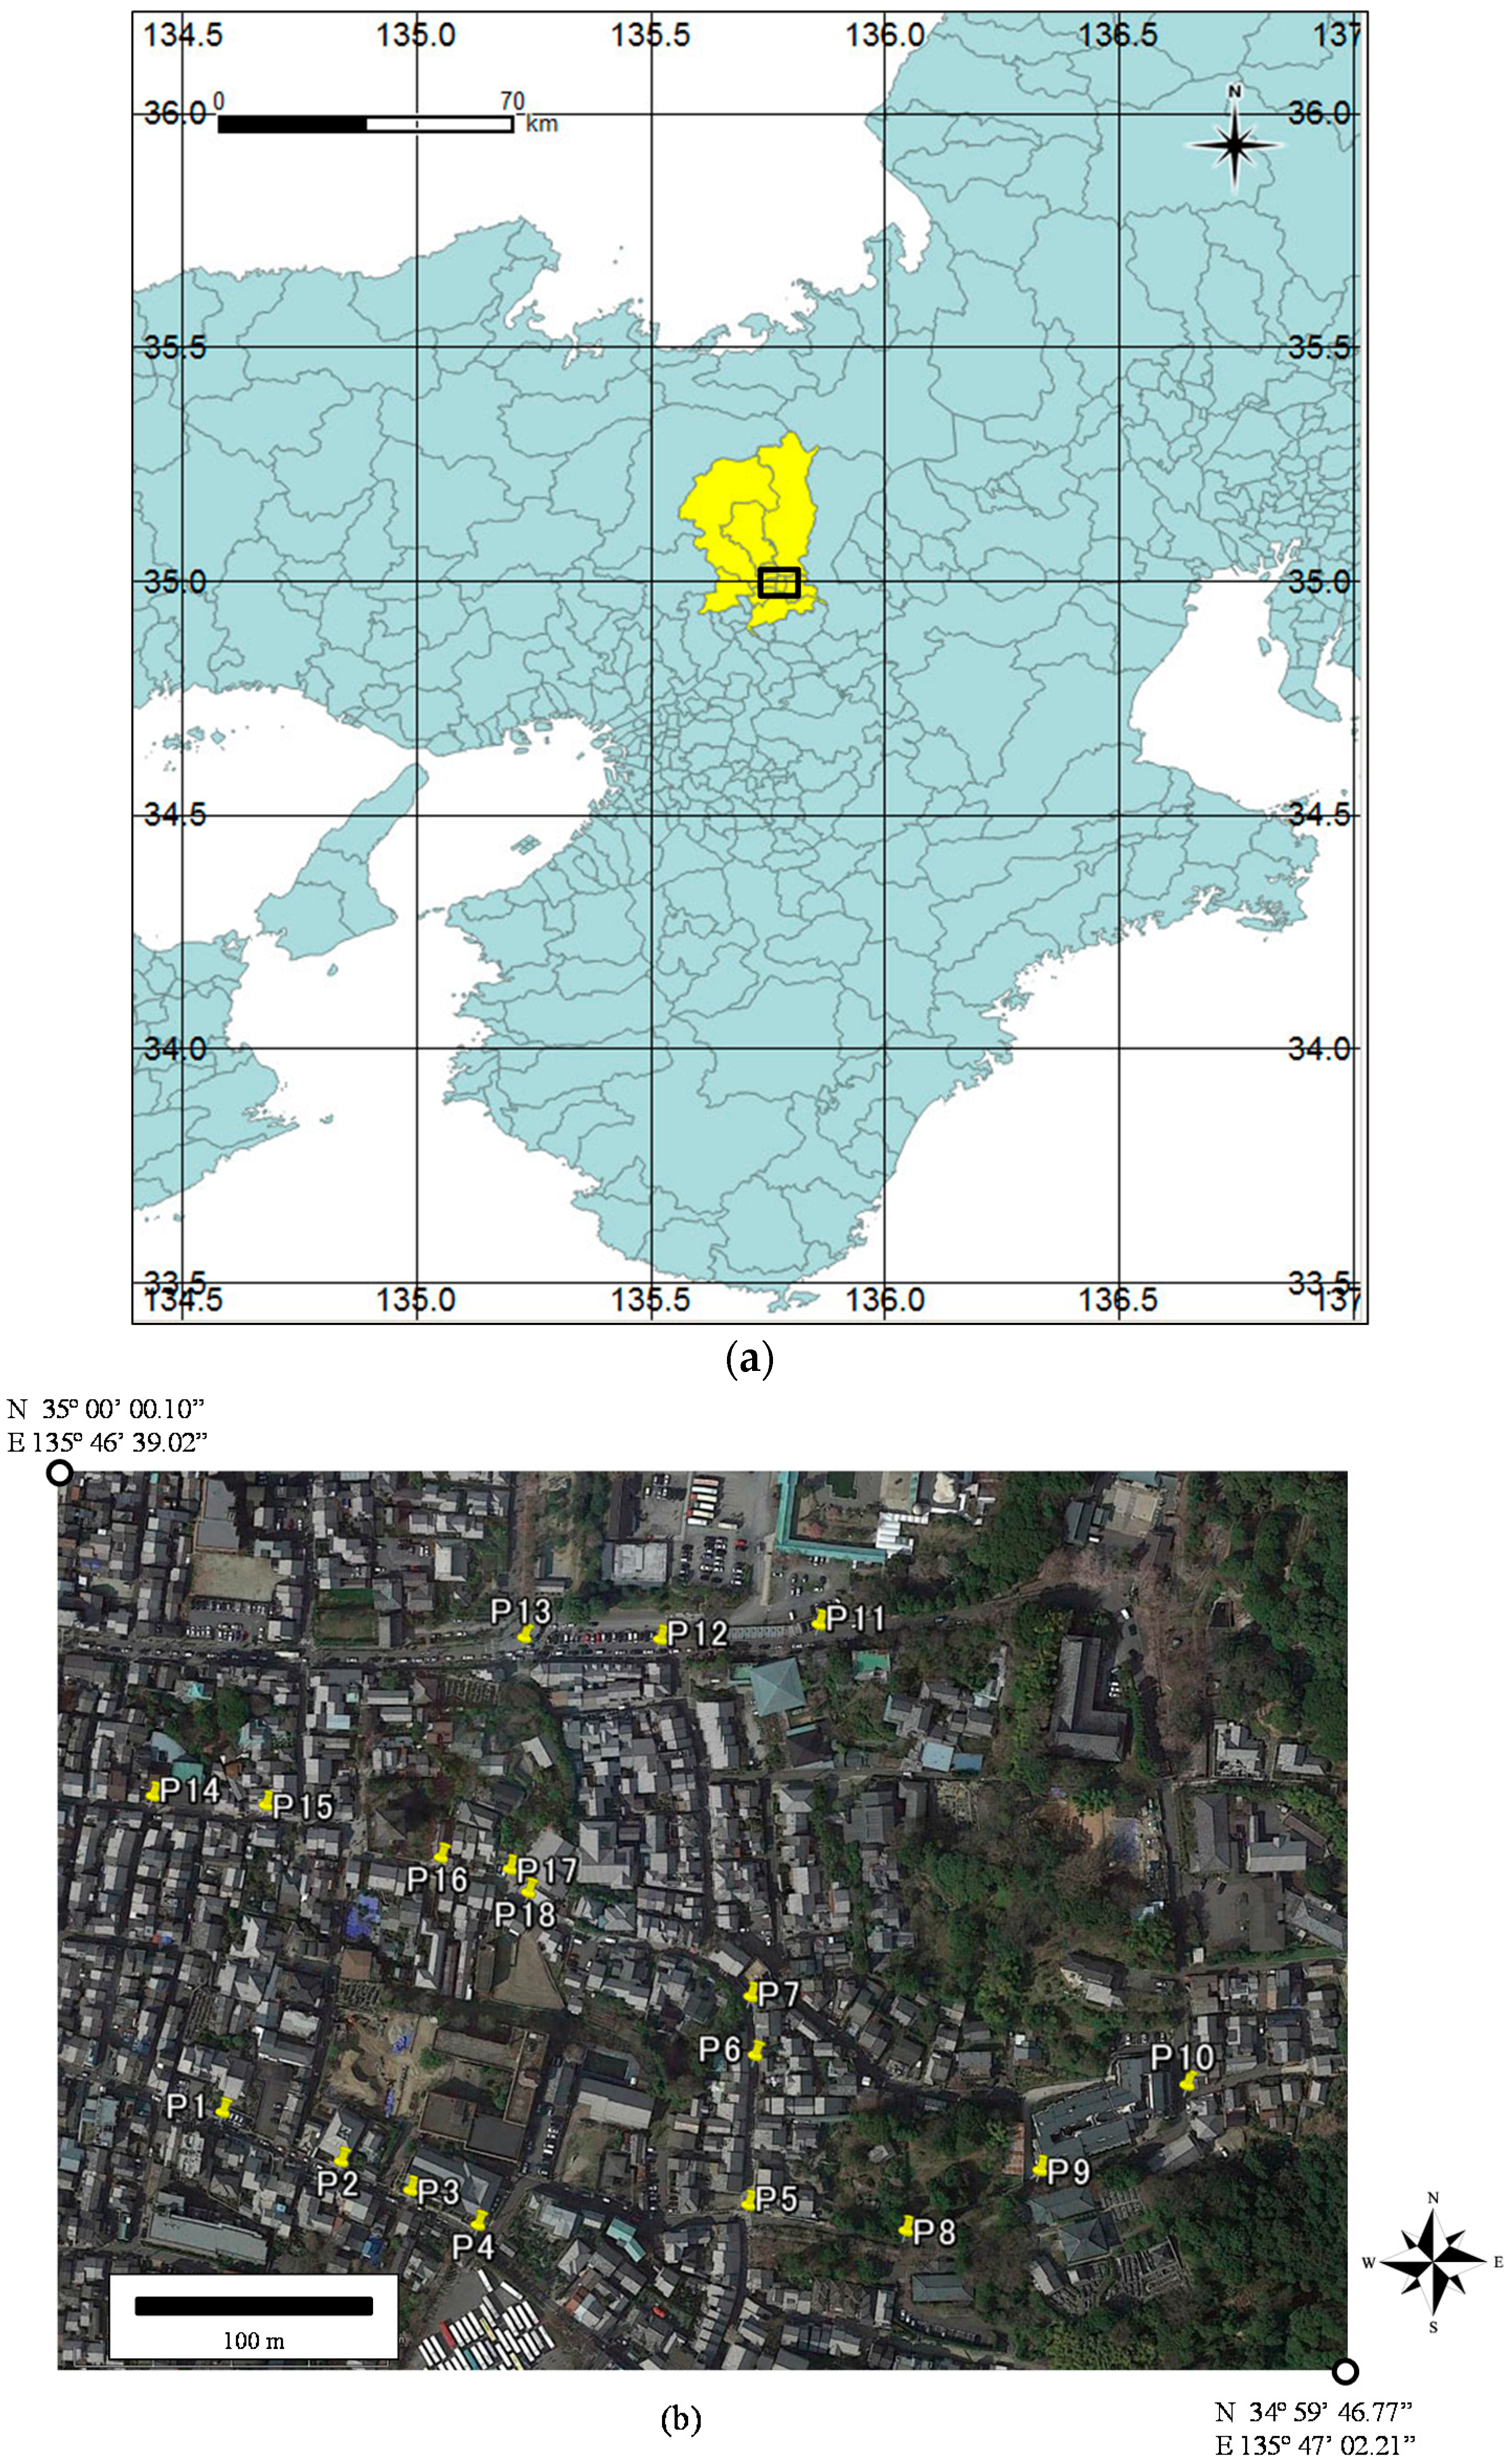
We used a mobile LiDAR system, Trimble MX5, which is a vehicle-mounted LiDAR whose angles were set to 30° for pitch rotation and 0° for heading rotation. The height of LiDAR was set to approximately 2.3 m. It measures 550,000 points per second at a maximum distance of 800 m. The system also has three cameras, which were set to −15°, 0° and 15° for heading rotation. The camera resolution was five million pixels. The measurements were carried out on 3 March 2014 in the Higashiyama Ward of Kyoto, Japan. Higashiyama contains plenty of GS around traditional temples and shrines. 
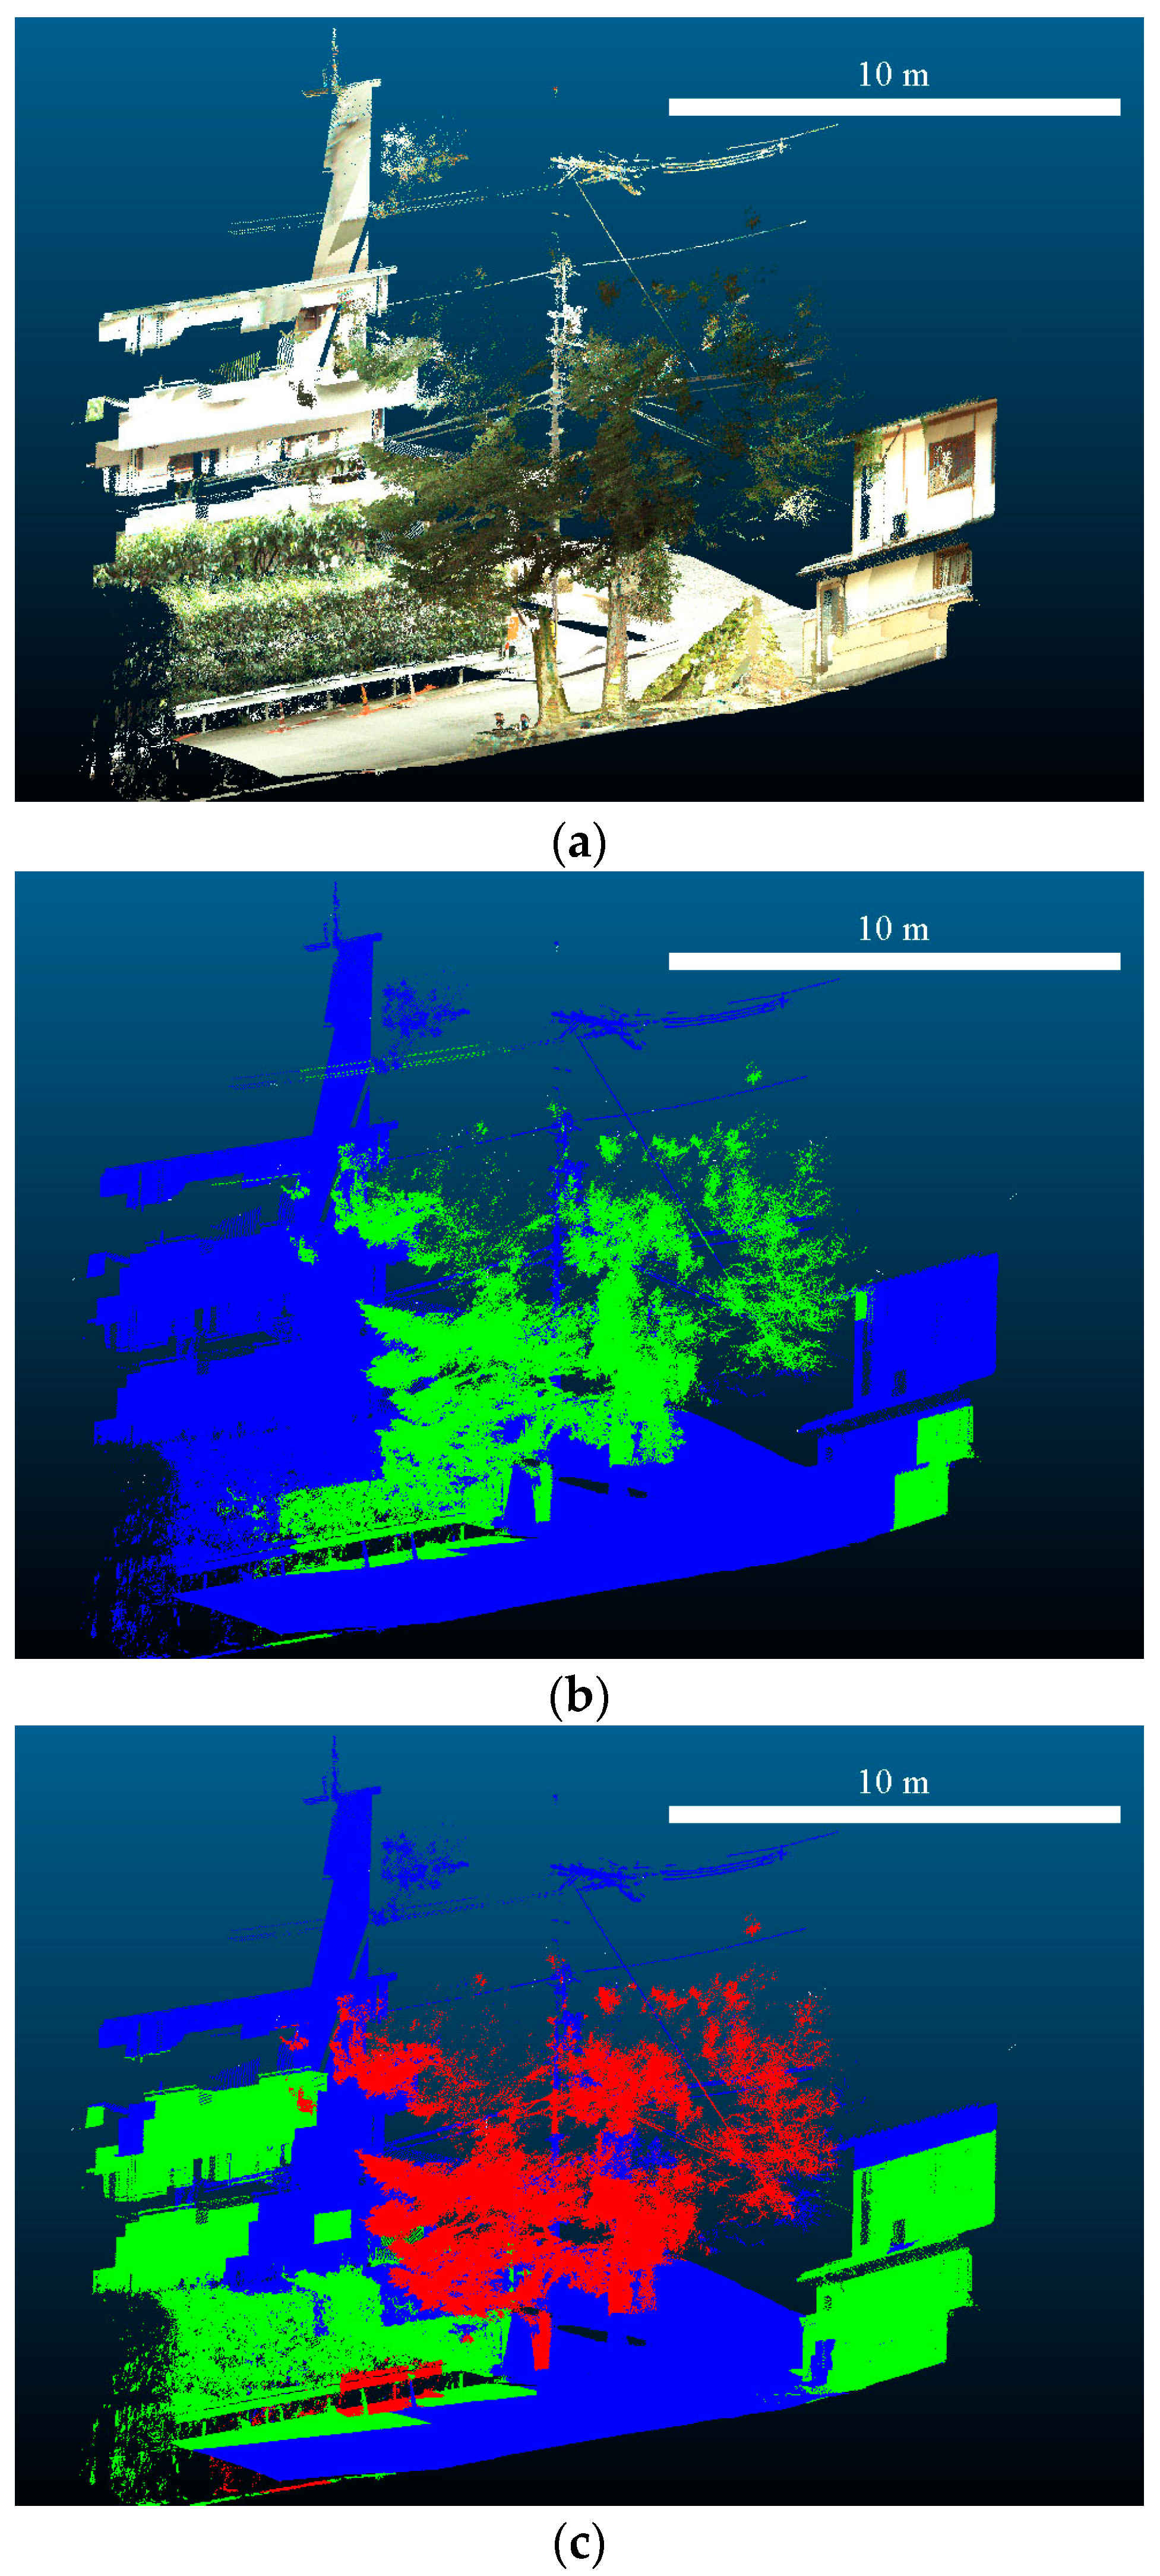
Figure 1 shows the study area.
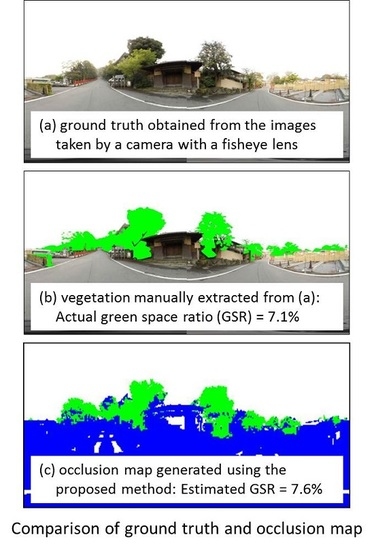
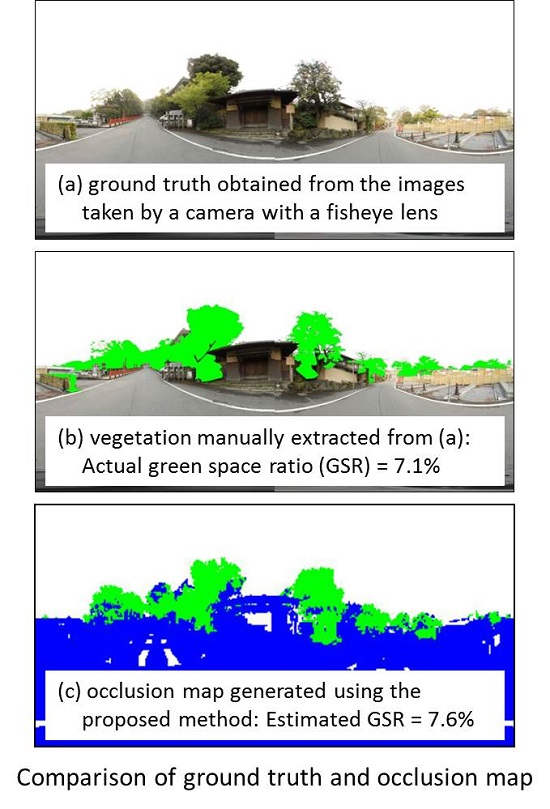
To assess the accuracy of the GSR estimated in this research, we used images taken on 11 April 2015 using a camera with a fisheye lens. Although there was almost a year between the mobile LiDAR and image data, we compared the equivalent color information in the point clouds and the camera images and concluded that the effect of the time gap was not significant. The camera used was an EOS Kiss X3 by Canon, and the fisheye lens was a 4.5-mm F2.8 EX DC Circular Fisheye by Sigma. We selected 18 points as assessment positions, labeled P1 to P18 in Figure 1. We took two images covering the forward and backward views at each position. We manually colored the vegetation areas and converted two images into one panoramic image, from which we calculated the measured GSR. At each position, we measured actual GSR and estimated GSR from LiDAR data. The measured GSRs were used as the ground truth for validating the estimated GSR results.

3. Green Space Ratio (GSR)

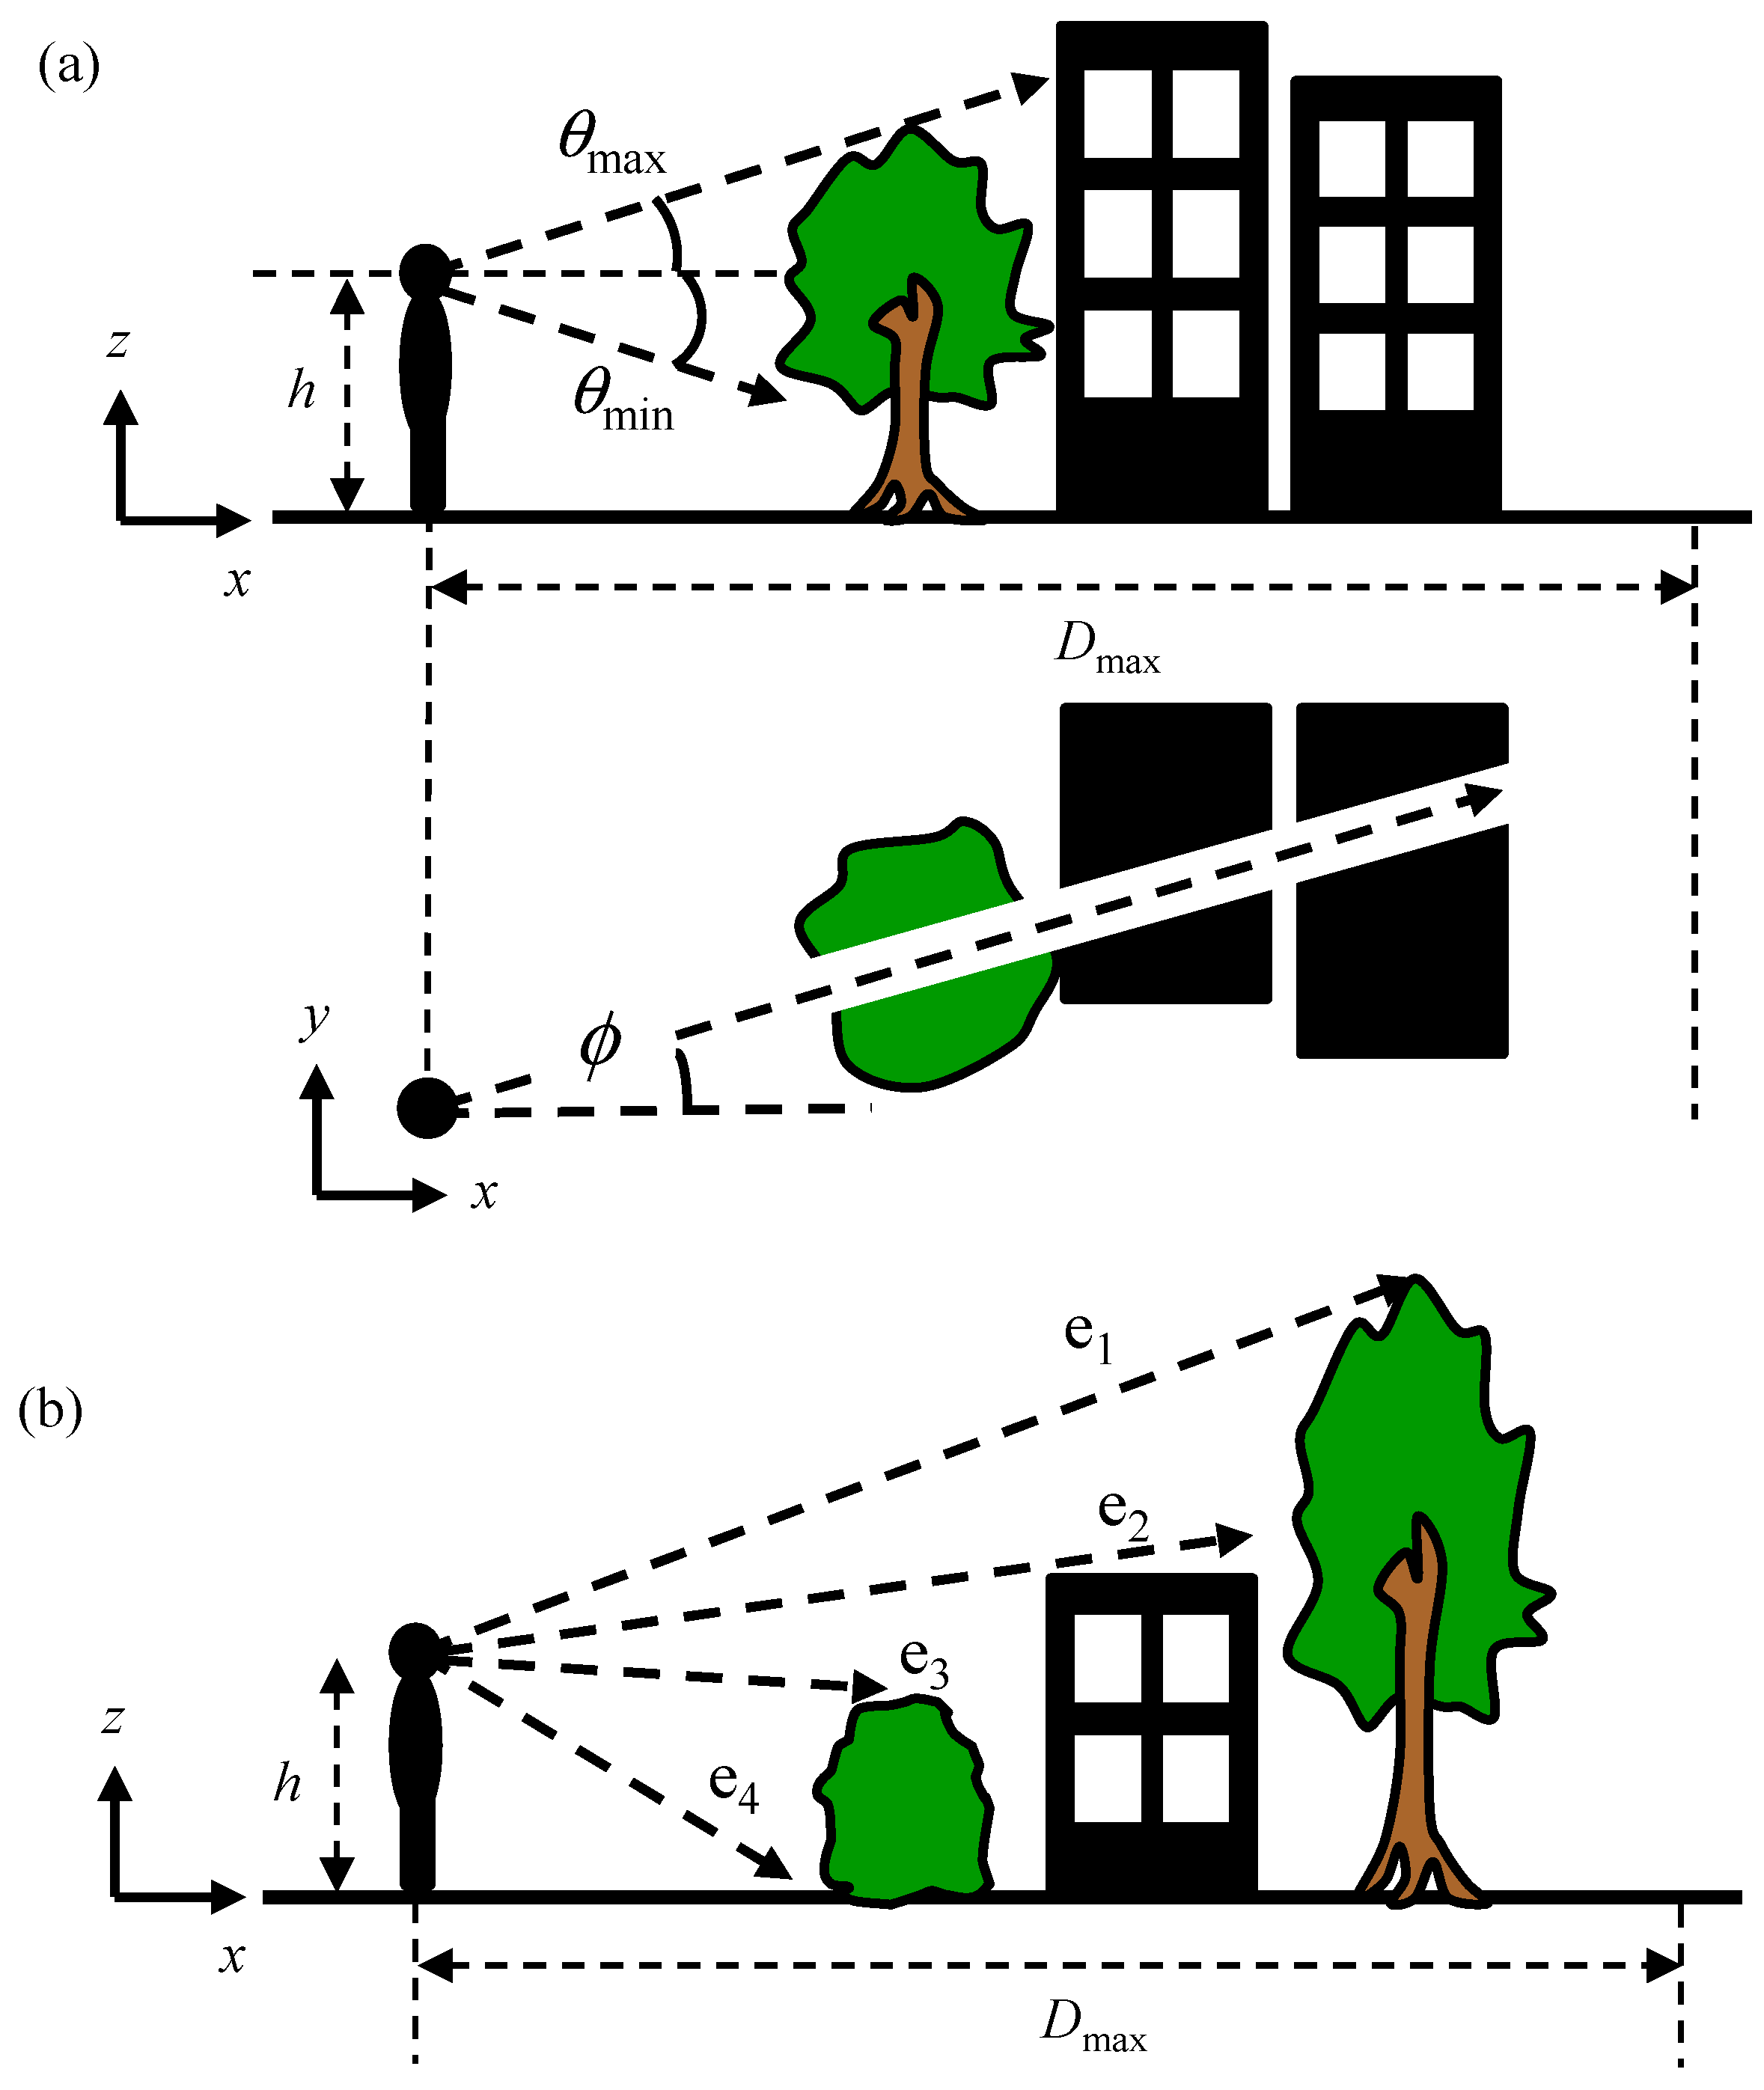
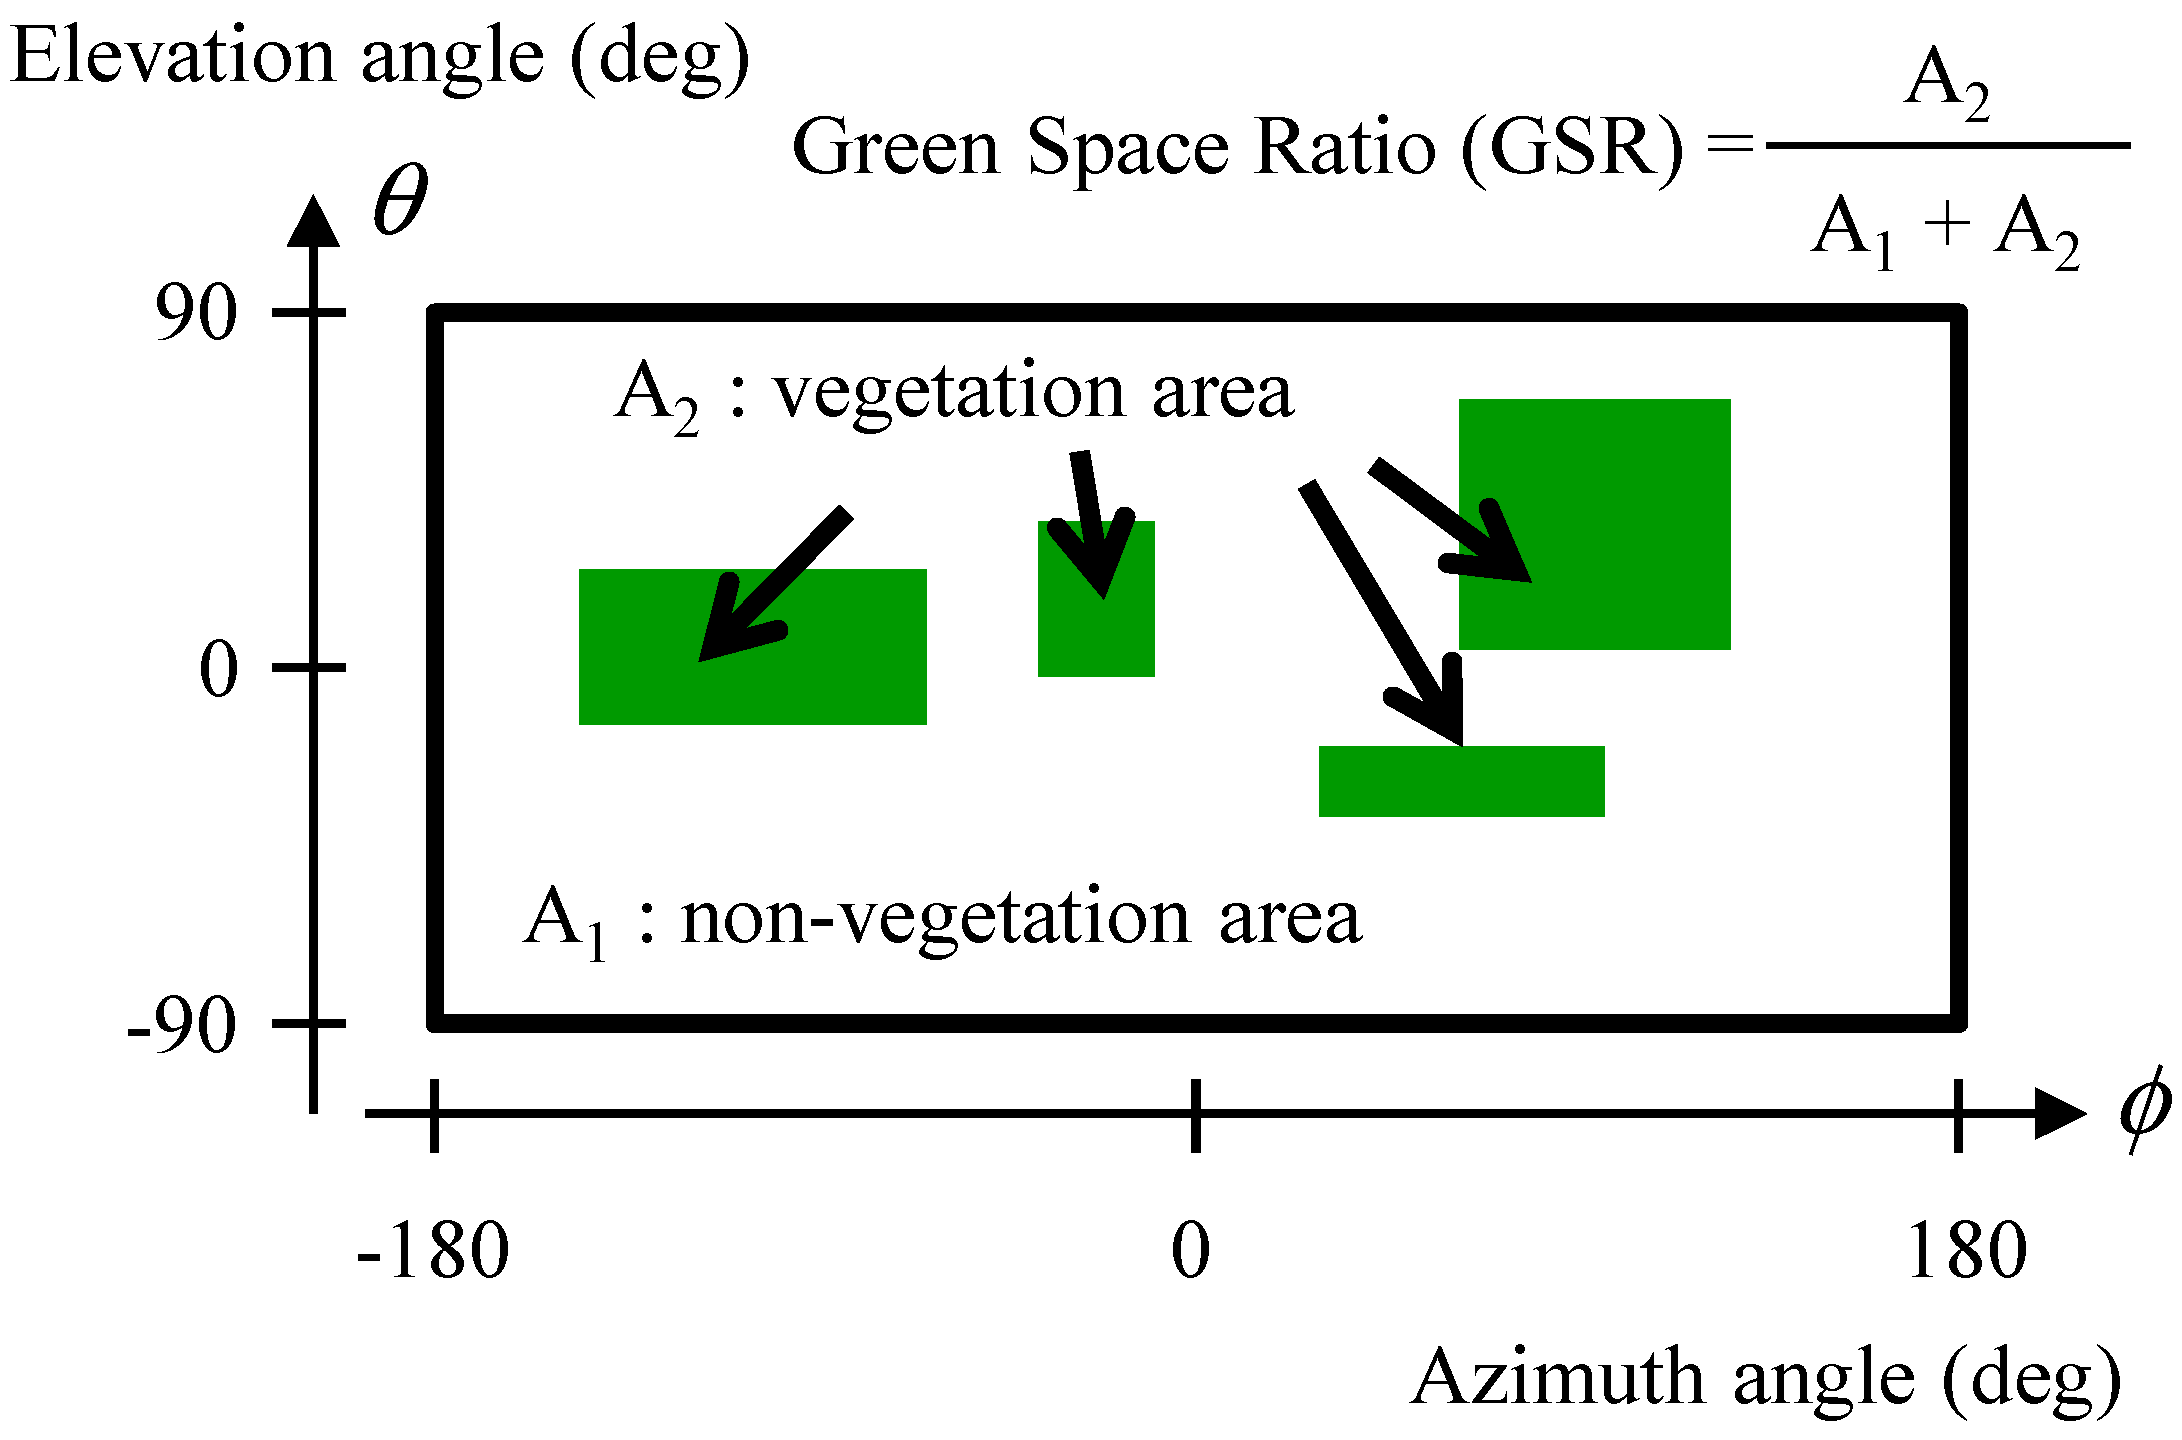
Assume that the vegetation distribution in 3D coordinates is known in advance. We vary the azimuth from 0° to 360° and determine the maximum and minimum elevation angles at which the view is occluded by vegetation. Figure 2a) shows the viewable area from the perspective of a person facing in the direction of the azimuth φ. We assume that φ and the elevation angle θ are uniformly divided into intervals ∆φ and ∆θ, respectively. We vary the value of φ in steps of ∆φ from 0° to 360°—∆φ, and search for vegetation points along each ray at angle φ within the maximum range Dmax. At every vegetation point, we can calculate the values of θ at which occlusion occurs because of vegetation and thereby determine the maximum elevation angle θmax and the minimum elevation angle θmin within the maximum range Dmax (Figure 2a). If multiple populations of vegetation exist, the maximum and minimum elevation angles occluded by each one are examined (Figure 2b). As a result, we can generate a map similar to the one shown in Figure 3 (referred to hereinafter as an occlusion map). The GSR in azimuth–elevation angle space is given by
G S R = A 2 A 1 + A 2 × 100 ,
where A1 and A2 denote the non-vegetation area and the occluded vegetation area, respectively, in azimuth–elevation angle space. According to Equation (1), the GSR can take any value between 0% and 100%.

4. Methodology for Estimating GSR from Mobile Scanning Data

Figure 4 shows the method for estimating GSR in this research. First, it classifies the point clouds measured using mobile LiDAR into vegetation and non-vegetation. Then, assuming the position of a viewpoint, it generates an occlusion map indicating how much vegetation is available in the view. Finally, it calculates GSR for the viewpoint.

4.1. Vegetation Extraction

The extraction of vegetation is based on volumetric pixel (voxel)-based analysis to reduce computational time. Voxels is a cuboid volumetric element, and it is an effective approach to process huge amount of point clouds by assigning point clouds to voxels [20]. The flowchart of vegetation extraction is shown in Figure 5. Local and contextual features are used to classify point clouds. Local features are calculated using a set of points in each voxel. A planar surface is fitted to the points to calculate a normal vector and express the 3D distribution characteristics using principal component analysis (PCA). The contextual features are derived from the horizontality of the normal vectors and the connectivity of the neighboring voxels. The extraction process is repeated twice with voxels of different sizes. The sizes are set according to the length of leaves. In the first screening, the majority of vegetation points are extracted but sparse vegetation points are not classified. Therefore, the second screening, with a larger voxel size, extracts the remaining vegetation points.

4.1.1. Vertical Planar Surface Exclusion

In urban areas, building walls and roofs account for the majority of non-vegetation objects; their distribution characteristics are planar rather than scattered. After applying PCA to each voxel, the root mean square error (RMSE) is calculated between points in the voxel and the estimated planar surface. If the RMSE is within a designated threshold and the horizontal component of the normal is within another designated threshold, the voxel is regarded as non-vegetation and is excluded from the subsequent process.

4.1.2. Voxel Classification by 3D Distribution Characteristics

PCA can capture the distribution features of point clouds contained in voxels and clusters. A set of 3D points, pi with i = 1, …, N, is used to compute three eigenvectors, l1, l2 and l3, and three eigenvalues, λ1, λ2 and λ3, with λ1λ2λ3 ≥ 0. Normalized eigenvalues c1, c2 and c3 are calculated by the sum of all eigenvalues, as shown in Equation (2):
c i = λ i i = 1 3 λ i ( i = 1 , 2 , 3 ) .
If c1 is much larger than the other two, the point cloud has a 1D point distribution. If c3 is much smaller than the other two, the points have a 2D distribution. If all three have similar values, the point cloud has a scattered (3D) distribution.
Voxels are divided into three groups according to their distribution characteristics computed with points in each voxel. Vegetation tends to have 3D distribution characteristics, hence we used the slope (ratio) as described in Equation (3) to distinguish vegetation from non-vegetation:
a = c 3 c 2 = λ 3 λ 2 .
According to slope a, vegetation candidate voxels are classified into three groups (Figure 6): G1 is a vegetation group, G2 is composed of ambiguous voxels (vegetation with trimmed surfaces and façades tends to be this group), and G3 is the non-vegetation group. Slope aij shows a threshold between two groups: a11 and a12 are used in the first loop, and a21 and a22 are used in the second loop. Voxels classified to G2 are re-classified into G1 or G3 in the process discussed in Section 4.1.3.
After the three-group classification, we reduce the false-positive voxels that are misclassified into G1. We examine an index that represents the homogeneity of vegetation voxels. The index is defined as Equation (4):
h o m o g e n e i t y = N G 1 N a l l .
where NG1 denotes the number of voxels classified into group G1, and NALL denotes the sum of G1, G2 and G3. When the index is below the designated threshold, the voxel is labeled as G2.

4.1.3. Voxel Classification by Continuity

Vegetation extraction with slope a alone is not stable because local features are sensitive to noise. Therefore, we improve classification accuracy using both local and contextual features. First, voxels are classified into three groups with the local feature as described in Section 4.1.2, and then voxels in G2 are re-classified according to their contextual features. Group G2 contains both vegetation voxels, such as vegetation with trimmed surfaces, and non-vegetation voxels, such as window frames and ridges of roofs. As shown in Figure 7, G2 voxels are gathered together by regarding neighboring voxels as one cluster. Each cluster is classified into G1 or G3. This operation can be explained by
c o n t i n u i t y = N G 1 N G 1 + N G 3 .
where NG1 corresponds to the number of G1 voxels and NG3 represents the number of G3 voxels surrounding a target cluster. Continuity is defined as the proportion of NG1 to the sum of NG1 and NG3. If continuity is greater than or equal to a designated threshold, the target voxel is classified as G1; otherwise, it is classified as G3.
After vegetation extraction with a local feature and continuity, G1 still contains noisy voxels located on windows and ridges of roofs. These voxels can be regarded as noise because they appear sparsely and constitute small clusters. However, other vegetation voxels exist that are connected with other vegetation voxels; for this reason, vegetation voxels tend to form larger clusters. We focused on this contextual feature to eliminate noisy voxels using the number of voxels. In the process, G1 voxels are divided into clusters by referring to the connectivity of voxels. If there are fewer voxels in a cluster than the designated threshold, the cluster is regarded as noise.
Moreover, we consider the distribution characteristic of points in a whole cluster. In some cases, noisy voxels form larger clusters that can be eliminated using c1 and c3 computed from points in a whole cluster. This is because these clusters are mainly on façades with rough surfaces or on ridges of roofs. If c1 is greater than a threshold or c3 is smaller than another threshold, the cluster is regarded as a noise cluster. In this process, clusters formed with another threshold are classified as vegetation without referring to c1 and c3 in order to reduce the computational cost. The thresholds given here are set through experiments with sample data.

4.2. Green Space Ratio Estimation

The methodology for calculating GSR using the classified point clouds is now explained. A point cloud generated by resampling LiDAR data with voxels is classified into two classes using the methodology explained in Section 4.1.3. A point cloud is divided into several parts on the x-y plane because the whole dataset needed to estimate GSR is too large to process simultaneously. After classifying every point cloud, the point cloud is labeled. If at least one point is labeled as vegetation in an overlapped area, the target point is also labeled as vegetation. The labeled point cloud is then stored in voxels, each of which is classified based on points that it contains as expressed by
r v = N v N a l l ,
where Nv and Nall represent the number of vegetation points and the number of all points in a voxel, respectively. If Nall is not larger than a threshold, the voxel is labeled as no object. In the case that rv is less than another threshold, the voxel is classed as non-vegetation, or else as vegetation. In the voxel space, a viewpoint of a person is given and the GSR from it is calculated as explained in Section 3.

5. Results

We conducted experiments using the data explained in 
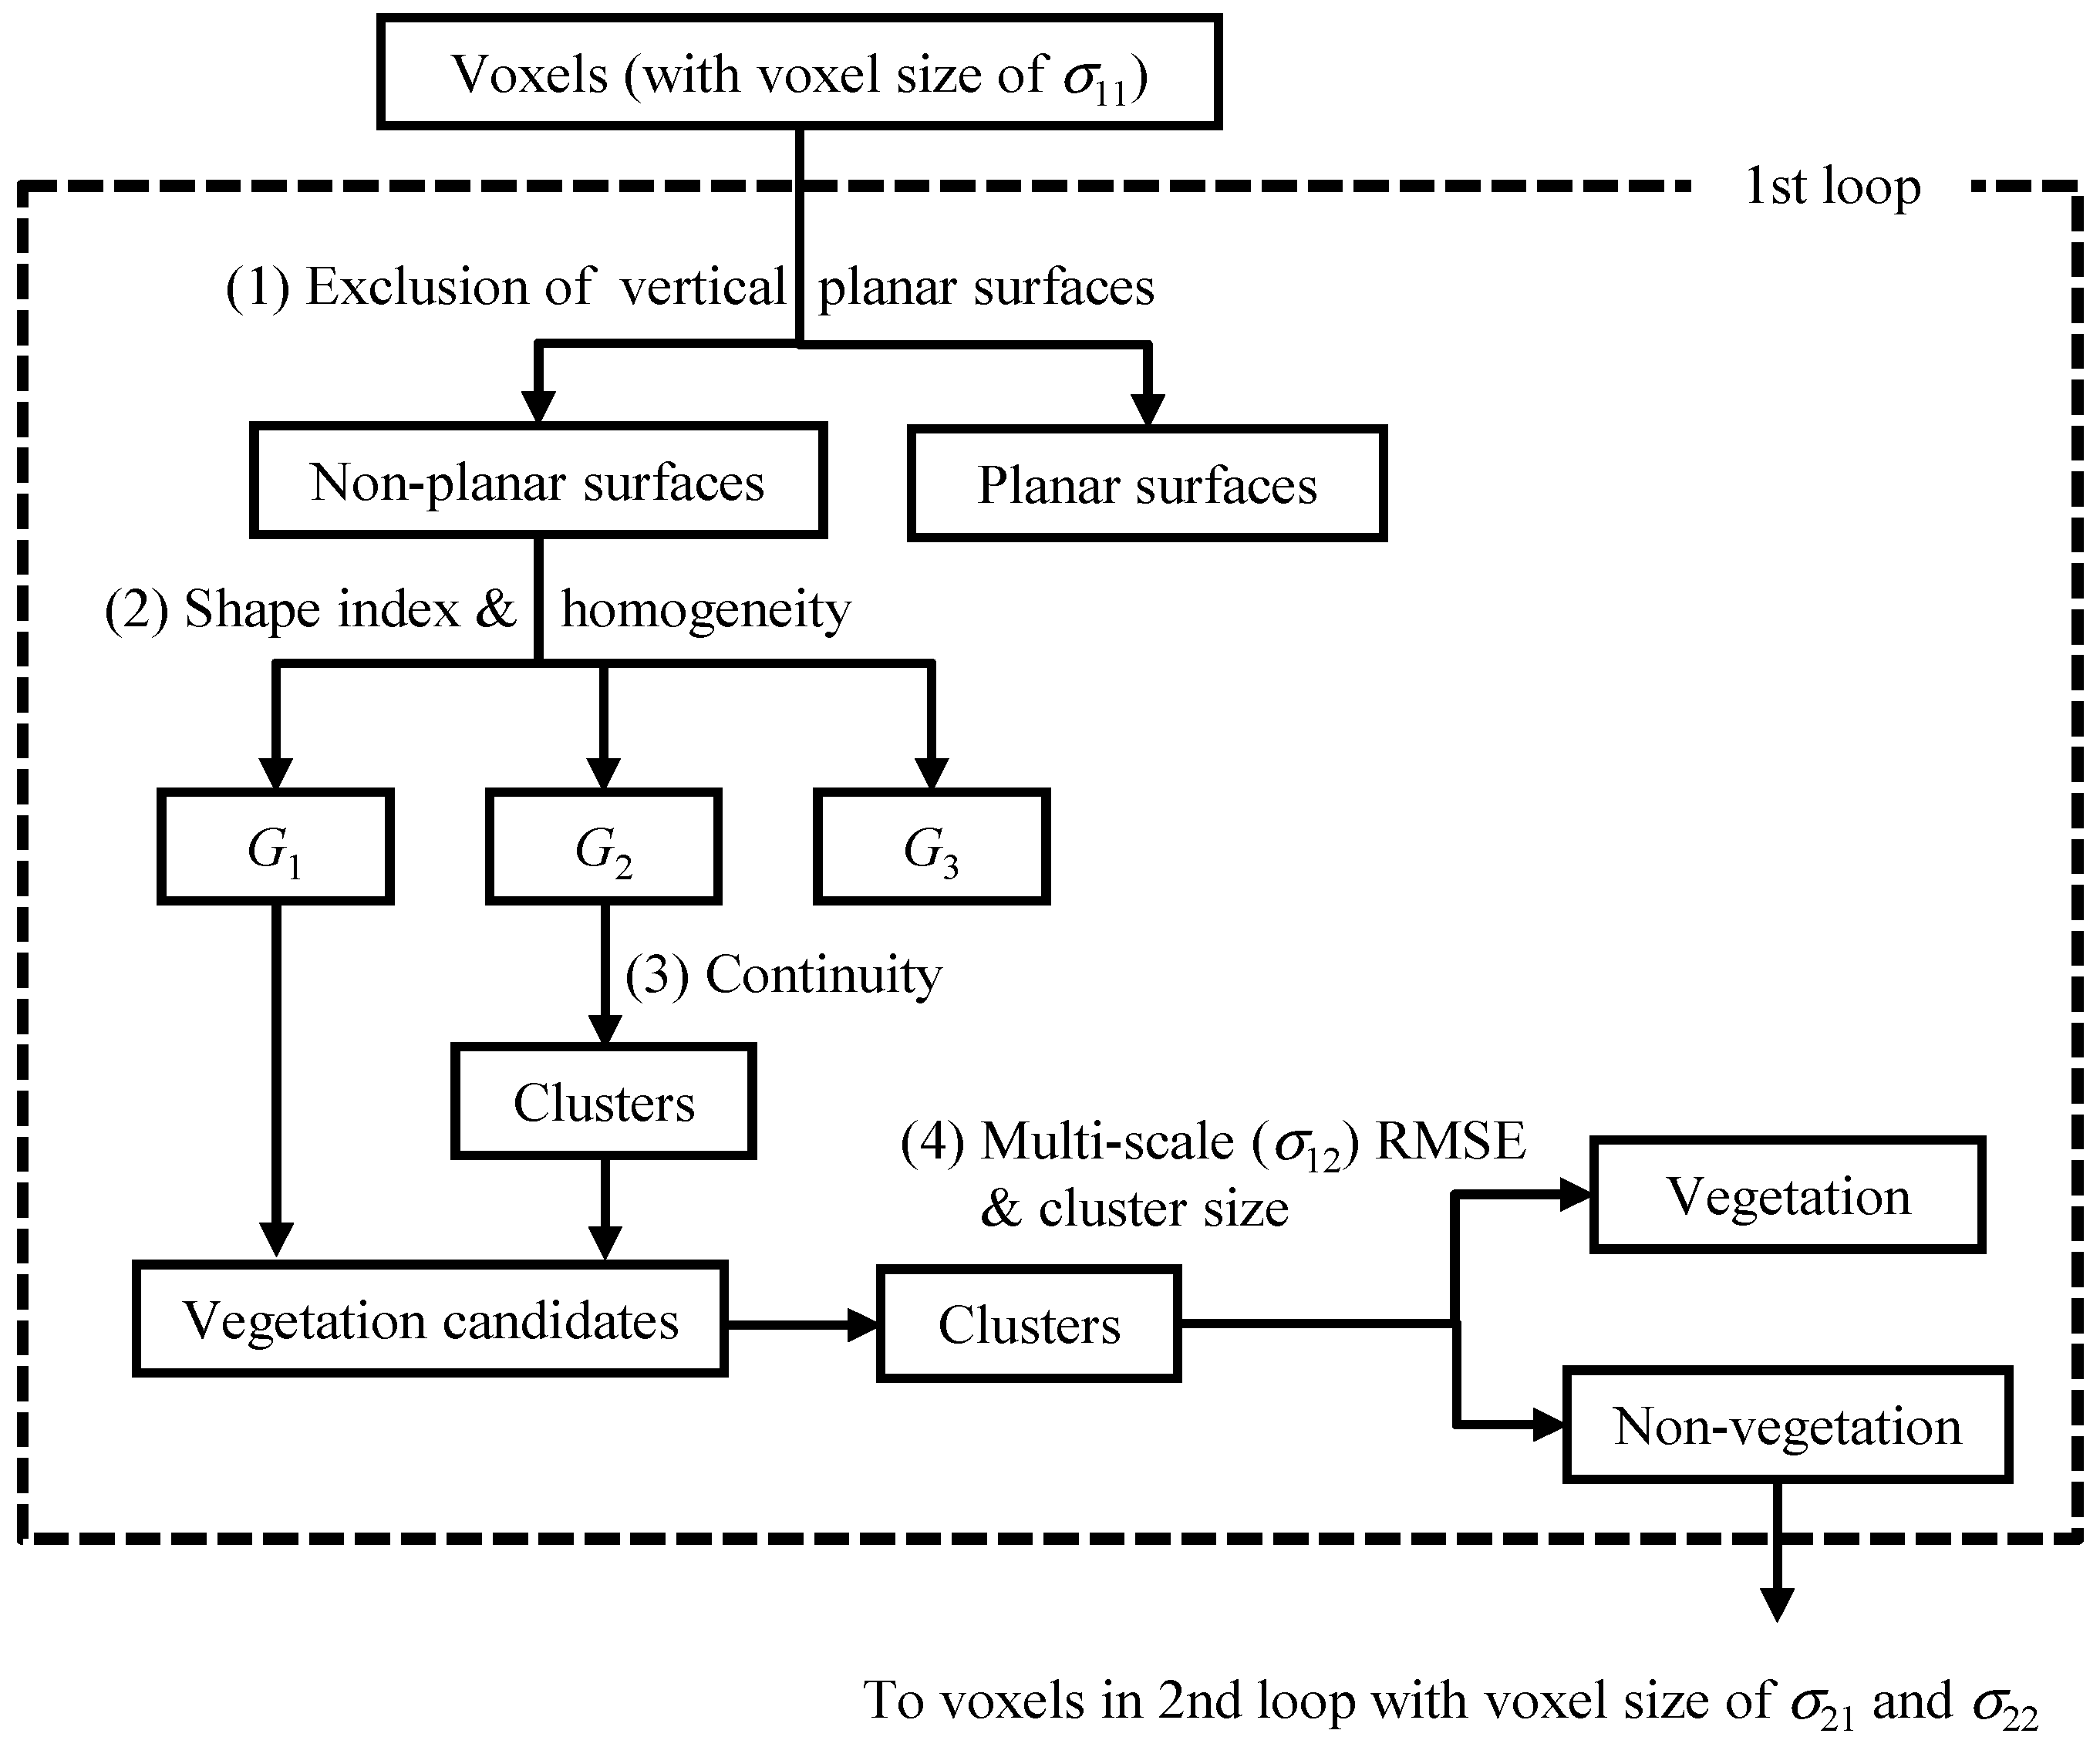
Section 2. We set parameter values required for the proposed method through experiments with sample data as follows. In vegetation extraction, the normal for labeling vertical planar surfaces was defined to have a zenith angle from 85° to 95°. Two sizes of a voxel in the first loop, σ11 and σ12, were set to 0.5 m and 1.0 m, respectively. In the second loop, σ21 and σ22 were set to 1.0 m and 2.0 m, respectively. The vegetation extraction was repeated with different thresholds. In the first loop, a11 and a12 were used as thresholds related to slope a. In the second loop, a21 and a22 were used. We set the thresholds through the experiment with samples as follows: a11 = 0.02, a12 = 0.1, a21 = 0.06, and a22 = 0.2. The threshold for homogeneity and continuity was set to 0.55. Neighboring was defined as a 5 × 5 × 5 voxel space. In noise removal, the number of voxels for a cluster to be labeled as noise was 50 in the first loop and 10 in the second loop. Moreover, if c1 was greater than 0.6 or c3 was smaller than 0.05, the cluster was regarded as a noise cluster.
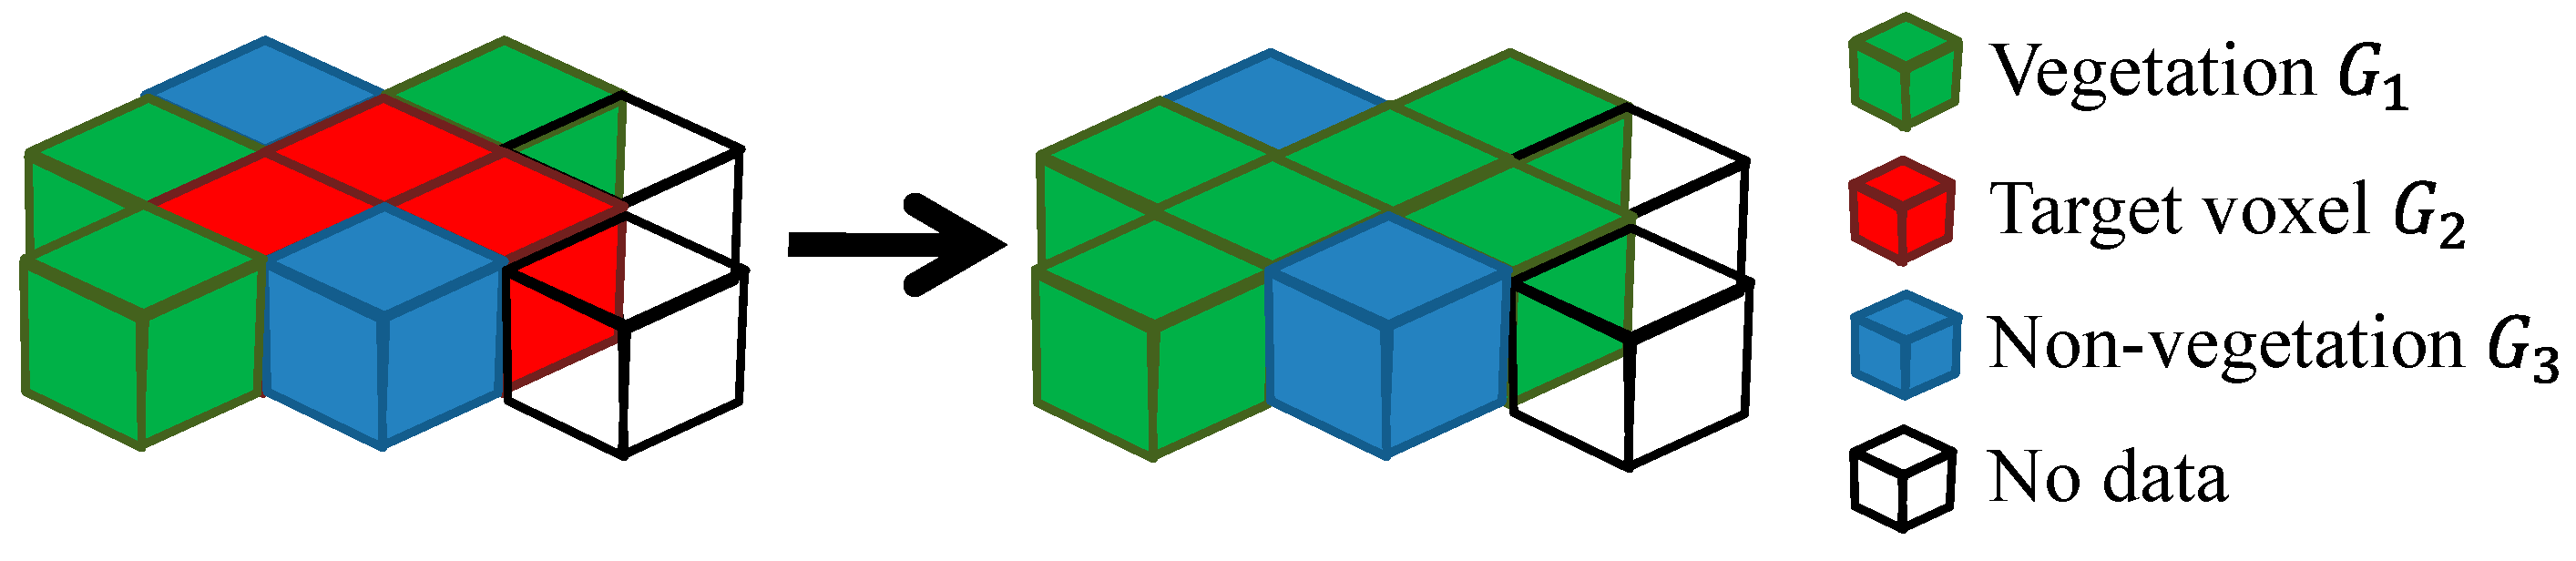
In GSR estimation, the size of a voxel was set to 0.5 m. As for dividing a point cloud into sub-regions, the grid size was 20 m and the overlap length between two adjoining grids was 3 m. The voxel size for storing labeled point clouds was set to 0.5 m. The threshold of Nall for labeling a voxel as no object was set to 2, and the threshold of rv for labeling as non-vegetation, or else as vegetation, was set to 0.5. In estimating the GSR, the height h of a person was set to 1.5 m.
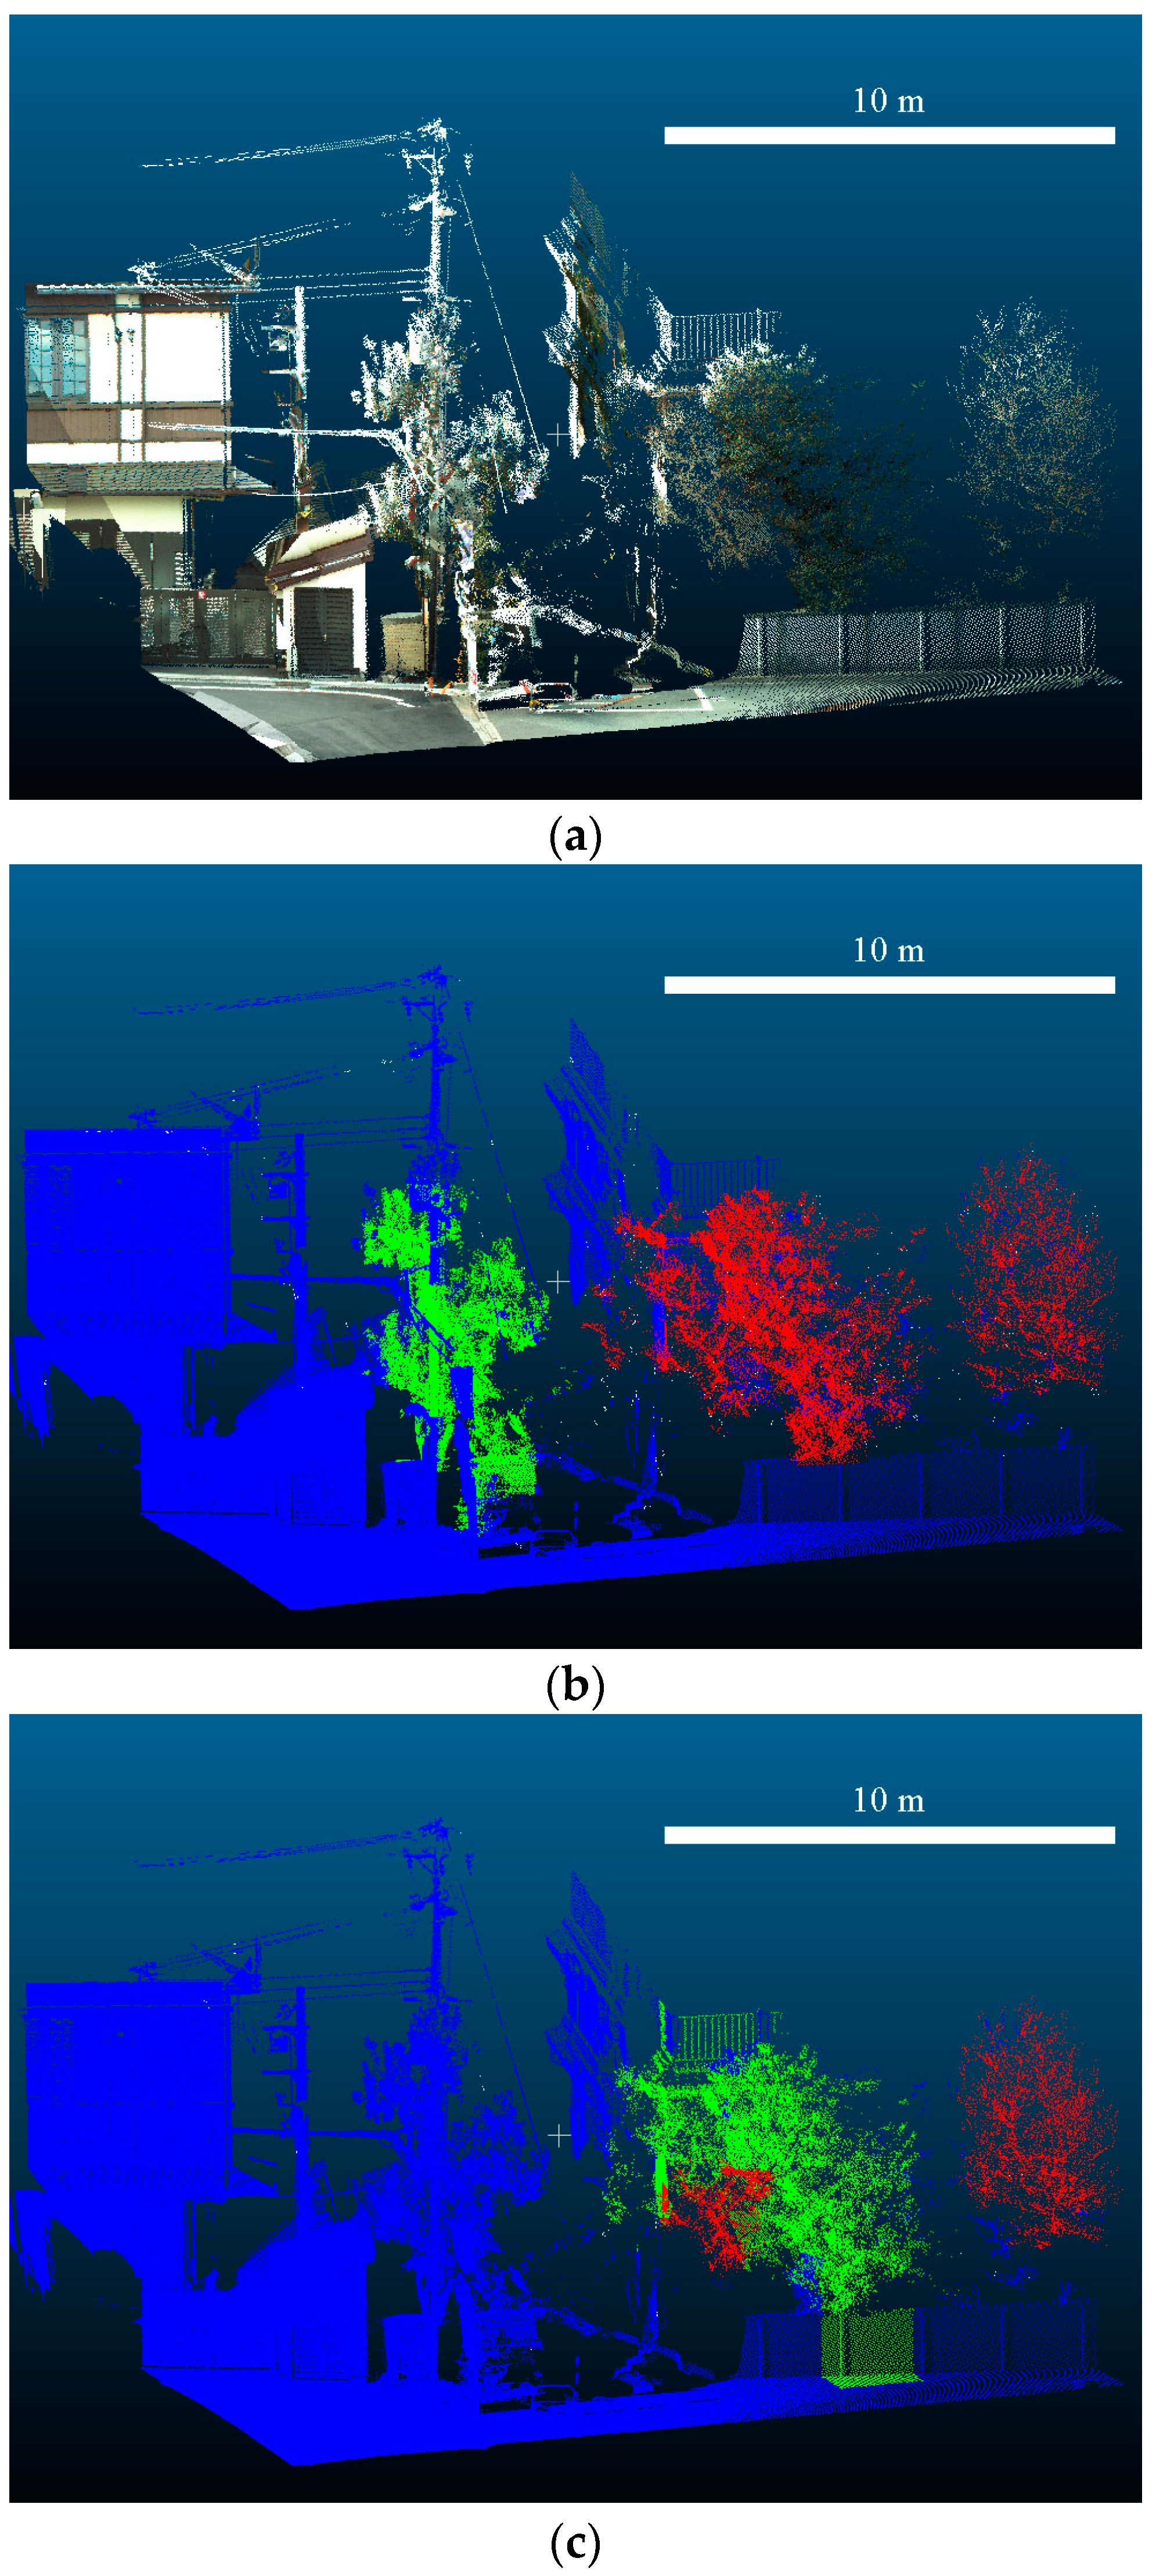
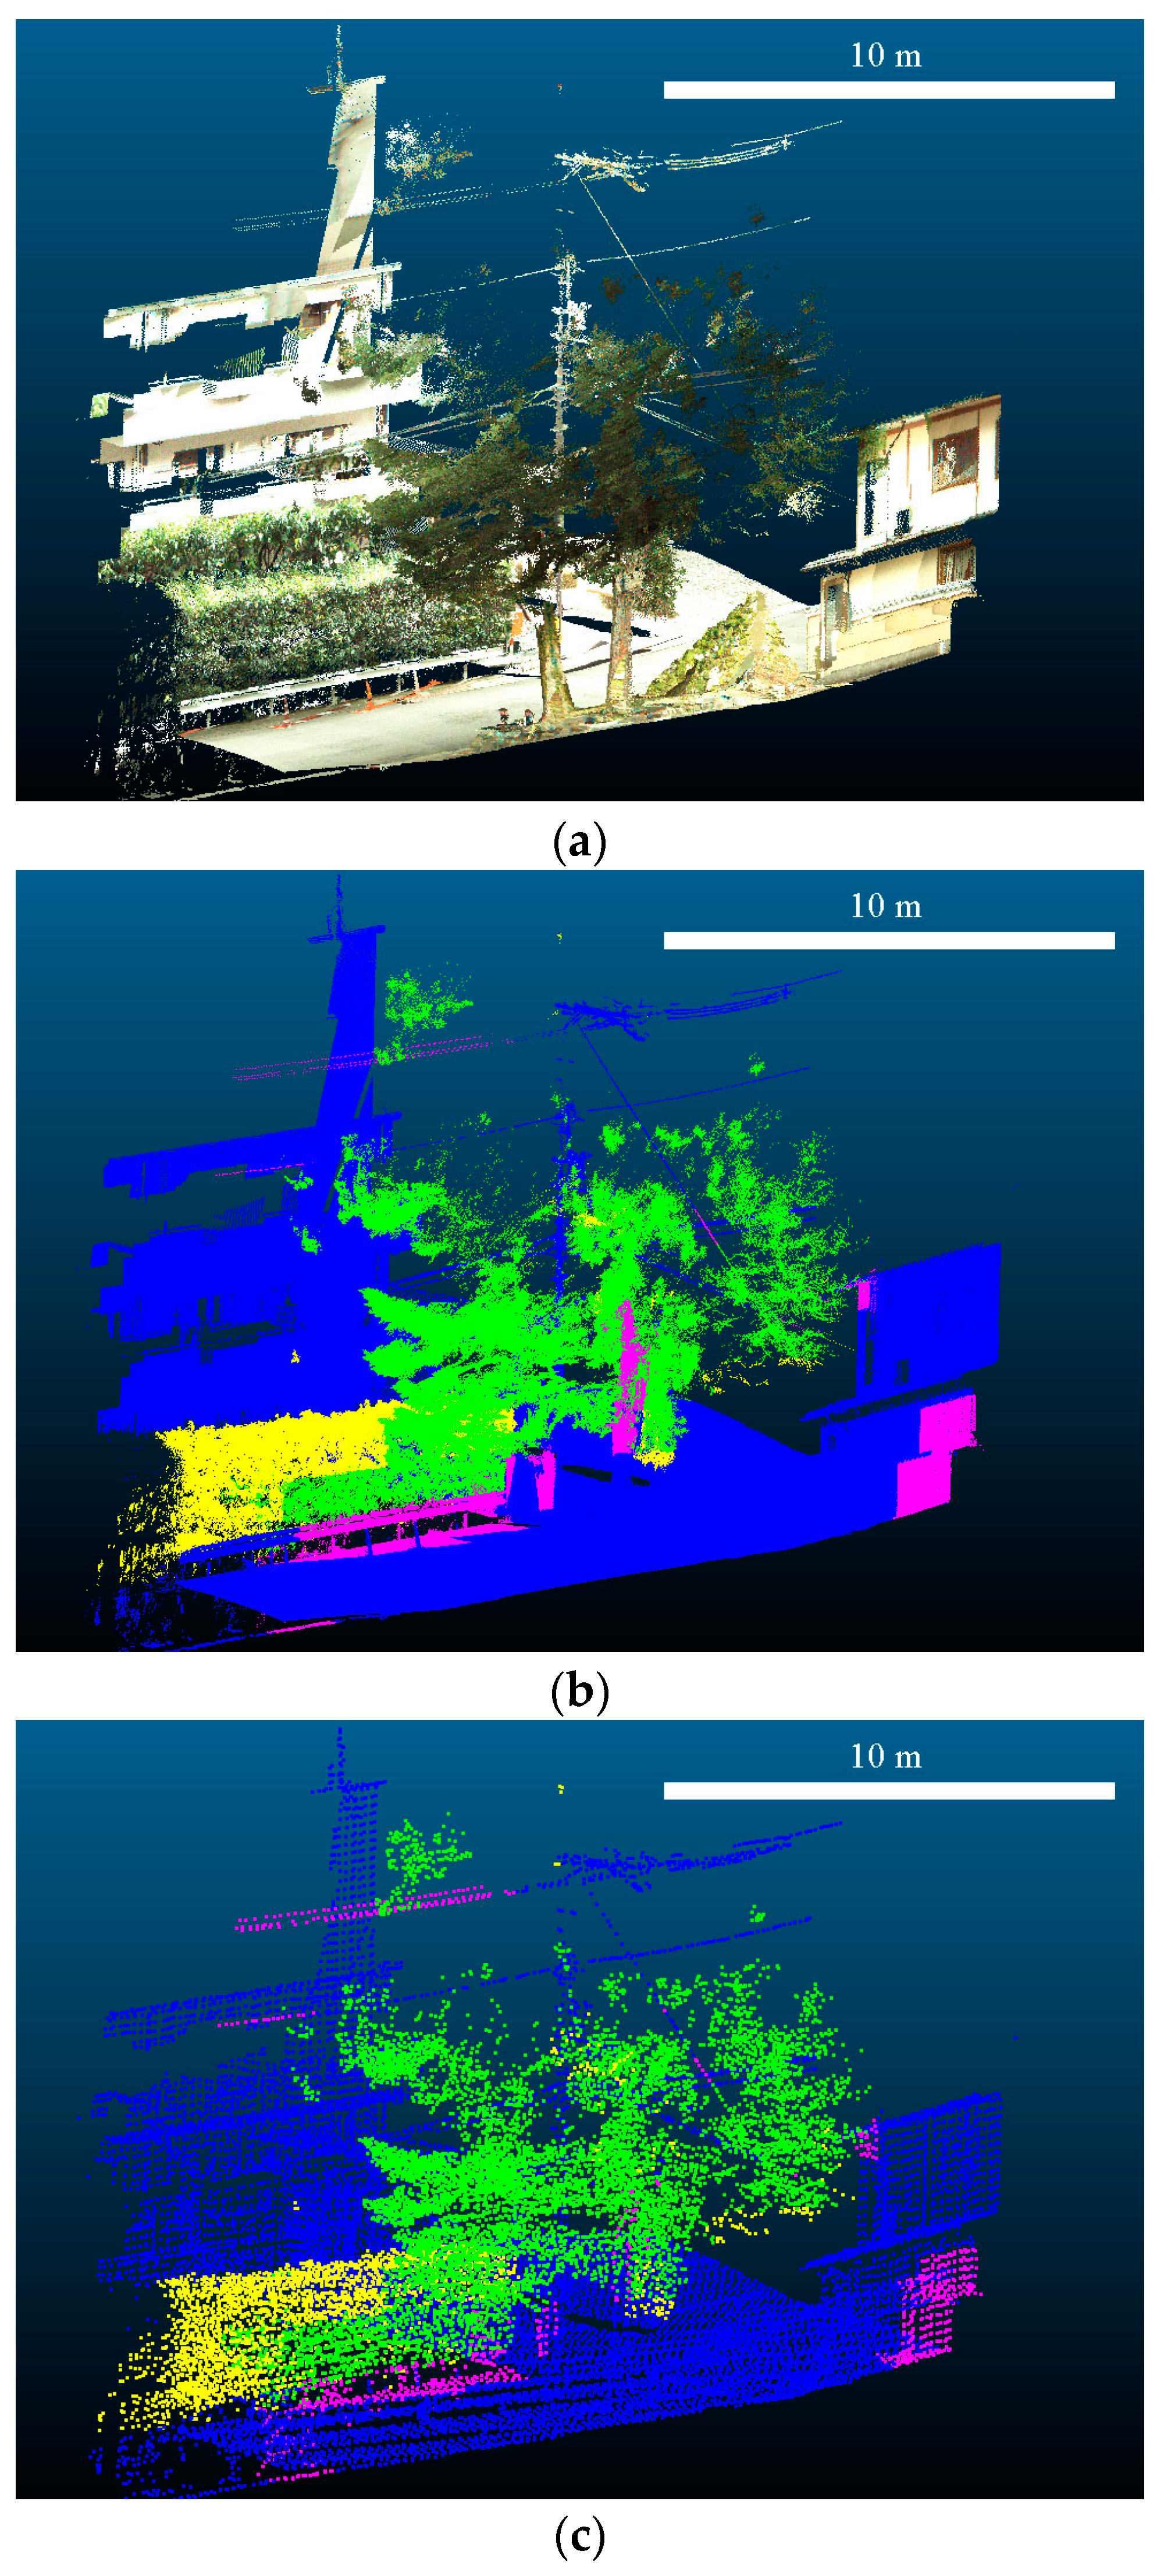
To show the performance of vegetation extraction, Figure 8 and Figure 9 demonstrate the improvement of extracting vegetation based on a multi-spatial-scale approach and the effect of the voxel sizes set for the experiments. Figure 8b and Figure 9b are the results obtained by applying the optimal parameter values.
We conducted accuracy assessments for vegetation extraction and GSR estimation. The former were assessed by F-measure, as shown in Equation (7):
F m e a s u r e = 2   ·   p r e c i s i o n   ·   r e c a l l p r e c i s i o n   +   r e c a l l p r e c i s i o n = T P / ( T P + F P ) r e c a l l = T P / ( T P + F N )
where, TP, TN, FP and FN denote true positive, true negative, false positive and false negative, respectively. The results are given in Table 1. Figure 10 shows points of the four labels in two cases: using original point clouds and using voxels. Assessment using the original points may be biased because far fewer points were observed around vegetation. Therefore, we assessed the results by aggregating the labels of points into those of voxels.
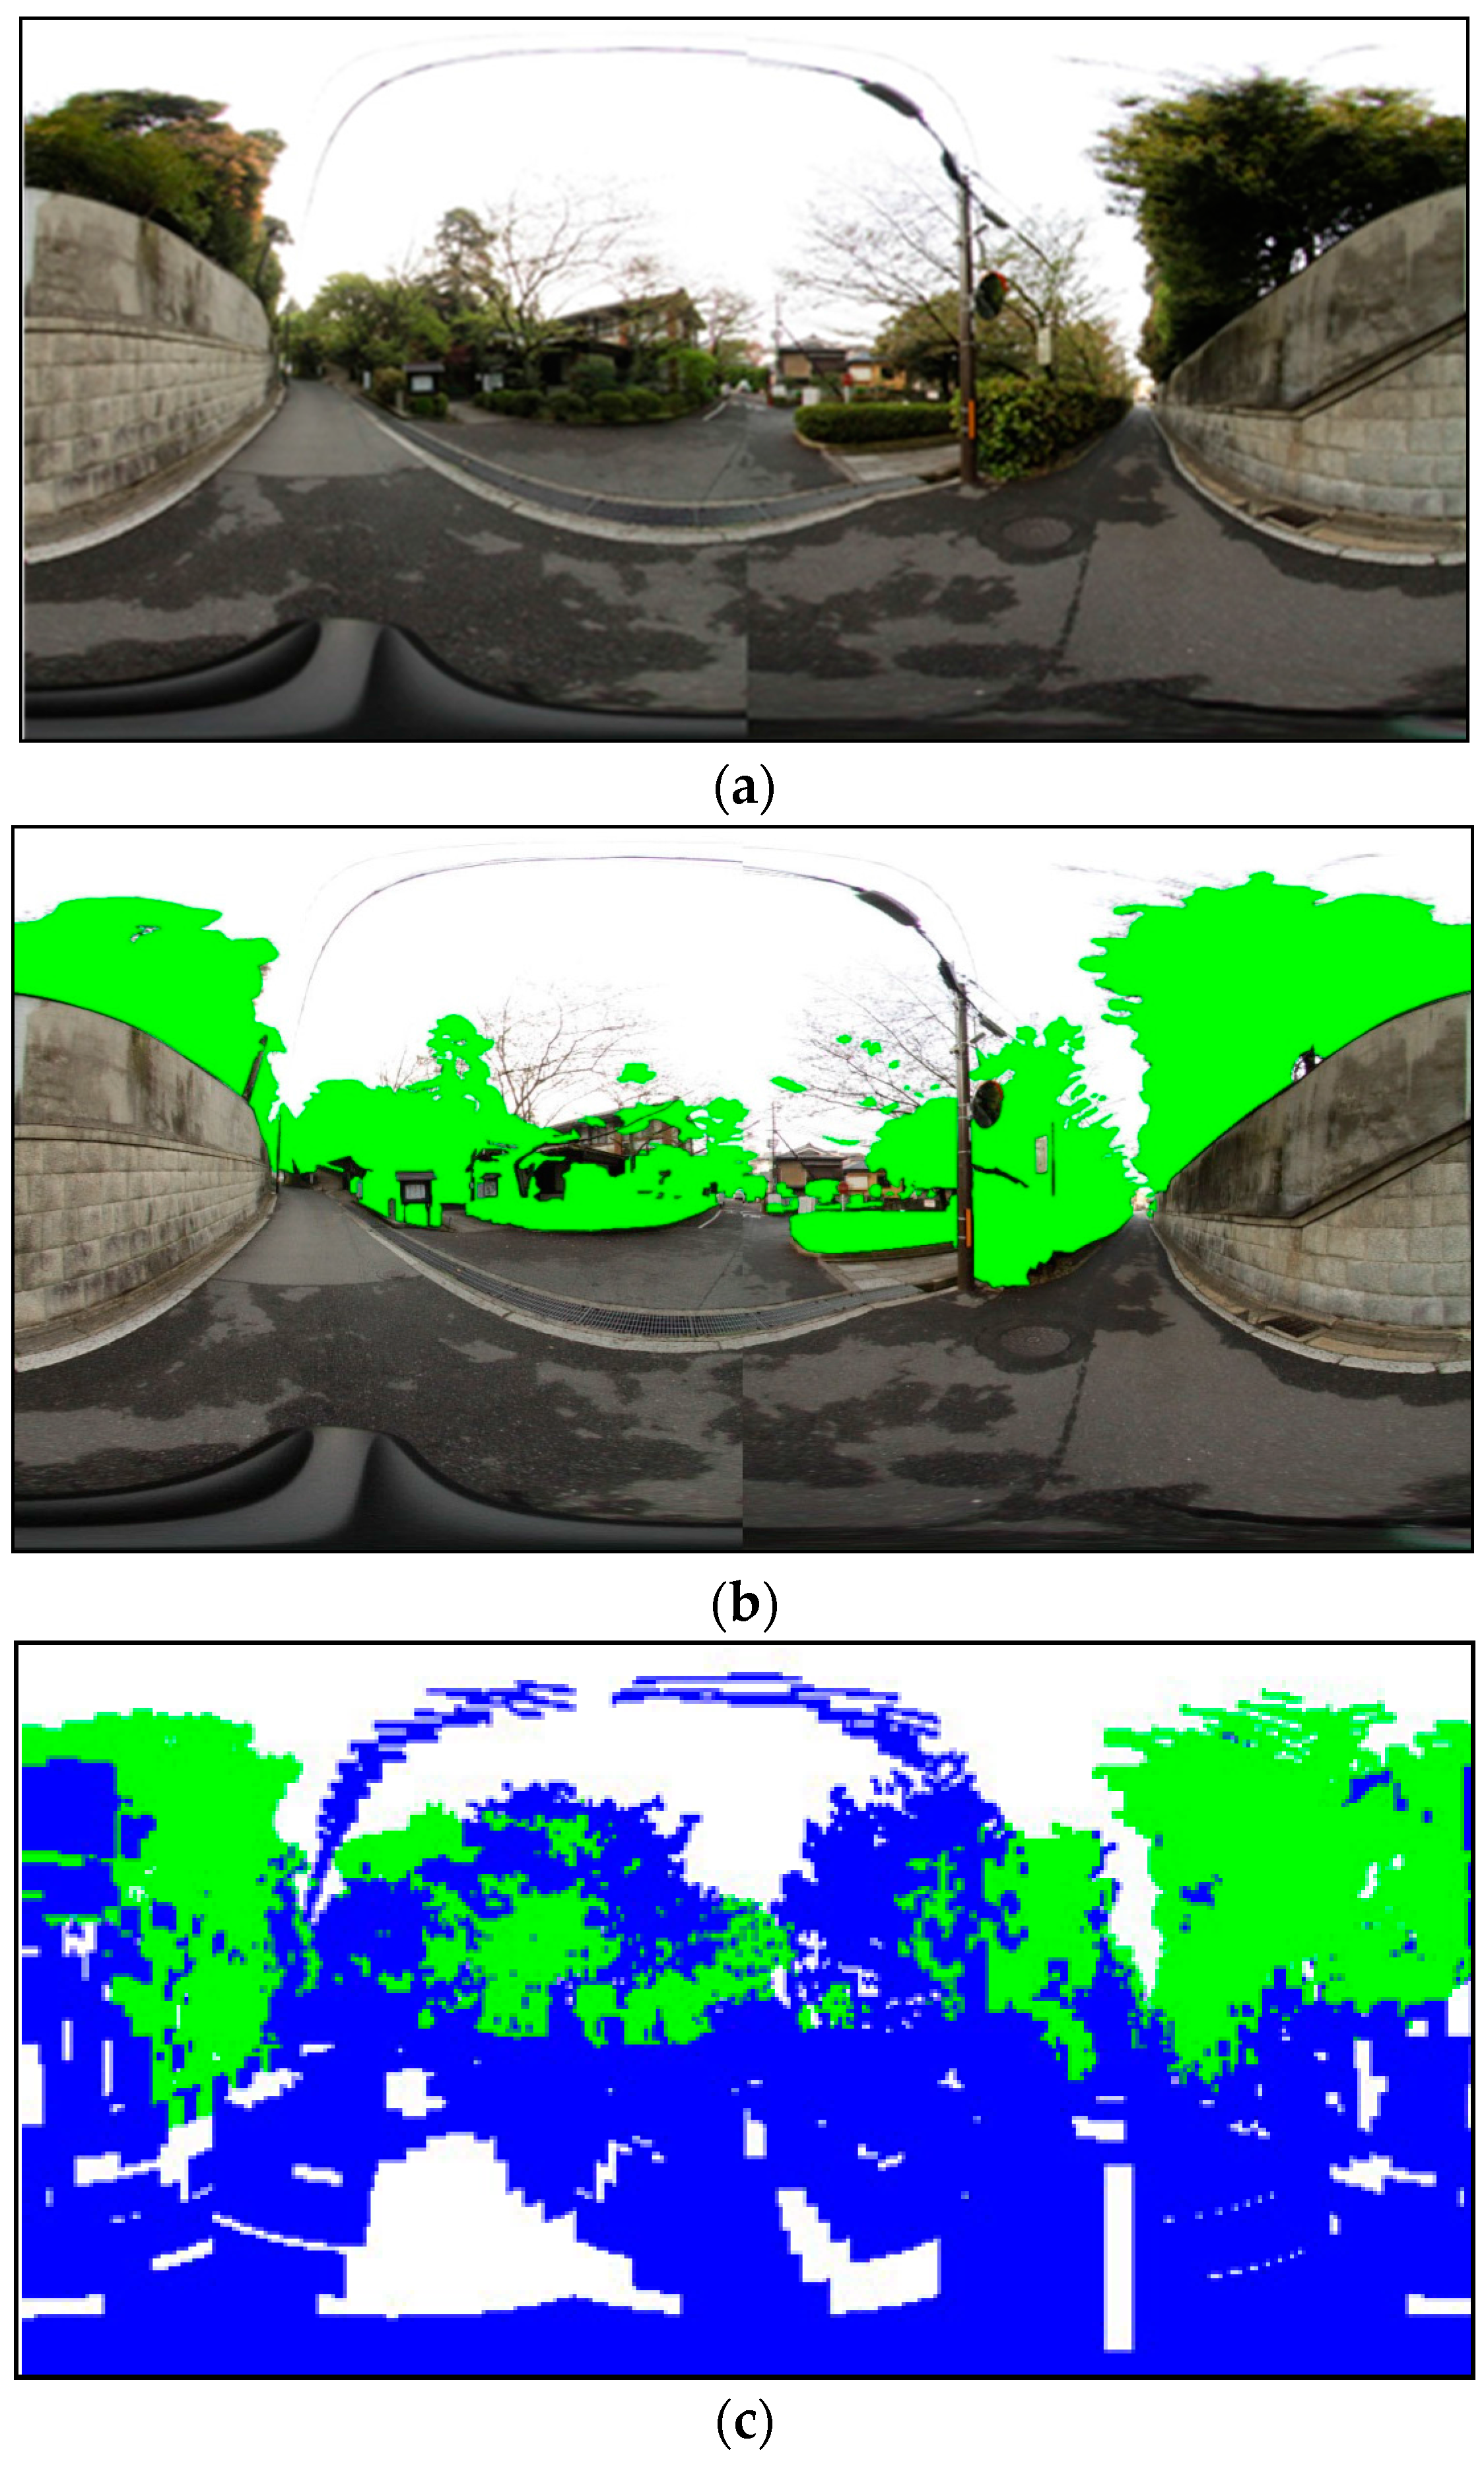
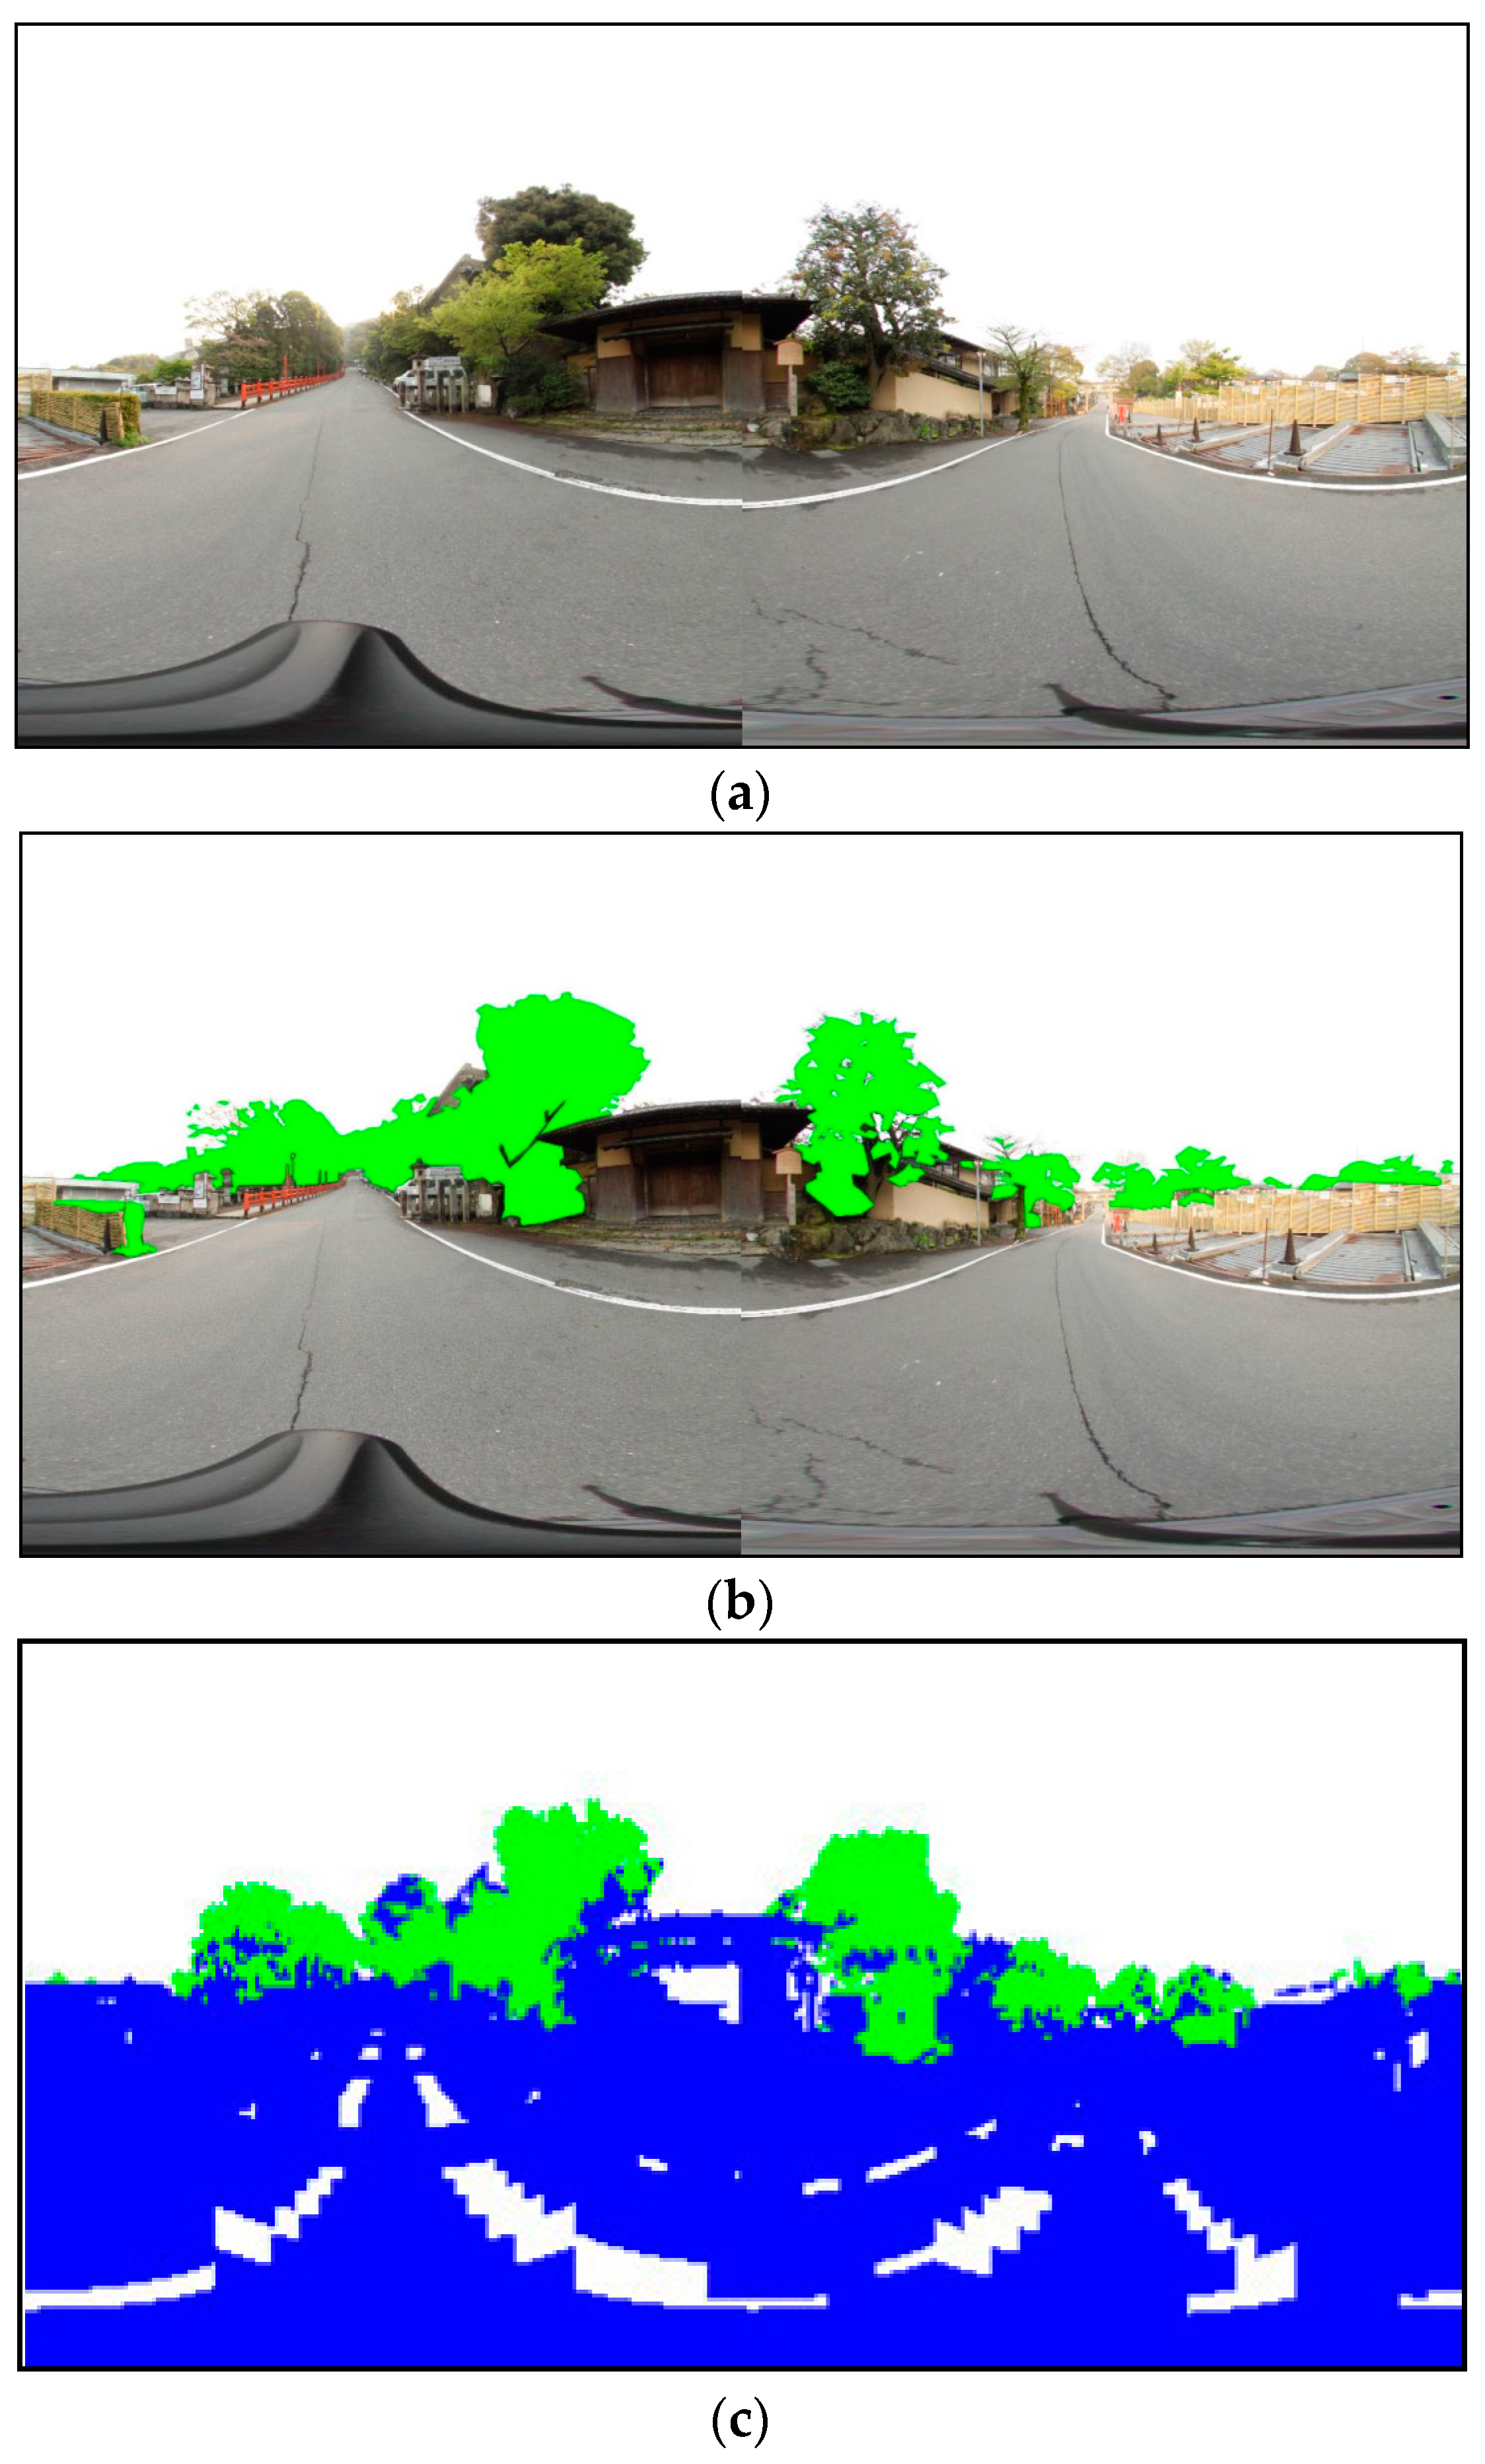
Figure 11 and Figure 12 show comparisons of the ground truth and the occlusion map obtained by applying the proposed method. 
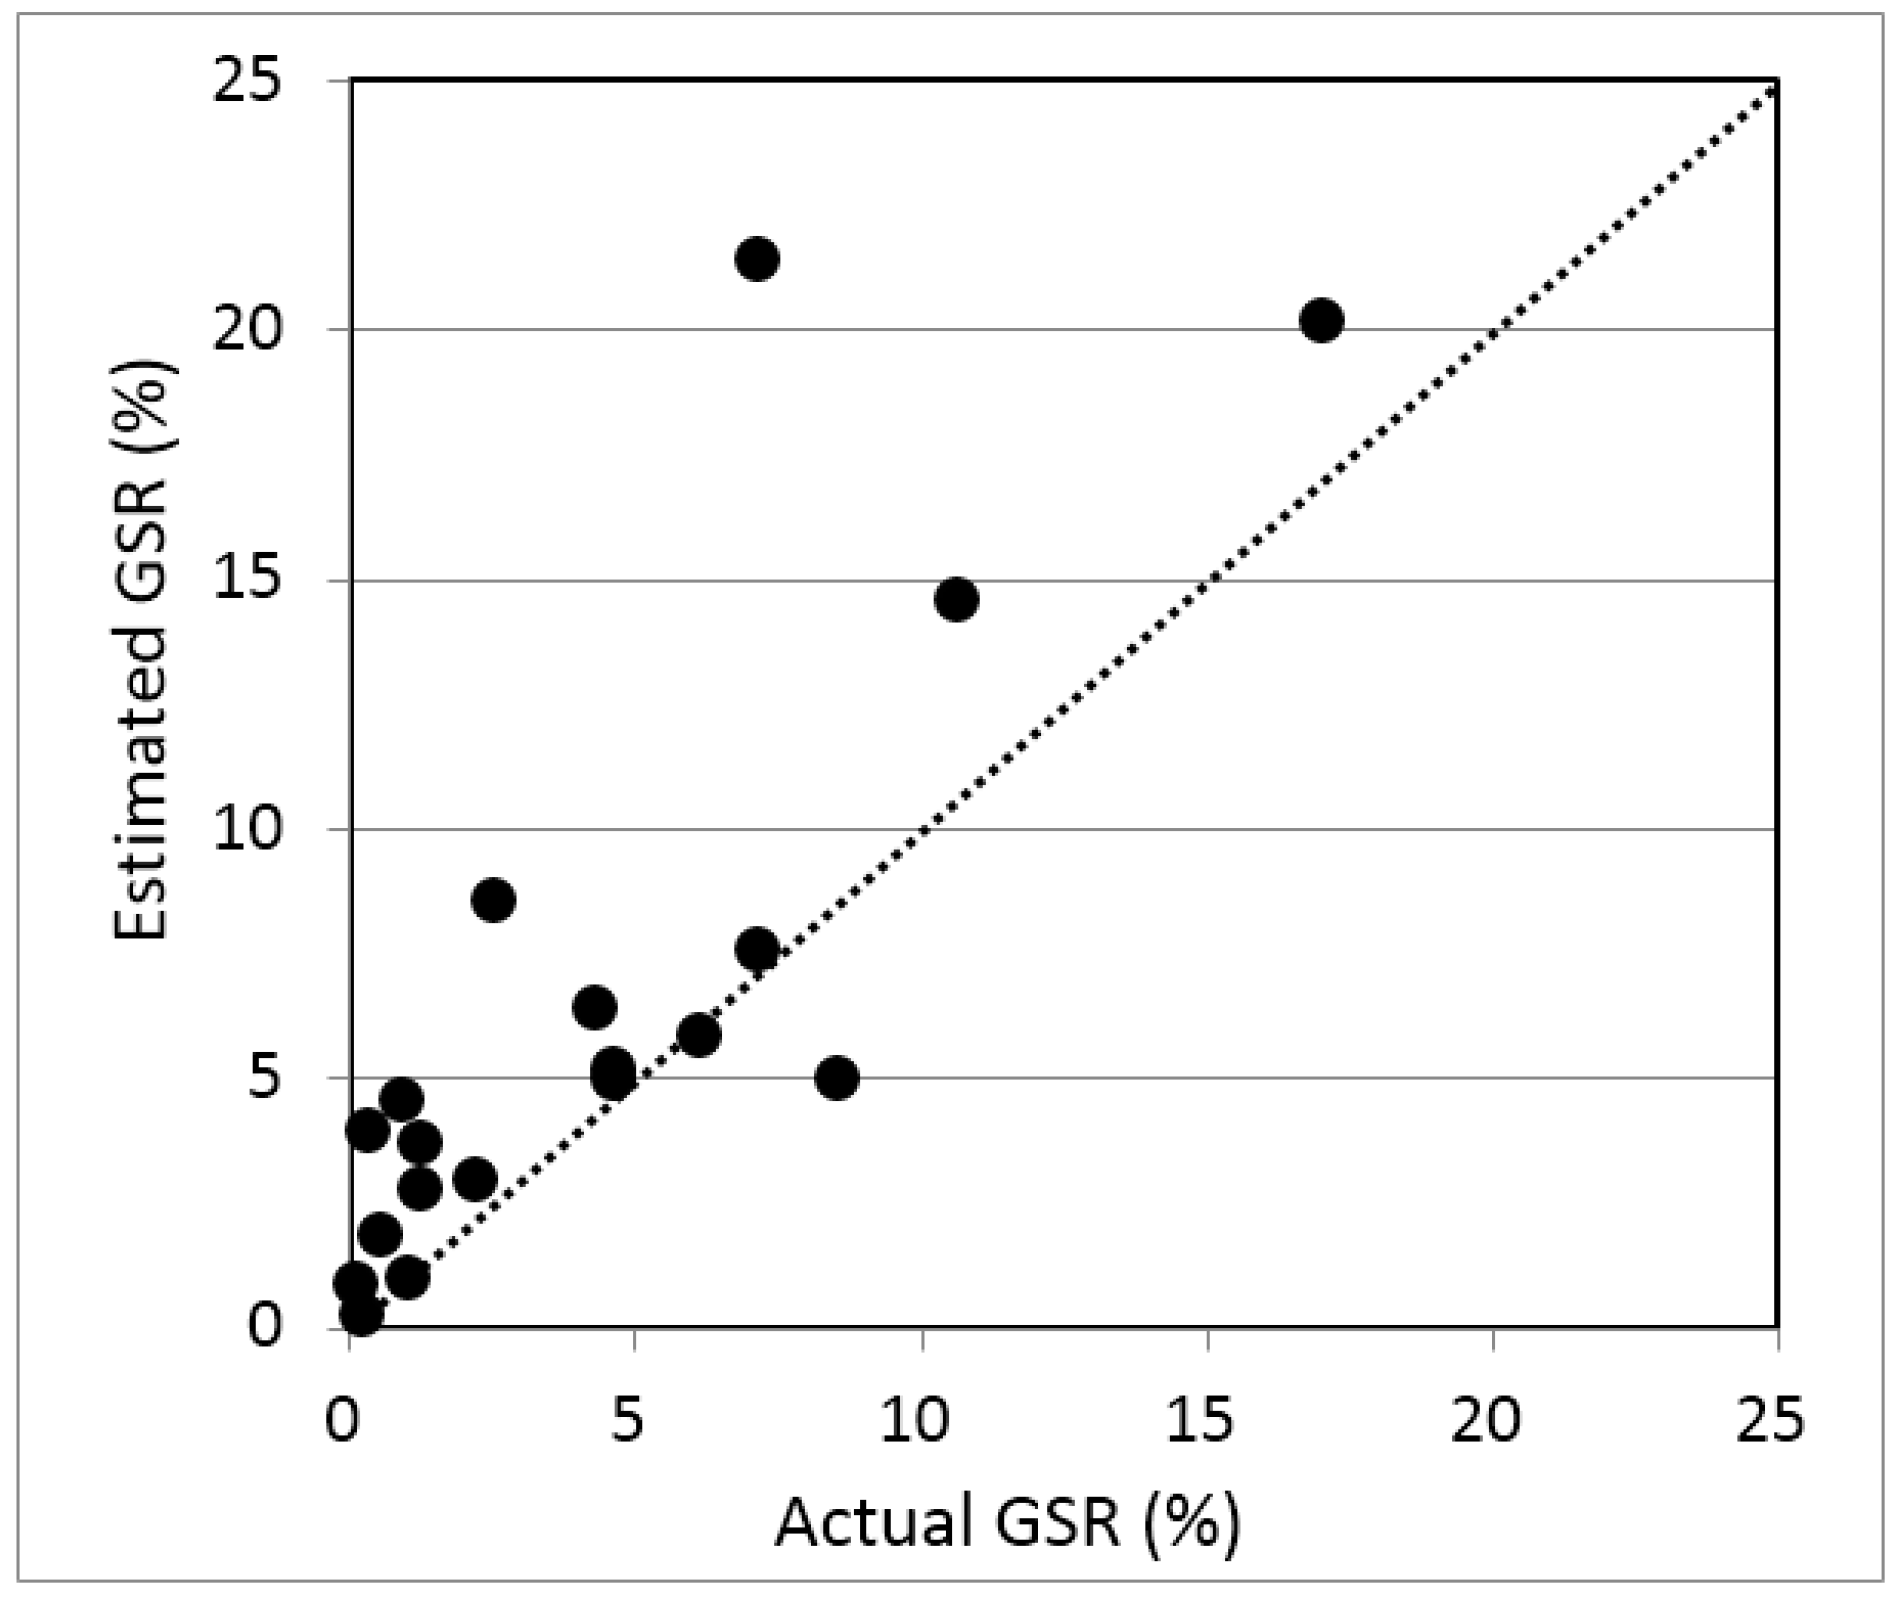
Figure 13 illustrates the comparison of the actual GSR and the estimated GSR. Finally, the RMSE of GSR estimation was found to be 4.1% for 18 points.

6. Discussion

First, we discuss the accuracy of the extracted vegetation and estimated GSR. In vegetation extraction, Figure 10b shows that the leaves of trees were well extracted, whereas the low box-shaped hedge was not extracted, shown as false negative (FN) in yellow. Figure 11 and Figure 12 show the actual view and the occlusion map at P8 and P11, respectively. In the occlusion map, green, blue and white areas represent vegetation, non-vegetation and no-object areas, respectively. The vegetation area drawn in the occlusion map of Figure 12c corresponds approximately to the area colored in green in the actual view of Figure 12b, whereas that of Figure 11c overestimated the vegetation compared to Figure 11b. As a result, the accuracy of the GSR estimated by the proposed method—an RMSE of 4.1%—was found to be acceptable (Figure 13) considering that the proposed method is designed to rapidly estimate GSR in wide areas.
The multi-spatial-scale extraction of vegetation implemented in the proposed method functions properly, as shown in Figure 8 and Figure 9. Vegetation has various types of 3D shape and surface roughness, and thus the optical spatial scale for extracting vegetation depends on such geometrical features. We take the approach of extracting vegetation using only geometrical information derived from point clouds, not using color information. This approach focuses on extracting geometrical information that reflects vegetation properties that differ from those of non-vegetation. Multi-spatial-scale processing is revealed to be effective for extracting vegetation. However, it falsely extracted as vegetation walls whose surfaces were not flat (Figure 8b) and branches without leaves. The latter are difficult to extract because they have similar geometrical features to vegetation, that is, they can be regarded as randomly sampled objects.
Next, we focus on the advantage of the proposed method for extracting vegetation and estimating GSR. As explained in Section 1, some existing approaches use point clouds and images to extract vegetation [15,16,17]. The image requires light source and the brightness of vegetation of the images may depend on the species and measurement season. As a result, the performance of extracting vegetation is not always stable. The proposed approach needs only point clouds and therefore it can avoid such unstable extraction of vegetation. In addition, mobile LiDAR data are found to be effective in estimating small vegetation that airborne LiDAR may have difficulty in extracting. In terms of estimating GSR, the proposed method can estimate it at any point of the study area. Mobile LiDAR can cover much larger areas than stationary LiDAR. The GSR estimated from mobile LiDAR data can represent smaller vegetation than that from airborne LiDAR data.
Then, we address the selection of parameter values. The optimal parameter values for vegetation extraction may be difficult to determine automatically. Therefore, in this research, we repeated manual tuning by applying them to the training data sets. For example, in a previous study we found that the optimal voxel sizes for extracting vegetation from terrestrial LiDAR data were 10 cm and 20 cm [16]. However, for mobile LiDAR data, we set them to 0.5 m and 1.0 m. We examined several different values, but finally these larger values were found to be optimal. Figure 8 and Figure 9 show that different parameter values for voxel size failed to extract vegetation. The optimal parameter values for mobile LiDAR data were found to be different from those for terrestrially fixed LiDAR data. Mobile LiDAR data covers much larger areas than does terrestrial LiDAR data, and accordingly, the range of point density per area of mobile LiDAR data changes much more than that of terrestrial LiDAR data.
Finally, we discuss the factors that contribute to the error in the GSR estimated by the proposed method. First, the estimated GSR tends to be an overestimate. Reconstructed objects become bigger than the actual objects because the voxel-based approach converts point clouds into 0.5 m or 1.0 m voxels. Second, the vegetation around θ = 90° may cause large errors, especially when the point of interest has tall trees and the occlusion map has some vegetation areas around θ = 90°. Voxels around 90° and −90° contribute more to the GSR estimation than does the actual contribution when the projection shown in Figure 11c and Figure 12c is used for the occlusion map. This contribution can be reduced using an equisolid angle projection [21]. Finally, the error in extracting vegetation using point-cloud classification should be resolved. For example, when there is vegetation on a wall or fence, such non-vegetation objects may be falsely extracted as a part of the vegetation. Separating such non-vegetation objects is one of the most difficult challenges in LiDAR data processing. Improving vegetation extraction is a key issue for improving GSR estimation.

7. Conclusions

In this paper, we presented a method for estimating GSR in urban areas using only mobile LiDAR data. The method is composed of vegetation extraction and GSR estimation. Vegetation is extracted by considering the shape of objects on multiple spatial scales. We applied the method to a residential area in Kyoto, Japan. The obtained RMSE of approximately 4.1% was found to be acceptable for rapidly assessing local landscape in a wide area. It was confirmed that mobile LiDAR could extract vegetation along streets and roads, whereas the estimated GSR tends to be an overestimate because of the voxel-based approach. The selection of optimal parameter values depends on the study area, and thus requires manual tuning. However, the proposed method overcame the existing challenge of the automatic vegetation extraction and contributes to assessment of green space even in a complex urban area, that will enrich green landscape. Future tasks are automatic selection of optimal parameter values, and improvement of the accuracy of extracting vegetation points even when there is vegetation on non-vegetation objects.

Acknowledgments

We express thanks to Amane Kurki, Kyoto University and Takuhiro Wakita for supporting in situ measurement using LiDAR and the camera, to The Obayashi Foundation for the grant of this research, and to PASCO Co., Ltd. for providing mobile LiDAR data.

Author Contributions

J.S. conceived and designed the experiments; J.S. and S.K. analyzed the data; and J.S. wrote the paper.

Conflicts of Interest

The authors declare no conflict of interest.

References

  1. Panduro, T.E.; Veie, K.L. Classification and valuation of urban green spaces—A hedonic house price evaluation. Landsc. Urban Plan. 2013, 120, 119–128. [Google Scholar] [CrossRef]
  2. Landscape Plan of Nishinomiya-City. 2011. Available online: http://www.nishi.or.jp/media/2016/keikankeikaku_nishinomiya_201609.pdf (accessed on 27 February 2017).
  3. Parent, J.R.; Volin, J.C.; Civco, D.L. A fully-automated approach to land cover mapping with airborne LiDAR and high resolution multispectral imagery in a forested suburban landscape. ISPRS J. Photogramm. Remote Sens. 2015, 104, 18–29. [Google Scholar] [CrossRef]
  4. Tian, Y.; Jim, C.Y.; Wang, H. Assessing the landscape and ecological quality of urban green spaces in a compact city. Landsc. Urban Plan. 2014, 121, 97–108. [Google Scholar] [CrossRef]
  5. Gupta, K.; Kumar, P.; Pathan, S.K.; Sharma, K.P. Urban neighborhood green index—A measure of green spaces in urban areas. Landsc. Urban Plan. 2012, 105, 325–335. [Google Scholar] [CrossRef]
  6. Rutzinger, M.; Höfle, B.; Hollaus, M.; Pfeifer, N. Object-based point cloud analysis of full-waveform airborne laser scanning data for urban vegetation classification. Sensors 2008, 8, 4505–4528. [Google Scholar] [CrossRef] [PubMed]
  7. Elseberg, J.; Borrmann, D.; Nuchter, A. Full wave analysis in 3D laser scans for vegetation detection in urban environments. In Proceedings of the 2011 XXIII International Symposium on Information, Communication and Automation Technologies, Sarajevo, Bosnia and Herzegovina, 27–29 October 2011; pp. 1–7.
  8. Unnikrishnan, R.; Hebert, M. Multi-scale interest regions from unorganized point clouds. In Proceedings of the Computer Vision and Pattern Recognition Workshops 2008, Anchorage, AK, USA, 23–28 June 2008; pp. 1–8.
  9. Lim, E.H.; Suter, D. 3D terrestrial LIDAR classifications with super-voxels and multi-scale Conditional Random Fields. Comput. Aided Des. 2009, 41, 701–710. [Google Scholar] [CrossRef]
  10. Xu, S.; Vosselman, G.; Oude Elberink, S. Multiple-entity based classification of airborne laser scanning data in urban areas. ISPRS J. Photogramm. Remote Sens. 2014, 88, 1–15. [Google Scholar] [CrossRef]
  11. Brodu, N.; Lague, D. 3D terrestrial lidar data classification of complex natural scenes using a multi-scale dimensionality criterion: Applications in geomorphology. ISPRS J. Photogramm. Remote Sens. 2012, 68, 121–134. [Google Scholar] [CrossRef] [Green Version]
  12. Wakita, T.; Susaki, J. Multi-scale based extraction of vegetation from terrestrial LiDAR data for assessing local landscape. ISPRS Ann. Photogramm. Remote Sens. Spat. Inf. Sci. 2015, II-3/W4, 263–270. [Google Scholar] [CrossRef]
  13. Susaki, J.; Komiya, Y. Estimation of green ratio index using airborne LiDAR and aerial images. In Proceedings of the 2014 8th IAPR Workshop on Pattern Recognition in Remote Sensing, Stockholm, Sweden, 24 August 2014; pp. 1–4.
  14. Wakita, T.; Susaki, J.; Kuriki, A. Assessment of vegetation landscape index in urban areas from terrestrial LiDAR Data. In Proceedings of the 36th Asian Conference on Remote Sensing (ACRS), Quezon City, Philippines, 24–28 October 2015.
  15. Huang, Y.; Yu, B.; Zhou, J.; Hu, C.; Tan, W.; Hu, Z.; Wu, J. Toward automatic estimation of urban green volume using airborne LiDAR data and high resolution Remote Sensing images. Front. Earth Sci. 2013, 7, 43–54. [Google Scholar] [CrossRef]
  16. Yang, J.; Zhao, L.S.; McBride, J.; Gong, P. Can you see green? Assessing the visibility of urban forests in cities. Landsc. Urban Plan. 2009, 91, 97–104. [Google Scholar] [CrossRef]
  17. Yu, S.; Yu, B.; Song, W.; Wu, B.; Zhou, J.; Huang, Y.; Wu, J.; Zhao, F.; Mao, W. View-based greenery: A three-dimensional assessment of city buildings’ green visibility using Floor Green View Index. Landsc. Urban Plan. 2016, 152, 13–26. [Google Scholar] [CrossRef]
  18. Lin, Y.; Holopainen, M.; Kankare, V.; Hyyppa, J. Validation of mobile laser scanning for understory tree characterization in urban forest. IEEE J. Sel. Top. Appl. Earth Obs. Remote Sens. 2014, 7, 3167–3173. [Google Scholar] [CrossRef]
  19. Yang, B.; Dong, Z. A shape-based segmentation method for mobile laser scanning point clouds. ISPRS J. Photogramm. Remote Sens. 2013, 81, 19–30. [Google Scholar] [CrossRef]
  20. Wu, B.; Yu, B.; Yue, W.; Shu, S.; Tan, W.; Hu, C.; Huang, Y.; Wu, J.; Liu, H. A voxel-based method for automated identification and morphological parameters estimation of individual street trees from mobile laser scanning data. Remote Sens. 2013, 5, 584–611. [Google Scholar] [CrossRef]
  21. Susaki, J.; Komiya, Y.; Takahashi, K. Calculation of enclosure index for assessing urban landscapes using digital surface models. IEEE J. Sel. Top. Appl. Earth Obs. Remote Sens. 2014, 7, 4038–4045. [Google Scholar] [CrossRef]
Figure 1. Study area: (a) Kyoto city in Japan, shown in yellow. The black rectangle corresponds to the area shown in (b). (b) Assessment positions are marked by yellow pins. Image is from Google Earth.
Remotesensing 09 00215 g001
Figure 2. Maximum elevation angle θmax at which occlusion by vegetation is present from the viewpoint of a human of height h along azimuth φ within the maximum range Dmax. (a) Minimum elevation angle θmin is estimated by referring to the ground surface height of a point where θmax is observed in the case where no object exists between the human and vegetation. (b) In the case where multiple populations of vegetation exist, maximum and minimum elevation angles occluded by each one are examined. In (b), e1 and e3 denote the eye sights at the maximum elevation angles, whereas e2 and e4 denote the eye sights at the minimum elevation angles.
Remotesensing 09 00215 g002
Figure 3. Occlusion map for calculating green space ratio (GSR) in azimuth–elevation angle space. GSR is defined as the ratio of occluded vegetation area to the entire area.
Remotesensing 09 00215 g003
Figure 4. Flowchart of the proposed method for estimating GSR from mobile scanning data.
Remotesensing 09 00215 g004
Figure 5. Flowchart of the method for extracting point clouds of vegetation. G1, G2 and G3 denote groups of vegetation, ambiguous voxels (vegetation and non-vegetation), and non-vegetation, respectively. σij denotes voxel size for the j-th processing in the i-th loop.
Remotesensing 09 00215 g005
Figure 6. Classification of voxels with the shape-based index defined by Equation (3). ai1 and ai2 are thresholds in the i-th loop for discriminating G1 from G2, and G3 from G2, respectively.
Remotesensing 09 00215 g006
Figure 7. Classification of voxels based on continuity. Target voxels are changed into vegetation ones.
Remotesensing 09 00215 g007
Figure 8. Improvement of extracting vegetation based on a multi-spatial-scale approach: (a) colored point cloud; (b) vegetation extracted with σ11 = 0.5 m, σ12 = 1.0 m, σ21 = 1.0 m and σ22 = 2.0 m; and (c) vegetation extracted with σ11 = 1.0 m, σ12 = 2.0 m, σ21 = 2.0 m and σ22 = 4.0 m. (b,c) Red and green denote vegetation extracted in the first and second loop, respectively, and blue denotes non-vegetation.
Remotesensing 09 00215 g008
Figure 9. (ac) Improvement of extracting vegetation based on a multi-spatial-scale approach. See Figure 8 for a description of each panel.
Remotesensing 09 00215 g009
Figure 10. Accuracy assessment of vegetation extraction: (a) colored point cloud; (b) verified result for original point cloud; and (c) verified result for 0.2 m voxel. (b,c) Green, blue, pink and yellow denote true positive (TP), true negative (TN), false positive (FP) and false negative (FN), respectively.
Remotesensing 09 00215 g010
Figure 11. Comparison of ground truth and occlusion map at P8 (shown in Figure 1): (a) ground truth obtained from the images taken by a camera with a fisheye lens; (b) vegetation manually extracted from (a); and (c) occlusion map generated using the proposed method. (b,c) Green denotes vegetation. (c) Blue and white denote non-vegetation and others, respectively. (b) Actual GSR = 17.0%. (c) Estimated GSR = 20.2%.
Remotesensing 09 00215 g011
Figure 12. (ac) Comparison of ground truth and occlusion map at P11 (shown in Figure 1). See Figure 11 for a description of each panel. (b) Actual GSR = 7.1%. (c) Estimated GSR = 7.6%.
Remotesensing 09 00215 g012
Figure 13. Comparison of actual GSR and estimated GSR.
Remotesensing 09 00215 g013
Table 1. Accuracy assessment of GSR estimation.
Original Point Cloud0.2 m Voxel
Number of samples1,993,25329,043
True Positive (TP)371,6299154
True Negative (TN)1,392,44416,036
False Positive (FP)94,6441132
False Negative (FN)134,5362721
Precision0.800.89
Recall0.730.77
F-measure0.760.83

