
Remote Sensing of Glacier Change in the Central Qinghai-Tibet Plateau and the Relationship with Changing Climate


Abstract
:
1. Introduction
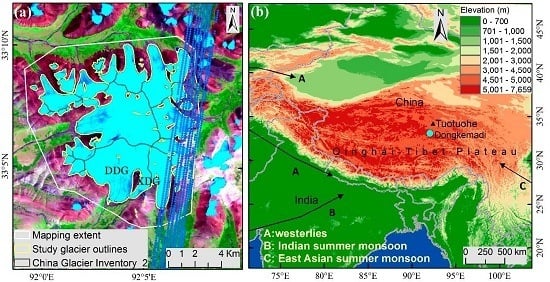
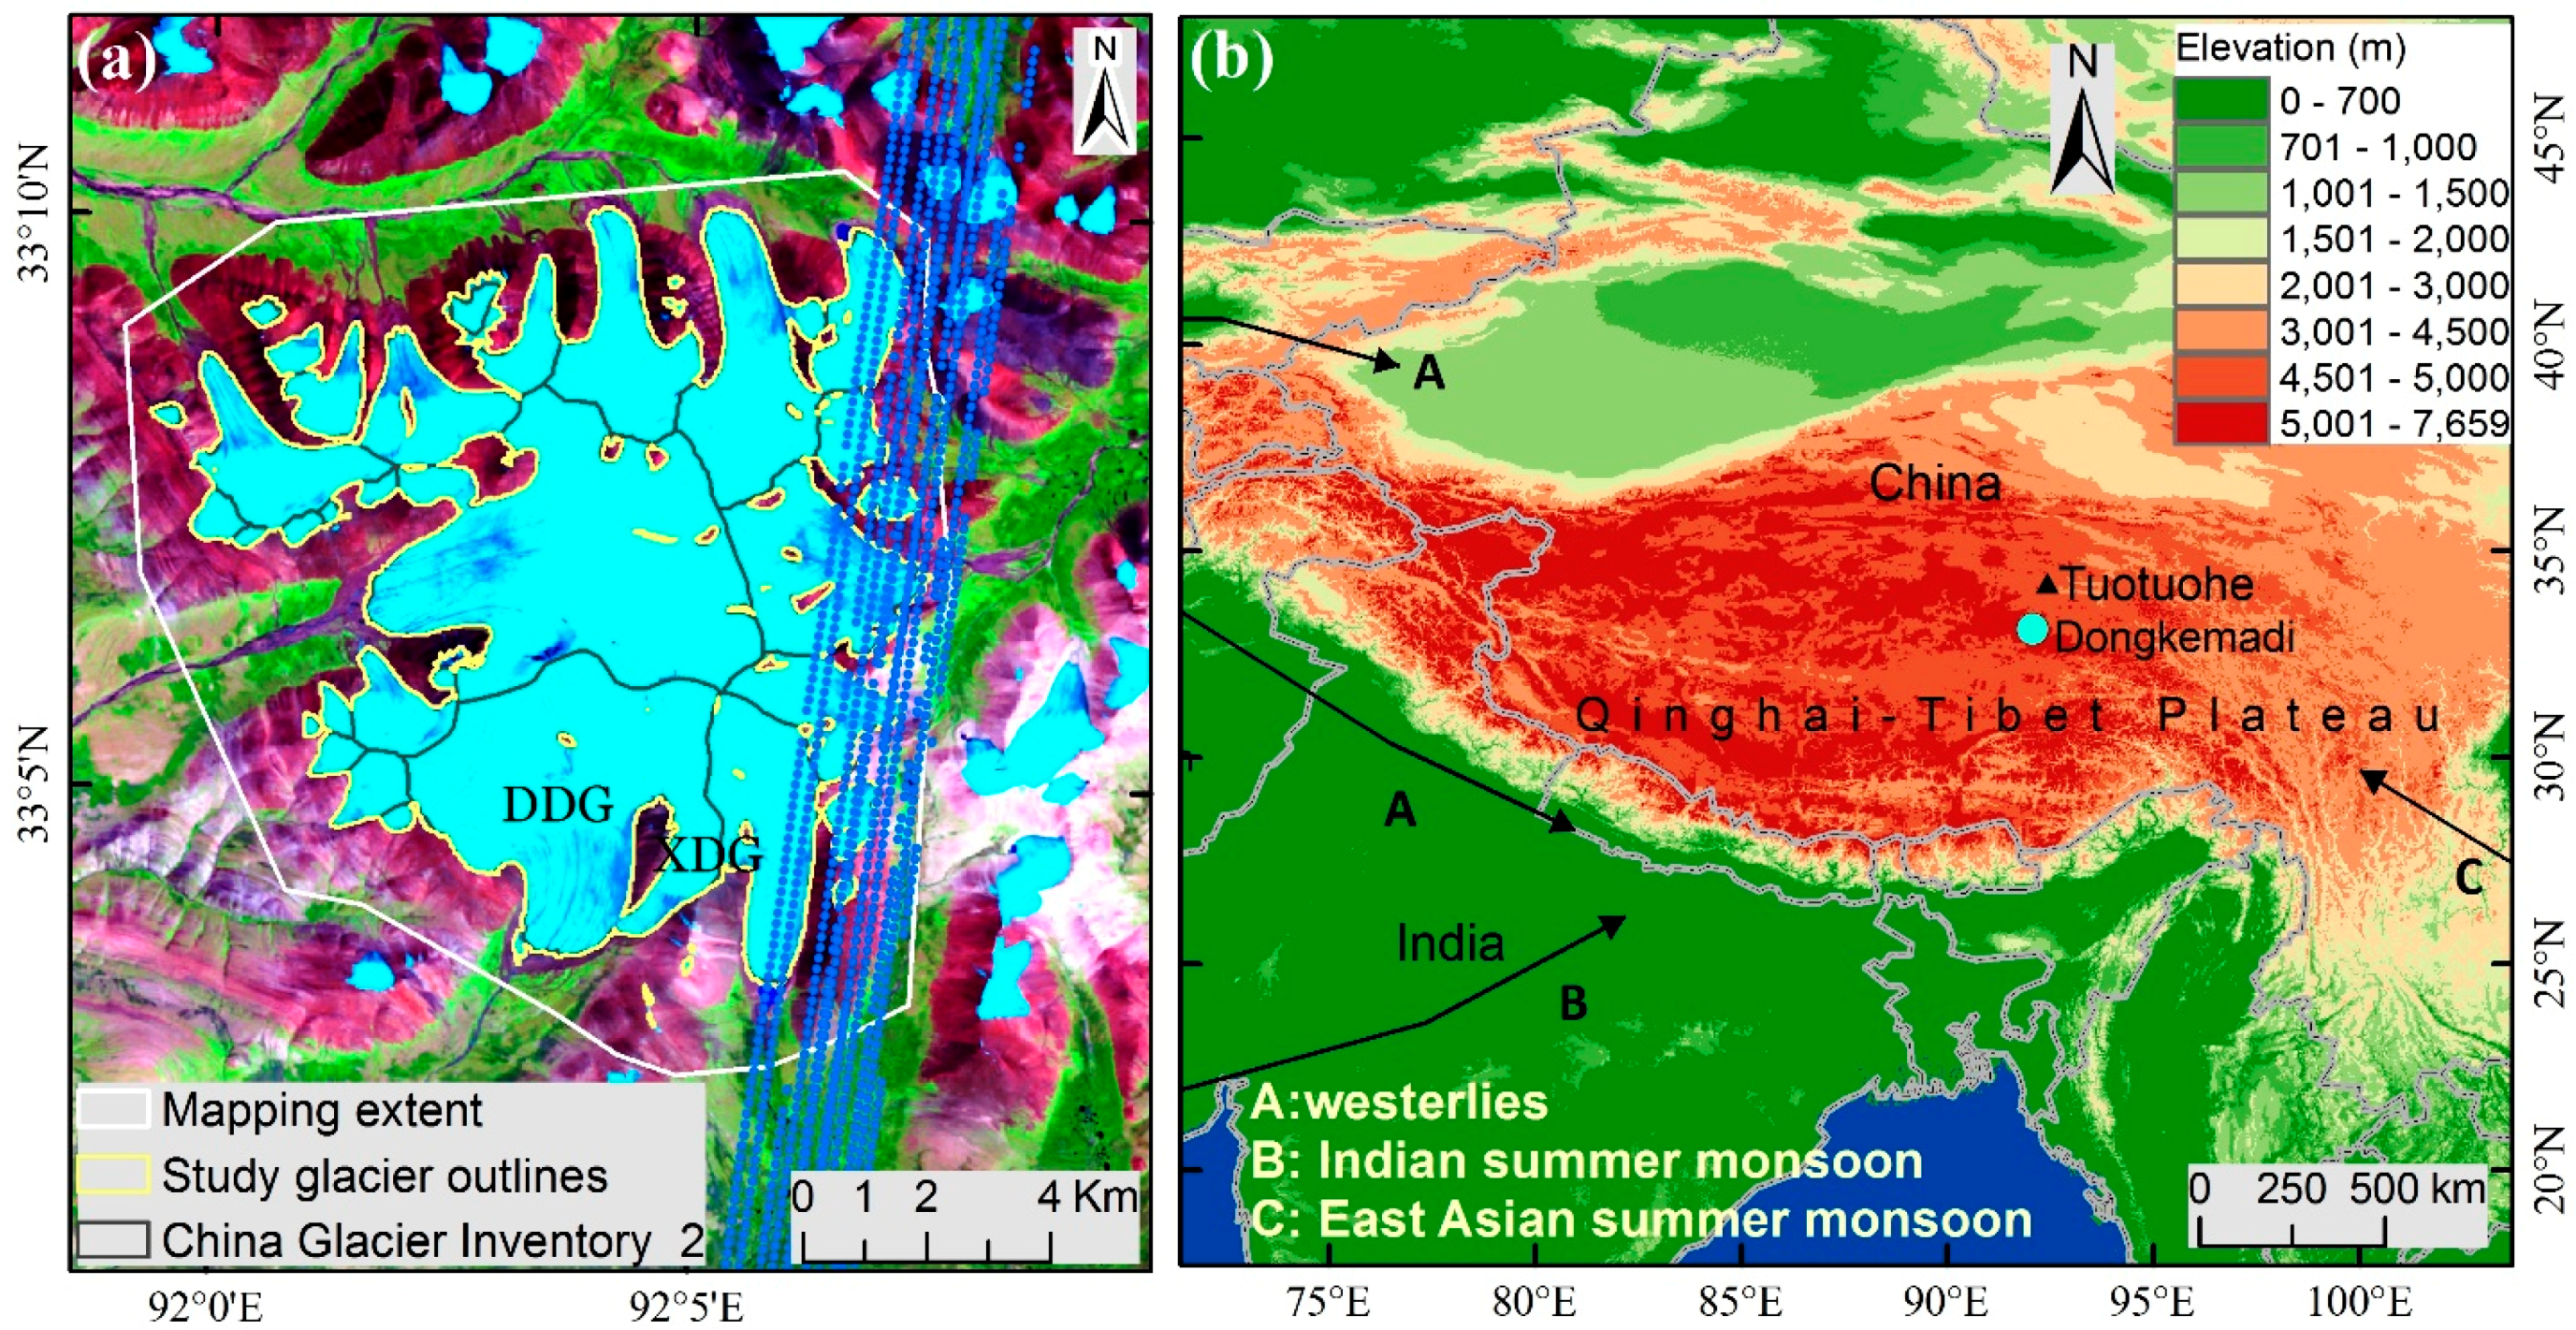
2. Study Area
3. Datasets and Methods
3.1. Glacier Area and Elevation Changes
3.1.1. Landsat Images over 1976–2013
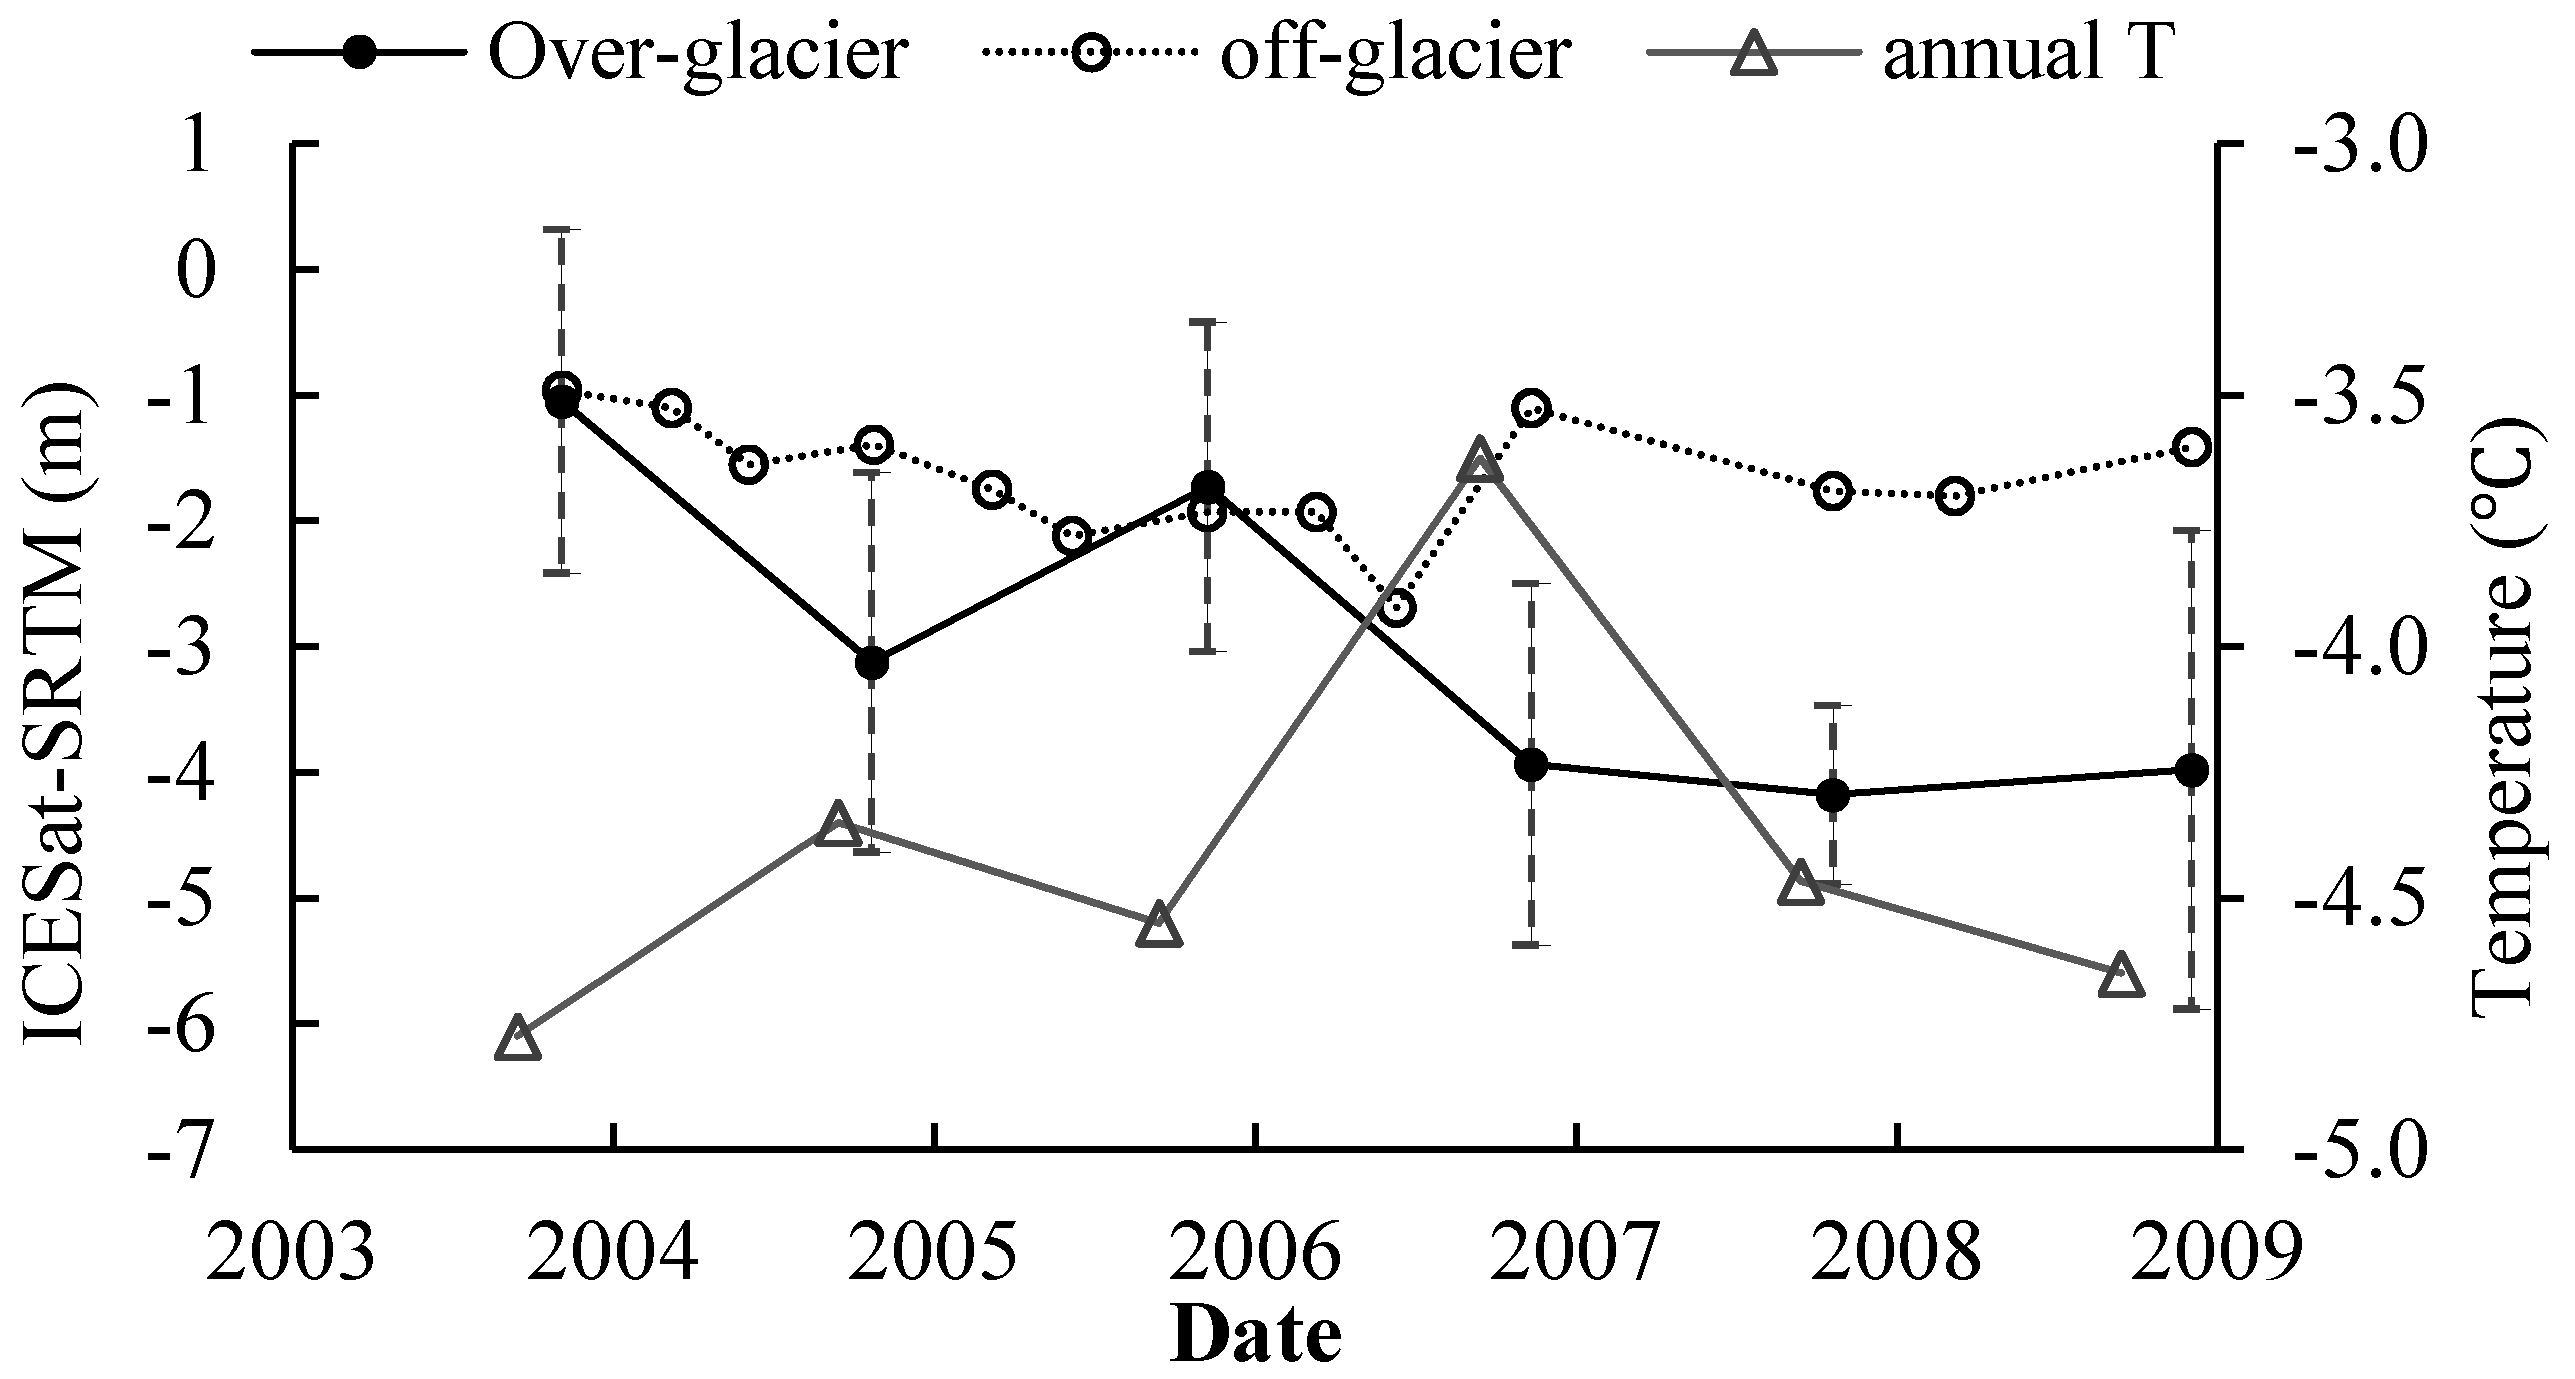
3.1.2. ICESat Elevation Measurements over 2003–2008
3.2. Glacier–Climate Relationship
4. Results and Discussion
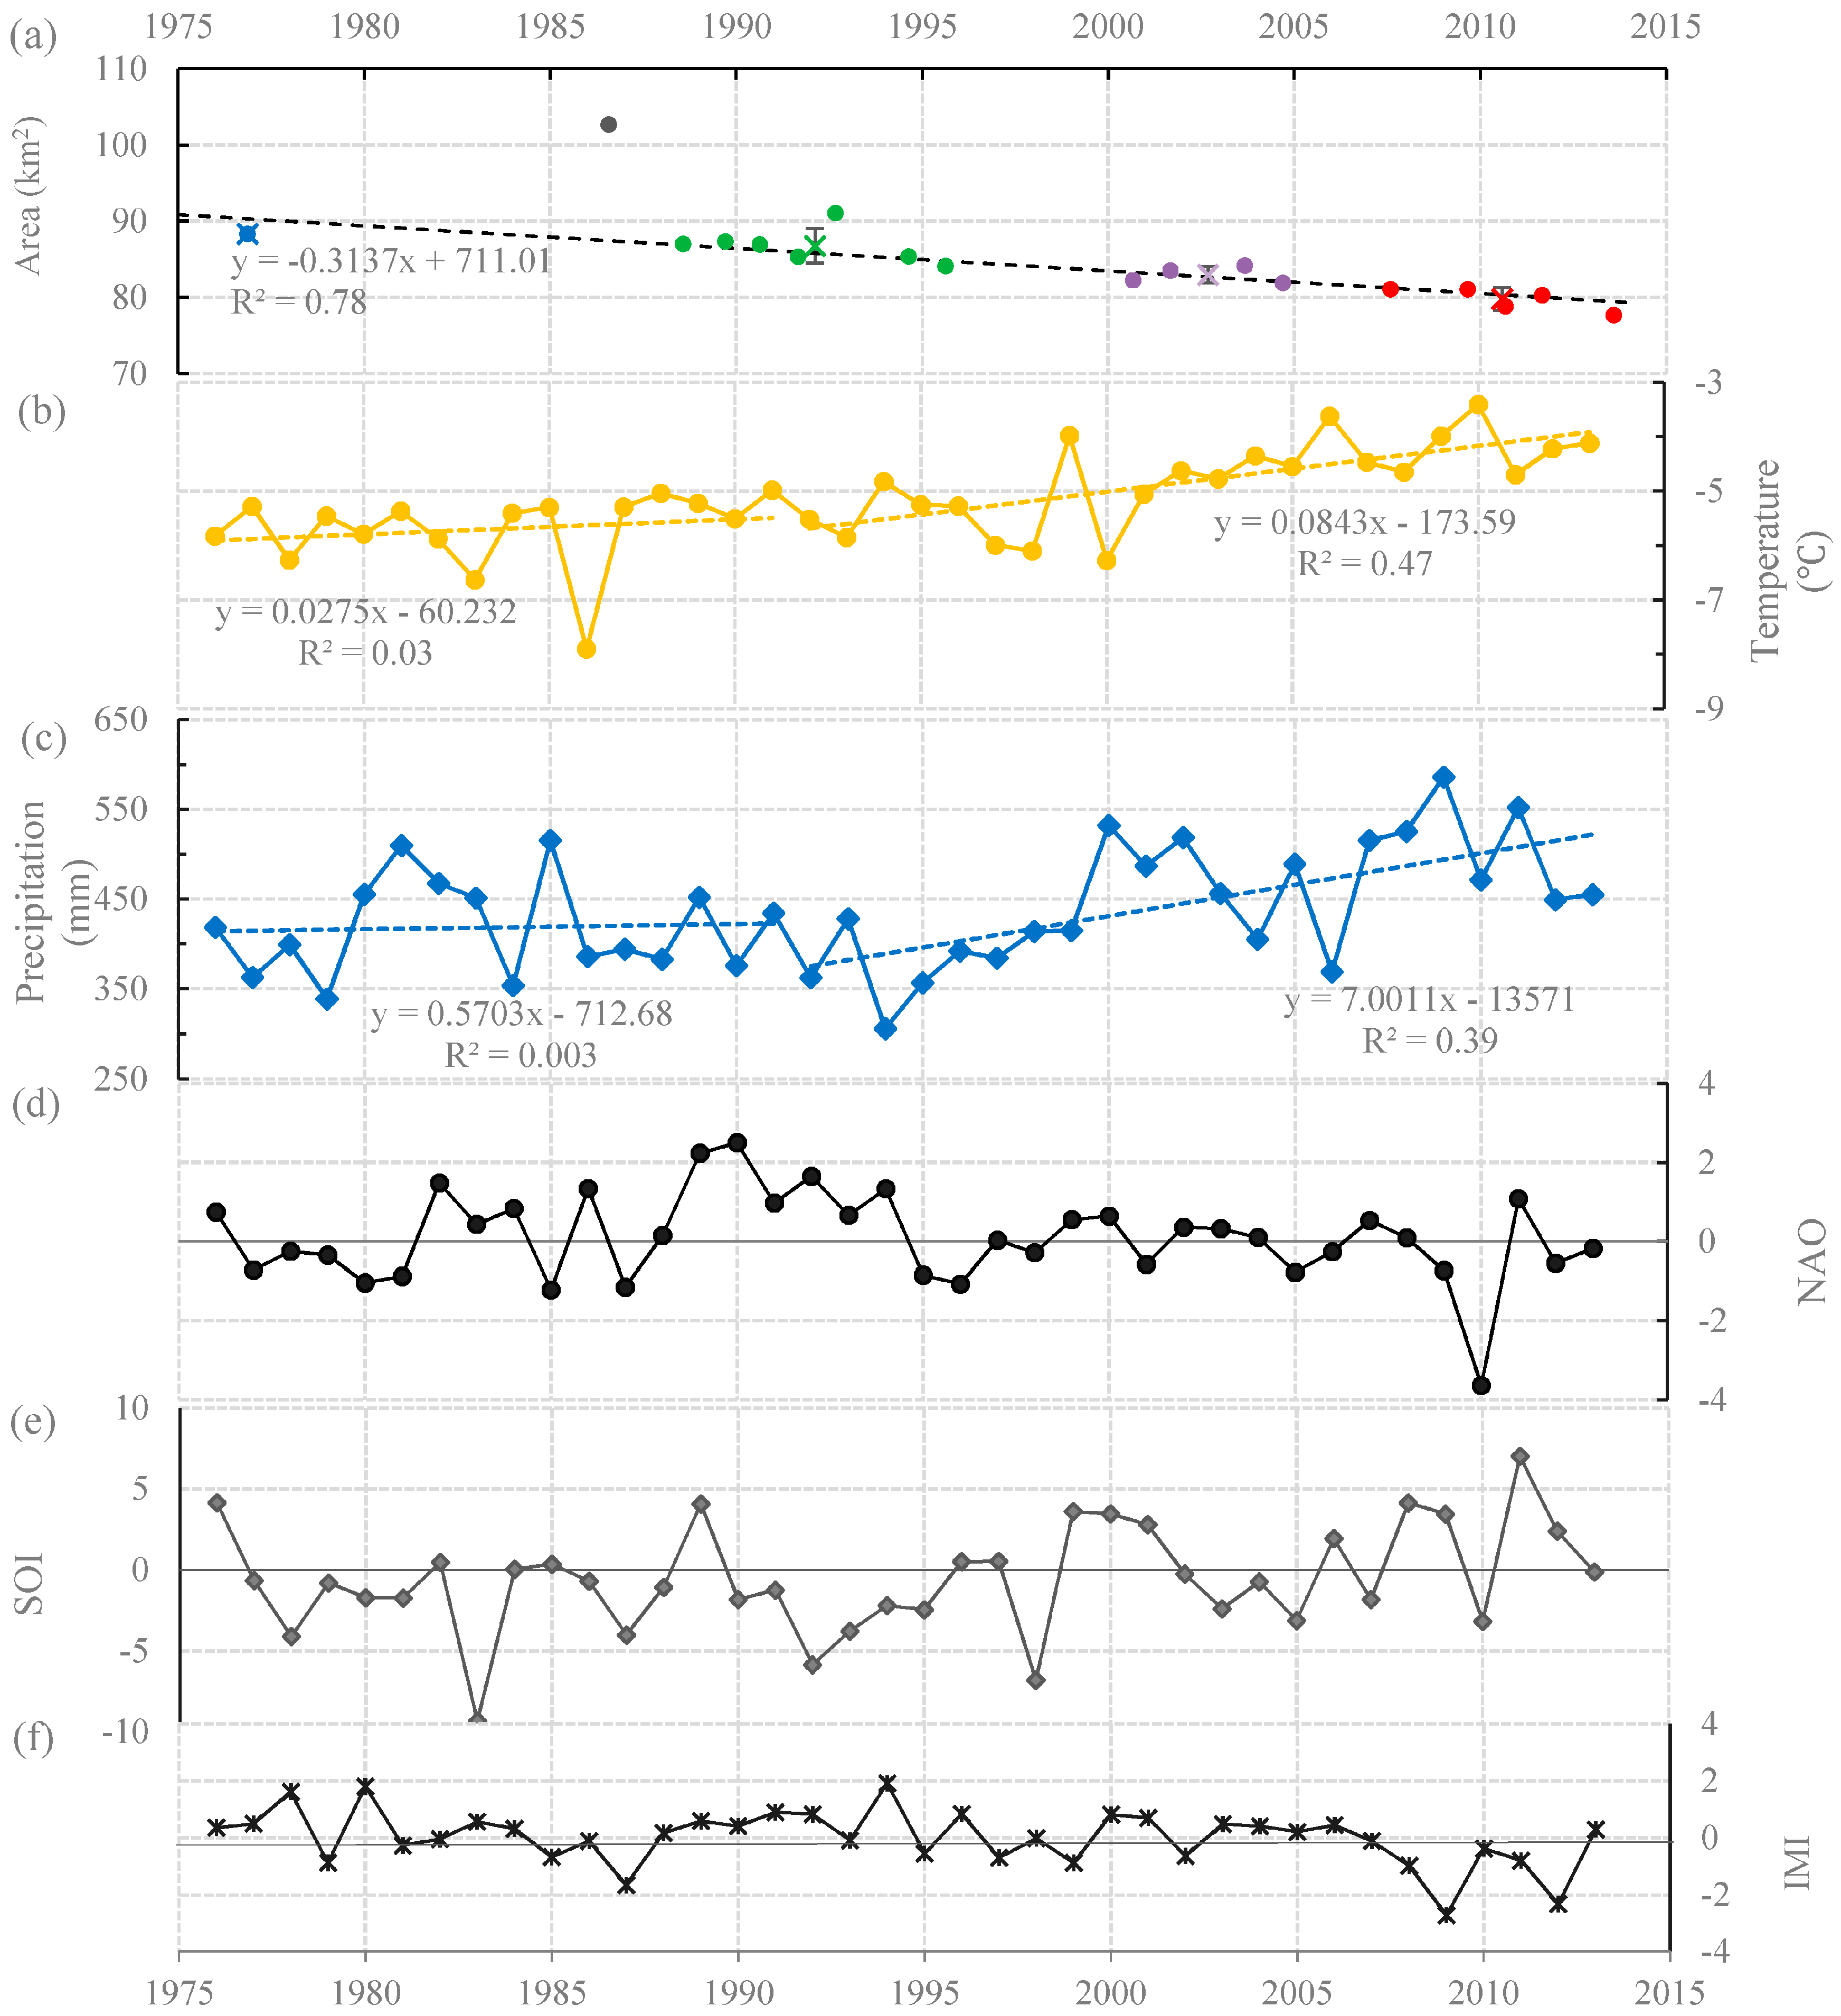
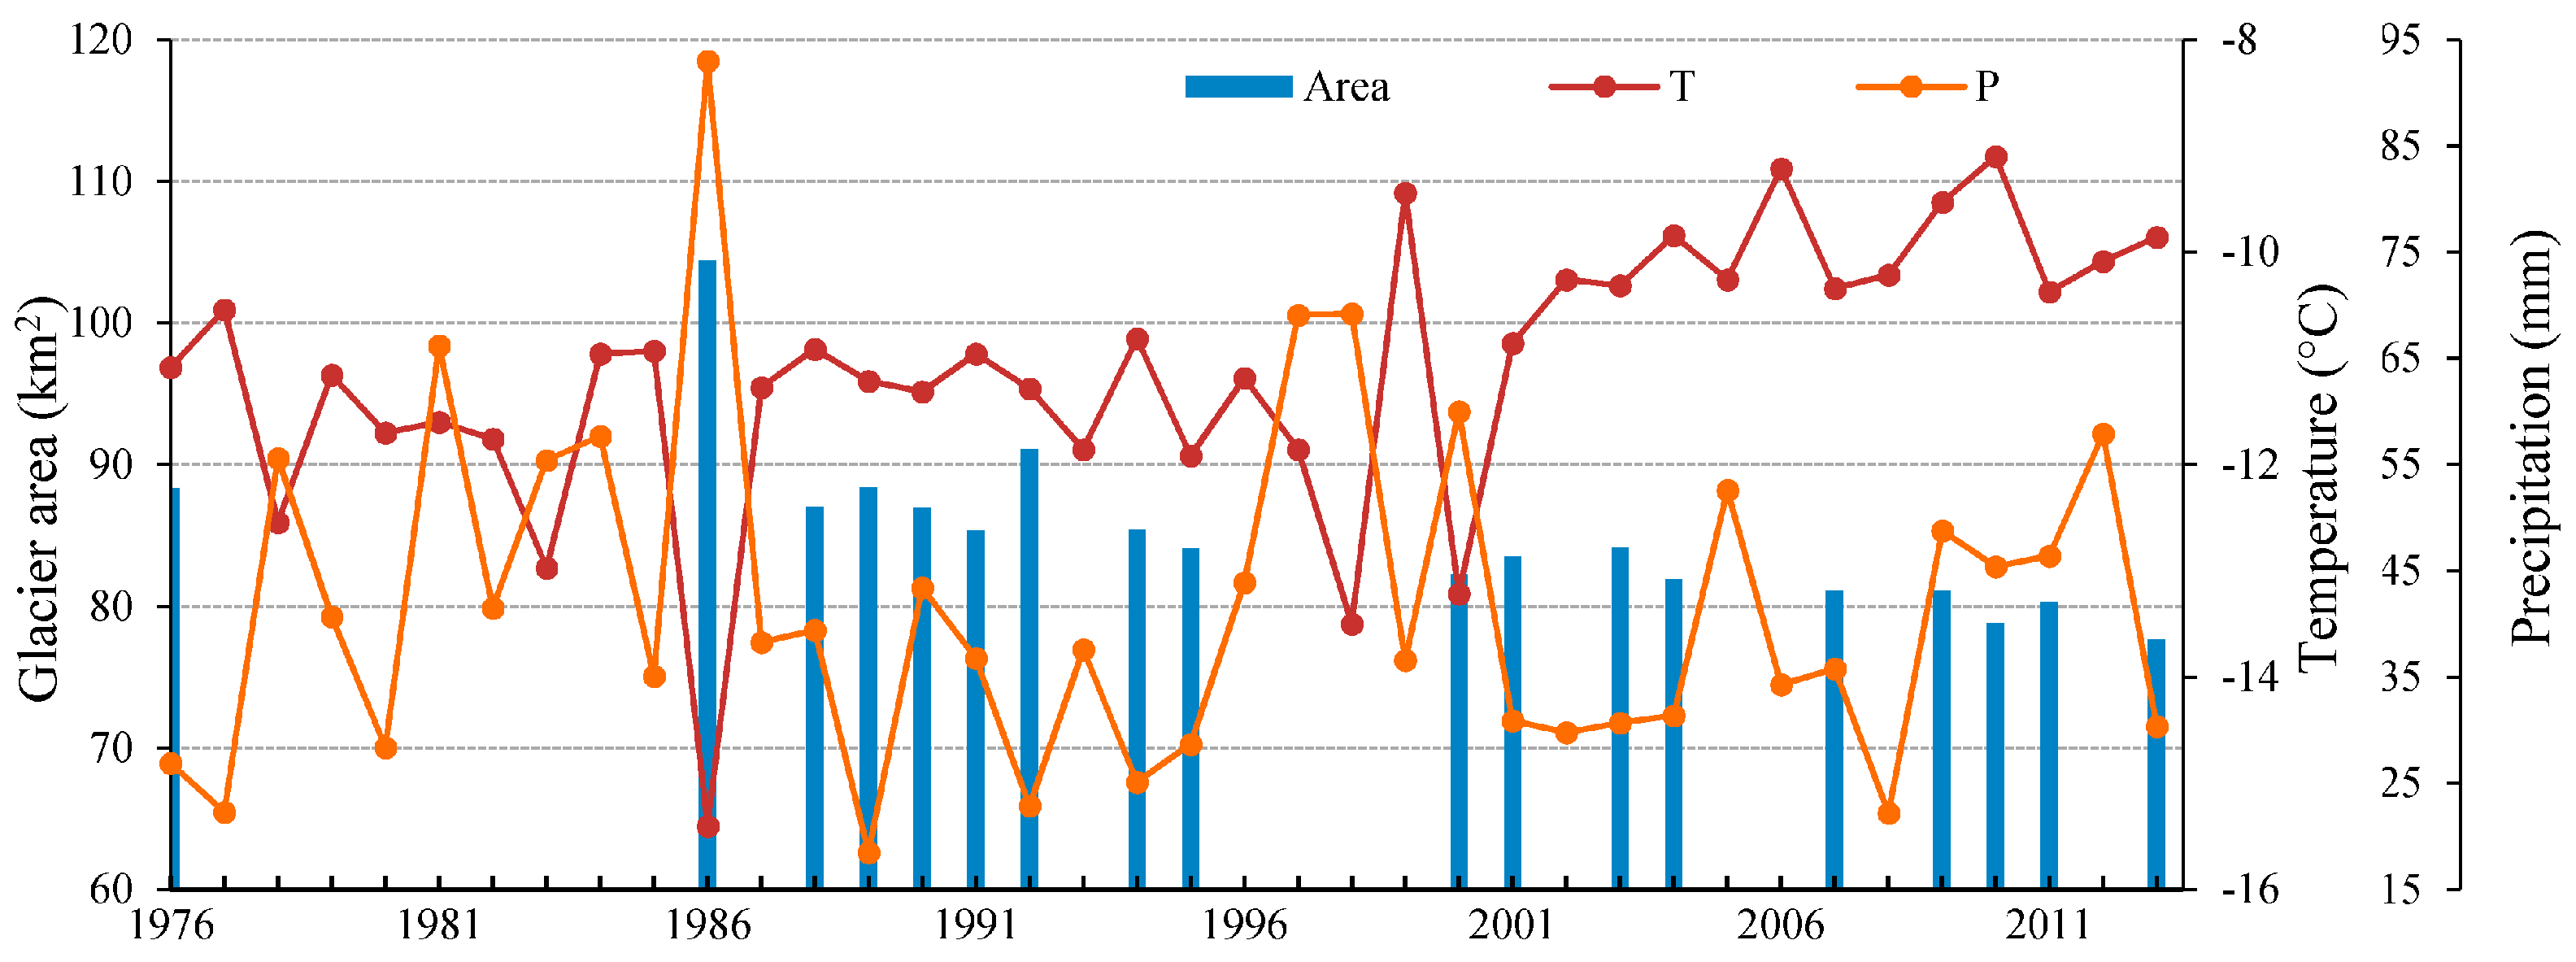
4.1. The Change of Glacier Area and Surface Elevation
4.2. Long-Term Variation of Temperature and Precipitation
4.3. Relationship between Glacier Variation and Local Climate Variables
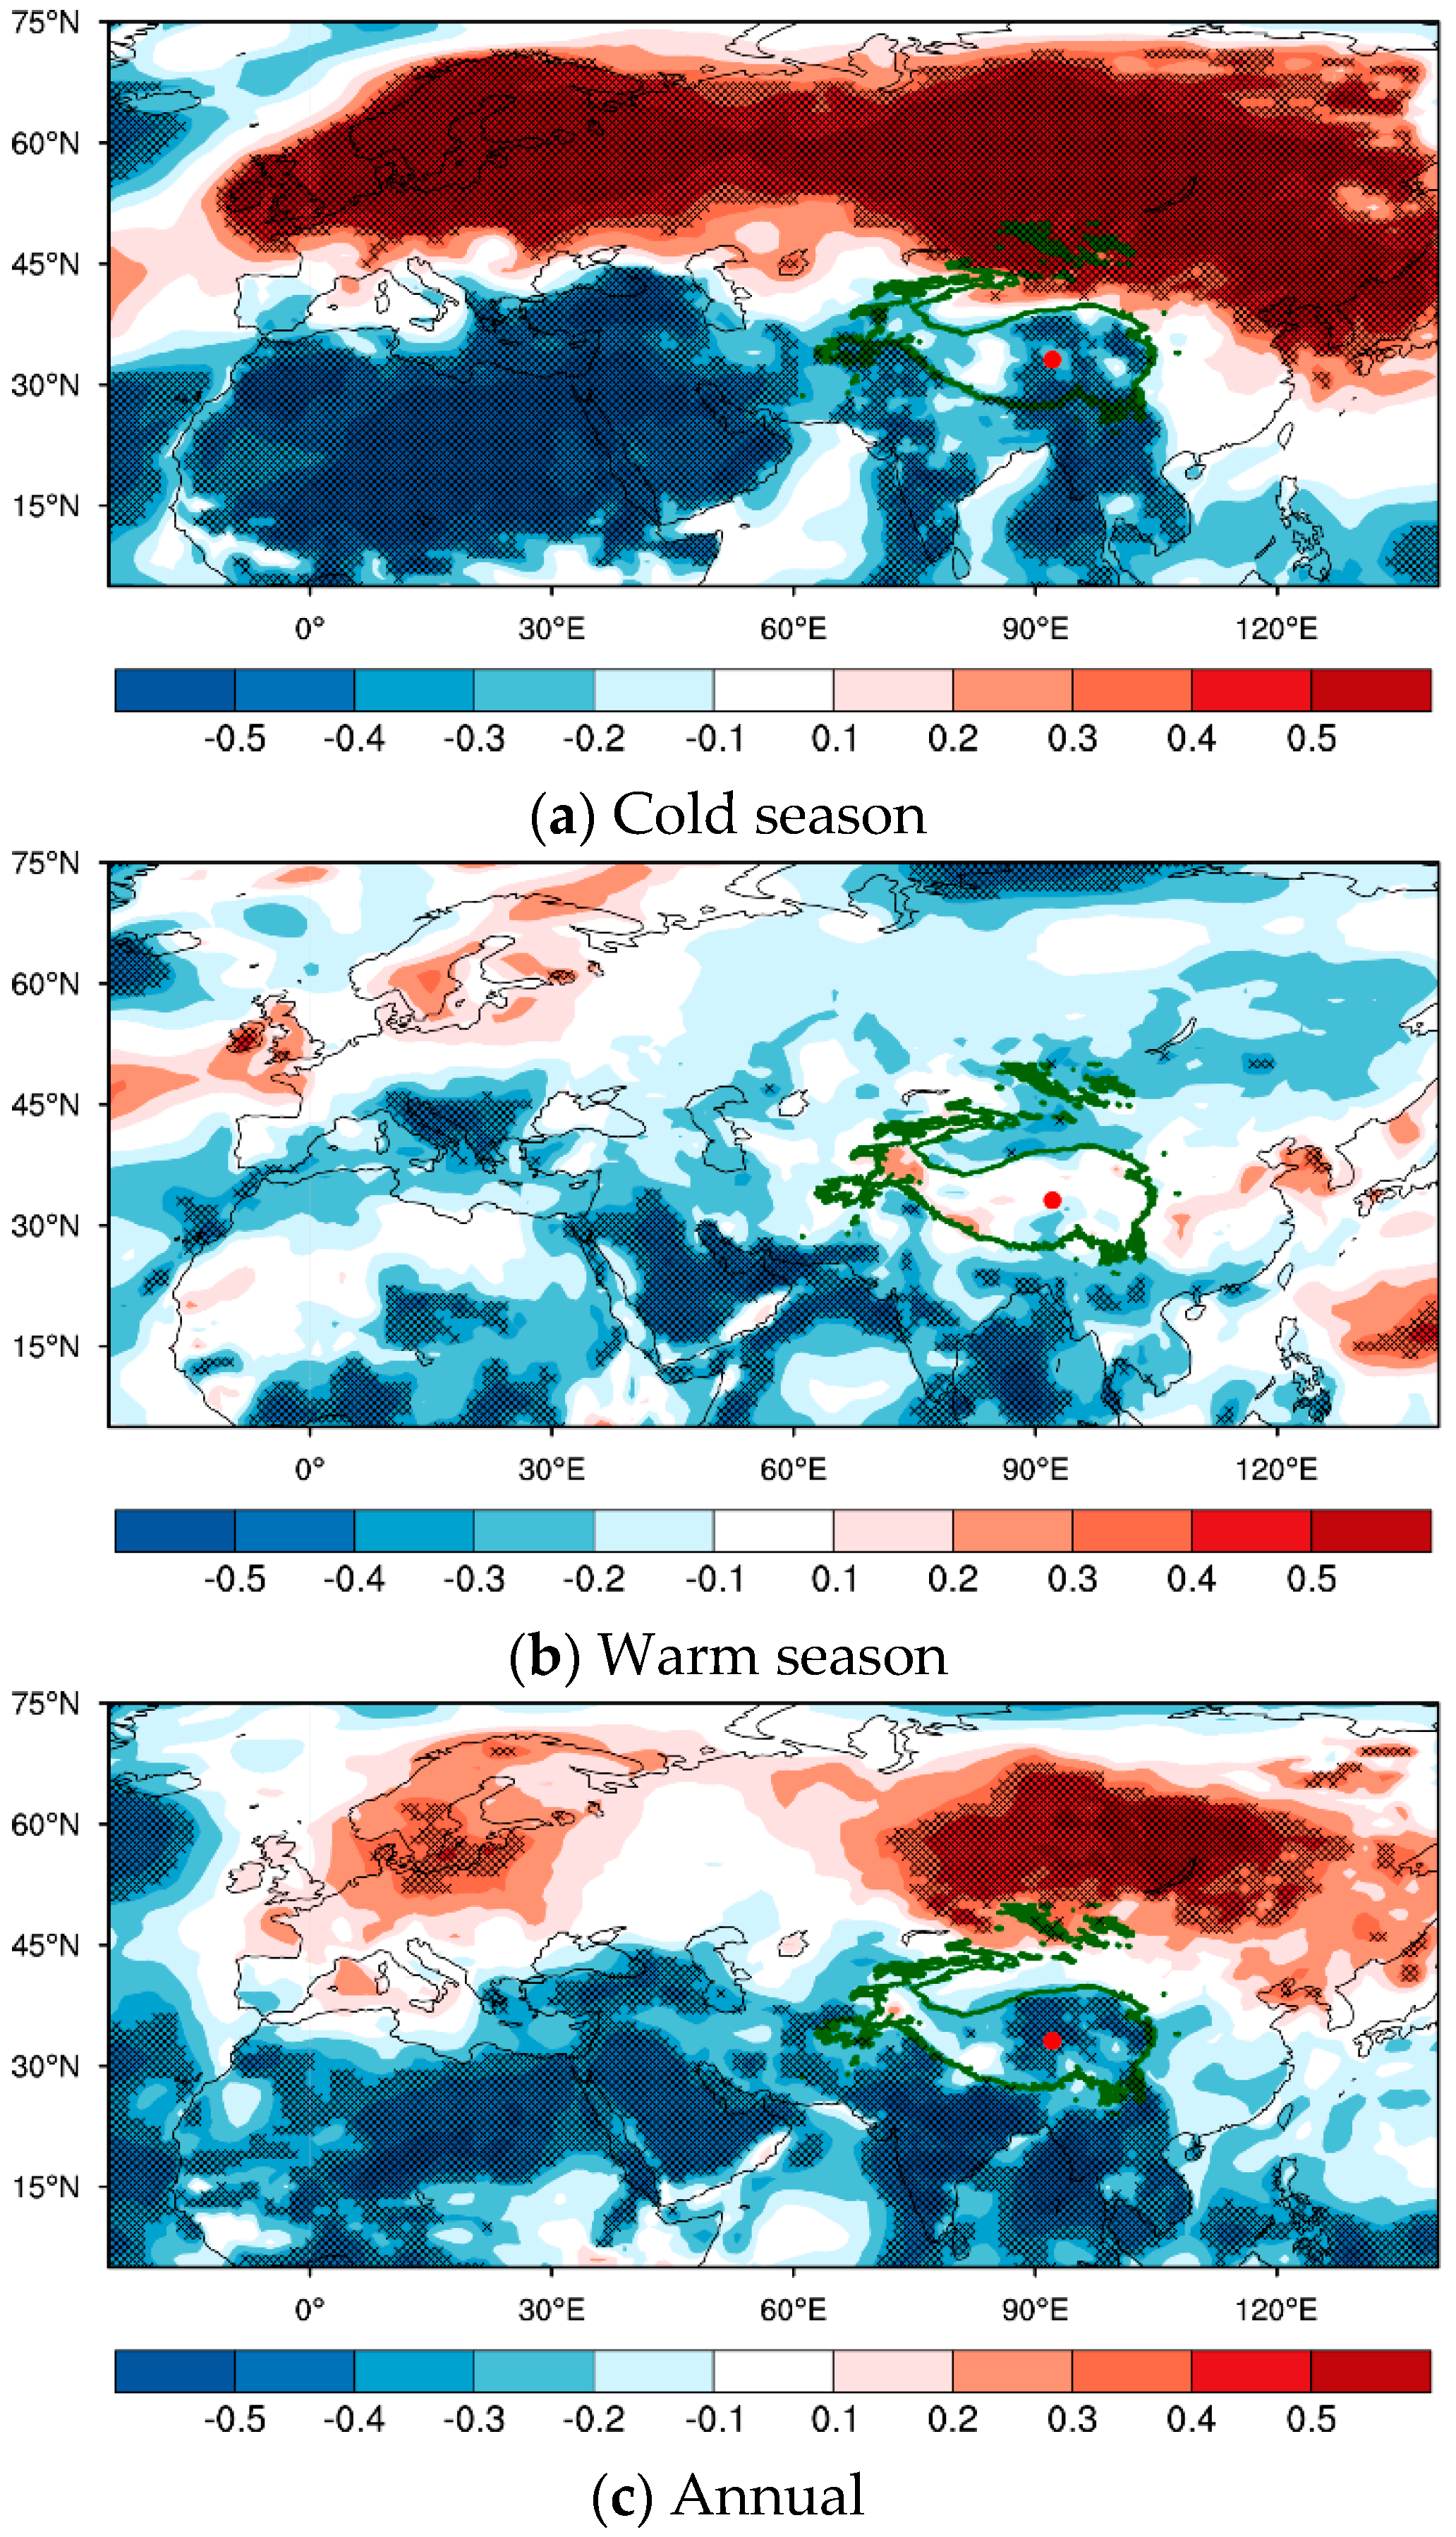
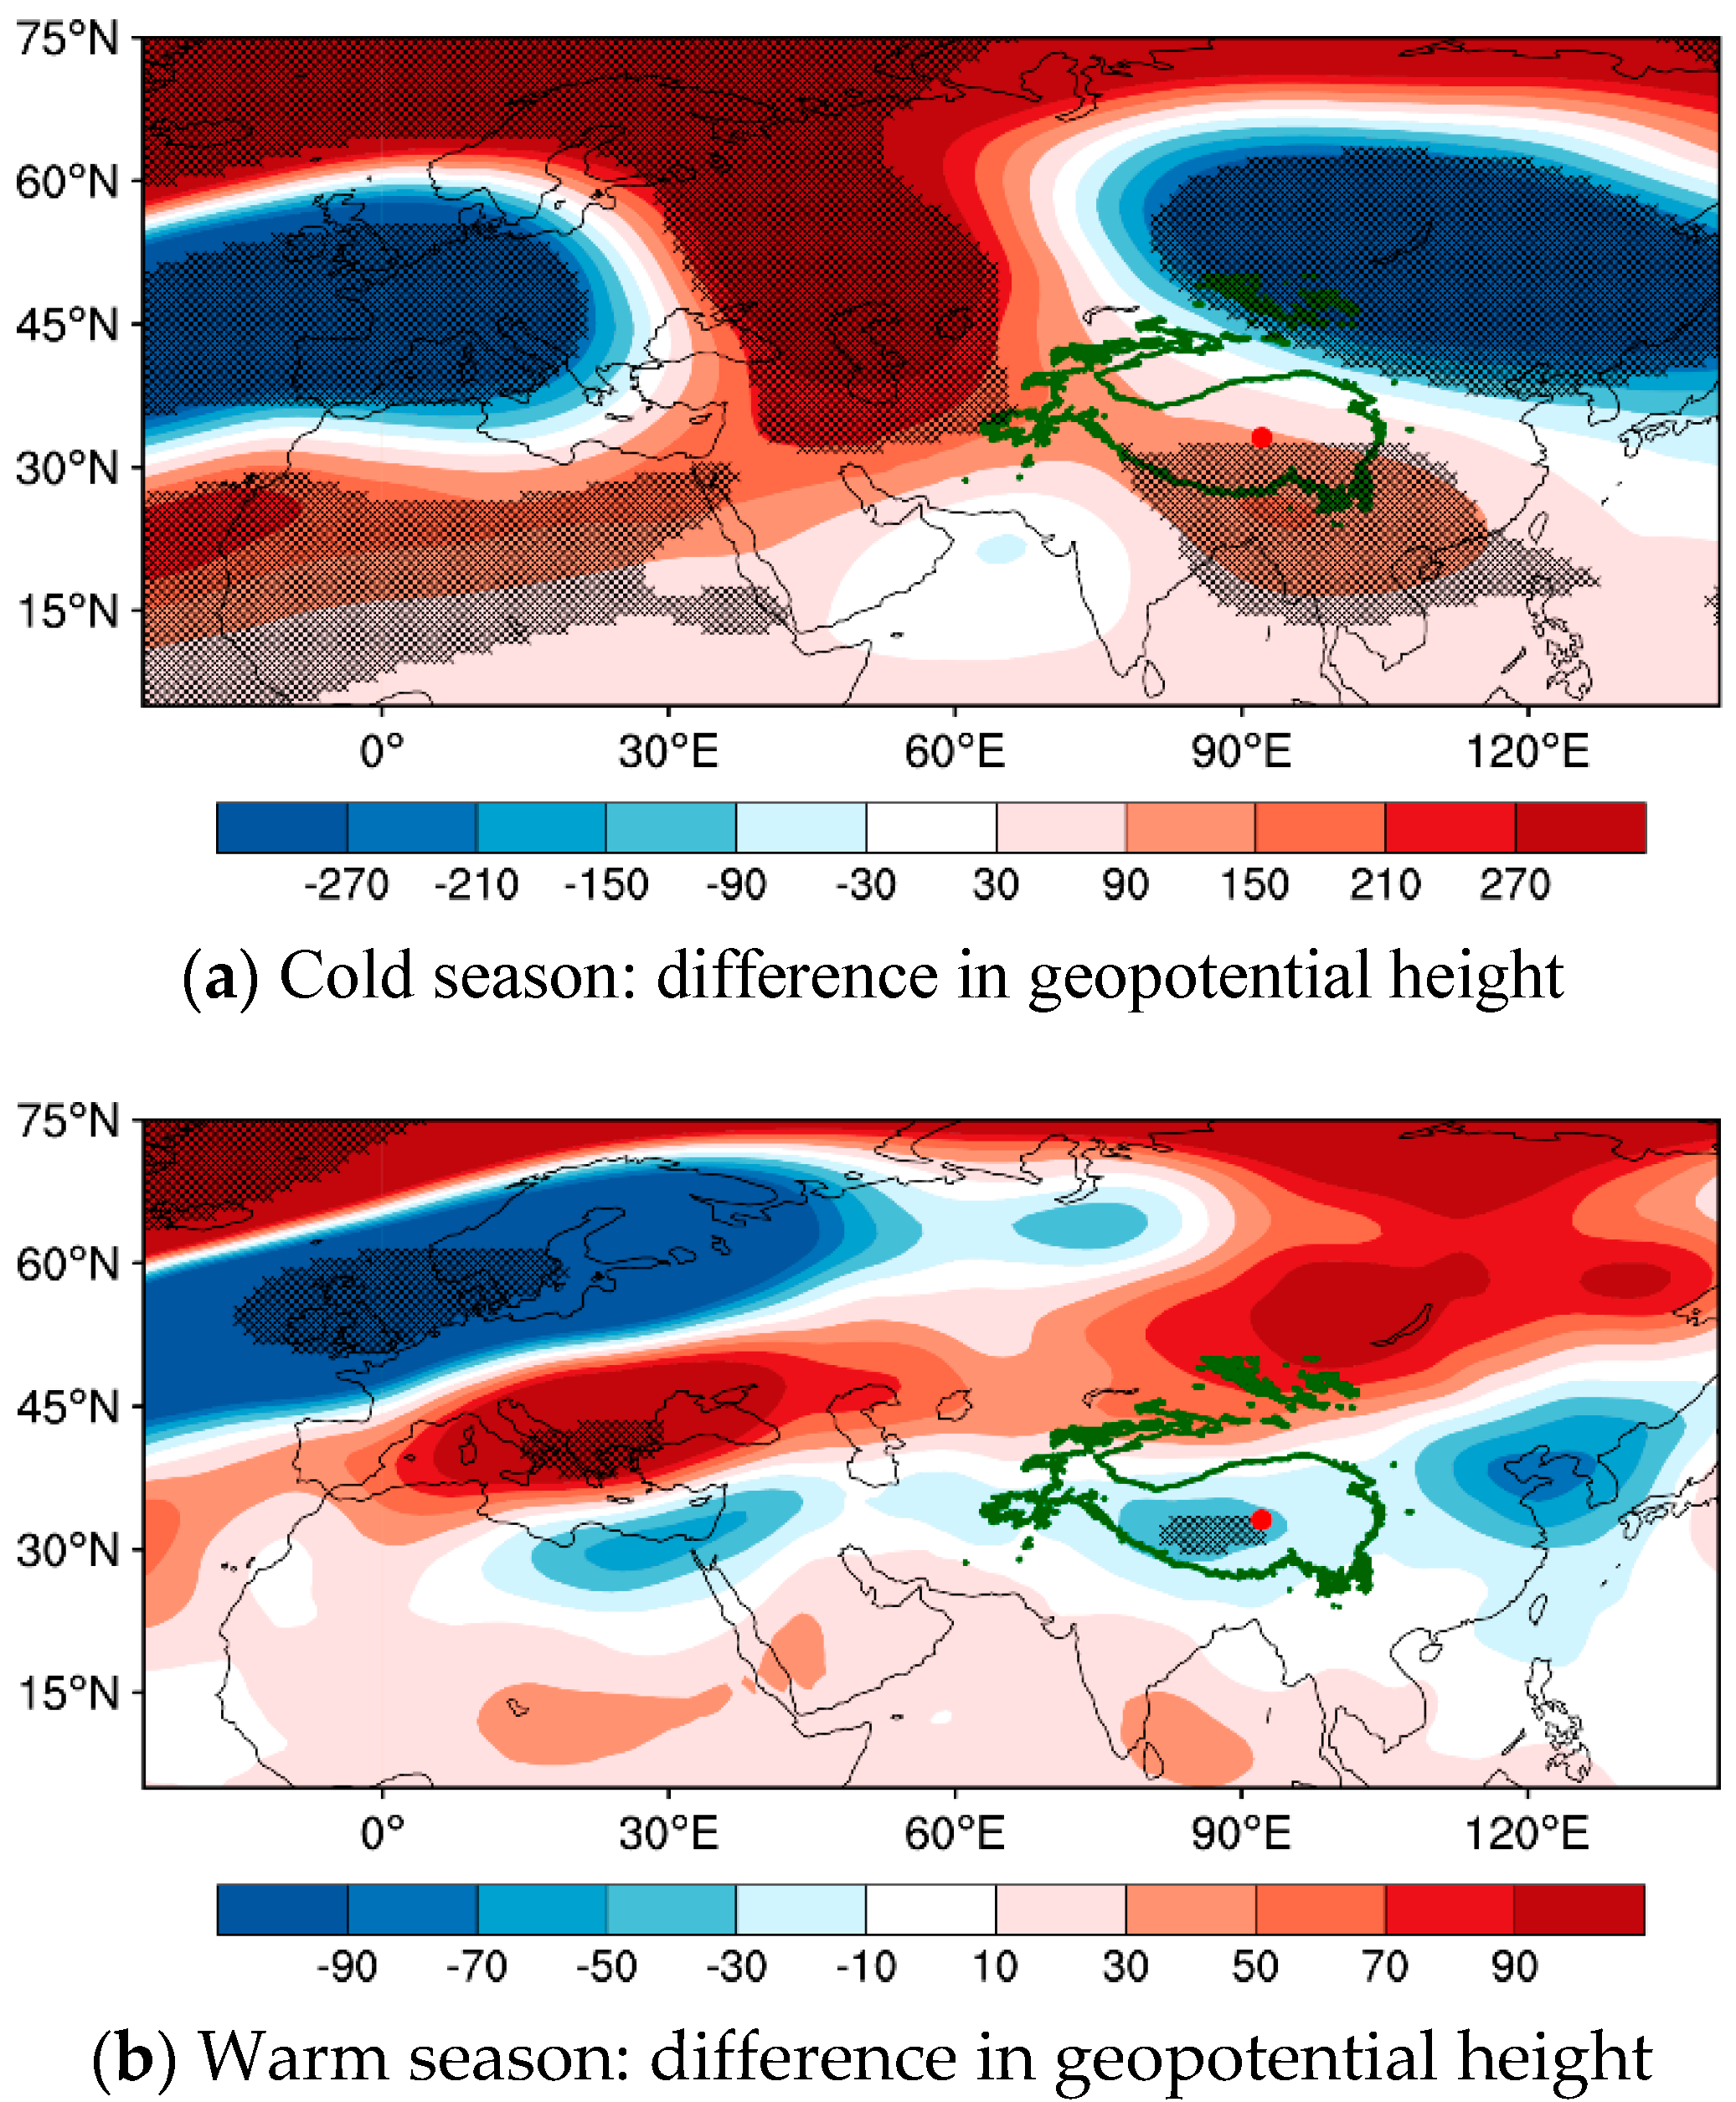
4.4. Links between Glacier Variation and Macroscale Atmospheric Circulations
4.5. The Role of SOI in Climate Variability
5. Summary and Conclusions
Supplementary Materials
Acknowledgments
Author Contributions
Conflicts of Interest
Abbreviations
| CGI | China Glacier Inventory |
| DEM | Digital Elevation Model |
| DKMD | Dongkemadi (place name) |
| EASM | East Asian Summer Monsoon |
| EASMI | East Asian Summer Monsoon Index |
| ENSO | El Niño Southern Oscillation |
| ERA | European Reanalysis |
| IM | Indian Monsoon |
| IMI | Indian Monsoon Index |
| NAM | North Annular Mode |
| NAO | North Atlantic Oscillation |
| NH | Northern Hemisphere |
| NPI | North Pacific Index |
| QTP | Qinghai-Tibet Plateau |
| SLP | Sea level pressure |
| SOI | Southern Oscillation Index |
References
- Immerzeel, W.W.; van Beek, L.P.H.; Bierkens, M.F.P. Climate change will affect the Asian water towers. Science 2010, 328, 1382–1385. [Google Scholar] [CrossRef]
- Yao, T.; Thompson, L.; Yang, W.; Yu, W.; Gao, Y.; Guo, X.; Yang, X.; Duan, K.; Zhao, H.; Xu, B.; et al. Different glacier status with atmospheric circulations in Tibetan Plateau and surroundings. Nat. Clim. Chang. 2012, 2, 663–667. [Google Scholar] [CrossRef]
- Song, C.; Sheng, Y. Contrasting evolution patterns between glacier-fed and non-glacier-fed lakes in the Tanggula Mountains and climate cause analysis. Clim. Chang. 2016, 135, 493–507. [Google Scholar] [CrossRef]
- Liu, S.; Sun, W.; Shen, Y.; Li, G. Glacier changes since the Little Ice Age maximum in the western Qilian Shan, northwest China, and consequences of glacier runoff for water supply. J. Glaciol. 2003, 49, 117–124. [Google Scholar]
- Kääb, A.; Berthier, E.; Nuth, C.; Gardelle, J.; Arnaud, Y. Contrasting patterns of early twenty-first-century glacier mass change in the Himalayas. Nature 2012, 488, 7412–7498. [Google Scholar] [CrossRef] [PubMed]
- Gardner, A.S.; Moholdt, G.; Cogley, J.G.; Wouters, B.; Arendt, A.A.; Wahr, J.; Berthier, E.; Hock, R.; Pfeffer, W.T.; Kaser, G.; et al. A reconciled estimate of glacier contributions to sea level rise: 2003 to 2009. Science 2013, 340, 852–857. [Google Scholar] [CrossRef] [PubMed] [Green Version]
- Ke, L.; Ding, X.; Song, C. Heterogeneous changes of glaciers over the western Kunlun Mountains based on ICESat and Landsat-8 derived glacier inventory. Remote Sens. Environ. 2015, 168, 13–23. [Google Scholar] [CrossRef]
- Ye, Q.; Bolch, T.; Naruse, R.; Wang, Y.; Zong, J.; Wang, Z.; Zhao, R.; Yang, D.; Kang, S. Glacier mass changes in Rongbuk catchment on Mt. Qomolangma from 1974 to 2006 based on topographic maps and ALOS PRISM data. J. Hydrol. 2015, 530, 273–280. [Google Scholar] [CrossRef]
- Yang, W.; Yao, T.; Guo, X.; Zhu, M.; Li, S.; Kattel, D.B. Mass balance of a maritime glacier on the southeast Tibetan Plateau and its climatic sensitivity. J. Geophys. Res. Atmos. 2013, 118, 9579–9594. [Google Scholar] [CrossRef]
- Tian, L.; Yao, T.; MacClune, K.; White, J.W.C.; Schilla, A.; Vaughn, B.; Vachon, R.; Ichiyanagi, K. Stable isotopic variations in west China: A consideration of moisture sources. J. Geophys. Res. Atmos. 2007, 112. [Google Scholar] [CrossRef]
- Koji, F.; Ageta, Y.; Pu, J.; Yao, T. Mass balance of Xiao Dongkemadi glacier on the central Tibetan Plateau from 1989 to 1995. Ann. Glaciol. 2000, 31, 159–163. [Google Scholar]
- Paul, F.; Barrand, N.; Baumann, S.; Berthier, E.; Bolch, T.; Casey, K.; Frey, H.; Joshi, S.; Konovalov, V.; Bris, R.L. On the accuracy of glacier outlines derived from remote-sensing data. Ann. Glaciol. 2013, 54, 171–182. [Google Scholar] [CrossRef] [Green Version]
- Redpath, T.; Sirguey, P.; Fitzsimons, S.; Kääb, A. Accuracy assessment for mapping glacier flow velocity and detecting flow dynamics from ASTER satellite imagery: Tasman Glacier, New Zealand. Remote Sens. Environ. 2013, 133, 90–101. [Google Scholar] [CrossRef]
- Bamber, J.L.; Rivera, A. A review of remote sensing methods for glacier mass balance determination. Glob. Planet. Chang. 2007, 59, 138–148. [Google Scholar] [CrossRef]
- Racoviteanu, E.A.; Williams, W.M.; Barry, G.R. Optical Remote Sensing of Glacier Characteristics: A Review with Focus on the Himalaya. Sensors 2008, 8, 3355–3383. [Google Scholar] [CrossRef] [PubMed]
- Neckel, N.; Kropácek, J.; Bolch, T.; Hochschild, V. Glacier mass changes on the Tibetan Plateau 2003–2009 derived from ICESat laser altimetry measurements. Environ. Res. Lett. 2014, 9, 014009. [Google Scholar] [CrossRef]
- Francis, J.A.; Vavrus, S.J. Evidence linking Arctic amplification to extreme weather in mid-latitudes. Geophys. Res. Lett. 2012, 39. [Google Scholar] [CrossRef]
- Screen, J.A.; Simmonds, I. Exploring links between Arctic amplification and mid-latitude weather. Geophys. Res. Lett. 2013, 40, 959–964. [Google Scholar] [CrossRef] [Green Version]
- Mölg, T.; Maussion, F.; Scherer, D. Mid-latitude westerlies as a driver of glacier variability in monsoonal High Asia. Nat. Clim. Chang. 2013, 4, 68–73. [Google Scholar] [CrossRef]
- Wang, N.L.; Thompson, L.G.; Davis, M.E.; Mosley-Thompson, E.; Yao, T.D.; Pu, J.C. Influence of variations in NAO and SO on air temperature over the northern Tibetan Plateau as recorded by δ18O in the Malan ice core. Geophys. Res. Lett. 2003, 30, 2167. [Google Scholar] [CrossRef]
- Xu, H.; Hong, Y.T.; Hong, B.; Zhu, Y.X.; Wang, Y. Influence of ENSO on multi-annual temperature variations at Hongyuan, NE Qinghai-Tibet plateau: Evidence from δ13C of spruce tree rings. Int. J. Climatol. 2010, 30, 120–126. [Google Scholar] [CrossRef]
- Xu, G.; Chen, T.; Liu, X.; Jin, L.; An, W.; Wang, W. Summer temperature variations recorded in tree-ring δ13C values on the northeastern Tibetan Plateau. Theor. Appl. Climatol. 2011, 105, 51–63. [Google Scholar] [CrossRef]
- Zhao, H.; Xu, B.; Yao, T.; Wu, G.; Lin, S.; Gao, J.; Wang, M. Deuterium excess record in a southern Tibetan ice core and its potential climatic implications. Clim. Dyn. 2012, 38, 1791–1803. [Google Scholar] [CrossRef]
- Guo, W.; Liu, S.; Xu, J.; Wu, L.; Shangguan, D.; Yao, X.; Wei, J.; Bao, W.; Yu, P.; Liu, Q. The second Chinese glacier inventory: Data, methods and results. J. Glaciol. 2015, 61, 357–372. [Google Scholar] [CrossRef]
- Chen, F.-H.; Chen, J.-H.; Holmes, J.; Boomer, I.; Austin, P.; Gates, J.B.; Wang, N.-L.; Brooks, S.J.; Zhang, J.-W. Moisture changes over the last millennium in arid central Asia: A review, synthesis and comparison with monsoon region. Quat. Sci. Rev. 2010, 29, 1055–1068. [Google Scholar] [CrossRef]
- Li, W.; Guo, W.; Hsu, P.-C.; Xue, Y. Influence of the Madden–Julian oscillation on Tibetan Plateau snow cover at the intraseasonal time-scale. Sci. Rep. 2016, 6. [Google Scholar] [CrossRef] [PubMed]
- Pu, J.; Yao, T.; Yang, M.; Tian, L.; Wang, N.; Ageta, Y.; Koji, F. Rapid decrease of mass balance observed in the Xiao (Lesser) Dongkemadi Glacier, in the central Tibetan Plateau. Hydrol. Process. 2008, 22, 2953–2958. [Google Scholar] [CrossRef]
- Hall, D.K.; Riggs, G.A.; Salomonson, V.V. Development of methods for mapping global snow cover using moderate resolution imaging spectroradiometer data. Remote Sens. Environ. 1995, 54, 127–140. [Google Scholar] [CrossRef]
- Memarsadeghi, N.; Mount, D.M.; Netanyahu, N.S.; Le Moigne, J. A fast implementation of the ISODATA clustering algorithm. Int. J. Comput. Geom. Appl. 2007, 17, 71–103. [Google Scholar] [CrossRef]
- Paul, F.; Bolch, T.; Kääb, A.; Nagler, T.; Nuth, C.; Scharrer, K.; Shepherd, A.; Strozzi, T.; Ticconi, F.; Bhambri, R.; et al. The glaciers climate change initiative: Methods for creating glacier area, elevation change and velocity products. Remote Sens. Environ. 2015, 162, 408–426. [Google Scholar] [CrossRef]
- Paul, F.; Kaab, A.; Maisch, M.; Kellenberger, T.; Haeberli, W. The new remote-sensing-derived Swiss glacier inventory: I. Methods. Ann. Glaciol. 2002, 34, 355–361. [Google Scholar] [CrossRef] [Green Version]
- Pieczonka, T.; Bolch, T. Region-wide glacier mass budgets and area changes for the Central Tien Shan between ~1975 and 1999 using Hexagon KH-9 imagery. Glob. Planet. Chang. 2015, 128, 1–13. [Google Scholar] [CrossRef]
- Zwally, H.J.; Schutz, B.; Abdalati, W.; Abshire, J.; Bentley, C.; Brenner, A.; Bufton, J.; Dezio, J.; Hancock, D.; Harding, D.; et al. ICESat’s laser measurements of polar ice, atmosphere, ocean, and land. J. Geodyn. 2002, 34, 405–445. [Google Scholar] [CrossRef]
- Ke, L.; Ding, X.; Song, C. Estimation of mass balance of Dongkemadi glaciers with multiple methods based on multi-mission satellite data. Quat. Int. 2015, 371, 58–66. [Google Scholar] [CrossRef]
- Wu, J.; Gao, X. A gridded daily observation dataset over China region and comparison with the other datasets. Chin. J. Geophys. 2013, 56, 1102–1111. [Google Scholar]
- New, M.; Hulme, M.; Jones, P. Representing twentieth-century space-time climate variability. Part II: Development of 1901–1996 monthly grids of terrestrial surface climate. J. Clim. 2000, 13, 2217–2238. [Google Scholar] [CrossRef]
- You, Q.; Min, J.; Zhang, W.; Pepin, N.; Kang, S. Comparison of multiple datasets with gridded precipitation observations over the Tibetan Plateau. Clim. Dyn 2015, 45, 791–806. [Google Scholar] [CrossRef] [Green Version]
- Shen, Y.; Xiong, A. Validation and comparison of a new gauge-based precipitation analysis over mainland China. Int. J. Climatol. 2016, 36, 252–265. [Google Scholar] [CrossRef]
- Zhou, B.; Xu, Y.; Wu, J.; Dong, S.; Shi, Y. Changes in temperature and precipitation extreme indices over China: Analysis of a high-resolution grid dataset. Int. J. Climatol. 2015. [Google Scholar] [CrossRef]
- Dee, D.; Uppala, S.; Simmons, A.; Berrisford, P.; Poli, P.; Kobayashi, S.; Andrae, U.; Balmaseda, M.; Balsamo, G.; Bauer, P. The ERA-Interim reanalysis: Configuration and performance of the data assimilation system. Q. J. R. Meteorol. Soc. 2011, 137, 553–597. [Google Scholar] [CrossRef]
- Hurrell, J.W. Decadal trends in the North Atlantic Oscillation: Regional temperatures and precipitation. Science 1995, 269, 676–679. [Google Scholar] [CrossRef] [PubMed]
- Wang, B.; Wu, R.; Lau, K.M. Interannual variability of the Asian summer monsoon: Contrasts between the Indian and the Western North Pacific-East Asian Monsoons*. J. Clim. 2001, 14, 4073–4090. [Google Scholar] [CrossRef]
- Li, J.; Zeng, Q. A unified monsoon index. Geophys. Res. Lett. 2002, 29, 1274. [Google Scholar] [CrossRef]
- Trenberth, K.E.; Hurrell, J.W. Decadal atmosphere-ocean variations in the Pacific. Clim. Dyn. 1994, 9, 303–319. [Google Scholar] [CrossRef]
- Siegfried, M.R.; Hawley, R.L.; Burkhart, J.F. High-resolution ground-based GPS measurements show intercampaign bias in ICESat elevation data near Summit, Greenland. IEEE Trans. Geosci. Remote Sens. 2011, 49, 3393–3400. [Google Scholar] [CrossRef]
- Hansen, J.; Ruedy, R.; Sato, M.; Lo, K. Global surface temperature change. Rev. Geophys. 2010, 48. [Google Scholar] [CrossRef]
- Tang, M.; Cheng, G.; Lin, Z. Contemporary Climatic Variations over Qinghai-Xizang (Tibetan) Plateau and Their Influences on Environments; Guangdong Science and Technology Press: Guangzhou, China, 1998. [Google Scholar]
- Yang, W.; Guo, X.; Yao, T.; Zhu, M.; Wang, Y. Recent accelerating mass loss of southeast Tibetan glaciers and the relationship with changes in macroscale atmospheric circulations. Clim. Dyn. 2016, 47, 805–815. [Google Scholar] [CrossRef]
- Song, C.; Ke, L.; Huang, B.; Richards, K.S. Can mountain glacier melting explains the GRACE-observed mass loss in the southeast Tibetan Plateau: From a climate perspective? Glob. Planet. Chang. 2015, 124, 1–9. [Google Scholar] [CrossRef]
- Chang, C.P.; Harr, P.; Ju, J. Possible roles of Atlantic circulations on the weakening Indian monsoon rainfall-ENSO relationship. J. Clim. 2001, 14, 2376–2380. [Google Scholar] [CrossRef]
- Goswami, B.N.; Madhusoodanan, M.S.; Neema, C.P.; Sengupta, D. A physical mechanism for North Atlantic SST influence on the Indian summer monsoon. Geophys. Res. Lett. 2006. [Google Scholar] [CrossRef]
- Li, J.; Wu, Z.; Jiang, Z.; He, J. Can global warming strengthen the East Asian summer monsoon? J. Clim. 2010, 23, 6696–6705. [Google Scholar] [CrossRef]
- Castro-Díez, Y.; Pozo-Vázquez, D.; Rodrigo, F.; Esteban-Parra, M. NAO and winter temperature variability in southern Eurotablepe. Geophys. Res. Lett. 2002, 29. [Google Scholar] [CrossRef]
- Lim, Y.-K. The East Atlantic/West Russia (EA/WR) teleconnection in the North Atlantic: Climate impact and relation to Rossby wave propagation. Clim. Dyn. 2015, 44, 3211–3222. [Google Scholar] [CrossRef]
- Thompson, D.W.J.; Wallace, J.M. Regional climate impacts of the Northern hemisphere annular mode. Science 2001, 293, 85–89. [Google Scholar] [CrossRef] [PubMed]
- Yin, Z.Y.; Lin, Z.; Zhao, X. Temperature anomalies in central and eastern Tibetan Plateau in relation to general circulation patterns during 1951–1993. Int. J. Climatol. 2000, 20, 1431–1449. [Google Scholar] [CrossRef]
- Shaman, J.; Tziperman, E. The effect of ENSO on Tibetan Plateau snow depth: A stationary wave teleconnection mechanism and implications for the South Asian monsoons. J. Clim. 2005, 18, 2067–2079. [Google Scholar] [CrossRef]


| Sensor | Acquisition Date (YYYY/MM/DD) | Path/Row | Used Bands |
|---|---|---|---|
| Landsat 2/MSS | 1976/11/11 | 148/37 | 4, 5, 6, 7 |
| Landsat 5/TM | 1986/07/30 | 138/37 | 2, 4, 5 |
| Landsat 5/TM | 1988/07/28 | 137/37 | 2, 4, 5 |
| Landsat 5/TM | 1989/09/17 | 137/37 | 2, 4, 5 |
| Landsat 5/TM | 1990/08/19 | 137/37 | 2, 4, 5 |
| Landsat 5/TM | 1991/09/14 | 138/37 | 2, 4, 5 |
| Landsat 5/TM | 1992/08/31 | 138/37 | 2, 4, 5 |
| Landsat 5/TM | 1994/08/21 | 138/37 | 2, 4, 5 |
| Landsat 5/TM | 1995/08/17 | 137/37 | 2, 4, 5 |
| Landsat 5/TM | 2000/08/30 | 137/37 | 2, 4, 5 |
| Landsat 5/TM | 2001/07/23 • | 138/37 | 2, 4, 5 |
| Landsat 7/ETM+ | 2001/10/12 * | 137/37 | 2, 4, 5 |
| Landsat 5/TM | 2003/08/07 • | 137/37 | 2, 4, 5 |
| Landsat 5/TM | 2003/10/17* | 138/37 | 2, 4, 5 |
| Landsat 5/TM | 2004/09/10 | 137/37 | 2, 4, 5 |
| Landsat 5/TM | 2007/08/02 | 137/37 | 2, 4, 5 |
| Landsat 5/TM | 2009/08/30 | 138/37 | 2, 4, 5 |
| Landsat 5/TM | 2010/09/02 • | 138/37 | 2, 4, 5 |
| Landsat 5/TM | 2010/10/20 * | 138/37 | 2, 4, 5 |
| Landsat 5/TM | 2011/08/29 | 137/37 | 2, 4, 5 |
| Landsat 8/OLI | 2013/08/02 | 137/37 | 3, 5, 6 |
| Climate Parameters and Season | Group I: All Cases (n = 18) | Group II: Normal Cases (Excluding 1986, 2000) | ||
|---|---|---|---|---|
| Correlation Coefficient | p-Value | Correlation Coefficient | p-Value | |
| Temperature | ||||
| -Annual | −0.78 | 0.00 | −0.85 | 0.00 |
| -Summer | −0.75 | 0.00 | −0.72 | 0.00 |
| -Winter | −0.71 | 0.00 | −0.76 | 0.00 |
| Precipitation | ||||
| -Annual | −0.65 | 0.00 | −0.64 | 0.01 |
| -Summer | −0.61 | 0.01 | −0.53 | 0.04 |
| -Winter | −0.34 | 0.17 | −0.57 | 0.02 |
| North Atlantic Oscillation | ||||
| -Annual | 0.67 | 0.00 | 0.65 | 0.01 |
| -Summer | 0.49 | 0.04 | 0.48 | 0.06 |
| -Winter | 0.57 | 0.01 | 0.74 | 0.00 |
| Southern Oscillation Index | ||||
| -Annual | −0.45 | 0.06 | −0.38 | 0.15 |
| -Summer | −0.34 | 0.17 | −0.32 | 0.24 |
| -Winter | −0.09 | 0.71 | −0.11 | 0.68 |
| North Annular Mode | −0.47 | 0.05 | −0.69 | 0.00 |
| North Pacific Index | −0.20 | 0.43 | −0.05 | 0.86 |
| Indian Monsoon Index | 0.44 | 0.07 | 0.59 | 0.02 |
| East Asian Summer Monsoon Index | 0.20 | 0.44 | 0.17 | 0.54 |
| Temperature | Precipitation | NAO | SOI | NAM | NPI | IM | EASMI | |||||||||
|---|---|---|---|---|---|---|---|---|---|---|---|---|---|---|---|---|
| Ann. | Sum. | Win. | Ann. | Sum. | Win. | Ann. | Sum. | Win. | Ann. | Sum. | Win. | |||||
| Temperature | ||||||||||||||||
| -Ann. | 1.00 | |||||||||||||||
| -Sum. | 0.48 | 1.00 | ||||||||||||||
| -Win. | 0.93 | 0.21 | 1.00 | |||||||||||||
| Precipitation | ||||||||||||||||
| -Ann. | −0.07 | −0.17 | −0.04 | 1.00 | ||||||||||||
| -Sum. | 0.01 | −0.21 | 0.06 | 0.97 | 1.00 | |||||||||||
| -Win. | −0.19 | 0.13 | −0.28 | 0.04 | −0.14 | 1.00 | ||||||||||
| North Atlantic Oscillation | ||||||||||||||||
| -Ann. | −0.24 | −0.34 | −0.15 | −0.09 | −0.06 | −0.22 | 1.00 | |||||||||
| -Sum. | 0.17 | 0.19 | 0.11 | −0.40 | −0.38 | −0.14 | 0.23 | 1.00 | ||||||||
| -Win. | −0.32 | −0.18 | −0.34 | −0.06 | −0.02 | −0.10 | 0.60 | 0.15 | 1.00 | |||||||
| Southern Oscillation Index | ||||||||||||||||
| -Ann. | 0.32 | −0.04 | 0.33 | 0.23 | 0.27 | −0.10 | −0.06 | −0.01 | −0.19 | 1.00 | ||||||
| -Sum. | 0.01 | 0.27 | −0.09 | 0.12 | 0.10 | 0.23 | −0.21 | 0.11 | −0.17 | 0.45 | 1.00 | |||||
| -Win. | 0.27 | −0.21 | 0.35 | 0.25 | 0.28 | −0.18 | 0.11 | −0.07 | −0.09 | 0.85 | −0.03 | 1.00 | ||||
| NAM | 0.36 | 0.26 | 0.34 | −0.02 | −0.07 | 0.16 | −0.66 | −0.08 | −0.95 | 0.20 | 0.23 | 0.06 | 1.00 | |||
| NPI | 0.30 | 0.06 | 0.25 | 0.09 | 0.13 | −0.21 | 0.35 | 0.06 | 0.16 | 0.46 | −0.17 | 0.56 | −0.23 | 1.00 | ||
| IMI | −0.17 | 0.02 | −0.15 | −0.20 | −0.19 | −0.27 | 0.18 | 0.37 | −0.12 | −0.24 | 0.05 | −0.31 | 0.15 | −0.18 | 1.00 | |
| EASMI | 0.21 | −0.10 | 0.24 | −0.10 | −0.10 | 0.18 | 0.18 | 0.09 | 0.14 | 0.05 | −0.45 | 0.32 | −0.15 | 0.31 | −0.22 | 1.00 |
| Season | Low NAO Years | High NAO Years |
|---|---|---|
| Cold season | 1996, 2001, 2006, 2010, 2013 | 1989, 1990, 1992, 1993, 2000, 2012 |
| Warm season | 1987, 1993, 2007, 2008, 2009, 2011, 2012 | 1983, 1989, 1994, 1996, 2013 |
© 2017 by the authors. Licensee MDPI, Basel, Switzerland. This article is an open access article distributed under the terms and conditions of the Creative Commons Attribution (CC BY) license ( http://creativecommons.org/licenses/by/4.0/).
Share and Cite
Ke, L.; Ding, X.; Li, W.; Qiu, B. Remote Sensing of Glacier Change in the Central Qinghai-Tibet Plateau and the Relationship with Changing Climate. Remote Sens. 2017, 9, 114. https://doi.org/10.3390/rs9020114
Ke L, Ding X, Li W, Qiu B. Remote Sensing of Glacier Change in the Central Qinghai-Tibet Plateau and the Relationship with Changing Climate. Remote Sensing. 2017; 9(2):114. https://doi.org/10.3390/rs9020114
Chicago/Turabian StyleKe, Linghong, Xiaoli Ding, Wenkai Li, and Bo Qiu. 2017. "Remote Sensing of Glacier Change in the Central Qinghai-Tibet Plateau and the Relationship with Changing Climate" Remote Sensing 9, no. 2: 114. https://doi.org/10.3390/rs9020114