Article

Adjustment of Sentinel-2 Multi-Spectral Instrument (MSI) Red-Edge Band Reflectance to Nadir BRDF Adjusted Reflectance (NBAR) and Quantification of Red-Edge Band BRDF Effects

Geospatial Sciences Center of Excellence, South Dakota State University, Brookings, SD 57007, USA
*
Author to whom correspondence should be addressed.
Remote Sens. 2017, 9(12), 1325; https://doi.org/10.3390/rs9121325
Submission received: 10 November 2017 / Revised: 7 December 2017 / Accepted: 13 December 2017 / Published: 16 December 2017

Abstract

:
Optical wavelength satellite data have directional reflectance effects over non-Lambertian surfaces, described by the bidirectional reflectance distribution function (BRDF). The Sentinel-2 multi-spectral instrument (MSI) acquires data over a 20.6° field of view that have been shown to have non-negligible BRDF effects in the visible, near-infrared, and short wave infrared bands. MSI red-edge BRDF effects have not been investigated. In this study, they are quantified by an examination of 6.6 million (January 2016) and 10.7 million (April 2016) pairs of forward and back scatter reflectance observations extracted over approximately 20° × 10° of southern Africa. Non-negligible MSI red-edge BRDF effects up to 0.08 (reflectance units) across the 290 km wide MSI swath are documented. A recently published MODIS BRDF parameter c-factor approach to adjust MSI visible, near-infrared, and short wave infrared reflectance to nadir BRDF-adjusted reflectance (NBAR) is adapted for application to the MSI red-edge bands. The red-edge band BRDF parameters needed to implement the algorithm are provided. The parameters are derived by a linear wavelength interpolation of fixed global MODIS red and NIR BRDF model parameters. The efficacy of the interpolation is investigated using POLDER red, red-edge, and NIR BRDF model parameters, and is shown to be appropriate for the c-factor NBAR generation approach. After adjustment to NBAR, red-edge MSI BRDF effects were reduced for the January data (acquired close to the solar principal where BRDF effects are maximal) and the April data (acquired close to the orthogonal plane) for all the MSI red-edge bands.

Graphical Abstract

1. Introduction

The Sentinel-2A and Sentinel-2B satellites carry the Multi Spectral Instrument (MSI) that sense medium-resolution multi-spectral data designed for global land surface monitoring [1]. Combined, the Sentinel-2A and -2B systems have a global median average revisit interval of five days [2]. The MSI has 13 spectral bands ranging from the visible to the shortwave infrared (0.433 μm to 2.19 μm) with four 10 m visible and near-infrared bands, six 20 m red-edge, near-infrared (NIR), and short wave infrared bands, and three 60 m bands [1]. The MSI red-edge bands are centered at 705 nm, 740 nm, and 783 nm, and are not present on the MSI heritage Landsat and Satellite Pour l’Observation de la Terre (SPOT) sensors. The red-edge encompasses the rapid change in vegetation reflectance from the red to the near infrared and is of interest for studies of chlorophyll and nitrogen content [3,4,5], leaf area index [6,7,8], and vegetation stress [9], and also may be useful for certain classification applications such as for burned area mapping [10,11].
The Sentinel-2A and -2B MSI remote sensing systems are in sun-synchronous polar orbits and acquire images over a 20.6° field of view that results in directional reflectance effects over non-Lambertian surfaces. These effects, often described by the bidirectional reflectance distribution function (BRDF), can be non-trivial. In a recent study of 17 million pairs of forward and back scatter reflectance observations, pronounced visible, near-infrared, and short wave infrared BRDF effects were documented across the 290 km wide MSI swath [12]. In this study, MSI red-edge BRDF effects are quantified using the same data that were extracted over 20° × 10° of southern Africa for two 10 day periods in January 2016 (acquired close to the solar principal plane when BRDF effects are maximal) and in April 2016 (acquired close to the orthogonal plane when BRDF effects are minimal).
The nadir BRDF-adjusted reflectance (NBAR), i.e., the reflectance at nadir (0° view zenith) for a specified solar zenith, nominally has no BRDF effects and therefore is well suited for applications that require consistent reflectance in space and time. The Moderate Resolution Imaging Spectral radiometer (MODIS) NBAR product is generated systematically on a global basis using BRDF model parameters that are derived by inversion against 16 days of MODIS observations [13]. This approach will not work for Sentinel-2 MSI data because there are insufficient cloud-free MSI observations available every 16 days for BRDF model inversion [12] and over longer periods the surface usually changes, precluding reliable BRDF model parameter estimations [14,15]. Recently, an empirical c-factor approach was published to adjust Landsat reflectance to NBAR [16]. The approach is based on multiplying the reflectance by the ratio of the reflectance modeled using MODIS BRDF spectral model parameters for the Landsat observed view zenith and for a nadir view. Global fixed BRDF model parameters were used and were defined by averaging, for each MODIS reflective wavelength band, the MODIS 500 m BRDF product (MCD43A1) spectral model parameters [13] over the entire global land surface for 12 months [16]. It was developed based on observations that BRDF shapes are sufficiently similar over the Landsat 15° field of view that a single global fixed set of MODIS BRDF spectral model parameters can be used regardless of the land cover or condition [16]. Consequently, Landsat NBAR can be derived using the c-factor approach for all the Landsat global long-term records and prior to the year 2000 availability of the MODIS BRDF product. The approach was subsequently demonstrated and used to correct Sentinel-2 MSI 10 m blue (490 nm), green (560 nm), red (665 nm), and near-infrared (NIR) (842 nm), in addition to the MSI 20 m short wave infrared (SWIR) (1610 nm and 2190 nm), reflectance to NBAR [12]. The three MSI 20 m red-edge bands were not considered because there are no equivalent red-edge MODIS BRDF spectral model parameters.
In this study, the c-factor approach is applied to the three MSI red-edge bands and used to adjust the red-edge reflectance to NBAR. MSI 705 nm, 740 nm, and 783 nm red-edge BRDF parameters are derived by linear wavelength-based interpolation of the red (645 nm) and NIR (858 nm) fixed global MODIS BRDF spectral model parameters. The efficacy of the interpolation is investigated by comparison with Polarization and Directionality of the Earth’s Reflectances (POLDER) red, red-edge and NIR BRDF spectral model parameters derived from a recently available POLDER BRDF database [17]. The c-factor NBAR approach is demonstrated considering the same MSI data used in [12] and the view zenith variation in MSI red-edge reflectance quantified before (surface reflectance) and after BRDF correction (NBAR) are compared. The paper concludes with a discussion and implications of the study findings.
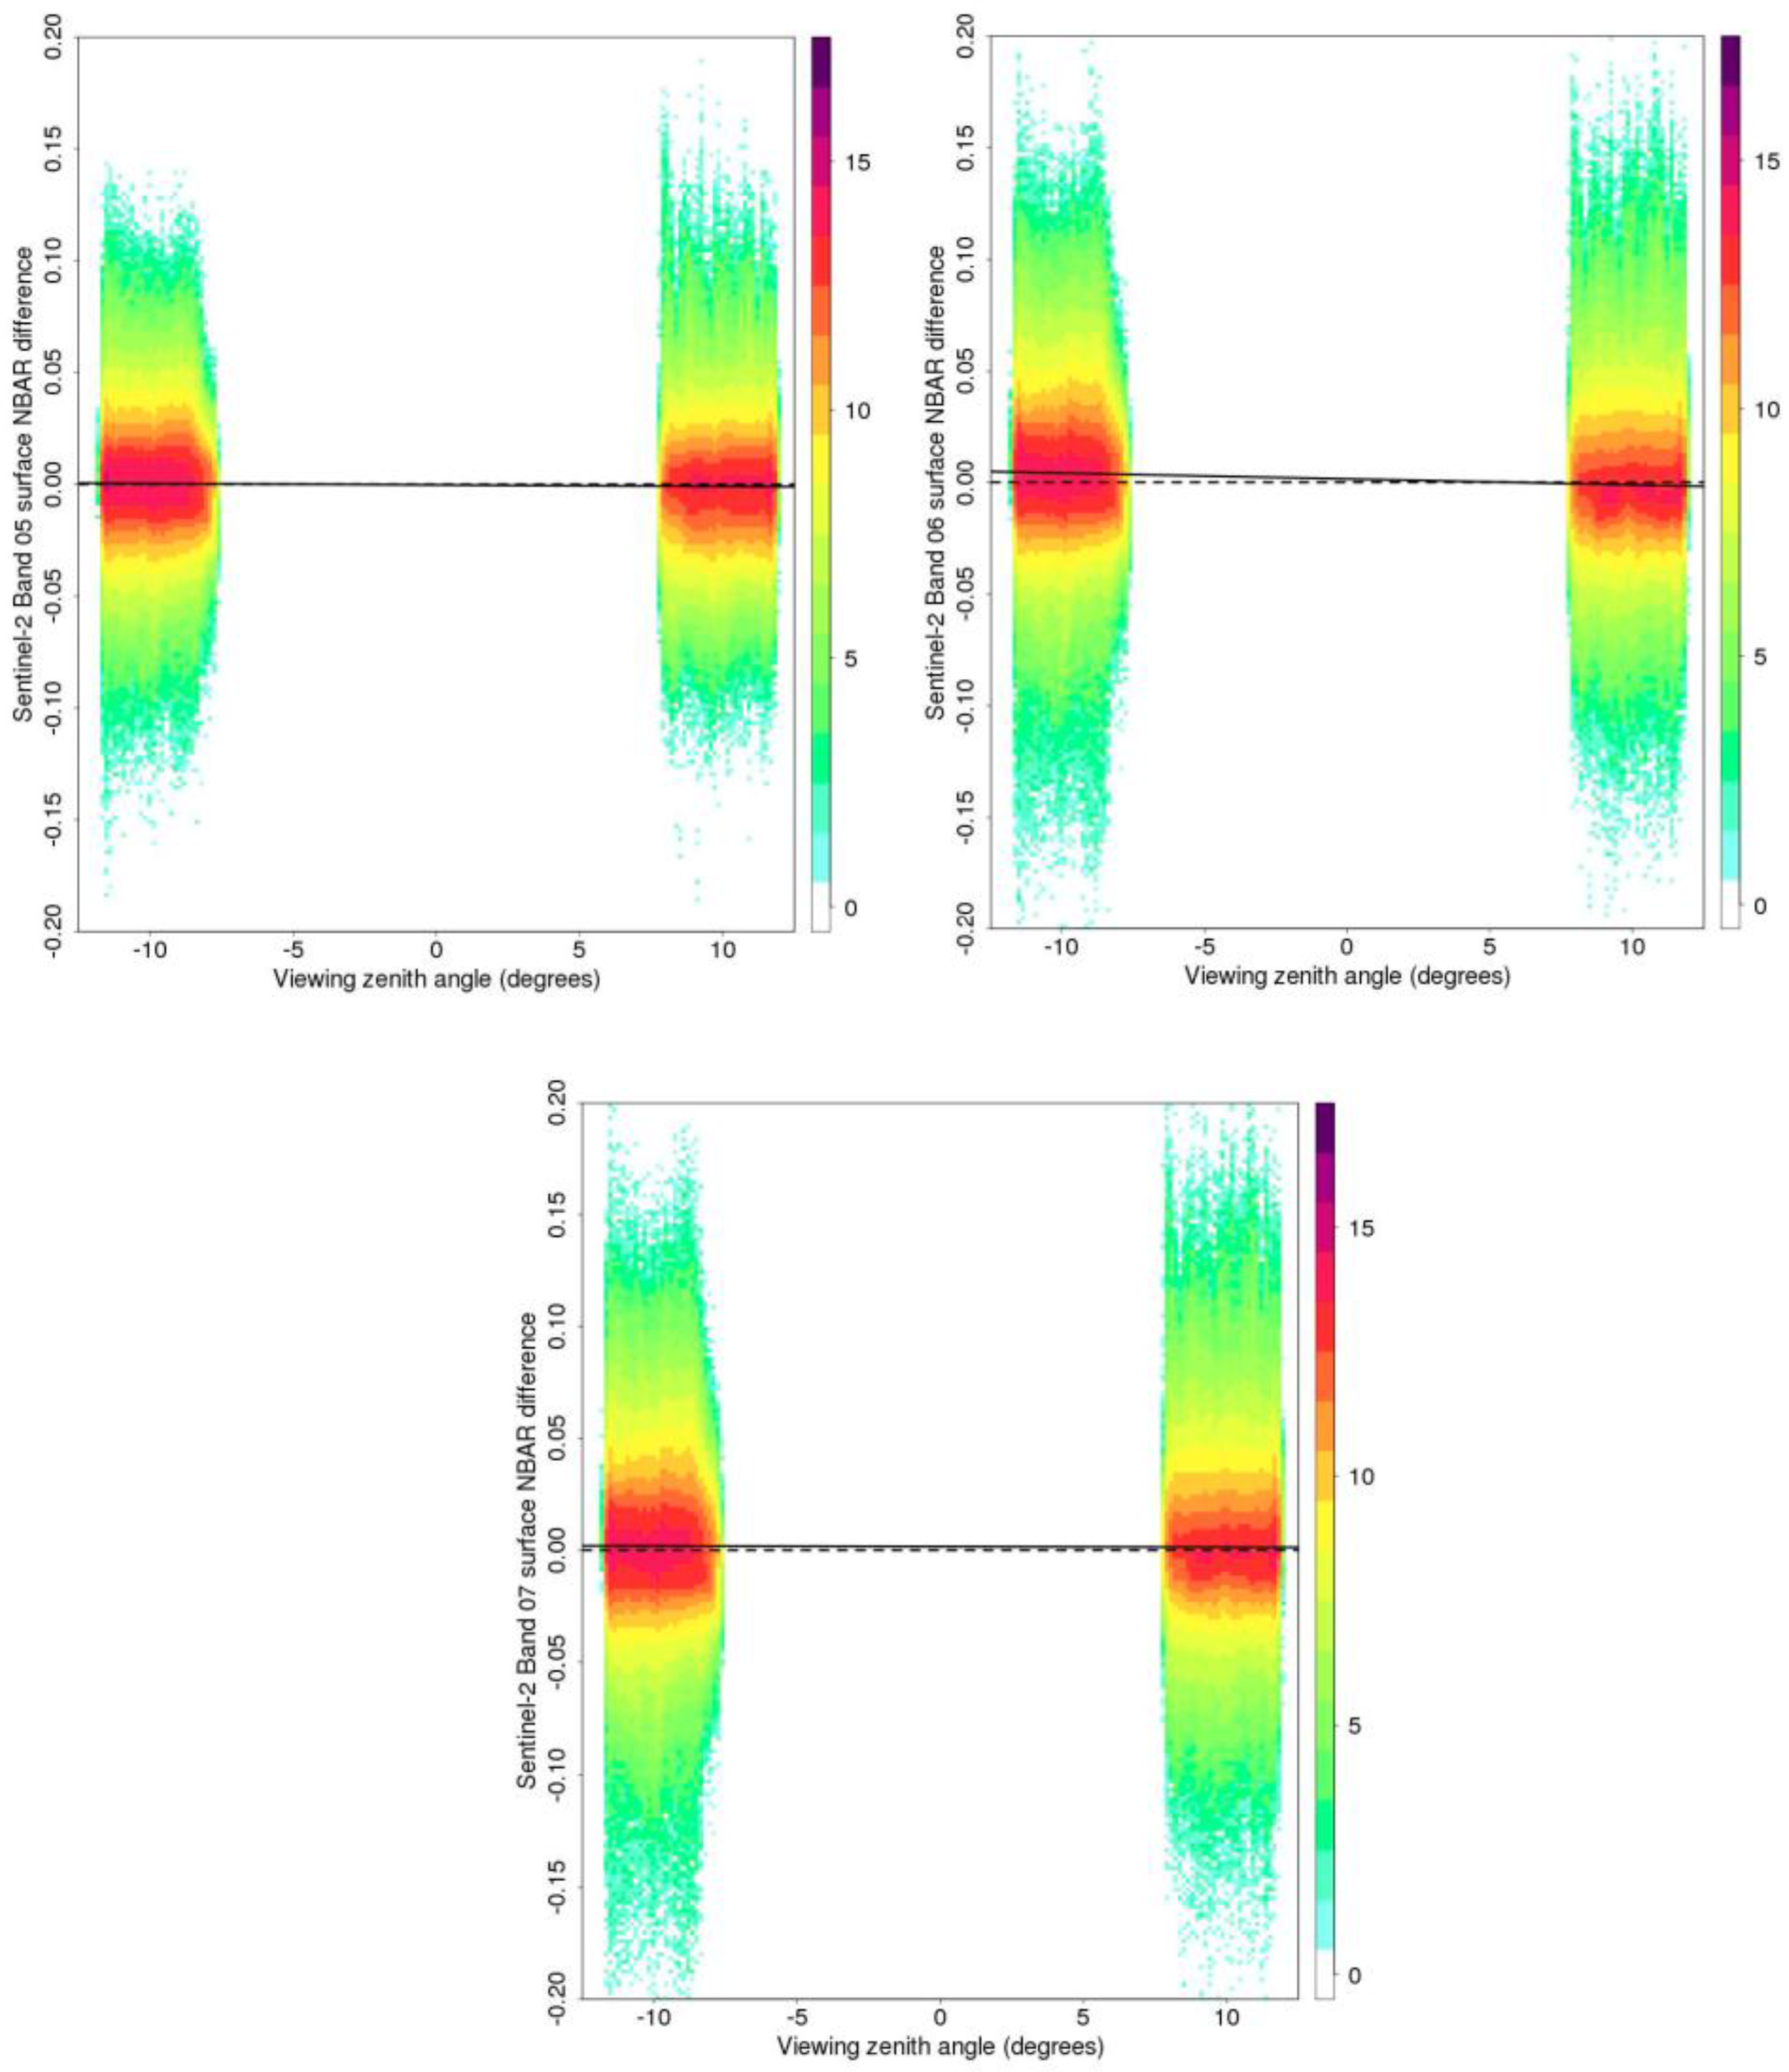
2. Data

2.1. Sentinel-2A Data

The Sentinel-2A data used in [12] were used in this study. Specifically, two ten day periods of Sentinel-2A MSI data acquired close to the solar principal (January 2016) and orthogonal planes (April 2016) over approximately 20° × 10° of southern Africa were analyzed. In this way, MSI data sensed where BRDF effects are maximal (solar principal plane) and minimal (solar orthogonal plane) [18,19] were examined. In each 10-day period, adjacent laterally overlapping MSI orbit swaths sensed in the forward and backward scatter directions were examined. More than 6.6 million (January 2016) and 10.6 million (April 2016) pairs of reflectance observations sensed three or seven days apart over the same location in the forward and backscatter directions in overlapping Sentinel-2A orbit swaths were considered. The maximum view zenith difference was 23.86°. The Sentinel-2A MSI data were projected into the MODIS sinusoidal projection, but first had to be registered due to misregistration that is evident between Sentinel-2A overlapping orbits [20,21]. The top of atmosphere reflectance data were corrected to surface reflectance using the SEN2COR atmospheric correction software [22]. Only pairs of forward and backward reflectance values that were cloud- and snow-free, unsaturated, and had no significant change in their three or seven day separation derived by the application of a blue band and normalized difference vegetation index filter [12] were used.
In this study, different to what was reported in [12], the three MSI red-edge bands were used and are illustrated as black lines in Figure 1. The MSI red-edge bands centered at 705 nm and 740 nm are 15 nm wide and the MSI red-edge band centered at 783 nm is 20 nm wide. Figure 1 also shows the MODIS red and NIR spectral response functions (dashed lines).

2.2. Fixed Global Annual MODIS Red and NIR BRDF Model Parameters

The fixed global annual MODIS red and NIR BRDF model parameters defined in [16] were used in this study (Table 1). They were defined by averaging the MODIS 500 m BRDF product spectral model parameters (MCD43A1) [13] over the entire global land surface for 12 months [16]. Only the highest quality and snow-free MCD43A1 data were used. The MODIS red and NIR BRDF model parameters are used because they bound the MSI red-edge wavelengths. The MODIS red and NIR bands are 50 nm and 35 nm wide, respectively, and their spectral response functions do not overlap with the MSI red-edge spectral response functions (Figure 1).
The MCD43A1 MODIS spectral BRDF model parameters f i s o ( λ ) , f v o l ( λ ) , and f g e o ( λ ) are defined for each MODIS band by the semi-empirical Ross-Thick/Li-Sparse-Reciprocal BRDF model [13,24] and may be used to predict reflectance for any view and solar geometry as:
ρ ^ λ ( Ω , Ω ) = f i s o ( λ ) + f v o l ( λ ) K v o l ( Ω , Ω ) + f g e o ( λ ) K g e o ( Ω , Ω )
where ρ ^ λ ( Ω , Ω ) is the predicted reflectance for the viewing vector Ω (view zenith and azimuth angles) and solar illumination vector Ω’ (solar zenith and azimuth angles); Kvol (Ω,Ω’) and Kgeo (Ω,Ω’) are volumetric scattering and geometric-optical model kernels, respectively, which only depend on the sun-view geometry; and f i s o ( λ ) , f v o l ( λ ) , and f g e o ( λ ) are the MODIS spectral BRDF model parameters.

2.3. Spectral BRDF Parameters Derived from the POLDER BRDF Database

MODIS has no red-edge bands suitable for land surface monitoring. In order to check the methodology to interpolate MODIS red-edge BRDF parameters (Section 3.2), an independent analysis was undertaken using different sensor data. There are only a small number of global coverage satellite sensors with a dedicated multi-angular sensing capability, such as the Multi-angle Imaging SpectroRadiometer (MISR) [25] and the Polarization and Directionality of the Earth’s Reflectances (POLDER) [26]. POLDER was selected as it has red-edge bands and the multi-angular data can be used to invert semi-empirical BRDF models [27]. POLDER measures the radiance in nine spectral bands (443 nm to 1020 nm) with nadir pixel dimensions of 6 × 7 km and provides up to 16 observations of the same target per orbit that are sensed over a range of view zenith angles up to nearly 70° [26].
Recently, a POLDER BRDF database was released that provides high-quality POLDER observations sensed over globally distributed sites that are free from significant aerosol and cloud contamination [17]. The database has an interface that enables interactive analysis of the POLDER observations and the inversion of BRDF models. All of the available snow-, ice-, and water-free observations in the database for 2008, i.e., more than 900,000 observations covering 8654 globally distributed sites, were considered. At each site, the snow-, ice-, and water-free POLDER observations for each calendar month of 2008 (typically at least 40 observations per site per month) were inverted against the Ross-Thick/Li-Sparse-Reciprocal model [13,24] to derive spectral BRDF model parameters f i s o ( λ ) , f v o l ( λ ) , and f g e o ( λ ) for each of the six POLDER bands in the database. Only site observations that resulted in positive BRDF model parameter values were retained following suggestions in previous MODIS BRDF research [13,28]. In addition, to quality check the BRDF model parameters, the white sky albedo, WSA(l), was derived for each band to ensure legal 0 ≤ WSA(l) ≤ 1 values [28,29]. Then, the mean value of each BRDF model parameter for all the globally distributed POLDER sites was derived, i.e., in the same way that we derived the global fixed MODIS BRDF parameters [16]. The results are shown in Table 2. Only the BRDF model parameters for the POLDER red (670 nm), red-edge (765 nm), and NIR (865 nm) bands were used in this study. The values for the other three POLDER bands are shown to provide context and in case researchers wish to use them for other purposes. The POLDER red (670 nm), red-edge (765 nm), and NIR (865 nm) bands have 15 nm, 38 nm, and 33.5 nm band widths and non-overlapping spectral response functions [30].

3. Methodology

3.1. Sentinel-2 MSI Red-Edge Band NBAR Derivation

The nadir BRDF-adjusted reflectance (NBAR) was derived for each MSI red-edge band (705 nm, 740 nm, or 783 nm) using the c-factor method as [12]:
N B A R λ ( θ ν = 0 , θ s = k )   =   c λ   × ρ λ ( θ ν = θ v S e n t i n e l ,   θ s = θ s S e n t i n e l ) c λ   = ρ ^ λ ( θ ν = 0 , θ s = k ) ρ ^ λ ( θ ν = θ v S e n t i n e l ,   θ s = θ s S e n t i n e l )
where ρ λ is the Sentinel-2A MSI reflectance sensed with view zenith ( θ v S e n t i n e l ) and solar zenith ( θ s S e n t i n e l ) for red-edge band wavelength λ, and N B A R λ is the NBAR equivalent estimated for a solar zenith angle ( θ s ) and nadir view zenith ( θ ν = 0 ) and k is the local solar zenith (set as the average solar zenith of the pair of forward and backward scattering observations). The ρ ^ λ values in (2) are defined as (1) using red-edge band interpolated MODIS spectral BRDF model parameters (Section 3.2).

3.2. Derivation of Sentinel-2 MSI Red-Edge Band BRDF Spectral Model Parameters by Linear Interpolation between the Red and NIR MODIS BRDF Spectral Model Parameters

In order to compute MSI red-edge NBAR, as (2), red-edge BRDF spectral model parameters are required. They were derived by linear interpolation between the red and NIR MODIS BRDF spectral model parameters. The BRDF shapes at red and NIR wavelengths are often quite different and typically red wavelengths have higher relative reflectance variation with respect to view and solar angle than the NIR [31,32]. The wavelength dependence of BRDF is not well studied, and only a small number of studies have considered red-edge wavelengths [33,34,35]. Typically, the BRDF of terrestrial surfaces can be described by dome or bowl shapes with greater reflectance in the back scatter direction [36,37,38] that is primarily due to shadow-hiding that occurs at the sand-sized microscale over soil surfaces [39] and at leaf and crown scales over vegetated surfaces [40].
In this study, we implemented a simple linear wavelength dependent interpolation of the semi-empirical Ross-Thick/Li-Sparse-Reciprocal red and NIR BRDF model parameters. The BRDF model implicitly models surface heterogeneity (assuming linear scaling of reflectance) [13,24,41] and it is meaningful to interpolate the BRDF model parameters and then predict reflectance from the interpolated parameter values, e.g., [42,43].
The Sentinel-2 MSI red-edge band (705 nm, 740 nm, 783 nm) BRDF model parameters values were derived by linear interpolation between the bounding MODIS red and NIR band fixed global annual BRDF model parameters as:
f i * ( λ ) = f i ( 645 ) + ( λ 645 ) × f i ( 858 ) f i ( 645 ) 858 645
where f i * ( λ ) is the interpolated BRDF model parameter i for the MSI red-edge band centered on wavelength λ; f i ( 645 ) and f i ( 858 ) are the MODIS red and NIR fixed global annual BRDF model parameters (Table 1), respectively; and i is one of three parameters (iso, geo, or vol).
To gain insights into the efficacy of the above rather simple interpolation, the same approach was applied to the POLDER red and NIR bands as:
f i * ( λ ) = f i ( 670 ) + ( λ 670 ) × f i ( 865 ) f i ( 670 ) 865 670
where f i * ( λ ) is the interpolated BRDF model parameter i for the POLDER red-edge band centered at 765 nm; f i ( 670 ) and f i ( 865 ) are the POLDER red and NIR fixed global annual BRDF model parameters (Table 2), respectively; and i is one of three parameters (iso, geo, or vol). Plots of predicted reflectance derived as (1), and c-factors derived as (2), were generated using the fixed global annual POLDER red-edge BRDF model parameters (Table 2) and using the interpolated red-edge BRDF model parameters derived as (4). In addition, plots of predicted reflectance and c-factors for the POLDER red and NIR BRDF model parameters (Table 2) were generated. The plots were generated as a function of view zenith angle and for different fixed solar zenith angles (0°, 30°, or 45°).

3.3. Quantification of Sentinel-2 MSI Red-Edge Directional Reflectance Effects and Reduction of Directional Reflectance Effects in MSI Red-Edge NBAR

More than 6.6 million (January 2016) and 10.6 million (April 2016) pairs of reflectance observations sensed three or seven days apart over the same location in the forward and backscatter directions in overlapping Sentinel-2A orbit swaths were considered. Red-edge band reflectance differences between adjacent overlapping Sentinel-2A swaths in the forward and backward scatter directions were quantified for both before (surface reflectance) and after BRDF correction (NBAR). Following the same approach as [12], the mean absolute difference, and also the relative absolute percentage difference, were derived for every pair of overlapping observations from forward and backward reflectance values as:
Δ ρ λ ¯ = i = 1 n | ρ i f o r w a r d , λ ρ i b a c k w a r d , λ | n
Δ ρ λ ¯ * = ( i = 1 n 2 | ρ i f o r w a r d , λ ρ i b a c k w a r d , λ | | ρ i f o r w a r d , λ + ρ i b a c k w a r d , λ | n ) × 100
where Δ ρ λ ¯ and Δ ρ λ ¯ * are the mean absolute and the relative absolute percentage reflectance differences, respectively; and ρ i f o r w a r d , λ and ρ i b a c k w a r d , λ are a pair of forward and backward reflectance values, respectively, and there are n pairs for Sentinel-2A wavelength λ. The same equations were applied for the pairs of reflectance adjusted to NBAR. Ordinary least squares (OLS) regression fits of the differences between the observed reflectance pairs and also the NBAR pairs as a function of the view zenith angle were generated independently for each Sentinel-2A red-edge band. The OLS slope term multiplied by the maximum observed MSI view zenith range (23.86°) was derived to quantify the average difference between surface reflectance in the forward and backward scatter directions at the MSI scan edges and, for brevity, is termed the B-F difference [12,16].

4. Results

4.1. Sentinel-2 MSI Red-Edge Band NBAR Derivation

Table 3 shows the Sentinel-2A MSI red-edge band BRDF model parameters values derived by linear interpolation, as (3), of the MODIS red and NIR BRDF model parameters. The interpolated red-edge band parameter values are intermediate between the MODIS red and NIR BRDF parameter values and increase with wavelength because the MODIS BRDF parameter values are greater at the NIR than at the red wavelengths (Table 1). The POLDER red-edge (765 nm) parameters derived by linear interpolation, as (4), of the POLDER red and NIR fixed global annual spectral BRDF model parameters (Table 2) were f_iso = 0.2040, f_geo = 0.0299, and f_vol = 0.1094. The POLDER and Sentinel-2 MSI red-edge band BRDF spectral model parameters are expected to be different because they were defined for different red-edge wavelengths and because of POLDER and MODIS sensor differences.
Figure 2 shows predicted POLDER reflectance, derived as (1) over a ±60° view zenith angle range and for three fixed solar zenith angles, generated using the fixed global annual POLDER red, red-edge, and NIR BRDF model parameters (Table 2) and using the interpolated POLDER red-edge parameters derived as (4) from the red and NIR POLDER parameters. The reflectance values are symmetrical for solar zenith = 0° around nadir (view zenith = 0°) and are bowl shaped with increasing reflectance in the backscatter (positive view zenith) at higher solar zenith angles, with an evident hot-spot when the view and solar zenith angles coincide. Similar predicted reflectance anisotropy was observed for reflectance predicted from the MODIS red and NIR BRDF parameters (Table 1) reported in [16]. Of most relevance here is that the predicted POLDER 765 nm reflectance (black) and the interpolated equivalent reflectance (orange) are dissimilar. The interpolated red-edge reflectance (orange) is close to the mean of the red (red) and NIR (blue) predicted reflectances because the POLDER red-edge band central wavelength (765 nm) is about mid-way between the POLDER red (670 nm) and NIR (865 nm) central wavelengths. However, the POLDER predicted red-edge reflectance (black) is much closer to the predicted NIR reflectance (blue). Evidently, the linear interpolation approach is not particularly appropriate, i.e., the POLDER wavelength dependence of the BRDF in the red-edge cannot be modelled reliably by linear interpolation of red and NIR BRDF parameters, and therefore interpolation of the MODIS red and NIR BRDF parameters to Sentinel-2 MSI red-edge wavelengths will also be unreliable.
Figure 3 shows the c-factor values derived as (2) for the same wavelengths, BRDF model spectral parameters, and solar zenith angles as seen in Figure 2. The c-factor values are plotted over the Sentinel-2 view zenith angle range. They vary linearly with view zenith and are similar to each other. This is because the BRDF shapes are similar over the Sentinel-2 field of view (Figure 2) and the c-factor provides a multiplicative scaling factor that is dependent on the shape but not the magnitude of the BRDF. The red-edge c-factors derived using the fixed global annual POLDER red-edge parameters and the interpolated parameters are almost the same, with less than a 1% difference at the greatest Sentinel-2 view zenith angle. Evidently, the difference in the magnitude of the predicted POLDER red-edge (black) and interpolated red-edge (orange) reflectance evident in Figure 2 is unimportant for red-edge BRDF normalization using the c-factor approach.

4.2. Quantification of Sentinel-2 MSI Red-Edge Band Bi-Directional Reflectance Effects

Figure 4 and Figure 5 show scatterplots of the MSI red-edge band surface reflectance differences as a function of view zenith for the 10-days of January and April data, respectively. In each period, pairs of MSI observations sensed in the forward and backward scatter directions over the same location were compared. The plots were generated using the same method as [12], but are shown here for the MSI red-edge bands. The figures show the surface reflectance differences for each pair plotted as a function of the view zenith angle. The view zenith BRDF effect across the Sentinel-2 field of view is evident for all three red-edges bands and in both months. The view zenith BRDF effect is greater in January than in April because the January data were sensed close to the solar principal plane when BRDF effects are pronounced and the April data were sensed closer to the orthogonal plane where BRDF effects are less pronounced. This is reflected in the slopes of the OLS regression lines that are significant for all bands and both months (p-values < 0.0001) and have higher r2 values (>0.7) for January than for April (>0.3) (Table 4). The B-F difference, i.e., the OLS slope term multiplied by the maximum observed view zenith range (23.86°), quantifies the average difference between surface reflectance in the forward and backward scatter directions at the MSI scan edges. The B-F differences for all three red-edge bands are about 0.07 to 0.08 (January) and 0.02 to 0.03 (April) (Table 4).
Table 5 summarizes the mean absolute ( Δ ρ λ ¯ ) and relative absolute percentage ( Δ ρ λ ¯ * ) differences between the pairs of forward and backward scatter surface reflectance values. The mean relative absolute difference values, ( Δ ρ λ ¯ * ) are normalized by the reflectance magnitude which changes with wavelength and surface conditions. The Δ ρ λ ¯ * values vary among the bands from 13.3% to 14.9% (January) and 9.4% to 10.5% (April). Clearly, these results illustrate that the MSI red-edge bands have view zenith BRDF effects.

4.3. Quantification of Sentinel-2A MSI Red-Edge Directional Reflectance Effect Reduction in the NBAR

Figure 6 and Figure 7 show the surface NBAR differences for the January and April data, respectively. Clearly, the normalization of the surface reflectance to NBAR reduces the BRDF effects that are less apparent in the NBAR scatterplots than the corresponding surface reflectance differences (Figure 4 and Figure 5). However, as previously reported for the other MSI bands [12], the BRDF normalization is not perfect. Although the April NBAR exhibit almost no residual BRDF effects with OLS regression lines that are near horizontal (Figure 7), the January NBAR data have evident small residual BRDF effects (Figure 6). The OLS regressions all have low r2 values (<0.21), but are statistically significant (p < 0.0001) (Table 6). The NBAR B–F differences are small, ~0.02 for the January data and <0.007 for the April data.
The OLS slope magnitudes and the B-F NBAR differences (Table 6) are always smaller than the corresponding values for the surface reflectance data (Table 4). Table 7 summarizes the mean absolute ( Δ ρ λ ¯ ) and relative absolute percentage ( Δ ρ λ ¯ * ) differences between the pairs of forward and backward scatter surface NBAR values. A comparison of these difference statistics with the corresponding surface reflectance difference statistics (Table 5) reveals that, for all bands and for both months, the NBAR differences are smaller than the corresponding surface reflectance differences. The Δ ρ λ ¯ * surface NBAR values are about half the Δ ρ λ ¯ * surface reflectance values for January and vary among the three red-edge bands from 6.0% to 7.5%. In April, when the BRDF effects were less pronounced, the Δ ρ λ ¯ * surface NBAR values vary among the three red-edge bands from 8.6% to 9.7% (Table 7) and are smaller than the Δ ρ λ ¯ * surface reflectance values (Table 5) by less than 1%. Evidently, the MODIS BRDF parameter c-factor approach systematically reduces Sentinel-2 red-edge BRDF effects.

5. Discussion

BRDF effects are known to be present in most optical wavelength data including the red-edge [33,34,
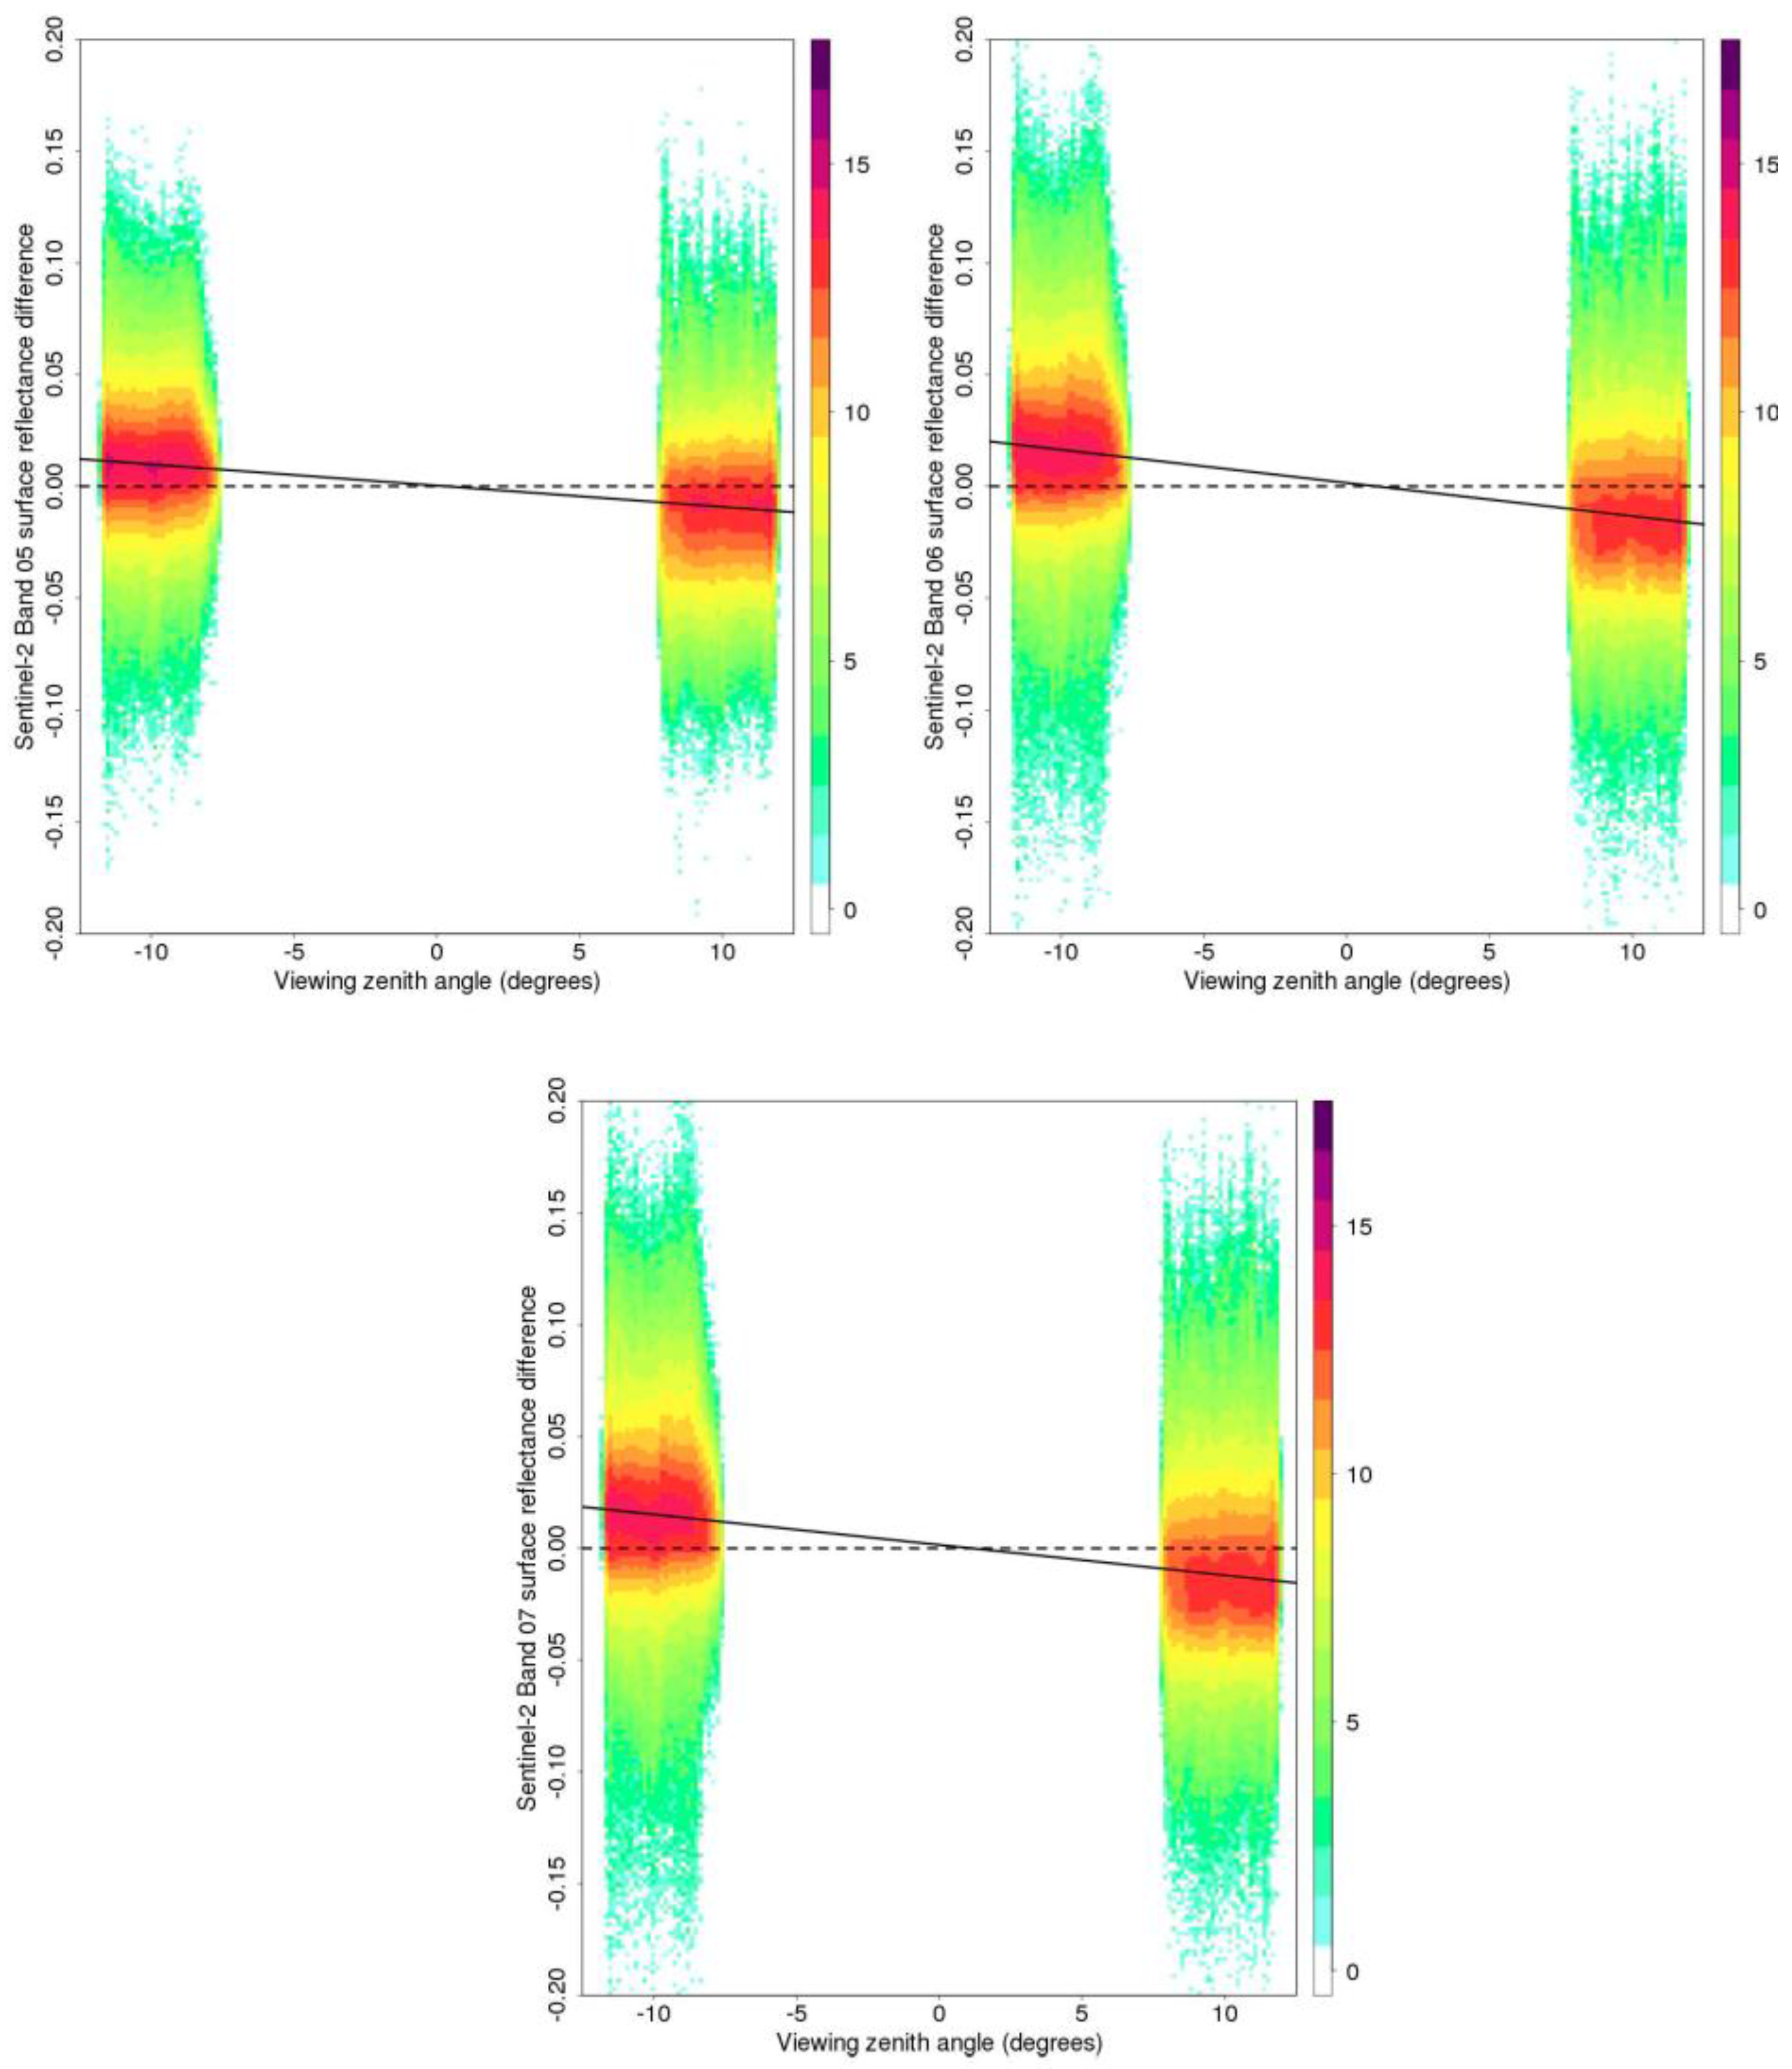
35]. A previous study, undertaken using the same data and analytical techniques as this one, documented pronounced visible, near-infrared, and short wave infrared BRDF effects across the Sentinel-2A MSI field of view [12]. In this study, we found similar BRDF effects in the three MSI red-edge bands, i.e., in MSI bands 5 (705 nm), 6 (740 nm), and 7 (783 nm). The B-F difference (that quantifies the average difference between surface reflectance in the forward and backward scatter directions at the MSI scan edges) varied among the three MSI red-edge bands from about 0.07 to 0.08 (January) and from about 0.02 to 0.03 (April). To provide context, the median red-edge surface reflectance for the Southern Africa study data was 0.22 (band 5), 0.25 (band 6), and 0.27 (band 7) for the January data and 0.18 (band 5), 0.25 (band 6), and 0.28 (band 7) for the April data. Further, the relative absolute percentage differences ( Δ ρ λ ¯ * ) between the pairs of forward and backward scatter surface reflectance values varied among the red-edge bands from 13.3% to 14.9% (January) and 9.4% to 10.5% (April). The magnitude of these red-edge BRDF effects are not insignificant, and are comparable in magnitude to Landsat atmospheric correction errors [44], and will likely be an issue for some Sentinel-2 MSI red-edge band applications. For example, the Sentinel-2 red-edge bands are of interest for studies of chlorophyll and nitrogen content, but statistical [45,46] and model inversion [47] approaches will require minimization or incorporation of BRDF variations into the estimation approach.
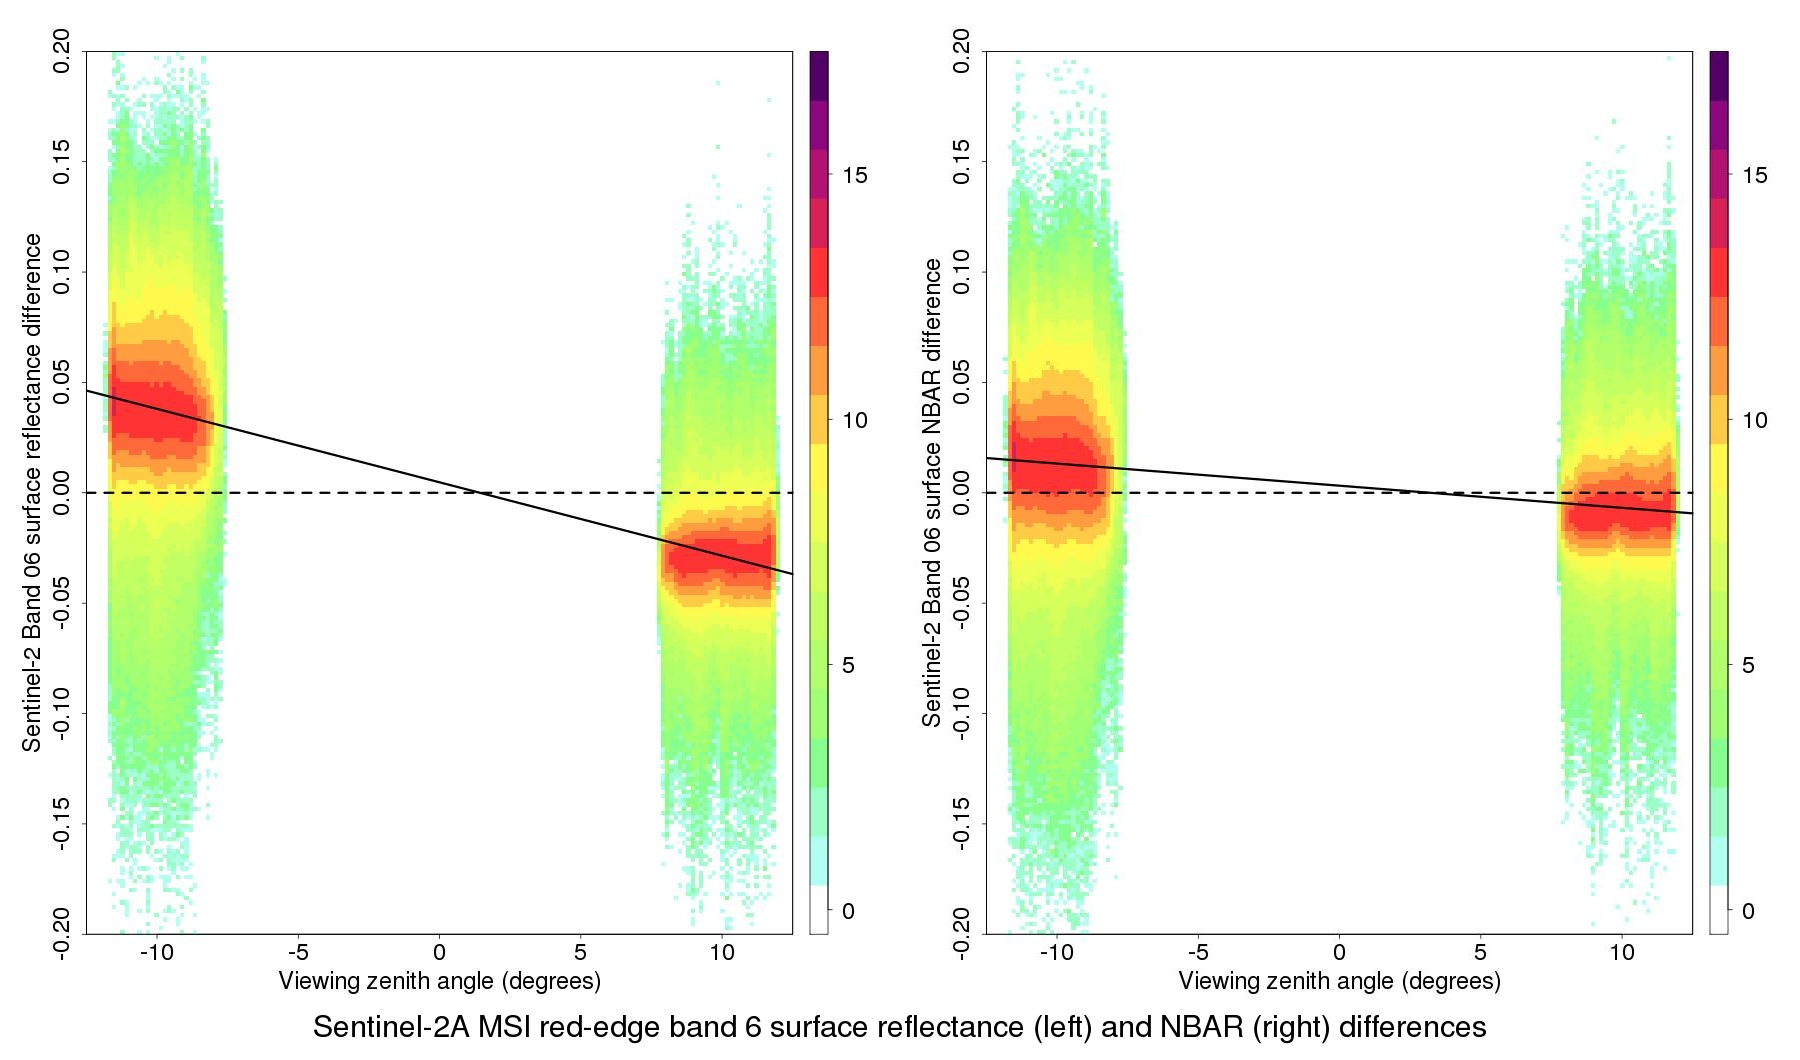
For Sentinel-2 red-edge applications that consider subtle changes in reflectance, there is a need for the correction of BRDF effects. Recently, an empirical c-factor approach was demonstrated to adjust MSI reflectance to a nadir view and specified solar zenith, i.e., to estimate nadir BRDF-adjusted reflectance (NBAR) [12]. The approach was applied to the MSI visible, near-infrared, and short wave infrared reflectance and shown to reduce BRDF effects. It was developed based on observations that BRDF shapes are sufficiently similar over the narrow field of view that a single global fixed set of MODIS BRDF spectral model parameters can be used to provide a first-order BRDF correction with little sensitivity to the land cover type, condition, or surface disturbance [
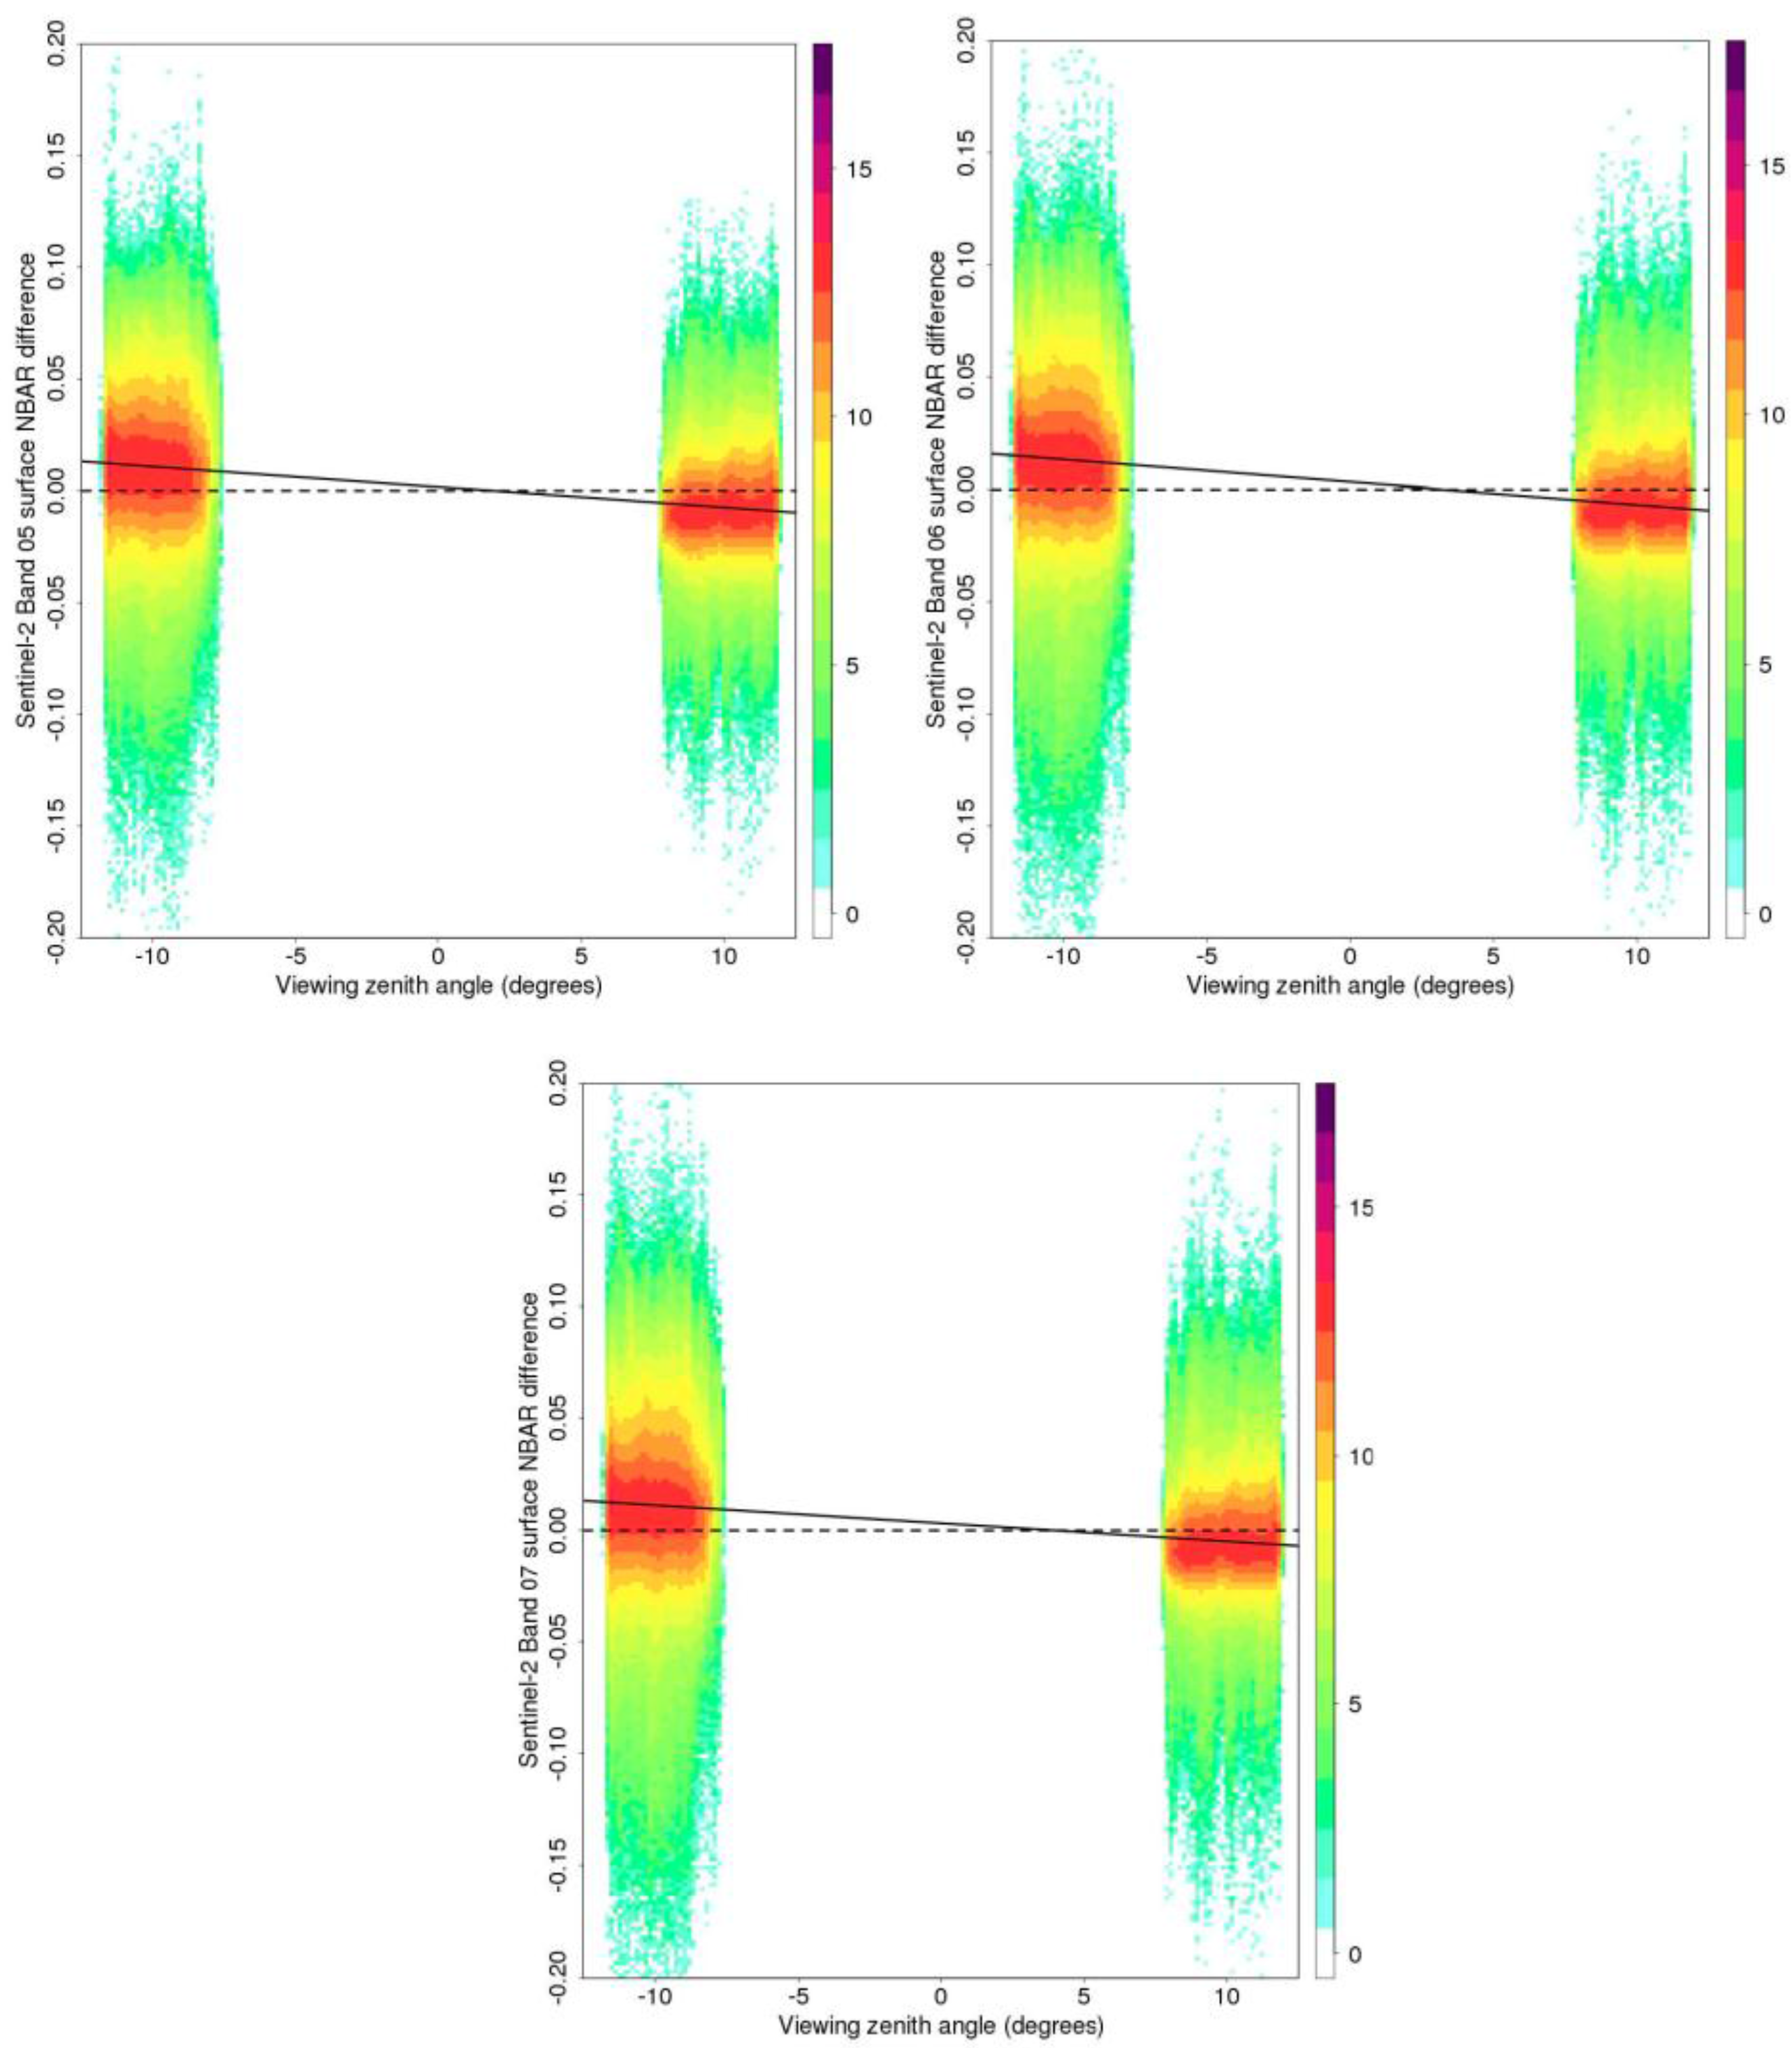
16]. As there are no MODIS red-edge BRDF model parameters, a linear wavelength interpolation of the MODIS red and NIR global fixed BRDF parameters to the MSI red-edge band wavelengths was implemented. The developed method worked successfully. For all the MSI red-edge bands and for both months of data considered, the NBAR forward and backscatter differences were smaller than the corresponding surface reflectance differences. The approach can be applied in a computationally efficient manner globally. As noted in [16], the approach should not be used to derive surface albedo, which would require a more accurate characterization of the surface BRDF than provided by fixed BRDF parameters.
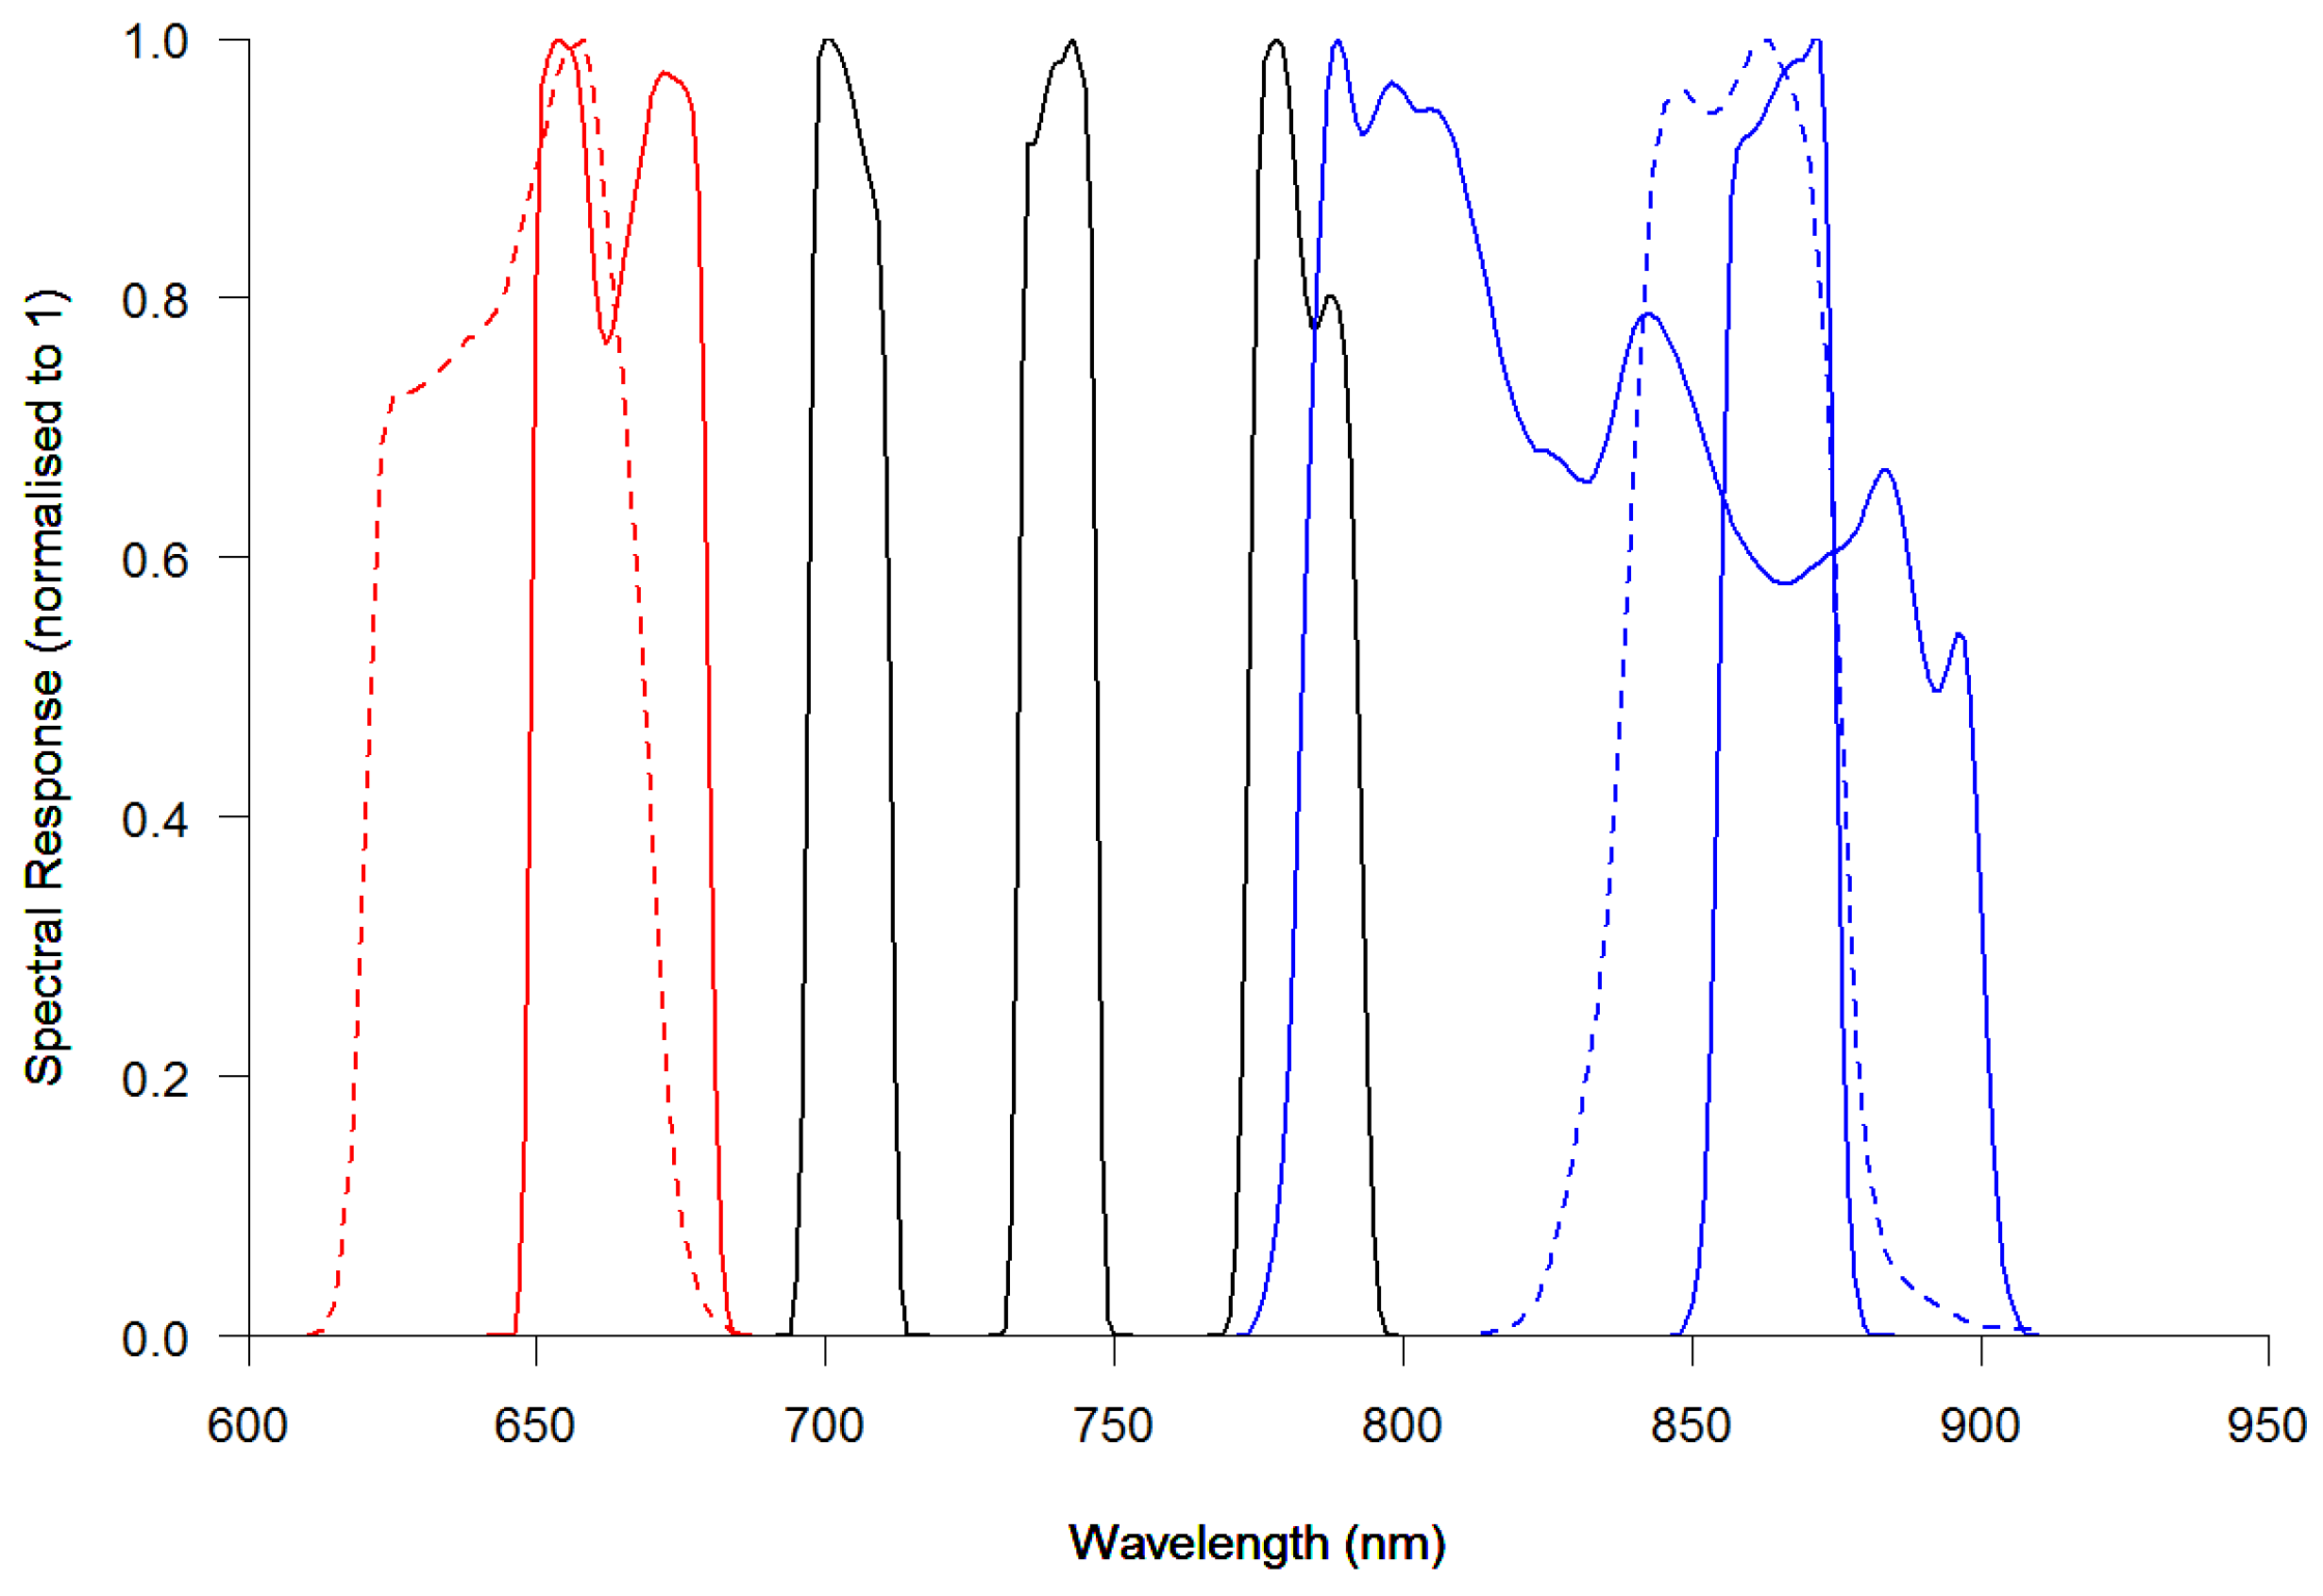
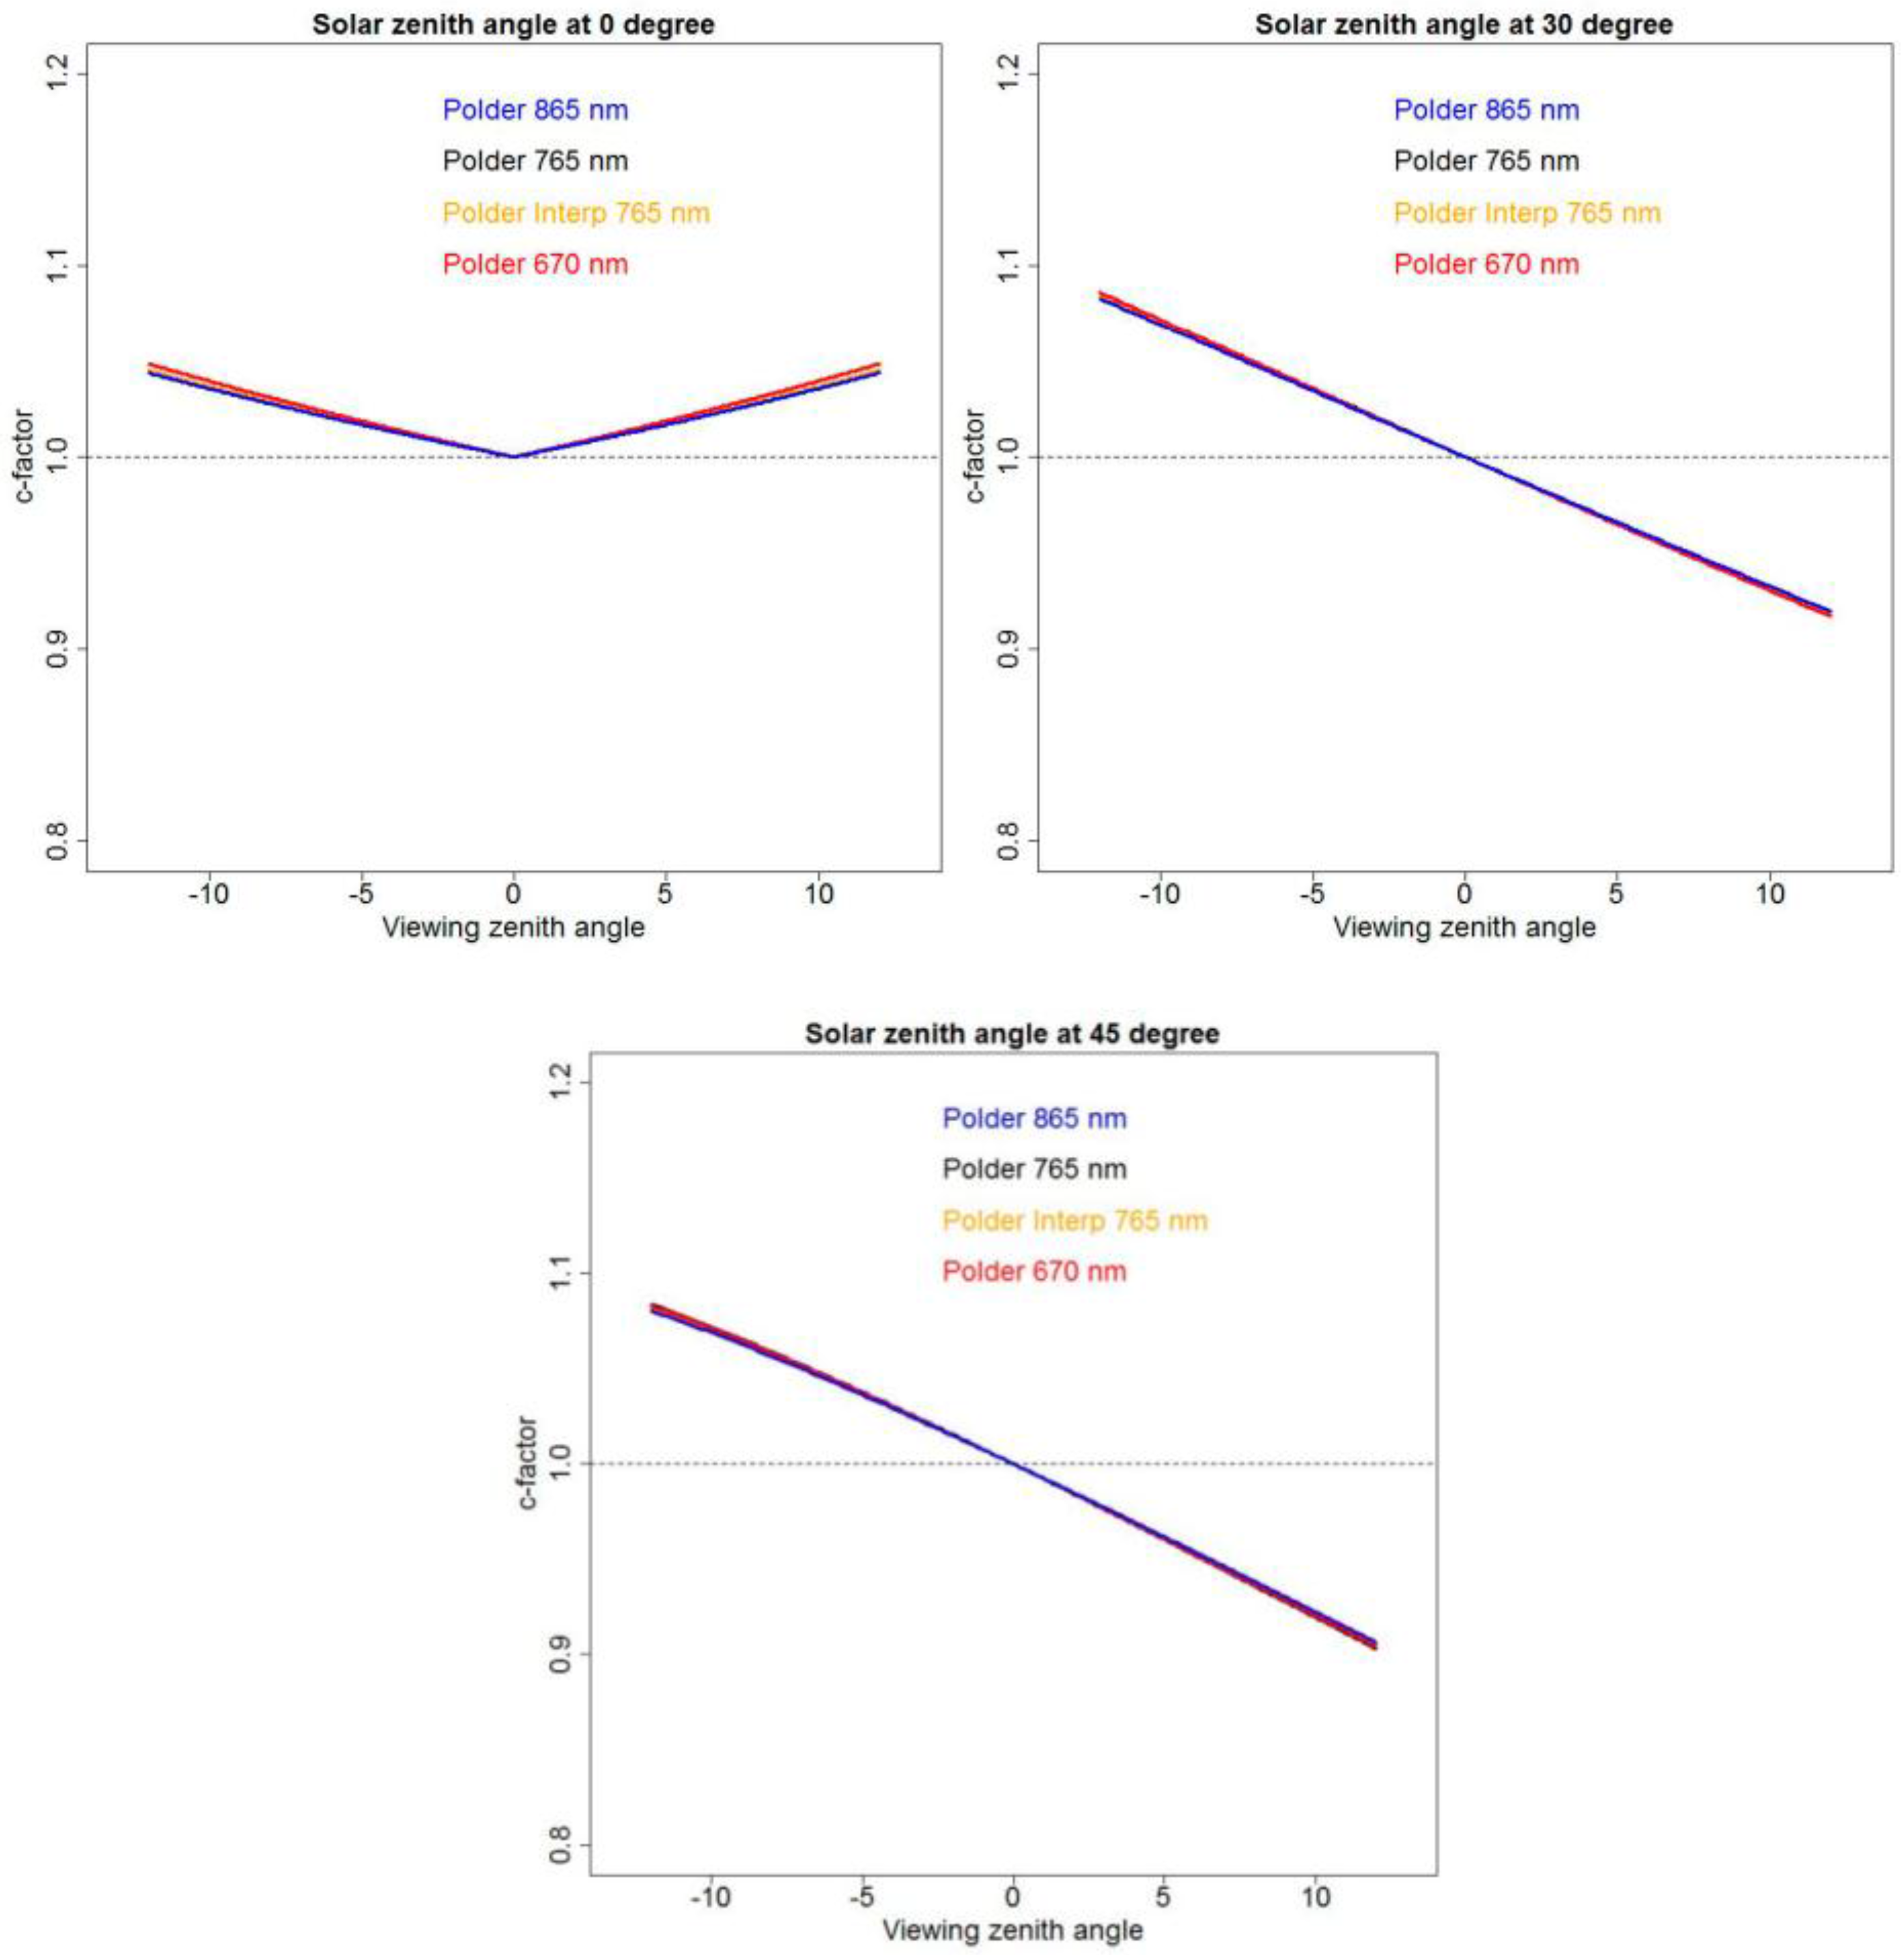
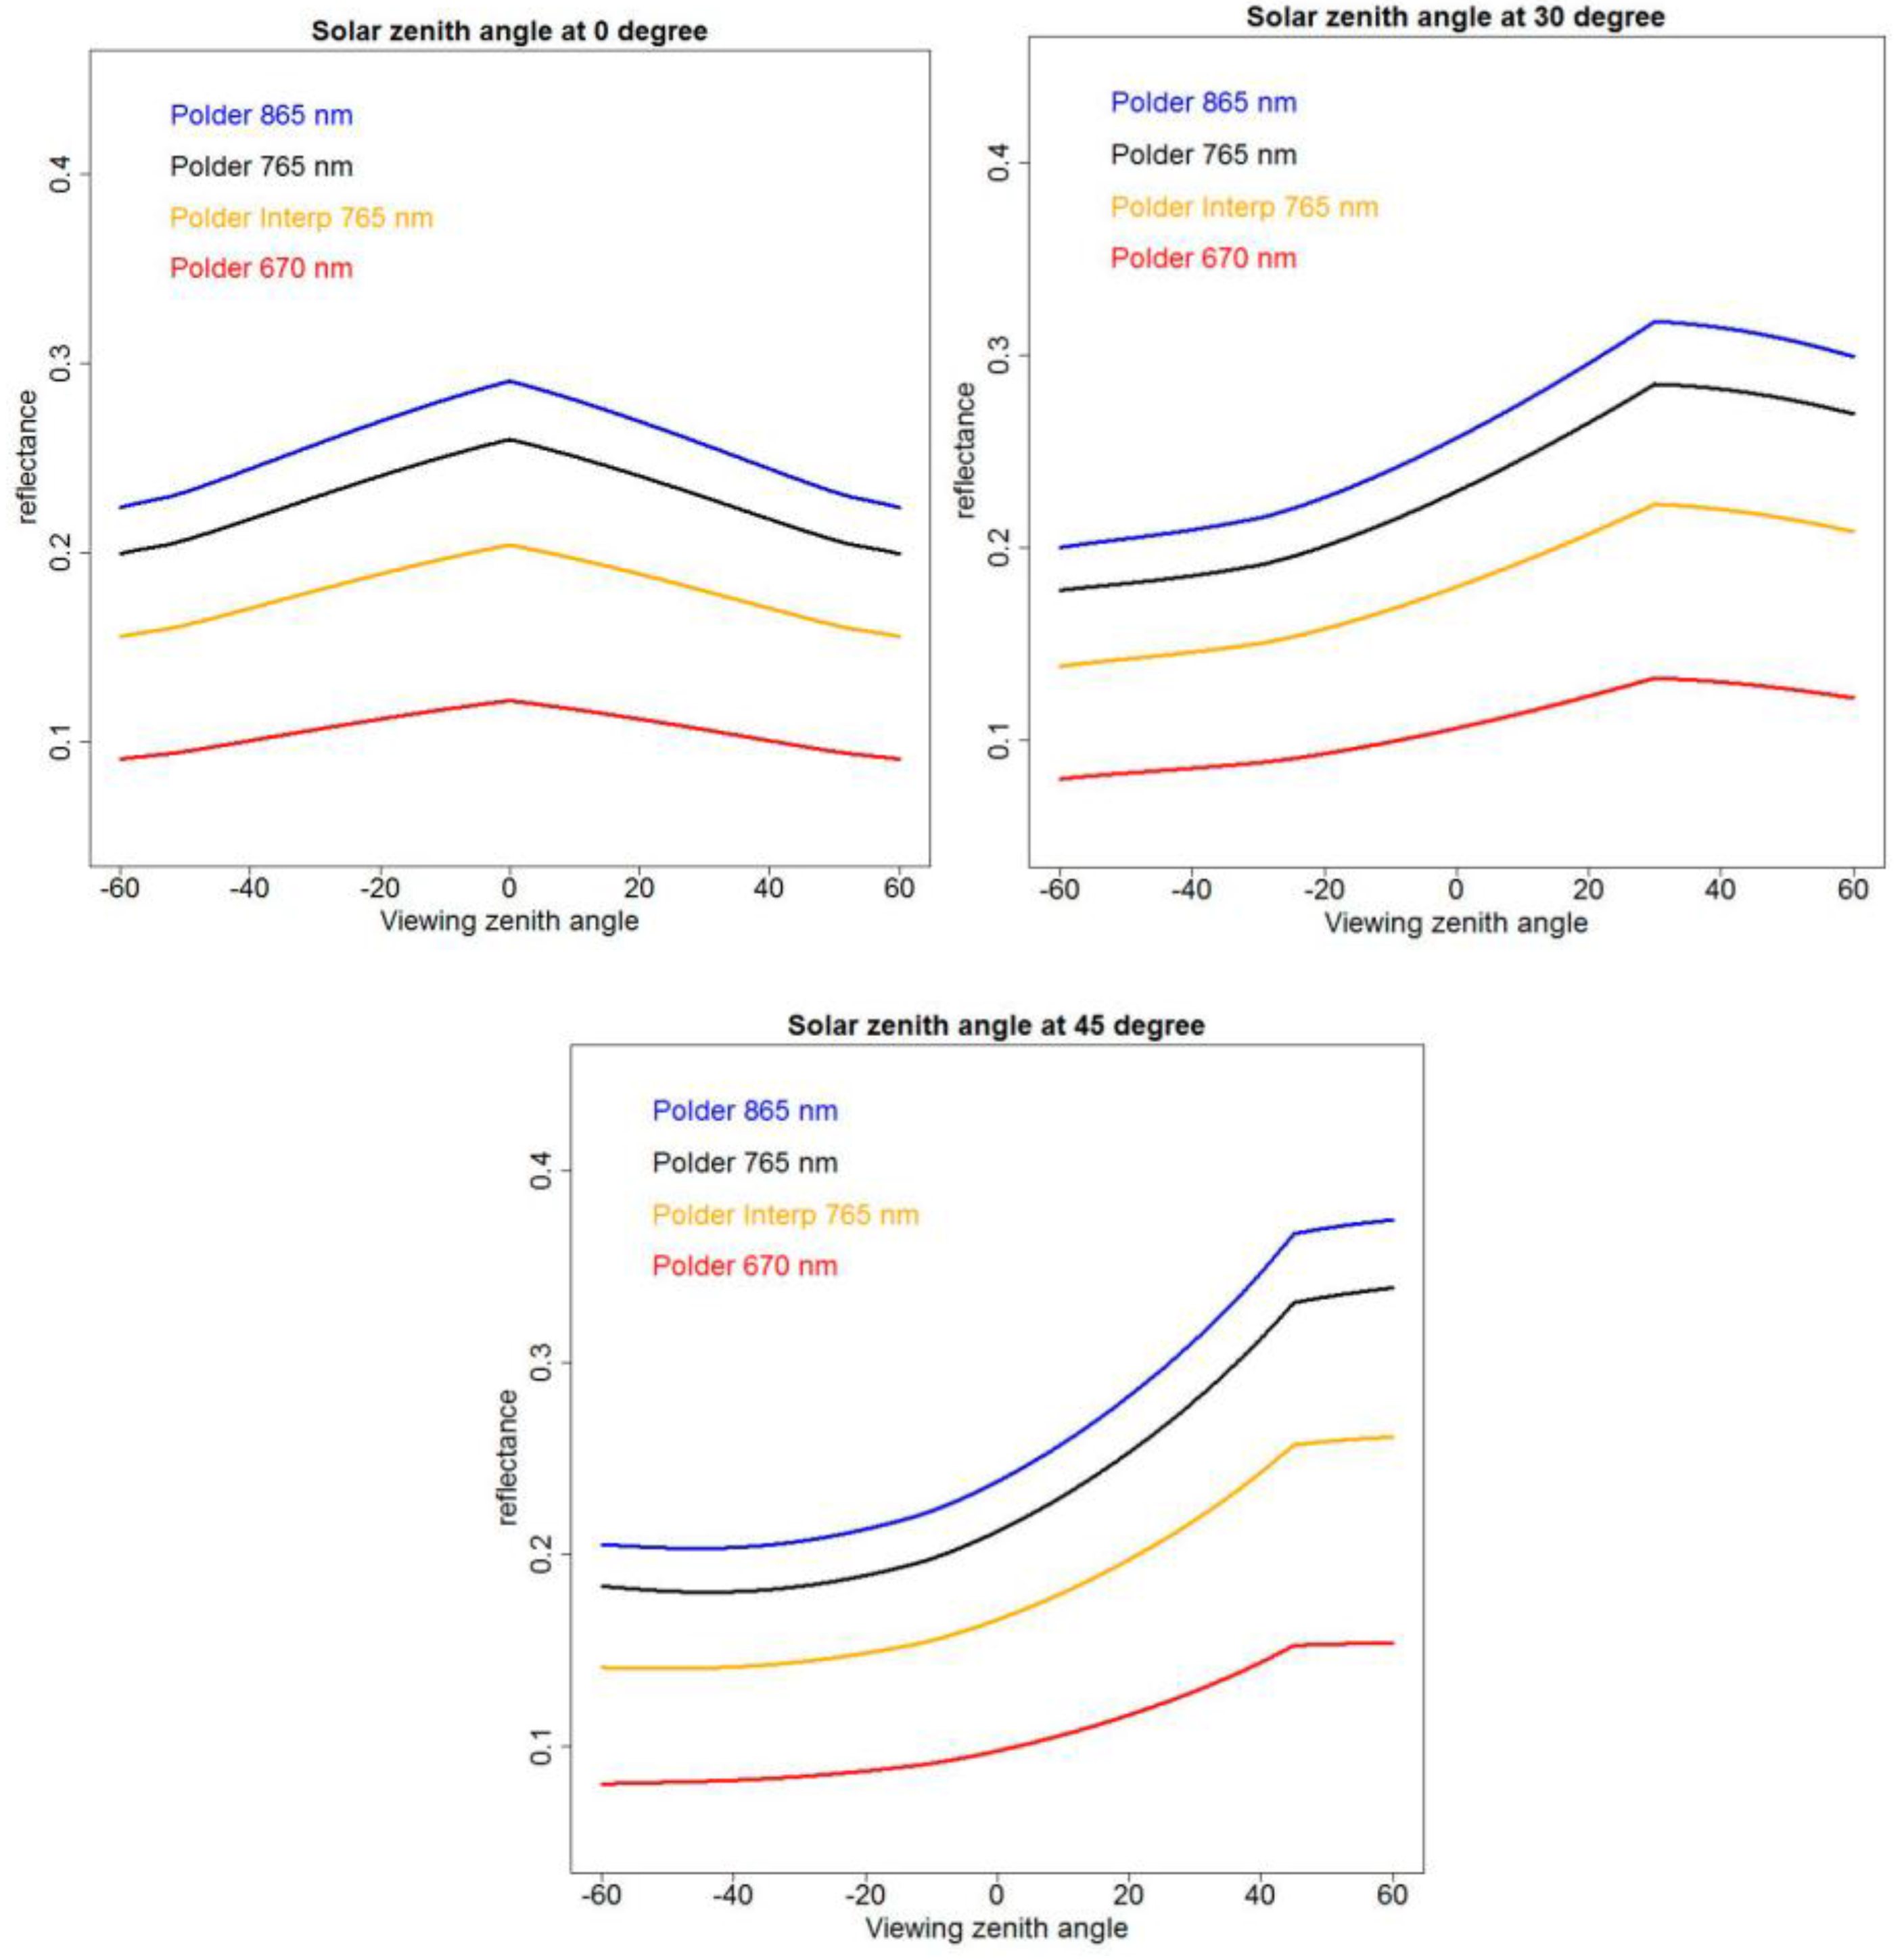
The red-edge BRDF normalization to NBAR was not perfect because of factors including atmospheric correction and sensor calibration errors [12]. In addition, a concern for this study is the appropriateness of the red-edge BRDF parameter generation by linear wavelength interpolation of the MODIS red and NIR BRDF parameters. To check that this simple interpolation approach was sufficient, an independent evaluation was undertaken using POLDER red, red-edge, and NIR fixed BRDF parameters. POLDER data were used because POLDER has a red-edge band with a multi-angular observation capability and the recent POLDER BRDF database makes access to POLDER data straightforward [17]. The POLDER BRDF parameters derived from a year of globally distributed sites were used to compute global fixed red, red-edge, and NIR BRDF parameters. The linear wavelength interpolation approach was applied to the POLDER red and NIR fixed global BRDF parameters to derive interpolated POLDER red-edge BRDF parameters. Predicted reflectance values for a range of view zenith and solar zenith angles derived using the linearly interpolated and the fixed red-edge parameters were compared. The reflectances had similar BRDF shapes but quite different magnitudes, indicating that the POLDER wavelength dependence of the BRDF in the red-edge cannot be modelled reliably by the linear interpolation of red and NIR BRDF parameters. However, the corresponding POLDER derived c-factors were linear and similar over the Sentinel-2 field of view, i.e., indicating that the interpolation approach is sufficient for the purposes of this research. More sophisticated interpolation approaches, for example, by fitting a spline or sigmoid curve to the MODIS visible, NIR, and SWIR BRDF parameters could be developed. However, in the absence of MODIS resolution multi-angular red-edge wavelength data required to test the interpolation, future research will need to proceed by modelling and/or by consideration of multi-spectral and multi-angular airborne and field measurements.
The majority of available medium resolution atmospheric correction algorithms assume a Lambertian surface and so the c-factor approach can be meaningfully applied to the resulting atmospherically corrected data. We note, however, that surface BRDF and atmospheric corrections can be coupled but that this requires knowledge of the atmospheric constituents and/or sufficient multi-angular observations for model inversion [37,48,49,50], which are not available from Sentinel-2 data. Despite this, research on the use of more physically-based correction approaches, and ones that include corrections for topographic and adjacency effects, that are particularly evident in medium spatial resolution data [51,52], is recommended.
Finally, as observed in [12,16], the spatial scale difference between medium resolution Sentinel-2 or Landsat data and coarse resolution MODIS data means that the fixed global mean 12 month MODIS BRDF spectral model parameters provide an average representation of the local surface reflectance anisotropy. Certain geographic locations and times may have greater red-edge reflectance anisotropy than captured by the MODIS interpolated red-edge BRDF spectral model parameters. In addition, although more than 17 million pairs of forward and back scatter reflectance observations sensed close to the solar principal and orthogonal planes were considered, they did not include evergreen needleleaf and snow and ice land covers or observations sensed with solar zenith >50°. Therefore, the efficacy of the red-edge normalization described here may not be globally representative.

6. Conclusions

Sentinel-2 MSI red-edge band BRDF effects were observed in more than 6.6 million (January 2016) and 10.6 million (April 2016) pairs of forward and back scatter reflectance observations extracted over approximately 20° × 10° of southern Africa. The BRDF effects were quantified and caused MSI red-edge surface reflectance variations up to 0.08 (reflectance units) across the 290 km wide swath. This variation is not negligible and may be an issue for MSI red-edge applications. The recently published MODIS BRDF parameter c-factor approach, developed to derive Landsat NBAR [16], and shown to also work for the generation of Sentinel-2 visible, near-infrared, and short wave NBAR data [12], was adapted in this study for MSI red-edge band implementation. The algorithm reduced BRDF effects for all three MSI red-edge bands and for both months of study data. Residual BRDF effects remained in the NBAR data, about 0.02 for the January data (that had more pronounced surface reflectance BRDF effects) and <0.007 for the April data. The MSI red-edge band BRDF parameters needed to implement the red-edge c-factor NBAR algorithm are provided (Table 3) so that users may implement the algorithm.

Acknowledgments

This research was funded by NASA Land Cover/Land Use Change Multi-Source Land Imaging Science Program Grant NNX15AK94G. Francois-Marie Breon and Fabienne Maignan are thanked for making the POLDER BRDF–BPDF database available to the community. Thanks to Jian Li for his assistance adapting the Sentinel-2 code based on the code in [12] for the MSI red-edge bands, to Lin Yan for registering the Sentinel-2 data, and to Haiyan Huang for assistance with the MSI atmospheric correction. The European Space Agency and Copernicus program management and staff are thanked for free provision of the Sentinel-2A data.

Author Contributions

D.P.R., H.K.Z., and Z.L. conceived the experiments; Z.L. obtained and processed the POLDER data with assistance from H.K.Z.; D.P.R. structured and drafted the manuscript with assistance from H.K.Z. and Z.L.

Conflicts of Interest

The authors declare no conflict of interest.

References

  1. Drusch, M.; Del Bello, U.; Carlier, S.; Colin, O.; Fernandez, V.; Gascon, F.; Hoersch, B.; Isola, C.; Laberinti, P.; Martimort, P. Sentinel-2: ESA’s optical high-resolution mission for GMES operational services. Remote Sens. Environ. 2012, 120, 25–36. [Google Scholar] [CrossRef]
  2. Li, J.; Roy, D.P. A Global Analysis of Sentinel-2A, Sentinel-2B and Landsat-8 Data Revisit Intervals and Implications for Terrestrial Monitoring. Remote Sens. 2017, 9, 902. [Google Scholar] [CrossRef]
  3. Cho, M.A.; Skidmore, A.K. A new technique for extracting the red edge position from hyperspectral data: The linear extrapolation method. Remote Sens. Environ. 2006, 101, 181–193. [Google Scholar] [CrossRef]
  4. Clevers, J.G.; Gitelson, A.A. Remote estimation of crop and grass chlorophyll and nitrogen content using red-edge bands on Sentinel-2 and -3. Int. J. Appl. Earth Obs. Geoinf. 2013, 23, 344–351. [Google Scholar] [CrossRef]
  5. Dash, J.; Curran, P.J. The MERIS terrestrial chlorophyll index. Int. J. Remote Sens. 2004, 25, 5403–5413. [Google Scholar] [CrossRef]
  6. Pu, R.; Gong, P.; Biging, G.S.; Larrieu, M.R. Extraction of red edge optical parameters from Hyperion data for estimation of forest leaf area index. IEEE Trans. Geosci. Remote Sens. 2003, 41, 916–921. [Google Scholar]
  7. Delegido, J.; Verrelst, J.; Alonso, L.; Moreno, J. Evaluation of Sentinel-2 red-edge bands for empirical estimation of green LAI and chlorophyll content. Sensors 2001, 11, 7063–7081. [Google Scholar] [CrossRef] [PubMed]
  8. Herrmann, I.; Pimstein, A.; Karnieli, A.; Cohen, Y.; Alchanatis, V.; Bonfil, D.J. LAI assessment of wheat and potato crops by VENμS and Sentinel-2 bands. Remote Sens. Environ. 2011, 115, 2141–2151. [Google Scholar] [CrossRef]
  9. Smith, K.; Steven, M.; Colls, J. Use of hyperspectral derivative ratios in the red-edge region to identify plant stress responses to gas leaks. Remote Sens. Environ. 2004, 92, 207–217. [Google Scholar] [CrossRef]
  10. Oliva, P.; Martín, P.; Chuvieco, E. Burned area mapping with MERIS post-fire image. Int. J. Remote Sens. 2011, 32, 4175–4201. [Google Scholar] [CrossRef]
  11. Huang, H.; Roy, D.P.; Boschetti, B.; Zhang, H.K.; Yan, L.; Kumar, S.S.; Gomez-Dans, J.; Li, J. Separability analysis of Sentinel-2A multi-spectral instrument (MSI) data for burned area discrimination. Remote Sens. 2016, 8, 873. [Google Scholar] [CrossRef]
  12. Roy, D.P.; Li, J.; Zhang, H.K.; Yan, L.; Huang, H. Examination of Sentinel-2A multi-spectral instrument (MSI) reflectance anisotropy and the suitability of a general method to normalize MSI reflectance to nadir BRDF adjusted reflectance. Remote Sens. Environ. 2017, 199, 25–38. [Google Scholar] [CrossRef]
  13. Schaaf, C.; Gao, F.; Strahler, A.; Lucht, W.; Li, X.; Tsang, T.; Strugnell, N.; Zhang, X.; Jin, Y.; Muller, J.-P.; et al. First operational BRDF, albedo and nadir reflectance products from MODIS. Remote Sens. Environ. 2002, 83, 135–148. [Google Scholar] [CrossRef]
  14. Gao, F.; Schaaf, C.; Strahler, A.H.; Lucht, W. Using a multi-kernel least variance approach to retrieve and evaluate albedo from limited BRDF observations. Remote Sens. Environ. 2001, 76, 57–66. [Google Scholar] [CrossRef]
  15. Roy, D.P.; Lewis, P.; Schaaf, C.; Devadiga, S.; Boschetti, L. The Global impact of cloud on the production of MODIS bi-directional reflectance model based composites for terrestrial monitoring. IEEE Geosci. Remote Sens. Lett. 2006, 3, 452–456. [Google Scholar] [CrossRef]
  16. Roy, D.P.; Zhang, H.K.; Ju, J.; Gomez-Dans, J.L.; Lewis, P.E.; Schaaf, C.B.; Sun, Q.; Li, J.; Huang, H.; Kovalskyy, V. A general method to normalize Landsat reflectance data to nadir BRDF adjusted reflectance. Remote Sens. Environ. 2016, 176, 255–271. [Google Scholar] [CrossRef]
  17. Breon, F.; Maignan, F. A BRDF–BPDF database for the analysis of Earth target reflectances. Earth Syst. Sci. Data 2017, 9, 31–45. [Google Scholar] [CrossRef]
  18. Kimes, D.S. Dynamics of directional reflectance factor distributions for vegetation canopies. Appl. Opt. 1983, 22, 1364–1372. [Google Scholar] [CrossRef] [PubMed]
  19. Hapke, B.; DiMucci, D.; Nelson, R.; Smythe, W. The cause of the hot spot in vegetation canopies and soils: Shadow-hiding versus coherent backscatter. Remote Sens. Environ. 1996, 58, 63–68. [Google Scholar] [CrossRef]
  20. Skakun, S.; Roger, J.C.; Vermote, E.F.; Masek, J.G.; Justice, C.O. Automatic sub-pixel co-registration of Landsat-8 Operational Land Imager and Sentinel-2A Multi-Spectral Instrument images using phase correlation and machine learning based mapping. Int. J. Digit. Earth 2017, 10, 1–17. [Google Scholar] [CrossRef]
  21. Yan, L.; Roy, D.P.; Li, Z.; Zhang, H.K.; Huang, H. Sentinel-2A multi-temporal misregistration characterization and an orbit-based sub-pixel registration methodology. Remote Sens. Environ. 2017. submitted. [Google Scholar]
  22. Müller-Wilm, U. Sen2Cor Configuration and User Manual. Available online: http://step.esa.int/thirdparties/sen2cor/2.3.0/%5BL2A-SUM%5D%20S2-PDGS-MPC-L2A-SUM%20%5B2.3.0%5D.pdf (accessed on 25 November 2016).
  23. Barnes, W.L.; Pagano, T.S.; Salomonson, V.V. Prelaunch characteristics of the moderate resolution imaging spectroradiometer (MODIS) on EOS-AM1. IEEE Trans. Geosci. Remote Sens. 1998, 36, 1088–1100. [Google Scholar] [CrossRef]
  24. Roujean, J.L.; Leroy, M.; Deschamps, P.Y. A bidirectional reflectance model of the Earth’s surface for the correction of remote sensing data. J. Geophys. Res. Atmos. 1992, 97, 20455–20468. [Google Scholar] [CrossRef]
  25. Diner, D.J.; Beckert, J.C.; Reilly, T.H.; Bruegge, C.J.; Conel, J.E.; Kahn, R.A.; Martonchik, J.V.; Ackerman, T.P.; Davies, R.; Gerstl, S.; et al. Multi-angle Imaging SpectroRadiometer (MISR) instrument description and experiment overview. IEEE Trans. Geosci. Remote Sens. 1998, 36, 1072–1087. [Google Scholar] [CrossRef]
  26. Deschamps, P.; Breon, F.; Leroy, M.; Podaire, A.; Bricaud, A.; Buriez, J.; Seze, G. The POLDER mission: Instrument characteristics and scientific objectives. IEEE Trans. Geosci. Remote Sens. 1994, 32, 598–615. [Google Scholar] [CrossRef]
  27. Leroy, M.; Deuzé, J.L.; Bréon, F.M.; Hautecoeur, O.; Herman, M.; Buriez, J.C.; Tanre, D.; Bouffies, S.; Chazette, P.; Roujean, J.L. Retrieval of atmospheric properties and surface bidirectional reflectances over land from POLDER/ADEOS. J. Geophys. Res. Atmos. 1997, 102, 17023–17037. [Google Scholar] [CrossRef]
  28. Lucht, W.; Schaaf, C.B.; Strahler, A.H. An algorithm for the retrieval of albedo from space using semiempirical BRDF models. IEEE Trans. Geosci. Remote Sens. 2000, 38, 977–998. [Google Scholar] [CrossRef]
  29. Jiao, Z.; Hill, M.J.; Schaaf, C.B.; Zhang, H.; Wang, Z.; Li, X. An anisotropic flat index (AFX) to derive BRDF archetypes from MODIS. Remote Sens. Environ. 2014, 141, 168–187. [Google Scholar] [CrossRef]
  30. Breon, F.M. PARASOL Level-1 Product Data Format and User Manual. Available online: http://www.icare.univ-lille1.fr/projects_data/parasol/docs/Parasol_Level-1_format_latest.pdf (accessed on 13 December 2016).
  31. Sandmeier, S.R.; Strahler, A.H. BRDF laboratory measurements. Remote Sens. Rev. 2000, 18, 481–502. [Google Scholar] [CrossRef]
  32. Gao, F.; Jin, Y.; Schaaf, C.B.; Strahler, A.H. Bidirectional NDVI and atmospherically resistant BRDF inversion for vegetation canopy. IEEE Trans. Geosci. Remote Sens. 2002, 40, 1269–1278. [Google Scholar]
  33. Sandmeier, S.R.; Middleton, E.M.; Deering, D.W.; Qin, W. The potential of hyperspectral bidirectional reflectance distribution function data for grass canopy characterization. J. Geophys. Res. Atmos. 1999, 104, 9547–9560. [Google Scholar] [CrossRef]
  34. Settle, J. On the dimensionality of multi-view hyperspectral measurements of vegetation. Remote Sens. Environ. 2004, 90, 235–242. [Google Scholar] [CrossRef]
  35. Doctor, K.Z.; Bachmann, C.M.; Gray, D.J.; Montes, M.J.; Fusina, R.A. Wavelength dependence of the bidirectional reflectance distribution function (BRDF) of beach sands. Appl. Opt. 2015, 54, F243–F255. [Google Scholar] [CrossRef] [PubMed]
  36. Jackson, R.; Teillet, P.; Slater, P.; Fedosejevs, G.; Jasinski, M.; Aase, J.; Moran, M. Bidirectional measurements of surface reflectance for view angle corrections of oblique imagery. Remote Sens. Environ. 1990, 32, 189–202. [Google Scholar] [CrossRef]
  37. Rahman, H.; Verstraete, M.M.; Pinty, B. Coupled surface-atmosphere reflectance (CSAR) model: 1. Model description and inversion on synthetic data. J. Geophys. Res. Atmos. 1993, 98, 20779–20789. [Google Scholar] [CrossRef]
  38. Pinty, B.; Widlowski, J.-L.; Gobron, N.; Verstraete, M.M.; Diner, D.J. Uniqueness of multiangular measurements. I. An indicator of subpixel surface heterogeneity from MISR. IEEE Trans. Geosci. Remote Sens. 2002, 40, 1560–1573. [Google Scholar] [CrossRef]
  39. Deering, D.; Eck, T.; Otterman, J. Bidirectional reflectances of selected desert surfaces and their three-parameter soil characterization. Agric. For. Meteorol. 1990, 52, 71–93. [Google Scholar] [CrossRef]
  40. Li, X.; Strahler, A.H. Geometric-optical bidirectional reflectance modeling of the discrete crown vegetation canopy: Effect of crown shape and mutual shadowing. IEEE Trans. Geosci. Remote Sens. 1992, 30, 276–292. [Google Scholar] [CrossRef]
  41. Lucht, W.; Roujean, J.-L. Considerations in the parametric modeling of BRDF and Albedo from multiangular satellite sensor observations. Remote Sens. Rev. 2000, 18, 343–379. [Google Scholar] [CrossRef]
  42. Samain, O.; Roujean, J.L.; Geiger, B. Use of a Kalman filter for the retrieval of surface BRDF coefficients with a time-evolving model based on the ECOCLIMAP land cover classification. Remote Sens. Environ. 2008, 112, 1337–1346. [Google Scholar] [CrossRef]
  43. Sun, Q.; Wang, Z.; Li, Z.; Erb, A.; Schaaf, C.B. Evaluation of the global MODIS 30 arc-second spatially and temporally complete snow-free land surface albedo and reflectance anisotropy dataset. Int. J. Appl. Earth Obs. Geoinf. 2017, 58, 36–49. [Google Scholar] [CrossRef]
  44. Ju, J.; Roy, D.P.; Vermote, E.; Masek, J.; Kovalskyy, V. Continental-scale validation of MODIS-based and LEDAPS Landsat ETM+ atmospheric correction methods. Remote Sens. Environ. 2012, 122, 175–184. [Google Scholar] [CrossRef]
  45. Ramoelo, A.; Cho, M.; Mathieu, R.; Skidmore, A.K. Potential of Sentinel-2 spectral configuration to assess rangeland quality. J. Appl. Remote Sens. 2015, 9, 094096. [Google Scholar] [CrossRef]
  46. Clevers, J.G.; Kooistra, L.; van den Brande, M.M. Using Sentinel-2 Data for Retrieving LAI and Leaf and Canopy Chlorophyll Content of a Potato Crop. Remote Sens. 2017, 9, 405. [Google Scholar] [CrossRef]
  47. Féret, J.B.; Gitelson, A.A.; Noble, S.D.; Jacquemoud, S. PROSPECT-D: Towards modeling leaf optical properties through a complete lifecycle. Remote Sens. Environ. 2017, 193, 204–215. [Google Scholar] [CrossRef]
  48. Hu, B.; Lucht, W.; Strahler, A.H. The interrelationship of atmospheric correction of reflectances and surface BRDF retrieval: A sensitivity study. IEEE Trans. Geosci. Remote Sens. 1999, 37, 724–738. [Google Scholar]
  49. Lyapustin, A.; Martonchik, J.; Wang, Y.; Laszlo, I.; Korkin, S. Multiangle implementation of atmospheric correction (MAIAC): 1. Radiative transfer basis and look-up tables. J. Geophys. Res. Atmos. 2011. [Google Scholar] [CrossRef]
  50. Franch, B.; Vermote, E.F.; Sobrino, J.A.; Fédèle, E. Analysis of directional effects on atmospheric correction. Remote Sens. Environ. 2013, 128, 276–288. [Google Scholar] [CrossRef]
  51. Li, F.; Jupp, D.L.; Thankappan, M.; Lymburner, L.; Mueller, N.; Lewis, A.; Held, A. A physics-based atmospheric and BRDF correction for Landsat data over mountainous terrain. Remote Sens. Environ. 2012, 124, 756–770. [Google Scholar] [CrossRef]
  52. Houborg, R.; McCabe, M.F. Impacts of dust aerosol and adjacency effects on the accuracy of Landsat 8 and RapidEye surface reflectances. Remote Sens. Environ. 2017, 194, 127–145. [Google Scholar] [CrossRef]
Figure 1. Spectral response functions for the Sentinel-2 MSI (solid, [1]) and MODIS (dashed, [23]) red to NIR wavelength bands. The MSI red-edge bands 5 (705 nm), band 6 (740 nm), and band 7 (783 nm) are shown in black. The MSI bands (in order of increasing central wavelength) are band 4 (665 nm), band 5 (705 nm), band 6 (740 nm), band 7 (783 nm), band 8 (842 nm), and band8A (865 nm). The MODIS red (645 nm) and NIR (858 nm) bands are shown by the dashed lines.
Remotesensing 09 01325 g001
Figure 2. Predicted reflectance (derived as 1) using the fixed global annual POLDER NIR 865 nm (blue), red-edge 765 nm (black), and red 670 nm (red) BRDF model parameters (Table 2) and using the interpolated POLDER red-edge 765 nm (orange) BRDF model parameters. Shown for MODIS or POLDER ± 60° view zenith angle range and for three fixed solar zenith angles (0°, 30°, 45°).
Remotesensing 09 01325 g002
Figure 3. c-factors (derived as 2) using the fixed global annual POLDER NIR 865 nm (blue), red-edge 765 nm (black), and red 670 nm (red) BRDF model parameters (Table 2) and using the interpolated POLDER red-edge 765 nm (orange) BRDF model parameters. Shown for Sentinel-2 MSI ± 10.3° view zenith angle range and for three fixed solar zenith angles (0°, 30°, 45°). The orange and blue lines are almost identical and the blue lines are plotted over the orange lines.
Remotesensing 09 01325 g003
Figure 4. Sentinel-2A MSI red-edge surface reflectance differences in the Southern Africa January swath image overlap zones plotted against view zenith for a total of 6,600,685 pairs of forward and back scatter surface reflectance values. The plot colors show the relative frequency of occurrence of similar difference values (with a log2 scale). The solid lines show ordinary least squares (OLS) linear regression fits of these data (see Table 4). Results shown for MSI bands 5 (705 nm), 6 (740 nm), and 7 (783 nm).
Remotesensing 09 01325 g004
Figure 5. Same as Figure 4 but for the April data, a total of 10,656,197 pairs of forward and back scatter surface reflectance values were considered. The solid lines show ordinary least squares (OLS) linear regression fits of these data (see Table 4).
Remotesensing 09 01325 g005
Figure 6. Sentinel-2A MSI red-edge surface NBAR differences in the Southern Africa January swath image overlap zones plotted against view zenith for a total of 6,600,685 pairs of forward and back scatter surface NBAR values. The plot colors show the relative frequency of occurrence of similar difference values (with a log2 scale). The solid lines show ordinary least squares (OLS) linear regression fits of these data (see Table 6). Results shown for MSI bands 5 (705 nm), 6 (740 nm), and 7 (783 nm).
Remotesensing 09 01325 g006
Figure 7. Same as Figure 6 but for the April data, a total of 10,656,197 pairs of forward and back scatter surface NBAR values were considered. The solid lines show ordinary least squares (OLS) linear regression fits of these data (see Table 6).
Remotesensing 09 01325 g007
Table 1. Fixed global annual MODIS spectral BRDF model parameters for the MODIS red and NIR bands (reproduced from Table 5 of [16]) used in this study.
MODIS Band (Center Wavelength) f i s o ( λ ) f g e o ( λ ) f v o l ( λ )
1 (red, 645 nm)0.16900.02270.0574
2 (NIR, 858 nm)0.30930.03300.1535
Table 2. Fixed global annual spectral BRDF model parameters for the six POLDER bands derived from the POLDER database [17]. The 765 nm band is a red-edge band.
POLDER Band f i s o ( λ ) f g e o ( λ ) f v o l ( λ )
490 nm0.07080.01200.0547
565 nm0.10390.01710.0680
670 nm0.12160.01930.0602
765 nm0.25980.03690.1531
865 nm0.29070.04100.1611
1020 nm0.32010.04710.1611
Table 3. Sentinel-2 MSI red-edge band BRDF spectral model parameters derived by linear interpolation between the red and NIR MODIS BRDF spectral model parameters (Table 1).
Sentinel-2 Red-Edge Band (Center Wavelength) f i s o ( λ ) f g e o ( λ ) f v o l ( λ )
5 (705 nm)0.20850.02560.0845
6 (740 nm)0.23160.02730.1003
7 (783 nm)0.25990.02940.1197
Table 4. Summary of the ordinary least squares (OLS) linear regressions of the surface reflectance differences illustrated in Figure 4 and Figure 5; OLS regression coefficient of determination (r2), the OLS regression F-test p-value, and the B-F difference. A total of 6,600,685 and 10,656,197 pairs of forward and back scatter surface reflectance values were considered in January and April, respectively.
Sentinel-2 Red-Edge BandJanuaryApril
OLS EquationOLS r 2 (p-Value)B-F DifferenceOLS EquationOLS r 2 (p-Value)B-F Difference
705 nmΔ = −0.0029 θv + 0.00180.7271 (<0.0001)0.0698Δ = −0.0010 θv + 0.00030.2877 (<0.0001)0.0226
740 nmΔ = −0.0033 θv + 0.00480.7379 (<0.0001)0.0787Δ = −0.0015 θv + 0.00150.4014 (<0.0001)0.0352
783 nmΔ = −0.0033 θv + 0.00510.7086 (<0.0001)0.0776Δ = −0.0014 θv + 0.00150.3311 (<0.0001)0.0323
Table 5. Mean absolute reflectance differences ( Δ ρ λ ) ¯ (Equation (5)) and mean absolute relative percentage differences ( Δ ρ λ ¯ * ) (Equation (6)) between the pairs of forward and backward scatter Sentinel-2A surface reflectance values illustrated in Figure 4 and Figure 5. A total of 6,600,685 and 10,656,197 pairs of forward and back scatter surface reflectance values were considered in January and April, respectively.
Sentinel-2 Red-Edge BandJanuaryApril
Δ ρ λ ¯ Δ ρ λ ¯ * Δ ρ λ ¯ Δ ρ λ ¯ *
705 nm0.031414.9280.013310.487
740 nm0.035814.2830.01869.699
783 nm0.035613.3000.01829.378
Table 6. Summary of the ordinary least squares (OLS) linear regressions of the surface NBAR differences illustrated in Figure 6 and Figure 7; OLS regression coefficient of determination (r2), the OLS regression F-test p-value, and the B-F difference. A total of 6,600,685 and 10,656,197 pairs of forward and back scatter surface reflectance values were considered in January and April, respectively.
Sentinel-2 Red-Edge BandJanuaryApril
OLS EquationOLS r 2 (p-Value)B-F DifferenceOLS EquationOLS r 2 (p-Value)B-F Difference
705 nmΔ =−0.0009 θv + 0.00170.2059 (<0.0001)0.0217Δ =−0.0001 θv − 0.00030.0018 (<0.0001) 0.0015
740 nmΔ =−0.0010 θv + 0.00320.2061 (<0.0001)0.0237Δ =−0.0003 θv + 0.00150.0218 (<0.0001) 0.0063
783 nmΔ =−0.0008 θv + 0.00320.1300 (<0.0001)0.0191Δ =−0.0000 θv + 0.00160.0002 (<0.0001)0.0006
Table 7. Mean absolute reflectance differences ( Δ ρ λ ) ¯ (Equation (5)) and mean absolute relative percentage differences ( Δ ρ λ ¯ * ) (Equation (6)) between the pairs of forward and backward scatter Sentinel-2A surface NBAR values illustrated in Figure 6 and Figure 7. A total of 6,600,685 and 10,656,197 pairs of forward and back scatter surface NBAR values were considered in January and April, respectively.
Sentinel-2 Red-Edge BandJanuaryApril
Δ ρ λ ¯ Δ ρ λ ¯ * Δ ρ λ ¯ Δ ρ λ ¯ *
705 nm0.01507.4800.01049.735
740 nm0.01636.6460.01239.016
783 nm0.01575.9730.01278.643

