Chlorophyll Fluorescence Data Reveals Climate-Related Photosynthesis Seasonality in Amazonian Forests


1
Remote Sensing Division, National Institute for Space Research–INPE, São José dos Campos 12227-010, SP, Brazil
2
National Center for Natural Disasters Monitoring–CEMADEN, São José dos Campos 12247-016, SP, Brazil
3
Environmental Change Institute, University of Oxford, OX1 3QY Oxford, UK
4
College of Life and Environmental Sciences, University of Exeter, EX4 4RJ Exeter, UK
*
Author to whom correspondence should be addressed.
Remote Sens. 2017, 9(12), 1275; https://doi.org/10.3390/rs9121275
Submission received: 1 October 2017
/
Revised: 29 November 2017
/
Accepted: 6 December 2017
/
Published: 8 December 2017
(This article belongs to the Special Issue Remote Sensing of Land-Atmosphere Interactions)
Abstract
:Amazonia is the world largest tropical forest, playing a key role in the global carbon cycle. Thus, understanding climate controls of photosynthetic activity in this region is critical. The establishment of the relationship between photosynthetic activity and climate has been controversial when based on conventional remote sensing-derived indices. Here, we use nine years of solar-induced chlorophyll fluorescence (ChlF) data from the Global Ozone Monitoring Experiment (GOME-2) sensor, as a direct proxy for photosynthesis, to assess the seasonal response of photosynthetic activity to solar radiation and precipitation in Amazonia. Our results suggest that 76% of photosynthesis seasonality in Amazonia is explained by seasonal variations of solar radiation. However, 13% of these forests are limited by precipitation. The combination of both radiation and precipitation drives photosynthesis in the remaining 11% of the area. Photosynthesis tends to rise only after radiation increases in 61% of the forests. Furthermore, photosynthesis peaks in the wet season in about 58% of the Amazon forest. We found that a threshold of ≈1943 mm per year can be defined as a limit for precipitation phenological dependence. With the potential increase in the frequency and intensity of extreme droughts, forests that have the photosynthetic process currently associated with radiation seasonality may shift towards a more water-limited system.

1. Introduction
The vulnerability of Amazonian forests to climate change depends on the physiological responses of plants to changes in the climate system. Because of Amazonia’s continental extent any small climate-induced changes on the functioning of this ecosystem may promote significant perturbations in the global carbon cycle [1,2,3]. Photosynthesis is the primary process linking the climate system with the biosphere [4]. Quantifying photosynthesis across Amazonia, the world largest tropical forest, hence, is fundamentally important for the global carbon cycle. This biome contributes up to 14% of all carbon fixed by photosynthesis in the terrestrial biosphere [5]. However, current formulations of Earth System Models (ESM) are unable to correctly capture the direction of seasonal changes in Amazonian photosynthesis as observed by flux tower data [6,7], which shows, contrarily to models, a steady increase in photosynthesis starting in the dry season.
Satellite remote sensing information associated with the Enhanced Vegetation Index (EVI), derived from the Moderate Resolution Imaging Spectroradiometer (MODIS) sensor, which correlates with chlorophyll content and photosynthetic activity [8,9], coherently tracks seasonal changes in tower-based photosynthesis measurements and canopy phenology [9,10,11,12,13,14,15,16,17,18]. Results based on the analysis of EVI show that the seasonality of photosynthesis in Amazonia is strongly linked to temporal fluctuations of radiation and precipitation [15,16,19,20]. More specifically, satellite observations demonstrate that photosynthetic activity tends to raise following radiation increases during the dry season across Amazonia [9,10,11,12,13,14,15,16,19,20,21]. This process is explained by the occurrence of new leaf flushing triggered by increased radiation availability during the dry season [7,10,12,18]. New leaves are more light-use efficient than old senescent leaves. This process occurs where forests are not limited by water, because their water demands can be supplied during the dry season by the redistributed subsurface water of the wet season [19]. However, in southern Amazonia, where water availability constrains leaf phenology, this process is not observed, with photosynthesis declining during the dry season in these areas [19,20].
Although EVI is commonly applied as a proxy for the photosynthetic capacity of vegetation in Amazonia [10,16,19,21], the biophysical interpretation of this index has been controversial [17]. Previous studies have questioned the observed greening during the dry season in Amazonia, suggesting that the observed patterns can be related to artifacts in the EVI data [22,23] or changes in forest structure [24]. However, the recent use of MODIS products, fully corrected for removing atmospheric and radiometric artifacts [25], provide solid evidence about the climate controls of phenology and photosynthesis seasonality [15,16,19,20]. Remote sensing data, therefore, provide potentially powerful observations of whole system patterns that can be used to mechanistically test forest-climate interactions.
Recently, a new dataset on fluorescence of chlorophyll (ChlF) has been used to study photosynthesis in Amazonia [19,26,27,28,29,30,31]. This data offers a more direct measure of photosynthetic activity. Unlike vegetation indices, which are indirect estimates of the vegetation status, the ChlF consists of a measurable and dimensional variable [32]. ChlF is the portion of radiation, with wavelengths between 650 and 800 nm, re-emitted by plants after energy absorption, and can be obtained by passive remote sensing [33,34,35,36,37,38,39,40,41]. One critical limitation of space-borne estimates of ChlF is the relatively low spatial resolution required for retrieving this variable. The Global Ozone Monitoring Experiment-2 (GOME-2) instrument has a spatial resolution of approximately 40 km × 40 km at nadir, for example. Therefore, clouds and aerosols tend to be present in almost every observation, being an important source of uncertainty. However, screening for cloud contamination is routinely applied in the processing stages of these products [39]. Moreover, the rate of ChlF varies depending on the time of day and directional effects. The study from [40] indicates that the highest production rate of ChlF (ratio between the ChlF observed flux and the incident photosynthetically active radiation (PAR)) occurs in the first hours of the morning. However, this signal is too low to be detected by orbital sensors. This fact makes the midmorning time the most adequate time for detecting ChlF by orbital remote sensing. The orientation of leaves, angle of light incidence, multiple scattering and absorption effects at the canopy level also impact the retrieval of ChlF [42]. Non-photochemical quenching (NPQs) is another process that directly affects ChlF production. The plants increase the quenching by non-photochemical quenching and slow down photosynthesis and fluorescence emission when exposed to water stress or unfavorable temperatures [43].
Ref. [38] provides a literature overview of the primary techniques used for retrieving ChlF. More recent and complex techniques, however, can be found in the studies of [33,34,36,41,44]. Photosynthetic activity in Amazonia has been analyzed through ChlF by using GOME-2 [19,26,27]—onboard the Meteorological Operational satellite program (METOP-A) and the Thermal and Near Infrared Sensor for Carbon Observation Fourier-Transform Spectrometer (TANSO-FTS)—onboard the Japanese Greenhouse Gases Observing Satellite (GOSAT) [28,29,30] sensors. However, there are no spatially explicit studies so far, demonstrating how ChlF seasonality correlates with the monthly variation of precipitation and radiation in Amazonia.
The primary aim of this paper was to analyze the dependence of photosynthesis seasonality on climate in Amazonia, using a new remote sensing dataset, ChlF from GOME-2, which is independent of vegetation indices commonly used to study photosynthetic activity. Therefore, in this study we aim to answer three research questions: (i) How does photosynthesis vary as a function of climate seasonality? (ii) What is the association between climate-drivers of photosynthesis seasonality and the spatial gradient of mean annual precipitation? (iii) When is the peak of maximum photosynthesis activity in Amazonia? To elucidate these questions, monthly ChlF data from the GOME-2 sensor [41] was analyzed in conjunction with remote sensing based precipitation data, derived from the Tropical Rainfall Measuring Mission (TRMM) [45] and surface incident shortwave radiation, derived from the Global Land Data Assimilation System (GLDAS) [46].
2. Materials and Methods
2.1. Chlorophyll Fluorescence (ChlF) Data
The study area was located between latitudes 10°N to 15°S and longitudes 80°W to 40°W, including the whole area covered by the Amazon biome. We used monthly time series of ChlF from the GOME2_F product level 3 (unit: mW/m2/sr/nm), version 26 (V26) [41] between 2007 and 2015. ChlF data are produced using channel 4 of the GOME-2 sensor (590–790 nm), with a spatial resolution of 0.5° [41]. The seasonal component of the ChlF data (ChlF-S) was extracted from the GOME2_F time series by the Breaks in Additive Season and Trend (BFAST) algorithm. This algorithm is based on the iterative decomposition of time-series data [47], excluding noise and outliers and extracting the tendency of the time series (Supplementary Material). Pixels with no information were represented as No Data, and were replaced by the average of a 3 × 3 window centered in the pixel with No Data. No Data values occur only in 2015 in the GOME2_F product and represent less than 0.001% of the study area. A harmonic seasonal model was used to fit the seasonal component [47] with a frequency equal to 12, due to the monthly resolution of the data. The seasonal component varies between −1 and 1. These values indicate how monthly ChlF varies within the years, what can be used to obtain the months when the maximum peaks of ChlF occur (Figure S1). To assess the uncertainty due to data availability, we quantified the number of observations per month per pixel, from the GOME2_F product and calculated mean annual observations for the time series.
2.2. Vegetation Land Mask and Vegetation Types
We used the treecover2000 and the Global Forest Cover Loss from 2000 to 2014 products to define the forest regions in the study area, both obtained from the Global Forest Change Project 2000–2014–GFCP [48]. The treecover2000 product represents the tree canopy cover for year 2000–varying from 0 to 100%. The Global Forest Cover Loss product available from 2000 to 2014 represents the deforested areas between 2000 and 2014. Both treecover2000 and Global Forest Cover Loss products have a spatial resolution of 30 m.
We also obtained a map of vegetation types from the Global Land Cover 2000 (Supplementary Material). Two major types of vegetation were observed in the study area: evergreen tropical forests and semi deciduous transition forests. The remaining types (agricultural areas, urbanization, etc.) were excluded. The vegetation types map is presented in the Figure S2.
2.3. Climate Data
Monthly precipitation data (mm∙month−1) for the 2007–2015 period was obtained from the TRMM-3B43V7 product [45] at a spatial resolution of 0.25°. Additionally, data from 12 rain gauge stations of the Brazilian National Institute of Meteorology (INMET) were used for assessing the quality of TRMM data. We applied a Pearson correlation analysis for quantifying the covariance between the rain gauges and satellite precipitation data (Supplementary Materials). The results of the comparison between TRMM data and ground stations indicate that TRMM captures 95% of the rainfall variability measured by the rain gauges (Supplementary Materials).
Radiation data were obtained from GLDAS reanalysis products [46]. The GLDAS product used in this paper corresponds to monthly surface incident shortwave radiation (W∙m−2)-Version 1, which has a spatial resolution of 0.25° and is generated with the Noah Land Surface Model [49]. A monthly annual mean over the 2007–2015 period was obtained for both climate variables (Supplementary Material). We used maximum monthly temperatures from ground stations of INMET as a proxy for the shortwave radiation for assessing the quality of GLDAS data. A Pearson correlation analysis was employed for quantifying the covariance between ground maximum temperature and GLDAS radiation data (Supplementary Material). The results indicate that GLDAS captures 72% of the maximum monthly temperatures variability measured by the ground stations.
2.4. Data Preparation
The treecover2000 was integrated with the Global Forest Cover Loss product [48], for excluding the deforested areas between 2000–2014. Then, climate and tree cover datasets were resampled by calculating their averages for a 0.5° × 0.5° grid, which corresponds to the original spatial resolution of the GOME2_F data. Mean Annual Precipitation–MAP (Figure S3) and Mean Monthly Precipitation–MMP were obtained by averaging the values of the resampled TRMM-3B43V7 product for each year and month, respectively, between 2007–2015. In order to analyze the relationship between the maximum photosynthesis and the dry season periods in the Amazon forest, we define the period of the dry season as a month with precipitation below 100 mm. This approximation is based on ground-based mean evapotranspiration values collected over the Amazon [50,51,52]. Also, the annual mean dry season length was obtained for each pixel (Figure S5). Finally, the treecover2000 was applied to all datasets. Pixels in all datasets that correspond to a tree cover below 70% in the treecover2000 product were excluded from the analysis. The threshold of 70% for the tree canopy cover was defined due to the gross spatial resolution of the GOME2_F product, as it usually encompasses non-forest areas within the pixels.
2.5. Model Application
For a pixel i, a number of pixels n and a month t, ChlF seasonality—S (ChlF)—was modeled using a linear regression framework as:
where:
- = Intercept of the regression.
- = Radiation coefficient.
- = Precipitation coefficient.
- = Residual of the model.
- = Radiation data.
- = Precipitation data.
For each pixel i (Equation (1)), the coefficient of determination (R2) was computed. Also, we performed the linear relationship between each predictor and ChlF. This correlation was obtained by applying a reduced model, where one of the predictors is omitted. Radiation driven and precipitation-limited areas were obtained by analyzing the R2 of the reduced model. In Equation (2) the reduced model for obtaining the R2 of the linear relationship between radiation and ChlF was applied by omitting the precipitation coefficient:
where:
- = Intercept of the linear relationship between radiation and ChlF.
- = Radiation coefficient of the linear relationship between radiation and ChlF.
In the same way, the reduced model for obtaining R2 from the linear model between precipitation and ChlF was obtained by omitting the radiation coefficient:
where:
- = Intercept of the linear relationship between precipitation and ChlF.
- = Precipitation coefficient of the linear relationship between precipitation and ChlF.
The coefficients of the model for each pixel were estimated by minimizing a negative log-likelihood function. An approximate covariance matrix for the parameters was obtained by inverting the Hessian matrix at the optimum. A confidence interval of 95% was defined for testing the significance of a bilateral test (p-value < 0.025). The standard errors used to determine the confidence interval were obtained by the square roots of the diagonal elements of the covariance matrix. To test the synchronicity between increase in ChlF seasonality and incident radiation we applied the model with one, two and three months lag in radiation (Rad):
where:
- = Intercept of the radiation lagged regression.
- = Radiation coefficient of the radiation lagged regression.
- = Precipitation coefficient of the radiation lagged regression.
We also tested the synchronicity between increase in ChlF seasonality and precipitation by applying the model with one, two and three months lag in precipitation (Pre):
where:
- = Intercept of the precipitation lagged regression.
- = Radiation coefficient of the precipitation lagged regression.
- = Precipitation coefficient of the precipitation lagged regression.
The reduced models were also applied with lags for radiation and precipitation. Lags were applied in order to determine the time when the increasing in ChlF seasonality was synchronous with the increase in incident radiation, such as observed with EVI data in the Amazon [16], and with the increase in precipitation, in order to improve the model performance. The best model of ChlF seasonality was estimated with the radiation or precipitation using lags of 0, 1, 2 and 3 months for each pixel. We discarded the pixels where lagged radiation and precipitation are correlated above a threshold of 0.5, in order to avoid positive correlations introduced by the lags where there was no or negative correlations without lags.
3. Results
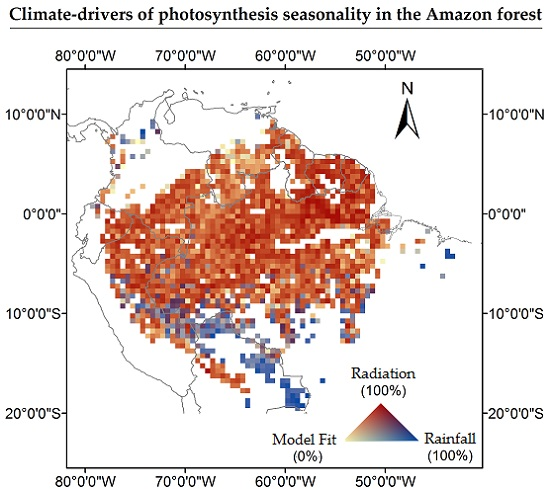
Our model estimated significant coefficients for 83% of the analyzed pixels. This is equivalent to an area of 4,694,678 km2 of extent. Among these pixels, 76% (3,857,216 km2) showed a positive relation between photosynthesis and radiation (Figure 1). For these pixels, the R2 was higher for the radiation coefficient. These areas were mainly located above latitude 7°S. Only 13% of the pixels (461,521 km2) had a positive relation with precipitation. Such pixels presented a R² greater for the precipitation coefficient. These areas were predominately concentrated in southwest and southern Amazonia. The remaining 11% of the pixels (375,941 km2) had a positive relationship and similar R² for both precipitation and radiation. These areas were located mainly in the western portion of Amazonia. The average R2 value for pixels with significant coefficients for the relationship with radiation and precipitation were respectively 0.68 (ranging from 0.15 to 0.95), and 0.75 (ranging from 0.30 to 0.96). In areas where ChlF was significantly related to both radiation and precipitation, the average R² was 0.79 (ranging from 0.53 to 0.97). Precipitation and radiation variables are highly correlated in these areas, thus it is not possible to identify which is the best variable to predict ChlF seasonality. Although the number of ChlF observations increases from the northwest to the southeast Amazonia (Figure S6), this variation had no impact on the model significance.
Southwestern Amazonia is an example of a region where ChlF seasonality is in phase with precipitation seasonality (Area 1 in Figure 1). In this region, the ChlF peaks in January when precipitation is at its maximum (Figure 2a,c). On the other hand, in the northeast region of Amazonia (Area 2 in Figure 1), ChlF seasonality is associated with radiation. ChlF peaks in October, one month after the peak in radiation (Figure 2f).
The model performance improved by applying a lag between radiation and ChlF (Equation (4)) in 61% of the study area (3,438,485 km2) (Figure S7). For these areas, the R² obtained with the radiation lag was significantly higher than the R² obtained with no lags. In southern Amazonia, most of the pixels exhibited a positive relation exclusively with precipitation (13% or 461,521 km2). In central Amazonia, a two-month time lag improved the model output and in northern Amazonia one month time lag provided the best results. Improvements in the model results with the use of three months time lag was only observed in some areas in the southeast and north portions of Amazonia (3% or 161,990 km2).
ChlF seasonality associated with precipitation was observed in areas with an average MAP of 1943 mm yr−1 (Figure 3). Approximately 95% of the areas where ChlF seasonality is associated with precipitation have a MAP between 1075 mm yr−1 and 3275 mm yr−1. In areas where ChlF seasonality is associated with radiation, the average MAP is 2571 mm yr−1, varying from 1840 mm yr−1 to 3625 mm yr−1. The difference between mean MAP values of ChlF seasonality responding to radiation and precipitation is 628 mm yr−1.
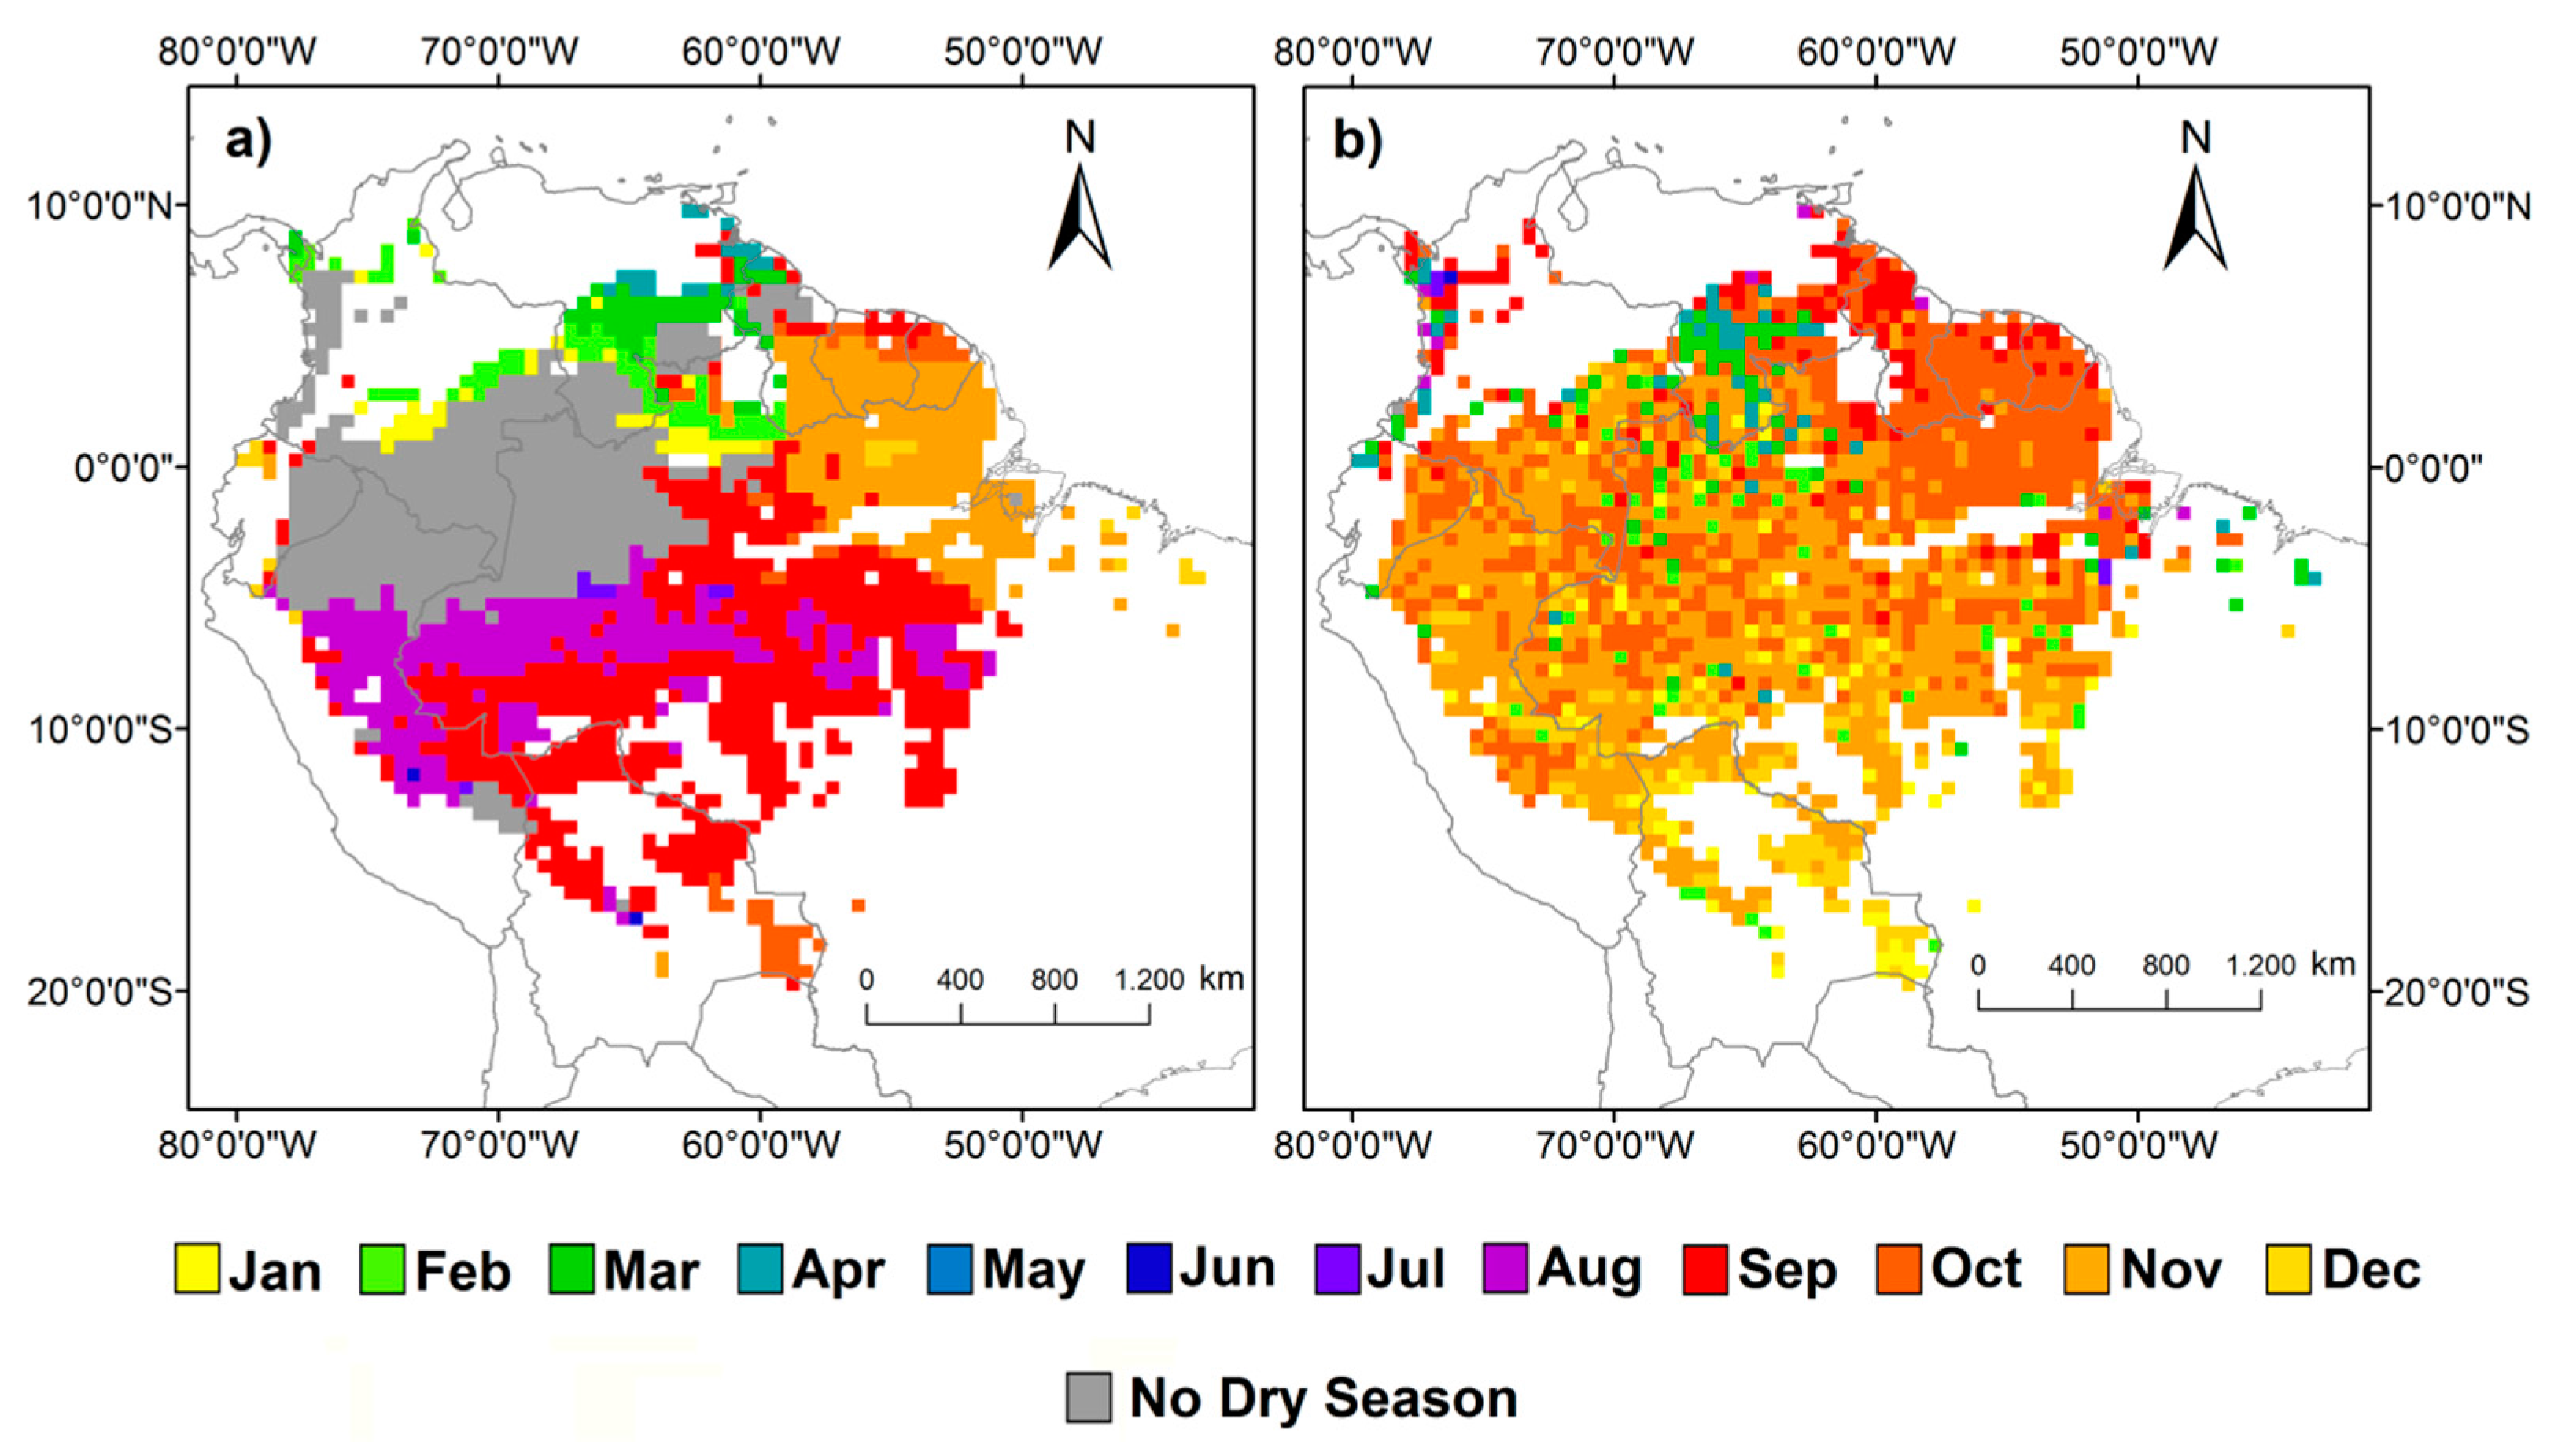
It is estimated that approximately 72% of the study area (4,052,827 km2) has at least one month of dry season during the year (Figure 4a). The dry season ends mostly between August and September in 62.67% (approximately 2,543,149 km2) of the areas where dry season occurs, predominately in the central region. In the northern part of the basin, the dry season ends mostly between January and April, corresponding to 13% (522,649 km2) of the areas where dry season occurs. In the northeast region, the dry season ends mostly in November and December, representing 19% of the areas with dry season (785,503 km2). The dry season ends in October in southern Amazonia, and represents 4% (approximately 177,273 km2) of the areas where dry season occurs. In the remaining areas the dry season ends mostly between June and July.
The maximum values of ChlF occur between September and December for 88% of the Amazon forest (Figure 4b), corresponding to an area of 4,939,157 km2. Maximum ChlF occurring in this period tend to be concentrated in different locations of the basin. The areas where the maximum ChlF peaks occurs in October are predominately in the northeast region, while maximum ChlF in December are more restricted to the southern. Finally, in northern Amazonia, ChlF peaks in September. Areas where maximum ChlF occurs in November are scattered.
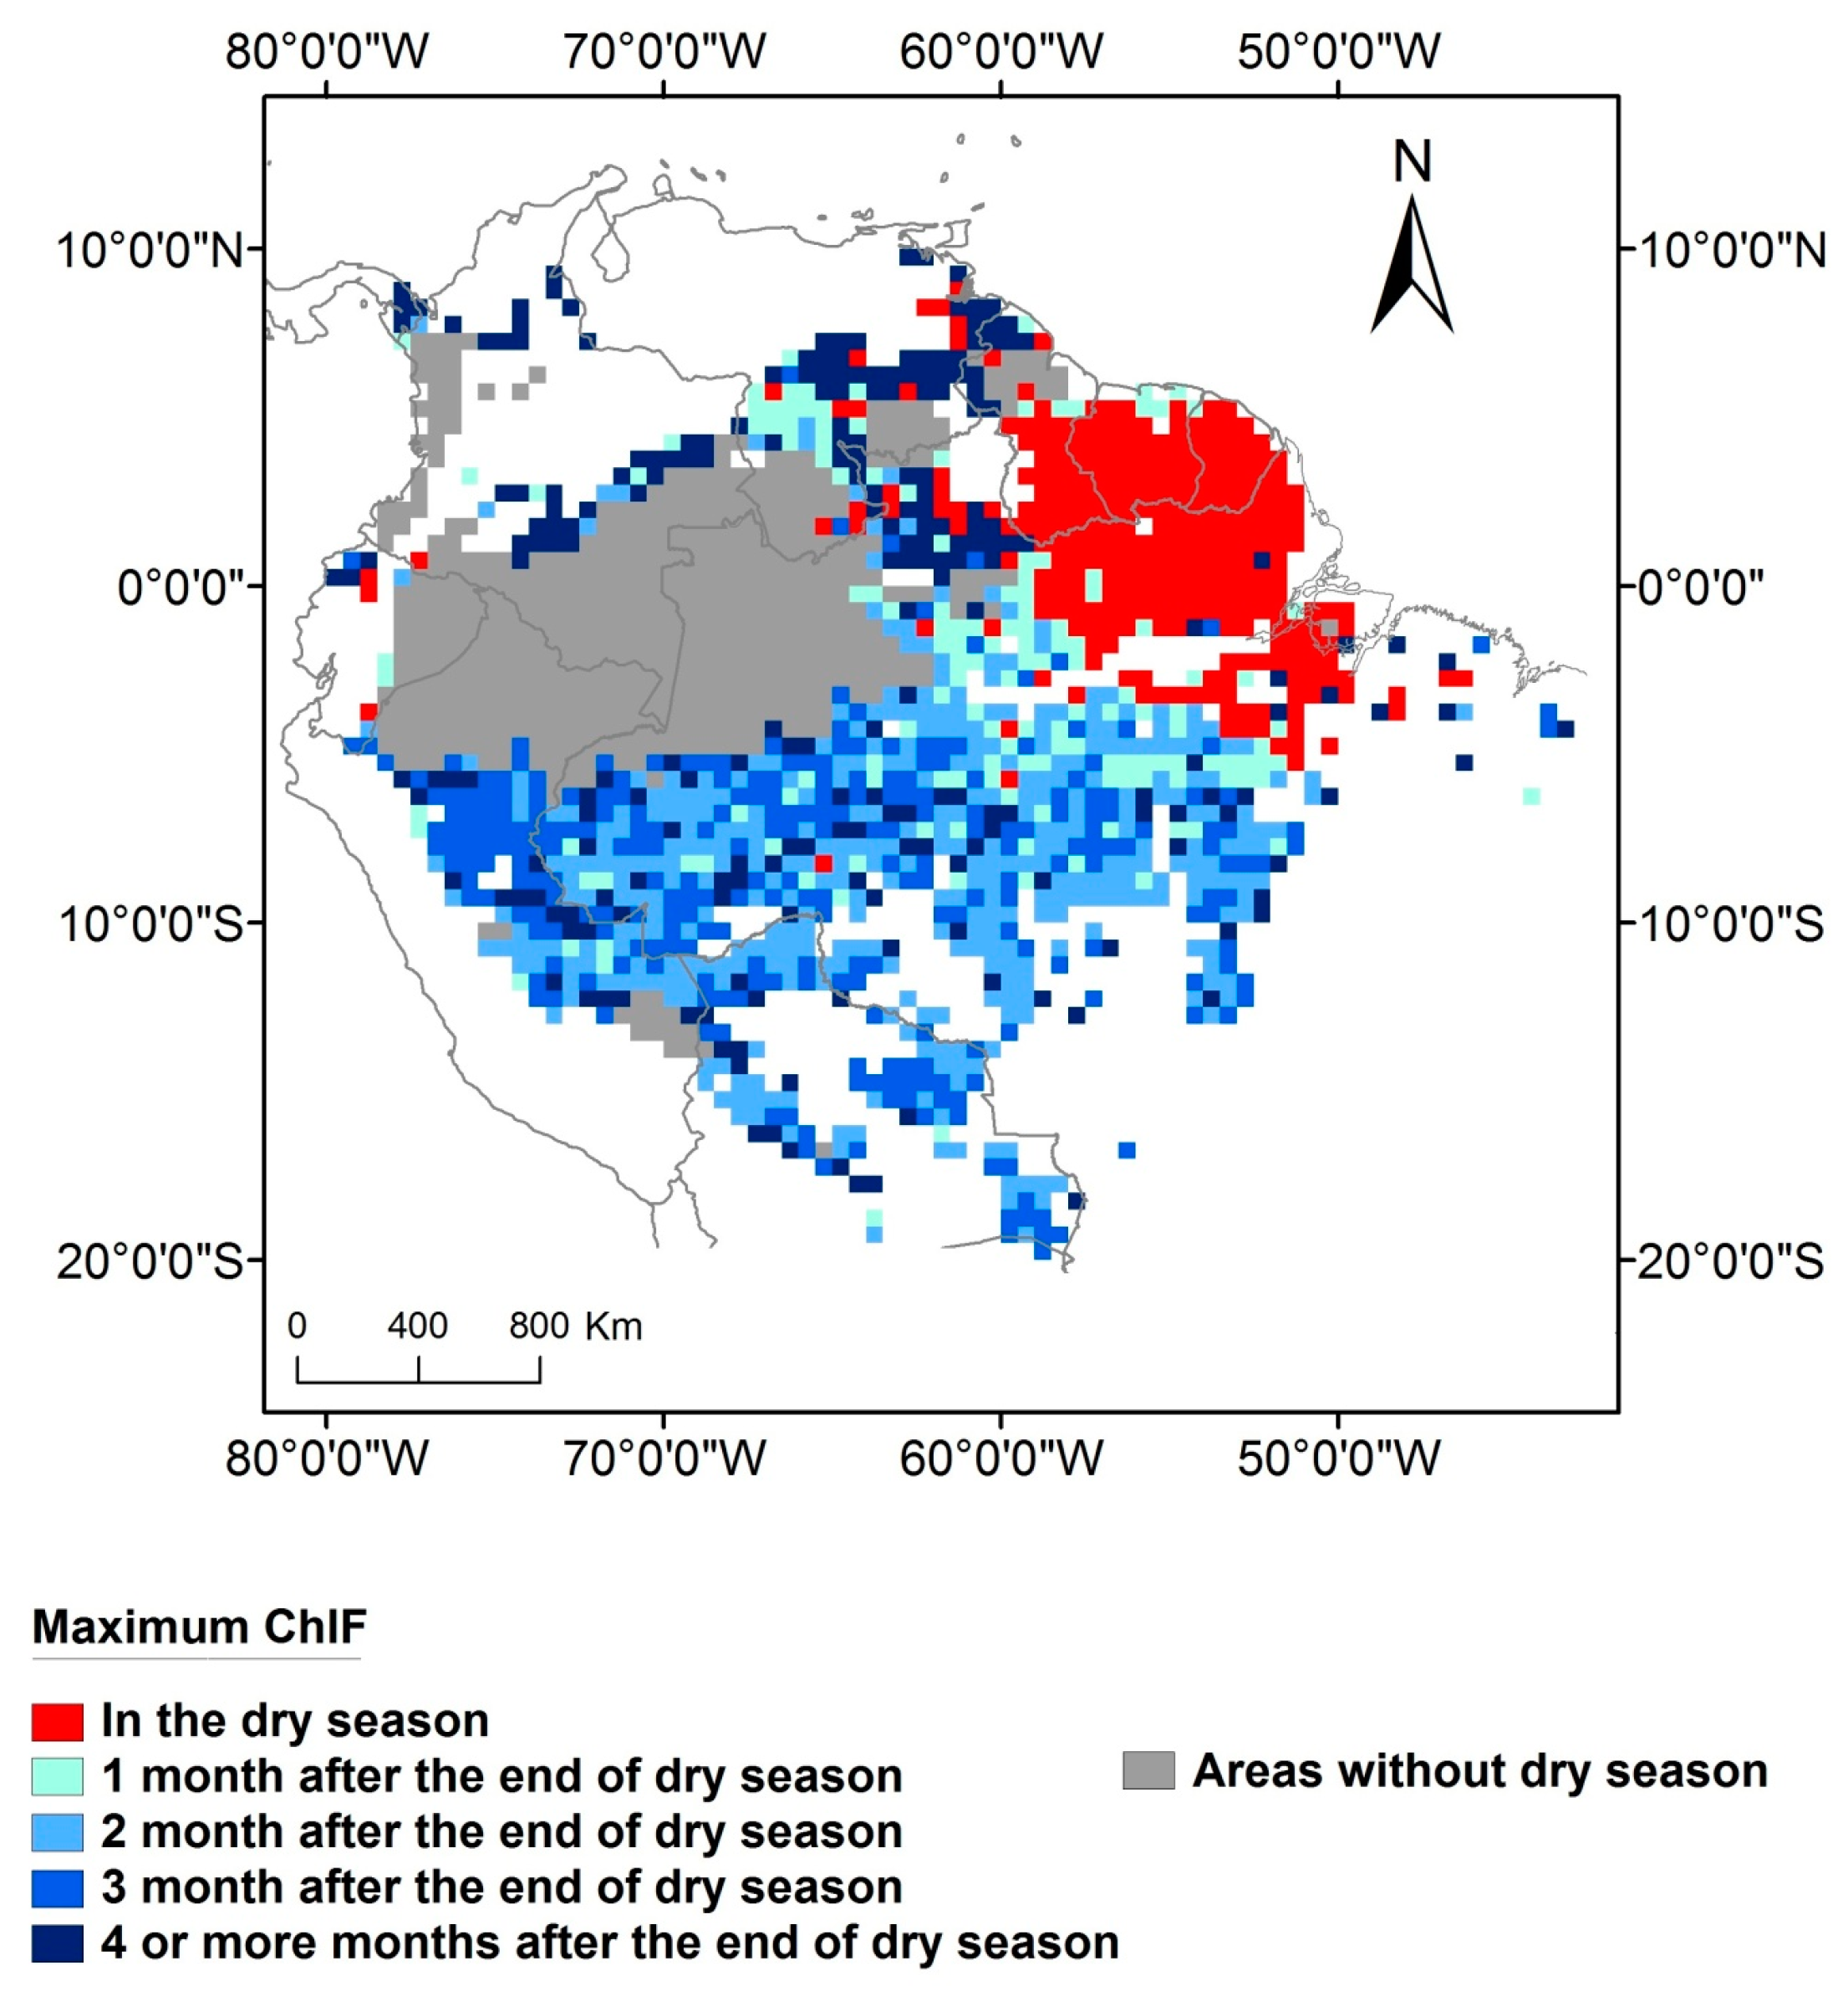
In areas with at least one month of dry season 58% (3,270,381 km2) of the forests have maximum ChlF occurring in the wet season. In most of this area (75% or 2,469,596 km2) ChlF will peak from one to three months after the end of the dry season. The remaining areas with dry season (25% or approximately 800,785 km2) exhibit maximum ChlF four or more months after the end of the dry season. On 14% of the Amazon forest (809,954 km2) which have at least one month of dry season, maximum ChlF occurs within the dry season period. The areas with no dry season (28% of the Amazon forest—1,589,344 km2) are located mainly in the northwest of the basin (Figure 5). In these areas, maximum ChlF occurs mostly in October or November (Figure 4).
4. Discussion
4.1. How Does Photosynthesis Varies as a Function of Climate Seasonality
The positive relationship between ChlF and radiation observed for 76% of the Amazon forest suggests that photosynthesis responds to an increase in radiation and is coherent with independent results obtained with Enhanced Vegetation Index (EVI), which is a proxy for photosynthetic capacity [9,10,11,12,13,14,15,16,50] and Leaf Area Index (LAI) [10,13]. Both EVI and LAI exhibit an increase with sunlight during the dry season in central and eastern Amazon rainforests [7,9,10,11,12,13,14,15,16,19,20,21]. Ground-based eddy flux towers data [6] support our findings of an increasing level of photosynthesis during the dry season (Figure 2b) in the equatorial portion of Amazonian forests (5°N–5°S). This further suggests that such areas are not limited by water, what have been observed with EVI data [16,19]. In these areas, photosynthesis increases mainly from 1 to 3 months after the increase of radiation (Figure 2b,f—ChlF seasonality peaking in October and radiation peaking in September, respectively).
Areas driven by radiation are composed predominately by evergreen forests (Figure S2) and our results indicate that the production of new leaves may compensate the leaf abscission that occurs in the dry season (Figure 2b,d) [53]. Our study supports the evidences that greening, or an increase in photosynthesis activity, occurs mostly in the dry season. This result contradicts the claim that the dry season Greening—observed in the Moderate Resolution Imaging Spectroradiometer (MODIS) EVI data is a result of an artificial increase in the canopy reflectance at near-infrared bands [23].
The application of a time lag over radiation significantly improves the model performance (Figure S7), suggesting a response of vegetation to the radiation increase. In these areas, the increase in radiation possibly causes bud breaking and posterior leaf emergence, leading to the development and the production of new leaves [54,55] (Figure 2b). This process may shift the canopy composition into younger and more light-use efficient leaves, that can explain the observed increase in ChlF [7]. Therefore, the asynchronous relation between photosynthesis and radiation observed in this study may be explained by the trimming of buds and new leaves development.
It is suggested that Amazonian forests use the diffuse photosynthetically active radiation (PAR) more efficiently than direct PAR to make photosynthesis [56]. Therefore, in the early wet season, when more clouds and aerosols are observed [56], and consequently more diffuse PAR, ChlF tend to be higher. This pattern contributes to explain the lags between radiation and photosynthesis identified in our analysis.
However, in water-limited areas, predominantly located in southern Amazonia, the photosynthetic capacity increases with precipitation during the wet season [6]. The increase of photosynthesis was synchronous with the onset of the wet season in these areas (Figure 2a,c). The lags in the precipitation applied in the model worsened the results (Figure S8). The mean R² of the model was 30% lower by applying a one-month lag in precipitation, in relation to the mean R² obtained without lags. Moreover, the mean R² calculated by applying two or three lags were close to zero. This result is consistent with a previously analysis carried out for dry tropical forests, which indicated a quick and synchronous bud break of leafless trees with the wet season onset [57]. Moreover, our results are in agreement with [20], which observed that net leaf flush tends to become more synchronous with water availability as the number of dry months by year increases This suggests that leaf buds are already present in the trees during the dry season, but in a dormant state due to water stress. As the wet season begins, the dormant state is broken and new leaves are produced, resulting in an increase of photosynthesis. In addition, in water limited areas the vegetation is predominately semi deciduous transitional forests, meaning that leaf abscission tends to occur [53] and less or no leaves are produced during the dry season, leading to the decrease in photosynthesis observed in this study (Figure 2a). The occurrence of more deciduous tree communities indicates that the water supply is insufficient to maintain the evergreen state of vegetation in such areas during the dry season [53,58]. It is important to mention that nutrient availability, especially phosphorus, may have an important role in the photosynthetic activity of the Amazon forest, as showed in the study of [59]. However, this effect was not quantified in our study.
4.2. What is the Association between Climate-Drivers of Photosynthesis Seasonality and the Spatial Gradient of Mean Annual Precipitation
Average MAP in water limited areas (1943 mm yr−1) obtained here is close to the 2000 mm yr−1 threshold established by [19]. In areas below this threshold, the differences between the EVI in wet and dry seasons are significantly positive. Our results support this conclusion in these areas, as the photosynthesis achieved its minimum during the dry season and its maximum during the wet season (Figure 2a,c). Areas with the same MAP can have the increase of photosynthesis related to radiation, precipitation or a combination of both. In some cases, no relationship between photosynthesis and the analyzed factors is observed. Other factors, such as forest structure, composition, soil water storage capacity and nutrients can also influence the photosynthetic activity, thus more studies investigating the role of these variables upon the photosynthetic process at a large scale are required. It is important to note that only 11% of the study area that is positively associated to radiation has MAP below the 2000 mm yr−1 threshold. Therefore, almost all of the radiation-associated areas are not limited by water supply. It is possible that areas that are positively associated to radiation and have a MAP equal or lower than the ~1943 mm yr−1 threshold will be more threatened by future climate changes [60]. If the amazon gets drier [60], such areas may become limited by water.
4.3. When is the Peak of Maximum Photosynthesis Activity in Amazonia
The peak of photosynthesis during the wet season is observed in 58% of Amazonia (Figure 5). This pattern is similar to the LAI pattern [10] reported for central Amazonia (Figure 1a of [10]) where LAI peaks at the wet season onset. The occurrence of the maximum photosynthesis during the wet season is supported by three complementary explanations. First, the maximum photosynthesis observed in the early wet season is likely to occur in response to the water recharge of soils at the wet season onset. Most areas with maximum photosynthesis occurring one or two months after the end of the dry season have at least three months of dry season (Figure S5). Second, in parts of northern and central Amazonia, precipitation is in phase with radiation (Figure 3 of [61]). Therefore, in fact, maximum ChlF occurs during the wet season because maximum radiation coincides with the onset of the wet season. Third, as vegetation uses diffuse PAR more efficiently than direct PAR [56], the increase in the diffuse fraction of PAR related to increased clouds and aerosols during the onset of the wet season is likely to favor the photosynthetic process, after the radiation peaks in the dry season.
However, in the northeast flank of Amazonia—more specifically—in the Guiana Shield, maximum photosynthesis occurs predominately in the dry season and is strongly associated with radiation (Figure 5). Negative correlations between ChlF and soil humidity and between ChlF and minimum temperature that have been observed in the Guiana Shield [26] are coherent with the results obtained here. As photosynthesis seasonality in this region appears to be not limited by soil water availability, then the observed peak in the dry season, is a function of maximum radiation (Figure 2f). Northeast Amazonian forests presented the most negative difference between ChlF in the wet and dry season (ChlFwet–ChlFdry) among all the tropical forests [19]. Vegetation characteristics, such as deeply rooted trees, or soil characteristics of this region allow vegetation to access soil water supply during the dry season [62,63]. Although the maximum photosynthesis occurs during the dry season, the length of the dry season in these regions is shorter than most part of the basin where maximum photosynthesis occurs in the wet season (Figure S5).
Finally, despite not being measured in our study, it is important to highlight that soil fertility may be another variable that can affect the photosynthetic process. Higher Net Primary Productivity (NPP) in Amazonia is directly correlated with higher soil fertility, particularly phosphorus [59,64]. However, the spatial patterns observed from forest productivity seem unrelated to atmospheric nutrient deposition patterns in this region [65,66]. It has been suggested that Amazonia may be losing phosphorus to adjacent oceans and in other regions downwind [65]. If it is the case, and somehow the atmospheric nutrient deposition plays a role in the Amazonian photosynthesis, a decrease in photosynthetic capacity should be observed through time. However, our method removes temporal trends in the dataset and therefore this effect should not impact our results.
Consistency in modeling photosynthesis through precipitation and radiation gradients was obtained despite the low spatial resolution of GOME-2 data. Our results are coherent with previous studies using EVI to estimate photosynthetic capacity in the Amazon forest [9,10,11,12,13,14,15,16,54]. These studies showed an increase in photosynthesis during the dry season in areas without water limitation, as observed here. It is important to note that the METOP-A mission, as well as the GOSAT [63], were not planned for studying ChlF. However, the high spectral resolution of GOME-2 sensor and the location of their spectral bands, covering the ChlF spectrum, made possible to retrieve ChlF using this sensor. The launch of the Fluorescence Explorer Mission–FLEX (the European Space Agency–ESA’s Living Planet Programme) scheduled to 2022 is being developed specifically for obtaining ChlF [63]. The launch of the FLEX may overcome the low spatial resolution limitation inherent to current satellites measuring ChlF. In addition, the FLEX will be able to retrieve the entire ChlF broadband spectrum and will allow the calculation of other vegetation parameters from the Top of the Atmosphere (TOA) radiance obtained by FLEX, such as LAI and chlorophyll content.
5. Conclusions
Photosynthesis seasonality tends to increase during the dry season in areas with positive relation between photosynthesis and radiation (76% of Amazonia) and during the wet months in water limited areas (13% of Amazonia), while in the remaining areas (11%) the photosynthesis seasonality was significantly related to both radiation and precipitation. Photosynthesis seasonality increases synchronously with the wet season onset in water-limited areas, while in most of radiation-driven areas the photosynthesis seasonality increases with a time lag between 1 to 3 months after the radiation increase. It may indicate that in water limited vegetation leaf buds maintain a dormant state during the dry season, and younger and more light-use efficient leaves are produced in the wet season onset, which causes the increase in photosynthesis activity during this time period. The observed time lag in radiation-driven areas may be related to the time needed by vegetation to produce leaf buds and subsequent bud break. Amazonian forests may use the diffuse PAR more efficiently than direct PAR, what occurs in the early wet season and also can explain the lags observed here. Interestingly, in northeast Amazonia maximum photosynthesis occurs predominately during the dry season, a feature that is not observed in the rest of the basin. It suggests that this region is not limited by water and photosynthesis seasonality is driven solely by radiation.
The value of the mean annual precipitation able to support the evergreen state of Amazonia for areas limited by water obtained here (1943 mm yr−1) was close to the threshold established by [19]. Above a 3275 mm yr−1 precipitation threshold the production of new leaves seasonality depends almost exclusively on the incident radiation seasonality, while below a threshold of 1635 mm yr−1 the production of new leaves is only limited by precipitation. Areas where photosynthesis is driven by radiation and have a MAP close to the ≈1943 mm yr−1 threshold can potentially turn into water limited forests due to the expected increase in the frequency and intensity of extreme droughts [67]. If this climatic shift occurs, vegetation in these areas are likely to change towards a forest dominated by deciduous tree communities instead of the evergreen forests.
Supplementary Materials
The following are available online at www.mdpi.com/2072-4292/9/12/1275/s1, Figure S1: Components obtained by decoupling the ChlF observed data; Figure S2: Dominant vegetation types occurring in the study area; Figure S3: Mean annual precipitation of the 2007–2015 period obtained from TRMM; Figure S4: Monthly precipitation values obtained from the Caracarai INMET station and from the TRMM pixel where this station is located; Figure S5: Length of the dry seasons occurring in the study area; Figure S6: Mean Annual Count of ChlF observations from the GOME-2 sensor; Figure S7: Best fit in the model by applying one, two, three months lag or no lag in the radiation component; Figure S8: Coefficient of determination obtained by applying the model with (a) Zero; (b) One; (c) Two and (d) Three month lags in precipitation (Pre); Table S1: Pearson correlation coefficients obtained between the INMET stations and the corresponded pixels in the TRMM time series; Table S2: Pearson correlation coefficients obtained between the INMET stations and the corresponded pixels in the GLDAS time series.
Acknowledgments
We gratefully acknowledge the CAPES and FAPESP (Grants No. 13/14520-6 and No. 2013/50533-5) agencies for providing research fellowships and support this work. L.O.A and L.E.O.C.A thank the National Council for Scientific and Technological Development (CNPq), for the productivity fellowship, processes number 309247/2016-0 and 305054/2016-3, respectively. F.H.W. have been funded by the FAPESP (process number 13/14520-6, process number 15/50484-0 and process number 16/17652-9).
Author Contributions
Luiz E. O. C. Aragão, Fabien H. Wagner and Liana O. Anderson led in the design of the experiment. Gabriel Bertani and Fabien H. Wagner performed data analysis. Gabriel Bertani, Luiz E. O. C. Aragão, Fabien H. Wagner and Liana O. Anderson interpreted the results. Gabriel Bertani wrote the paper with significant contributions from all authors.
Conflicts of Interest
The authors declare no conflict of interest.
References
- Cox, P.M.; Betts, R.A.; Jones, C.D.; Spall, S.A.; Totterdell, I.J. Acceleration of global warming due to carbon-cycle feedbacks in a coupled climate model. Nature 2000, 408, 184–187. [Google Scholar] [CrossRef] [PubMed]
- Cox, P.M.; Betts, R.A.; Collins, M.; Harris, P.P.; Huntingford, C.; Jones, C.D. Amazonian forest dieback under climate-carbon cycle projections for the 21st century. Theor. Appl. Climatol. 2004, 78. [Google Scholar] [CrossRef]
- Nobre, C.A.; Sellers, P.J.; Shukla, J. Amazonian deforestation and regional climate change. J. Clim. 1991, 4, 957–988. [Google Scholar] [CrossRef]
- De Sousa, C.; Hilker, T.; Waring, R.; de Moura, Y.; Lyapustin, A. Progress in remote sensing of photosynthetic activity over the amazon basin. Remote Sens. 2017, 9, 48. [Google Scholar] [CrossRef]
- Zhao, M.; Running, S.W. Drought-induced reduction in global terrestrial net primary production from 2000 through 2009. Science 2010, 329, 940–943. [Google Scholar] [CrossRef] [PubMed]
- Restrepo-Coupe, N.; da Rocha, H.R.; Hutyra, L.R.; da Araujo, A.C.; Borma, L.S.; Christoffersen, B.; Cabral, O.M.R.; de Camargo, P.B.; Cardoso, F.L.; da Costa, A.C.L.; et al. What drives the seasonality of photosynthesis across the amazon basin? A cross-site analysis of eddy flux tower measurements from the brasil flux network. Agric. For. Meteorol. 2013, 182–183, 128–144. [Google Scholar] [CrossRef]
- Wu, J.; Albert, L.P.; Lopes, A.P.; Restrepo-Coupe, N.; Hayek, M.; Wiedemann, K.T.; Guan, K.; Stark, S.C.; Christoffersen, B.; Prohaska, N.; et al. Leaf development and demography explain photosynthetic seasonality in amazon evergreen forests. Science 2016, 351, 972–976. [Google Scholar] [CrossRef] [PubMed]
- Huete, A.; Didan, K.; Miura, T.; Rodriguez, E.; Gao, X.; Ferreira, L. Overview of the radiometric and biophysical performance of the MODIS vegetation indices. Remote Sens. Environ. 2002, 83, 195–213. [Google Scholar] [CrossRef]
- Huete, A.R.; Didan, K.; Shimabukuro, Y.E.; Ratana, P.; Saleska, S.R.; Hutyra, L.R.; Yang, W.; Nemani, R.R.; Myneni, R. Amazon rainforests green-up with sunlight in dry season. Geophys. Res. Lett. 2006, 33. [Google Scholar] [CrossRef]
- Bi, J.; Knyazikhin, Y.; Choi, S.; Park, T.; Barichivich, J.; Ciais, P.; Fu, R.; Ganguly, S.; Hall, F.; Hilker, T.; et al. Sunlight mediated seasonality in canopy structure and photosynthetic activity of Amazonian rainforests. Environ. Res. Lett. 2015, 10. [Google Scholar] [CrossRef]
- Brando, P.M.; Goetz, S.J.; Baccini, A.; Nepstad, D.C.; Beck, P.S.; Christman, M.C. Seasonal and interannual variability of climate and vegetation indices across the amazon. Proc. Natl. Acad. Sci. USA 2010, 107, 14685–14690. [Google Scholar] [CrossRef] [PubMed]
- Lopes, A.P.; Nelson, B.W.; Wu, J.; Graça, P.M.L.d.A.; Tavares, J.V.; Prohaska, N.; Martins, G.A.; Saleska, S.R. Leaf flush drives dry season green-up of the central amazon. Remote Sens. Environ. 2016, 182, 90–98. [Google Scholar] [CrossRef]
- Myneni, R.B.; Yang, W.; Nemani, R.R.; Huete, A.R.; Dickinson, R.E.; Knyazikhin, Y.; Didan, K.; Fu, R.; Juárez, R.T.N.; Saatchi, S.S.; et al. Large seasonal swings in leaf area of Amazon rainforests. Proc. Natl. Acad. Sci. USA 2007, 104, 4820–4823. [Google Scholar] [CrossRef] [PubMed]
- Saleska, S.R.; Didan, K.; Huete, A.R.; da Rocha, H.R. Amazon forests green-up during 2005 drought. Science 2007, 318, 612. [Google Scholar] [CrossRef] [PubMed]
- Wagner, F.H.; Hérault, B.; Bonal, D.; Stahl, C.; Anderson, L.O.; Baker, T.R.; Becker, G.S.; Beeckman, H.; Boanerges, S.D.; Botosso, P.C.; et al. Climate seasonality limits leaf carbon assimilation and wood productivity in tropical forests. Biogeosciences 2016, 13, 2537–2562. [Google Scholar] [CrossRef] [Green Version]
- Wagner, F.H.; Herault, B.; Rossi, V.; Hilker, T.; Maeda, E.E.; Sanchez, A.; Lyapustin, A.I.; Galvao, L.S.; Wang, Y.; Aragao, L. Climate drivers of the amazon forest greening. PLoS ONE 2017, 12, e0180932. [Google Scholar] [CrossRef] [PubMed]
- Maeda, E.E.; Moura, Y.M.; Wagner, F.; Hilker, T.; Lyapustin, A.I.; Wang, Y.; Chave, J.; Mõttus, M.; Aragão, L.E.O.C.; Shimabukuro, Y. Consistency of vegetation index seasonality across the amazon rainforest. Int. J. Appl. Earth Obs. Geoinform. 2016, 52, 42–53. [Google Scholar] [CrossRef]
- De Moura, Y.M.; Galvão, L.S.; Hilker, T.; Wu, J.; Saleska, S.; do Amaral, C.H.; Nelson, B.W.; Lopes, A.P.; Wiedeman, K.K.; Prohaska, N.; et al. Spectral analysis of amazon canopy phenology during the dry season using a tower hyperspectral camera and modis observations. ISPRS J. Photogramm. Remote Sens. 2017, 131, 52–64. [Google Scholar] [CrossRef]
- Guan, K.; Pan, M.; Li, H.; Wolf, A.; Wu, J.; Medvigy, D.; Caylor, K.K.; Sheffield, J.; Wood, E.F.; Malhi, Y.; et al. Photosynthetic seasonality of global tropical forests constrained by hydroclimate. Nat. Geosci. 2015, 8, 284–289. [Google Scholar] [CrossRef]
- Jones, M.O.; Kimball, J.S.; Nemani, R.R. Asynchronous amazon forest canopy phenology indicates adaptation to both water and light availability. Environ. Res. Lett. 2014, 9. [Google Scholar] [CrossRef]
- Saleska, S.R.; Wu, J.; Guan, K.; Araujo, A.C.; Huete, A.; Nobre, A.D.; Restrepo-Coupe, N. Dry-season greening of amazon forests. Nature 2016, 531, E4–E5. [Google Scholar] [CrossRef] [PubMed]
- Galvão, L.S.; dos Santos, J.R.; Roberts, D.A.; Breunig, F.M.; Toomey, M.; de Moura, Y.M. On intra-annual evi variability in the dry season of tropical forest: A case study with modis and hyperspectral data. Remote Sens. Environ. 2011, 115, 2350–2359. [Google Scholar] [CrossRef]
- Morton, D.C.; Nagol, J.; Carabajal, C.C.; Rosette, J.; Palace, M.; Cook, B.D.; Vermote, E.F.; Harding, D.J.; North, P.R. Amazon forests maintain consistent canopy structure and greenness during the dry season. Nature 2014, 506, 221–224. [Google Scholar] [CrossRef] [PubMed]
- Anderson, L.O.; Malhi, Y.; Aragão, L.E.O.C.; Ladle, R.; Arai, E.; Barbier, N.; Phillips, O. Remote sensing detection of droughts in Amazonian forest canopies. New Phytol. 2010, 187, 733–750. [Google Scholar] [CrossRef] [PubMed]
- Lyapustin, A.I.; Wang, Y.; Laszlo, I.; Hilker, T.; Hall, F.G.; Sellers, P.J.; Tucker, C.J.; Korkin, S.V. Multi-angle implementation of atmospheric correction for modis (MAIAC): 3. Atmospheric correction. Remote Sens. Environ. 2012, 127, 385–393. [Google Scholar] [CrossRef]
- Madani, N.; Kimball, J.; Jones, L.; Parazoo, N.; Guan, K. Global analysis of bioclimatic controls on ecosystem productivity using satellite observations of solar-induced chlorophyll fluorescence. Remote Sens. 2017, 9. [Google Scholar] [CrossRef]
- Joiner, J.; Yoshida, Y.; Guanter, L.; Lindstrot, R.; Voigt, M.; Jung, M.; Vasilkov, A.; Middleton, E.; Huemmrich, K.F.; Tucker, C.J.; et al. New Measurements of Chlorophyll Fluorescence with Gome-2 and Comparisons with the Seasonal Cycle of GPP from Flux Towers. In Proceedings of the 5th International Workshop on Remote Sensing of Vegetation Fluoresce NCE, Paris, France, 22–24 April 2014; pp. 7–11. [Google Scholar]
- Lee, J.E.; Frankenberg, C.; van der Tol, C.; Berry, J.A.; Guanter, L.; Boyce, C.K.; Fisher, J.B.; Morrow, E.; Worden, J.R.; Asefi, S.; et al. Forest productivity and water stress in Amazonia: Observations from GOSAT chlorophyll fluorescence. Proc. Biol. Sci. 2013, 280. [Google Scholar] [CrossRef] [PubMed]
- Parazoo, N.C.; Bowman, K.; Frankenberg, C.; Lee, J.-E.; Fisher, J.B.; Worden, J.; Jones, D.B.A.; Berry, J.; Collatz, G.J.; Baker, I.T.; et al. Interpreting seasonal changes in the carbon balance of southern Amazonia using measurements of XCO2 and chlorophyll fluorescence from GOSAT. Geophys. Res. Lett. 2013, 40, 2829–2833. [Google Scholar] [CrossRef]
- Parazoo, N.C.; Bowman, K.; Fisher, J.B.; Frankenberg, C.; Jones, D.B.; Cescatti, A.; Perez-Priego, O.; Wohlfahrt, G.; Montagnani, L. Terrestrial gross primary production inferred from satellite fluorescence and vegetation models. Glob. Chang. Biol. 2014, 20, 3103–3121. [Google Scholar] [CrossRef] [PubMed]
- Joiner, J.; Yoshida, Y.; Vasilkov, A.P.; Yoshida, Y.; Corp, L.A.; Middleton, E.M. First observations of global and seasonal terrestrial chlorophyll fluorescence from space. Biogeosciences 2011, 8, 637–651. [Google Scholar] [CrossRef] [Green Version]
- Maxwell, K.; Johnson, G.N. Chlorophyll fluorescence—A practical guide. J. Exp. Bot. 2000, 51, 659–668. [Google Scholar] [CrossRef] [PubMed]
- Liu, X.; Liu, L.; Zhang, S.; Zhou, X. New spectral fitting method for full-spectrum solar-induced chlorophyll fluorescence retrieval based on principal components analysis. Remote Sens. 2015, 7, 10626–10645. [Google Scholar] [CrossRef]
- Köhler, P.; Guanter, L.; Joiner, J. A linear method for the retrieval of sun-induced chlorophyll fluorescence from gome-2 and sciamachy data. Atmos. Meas. Tech. 2015, 8, 2589–2608. [Google Scholar] [CrossRef]
- Ni, Z.; Liu, Z.; Li, Z.-L.; Nerry, F.; Huo, H.; Sun, R.; Yang, P.; Zhang, W. Investigation of atmospheric effects on retrieval of sun-induced fluorescence using hyperspectral imagery. Sensors 2016, 16, 480. [Google Scholar] [CrossRef] [PubMed]
- Joiner, J.; Yoshida, Y.; Guanter, L.; Middleton, E.M. New methods for the retrieval of chlorophyll red fluorescence from hyperspectral satellite instruments: Simulations and application to gome-2 and sciamachy. Atmos. Meas. Tech. 2016, 9, 3939–3967. [Google Scholar] [CrossRef]
- Du, S.; Liu, L.; Liu, X.; Hu, J. Response of canopy solar-induced chlorophyll fluorescence to the absorbed photosynthetically active radiation absorbed by chlorophyll. Remote Sens. 2017, 9, 911. [Google Scholar] [CrossRef]
- Meroni, M.; Rossini, M.; Guanter, L.; Alonso, L.; Rascher, U.; Colombo, R.; Moreno, J. Remote sensing of solar-induced chlorophyll fluorescence: Review of methods and applications. Remote Sens. Environ. 2009, 113, 2037–2051. [Google Scholar] [CrossRef]
- Joiner, J.; Yoshida, Y.; Vasilkov, A.P.; Middleton, E.M.; Campbell, P.K.E.; Yoshida, Y.; Kuze, A.; Corp, L.A. Filling-in of near-infrared solar lines by terrestrial fluorescence and other geophysical effects: Simulations and space-based observations from sciamachy and gosat. Atmos. Meas. Tech. 2012, 5, 809–829. [Google Scholar] [CrossRef]
- Amoros-Lopez, J.; Gomez-Chova, L.; Vila-Frances, J.; Alonso, L.; Calpe, J.; Moreno, J.; del Valle-Tascon, S. Evaluation of remote sensing of vegetation fluorescence by the analysis of diurnal cycles. Int. J. Remote Sens. 2008, 29, 5423–5436. [Google Scholar] [CrossRef]
- Joiner, J.; Guanter, L.; Lindstrot, R.; Voigt, M.; Vasilkov, A.P.; Middleton, E.M.; Huemmrich, K.F.; Yoshida, Y.; Frankenberg, C. Global monitoring of terrestrial chlorophyll fluorescence from moderate-spectral-resolution near-infrared satellite measurements: Methodology, simulations, and application to gome-2. Atmos. Meas. Tech. 2013, 6, 2803–2823. [Google Scholar] [CrossRef]
- Van Wittenberghe, S.; Alonso, L.; Verrelst, J.; Moreno, J.; Samson, R. Bidirectional sun-induced chlorophyll fluorescence emission is influenced by leaf structure and light scattering properties—A bottom-up approach. Remote Sens. Environ. 2015, 158, 169–179. [Google Scholar] [CrossRef]
- Flexas, J.; Escalona, J.M.; Evain, S.; Gulías, J.; Moya, I.; Osmond, C.B.; Medrano, H. Steady-state chlorophyll fluorescence (fs) measurements as a tool to follow variations of net CO2 assimilation and stomatal conductance during water-stress in C3 plants. Physiol. Plant. 2002, 114, 231–240. [Google Scholar] [CrossRef] [PubMed]
- Guanter, L.; Frankenberg, C.; Dudhia, A.; Lewis, P.E.; Gómez-Dans, J.; Kuze, A.; Suto, H.; Grainger, R.G. Retrieval and global assessment of terrestrial chlorophyll fluorescence from GOSAT space measurements. Remote Sens. Environ. 2012, 121, 236–251. [Google Scholar] [CrossRef]
- Huffman, G.J.; Bolvin, D.T.; Nelkin, E.J.; Wolff, D.B.; Adler, R.F.; Gu, G.; Hong, Y.; Bowman, K.P.; Stocker, E.F. The TRMM multisatellite precipitation analysis (TMPA): Quasi-global, multiyear, combined-sensor precipitation estimates at fine scales. J. Hydrometeorol. 2007, 8, 38–55. [Google Scholar] [CrossRef]
- Rodell, M.; Houser, P.R.; Jambor, U.; Gottschalck, J.; Mitchell, K.; Meng, C.J.; Arsenault, K.; Cosgrove, B.; Radakovich, J.; Bosilovich, M.; et al. The global land data assimilation system. Bull. Am. Meteorol. Soc. 2004, 85, 381–394. [Google Scholar] [CrossRef]
- Verbesselt, J.; Hyndman, R.; Zeileis, A.; Culvenor, D. Phenological change detection while accounting for abrupt and gradual trends in satellite image time series. Remote Sens. Environ. 2010, 114, 2970–2980. [Google Scholar] [CrossRef]
- Hansen, M.C.; Potapov, PV.; Moore, R.; Hancher, M.; Turubanova, S.A.; Tyukavina, A.; Thau, D.; Stehman, S.V.; Goet, S.J.; Loveland, T.R.; et al. High-resolution global maps of 21st-century forest cover change. Science 2013, 342, 850–853. [Google Scholar] [CrossRef] [PubMed]
- Koren, V.; Schaake, J.; Mitchell, K.; Duan, Q.Y.; Chen, F.; Baker, J.M. A parameterization of snowpack and frozen ground intended for NCEP weather and climate models. J. Geophys. Res. Atmos. 1999, 104, 19569–19585. [Google Scholar] [CrossRef]
- Da Rocha, H.R.; Goulden, M.L.; Miller, S.D.; Menton, M.C.; Pinto, L.D.V.O.; de Freitas, H.C.; E Silva Figueira, A.M. Seasonality of water and heat fluxes over a tropical forest in eastern Amazonia. Ecol. Appl. 2004, 14, 22–32. [Google Scholar] [CrossRef]
- Shuttleworth, W.J. Evaporation from Amazonian rainforest. Proc. R. Soc. Lond. Ser. B Biol. Sci. 1988, 233, 321–346. [Google Scholar] [CrossRef]
- Von Randow, C.; Manzi, A.O.; Kruijt, B.; de Oliveira, P.J.; Zanchi, F.B.; Silva, R.L.; Hodnett, M.G.; Gash, J.H.C.; Elbers, J.A.; Waterloo, M.J.; et al. Comparative measurements and seasonal variations in energy and carbon exchange over forest and pasture in south west Amazonia. Theor. Appl. Climatol. 2004, 78, 5–26. [Google Scholar] [CrossRef]
- Chave, J.; Navarrete, D.; Almeida, S.; Álvarez, E.; Aragão, L.E.O.C.; Bonal, D.; Châtelet, P.; Silva-Espejo, J.E.; Goret, J.Y.; von Hildebrand, P.; et al. Regional and seasonal patterns of litterfall in tropical South America. Biogeosciences 2010, 7, 43–55. [Google Scholar] [CrossRef] [Green Version]
- Girardin, C.A.J.; Malhi, Y.; Doughty, C.E.; Metcalfe, D.B.; Meir, P.; del Aguila-Pasquel, J.; Araujo-Murakami, A.; da Costa, A.C.L.; Silva-Espejo, J.E.; Farfán Amézquita, F.; et al. Seasonal trends of Amazonian rainforest phenology, net primary productivity, and carbon allocation. Glob. Biogeochem. Cycles 2016, 30, 700–715. [Google Scholar] [CrossRef]
- Klebs, G. Über das Treiben der Einheimischen Bäume, Speziell der Buche, Abhandl; Heidelberger Akad. Wiss. Math. Nat. Kl.: Heidelberge, Germany, 2014; Volume 3, pp. 1–112. (In German) [Google Scholar]
- Cirino, G.G.; Souza, R.A.F.; Adams, D.K.; Artaxo, P. The effect of atmospheric aerosol particles and clouds on net ecosystem exchange in the amazon. Atmos. Chem. Phys. 2014, 14, 6523–6543. [Google Scholar] [CrossRef] [Green Version]
- Borchert, R.; Calle, Z.; Strahler, A.H.; Baertschi, A.; Magill, R.E.; Broadhead, J.S.; Kamau, J.; Njoroge, J.; Muthuri, C. Insolation and photoperiodic control of tree development near the equator. New Phytol. 2015, 205, 7–13. [Google Scholar] [CrossRef] [PubMed]
- Enquist, B.J.; Enquist, C.A.F. Long-term change within a Neotropical forest: Assessing differential functional and floristic responses to disturbance and drought. Glob. Chang. Biol. 2011, 17, 1408–1424. [Google Scholar] [CrossRef]
- Mercado, L.M.; Patino, S.; Domingues, T.F.; Fyllas, N.M.; Weedon, G.P.; Sitch, S.; Quesada, C.A.; Phillips, O.L.; Aragao, L.E.; Malhi, Y.L.; et al. Variations in amazon forest productivity correlated with foliar nutrients and modelled rates of photosynthetic carbon supply. Philos. Trans. R. Soc. Lond. B Biol. Sci. 2011, 366, 3316–3329. [Google Scholar] [CrossRef] [PubMed]
- Feng, X.; Porporato, A.; Rodriguez-Iturbe, I. Changes in rainfall seasonality in the tropics. Nat. Clim. Chang. 2013, 3, 811–815. [Google Scholar] [CrossRef]
- Bradley, A.V.; Gerard, F.F.; Barbier, N.; Weedon, G.P.; Anderson, L.O.; Huntingford, C.; AragÃO, L.E.O.C.; Zelazowski, P.; Arai, E. Relationships between phenology, radiation and precipitation in the amazon region. Glob. Chang. Biol. 2011, 17, 2245–2260. [Google Scholar] [CrossRef]
- Nepstad, D.C.; de Carvalho, C.R.; Davidson, E.A.; Jipp, P.H.; Lefebvre, P.A.; Negreiros, G.H.; da Silva, E.D.; Stone, T.A.; Trumbore, S.E.; Vieira, S. The role of deep roots in the hydrological and carbon cycles of Amazonian forests and pastures. Nature 1994, 372, 666–669. [Google Scholar] [CrossRef]
- Oliveira, R.S.; Dawson, T.E.; Burgess, S.S.O.; Nepstad, D.C. Hydraulic redistribution in three Amazonian trees. Oecologia 2005, 145, 354–363. [Google Scholar] [CrossRef] [PubMed]
- Aragão, L.E.O.C.; Malhi, Y.; Metcalfe, D.B.; Silva-Espejo, J.E.; Jiménez, E.; Navarrete, D.; Almeida, S.; Costa, A.C.L.; Salinas, N.; Phillips, O.L.; et al. Above- and below-ground net primary productivity across ten Amazonian forests on contrasting soils. Biogeosciences 2009, 6, 2759–2778. [Google Scholar] [CrossRef]
- Mahowald, N.M.; Artaxo, P.; Baker, A.R.; Jickells, T.D.; Okin, G.S.; Randerson, J.T.; Townsend, A.R. Impacts of biomass burning emissions and land use change on Amazonian atmospheric phosphorus cycling and deposition. Glob. Biogeochem. Cycles 2005, 19. [Google Scholar] [CrossRef]
- Mahowald, N.M.; Engelstaedter, S.; Luo, C.; Sealy, A.; Artaxo, P.; Benitez-Nelson, C.; Bonnet, S.; Chen, Y.; Chuang, P.Y.; Cohen, D.D.; et al. Atmospheric iron deposition: Global distribution, variability, and human perturbations. Annu. Rev. Mar. Sci. 2009, 1, 245–278. [Google Scholar] [CrossRef] [PubMed]
- Duffy, P.B.; Brando, P.; Asner, G.P.; Field, C.B. Projections of future meteorological drought and wet periods in the amazon. Proc. Natl. Acad. Sci. USA 2015, 112, 13172–13177. [Google Scholar] [CrossRef] [PubMed]
Figure 1.
Spatial patterns of climate-drivers of photosynthesis seasonality in Amazonia, represented by the R² for each predictor. Areas 1 and 2 represent regions limited by water and driven by radiation, respectively. The pixels encompassed by such areas were used to analyze the relations between ChlF seasonality and the monthly means of the climate variables, as showed in Figure 2.
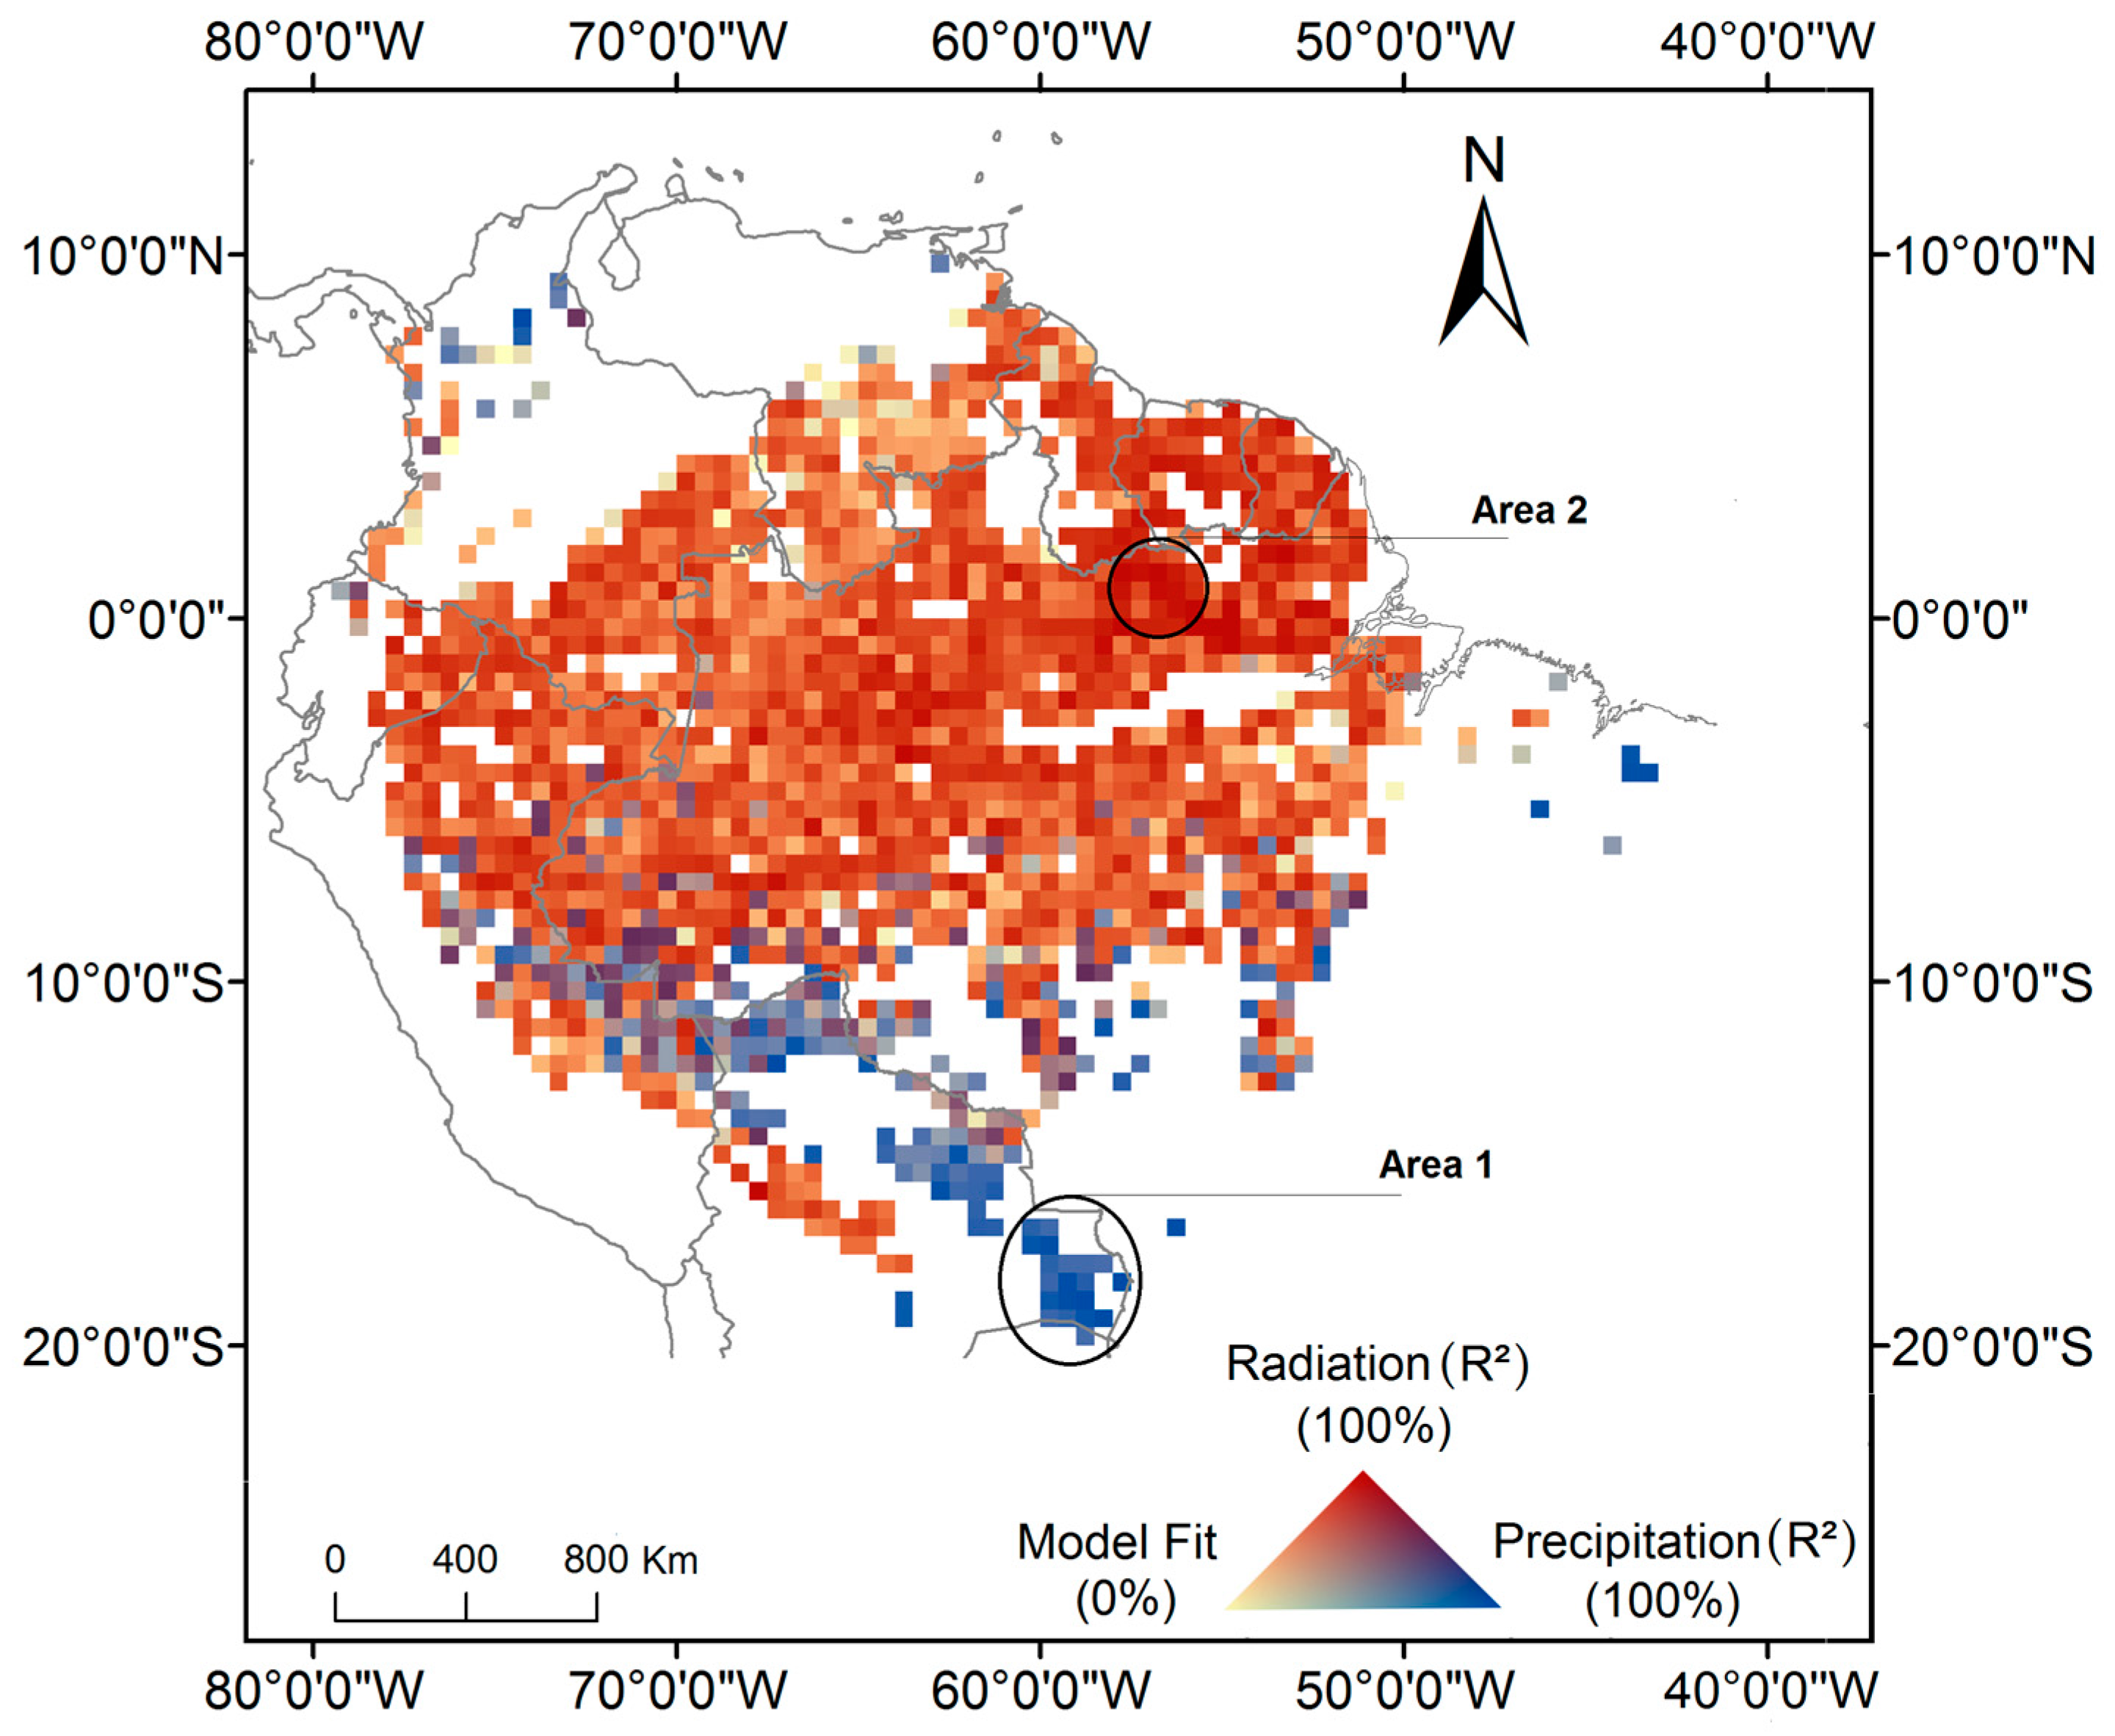
Figure 2.
ChlF seasonality (a,b), Mean Monthly Precipitation (MMP) (c,d) and Mean Monthly Radiation (MMR) (e,f) variables of the pixels located in the areas (1 and 2) indicated in the Figure 1. The pixel values of ChlF seasonality, MMP and MMR variables in the Area 1 and Area 2 are plotted for each month (X-axis). Upper, middle (yellow line) and lower box edges show the 75th, 50th and 25th percentiles of the pixel values for each variable. The upper (lower) whisker delimit the most extreme value contained in the limit defined by the sum (difference) between the 75th (25th) percentile and the difference between the 75th and 25th percentiles multiplied by 1.5. Outliers (black circles) represent values outside the limits defined by the whiskers.
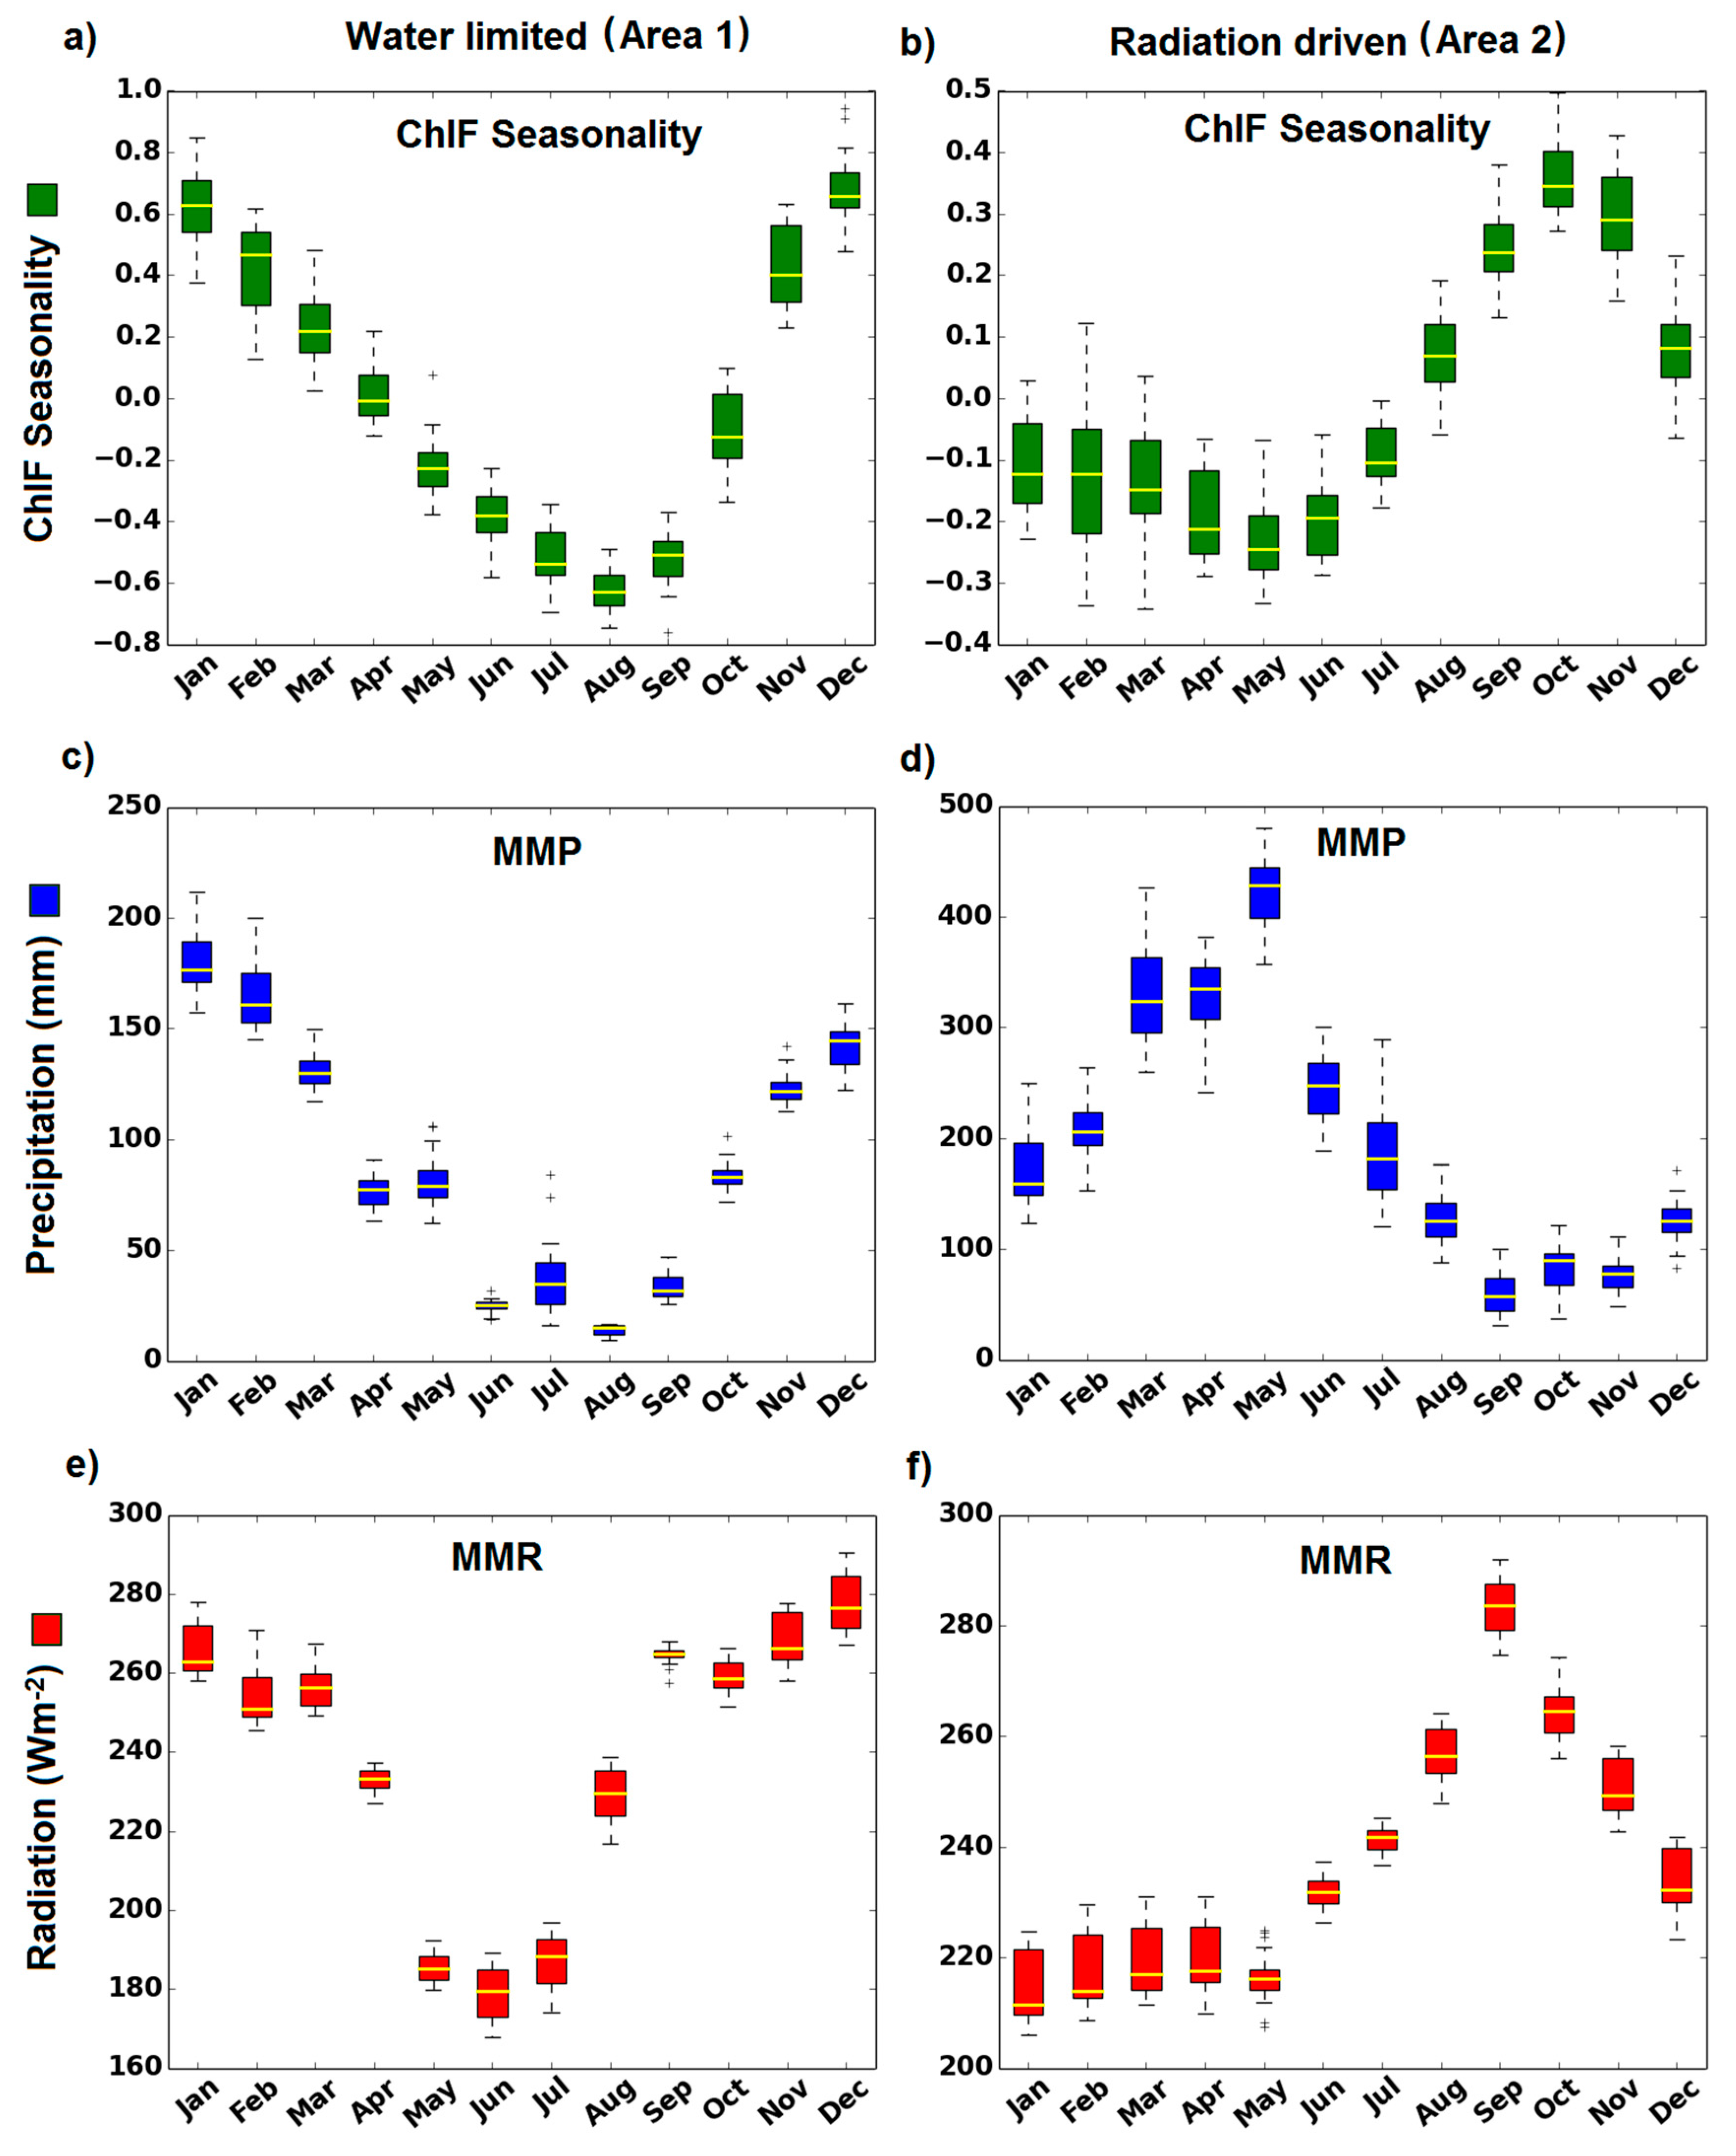
Figure 3.
Accumulated frequencies of Mean Annual Precipitation (MAP) in the areas where ChlF seasonality is associated to precipitation or radiation.
Figure 3.
Accumulated frequencies of Mean Annual Precipitation (MAP) in the areas where ChlF seasonality is associated to precipitation or radiation.
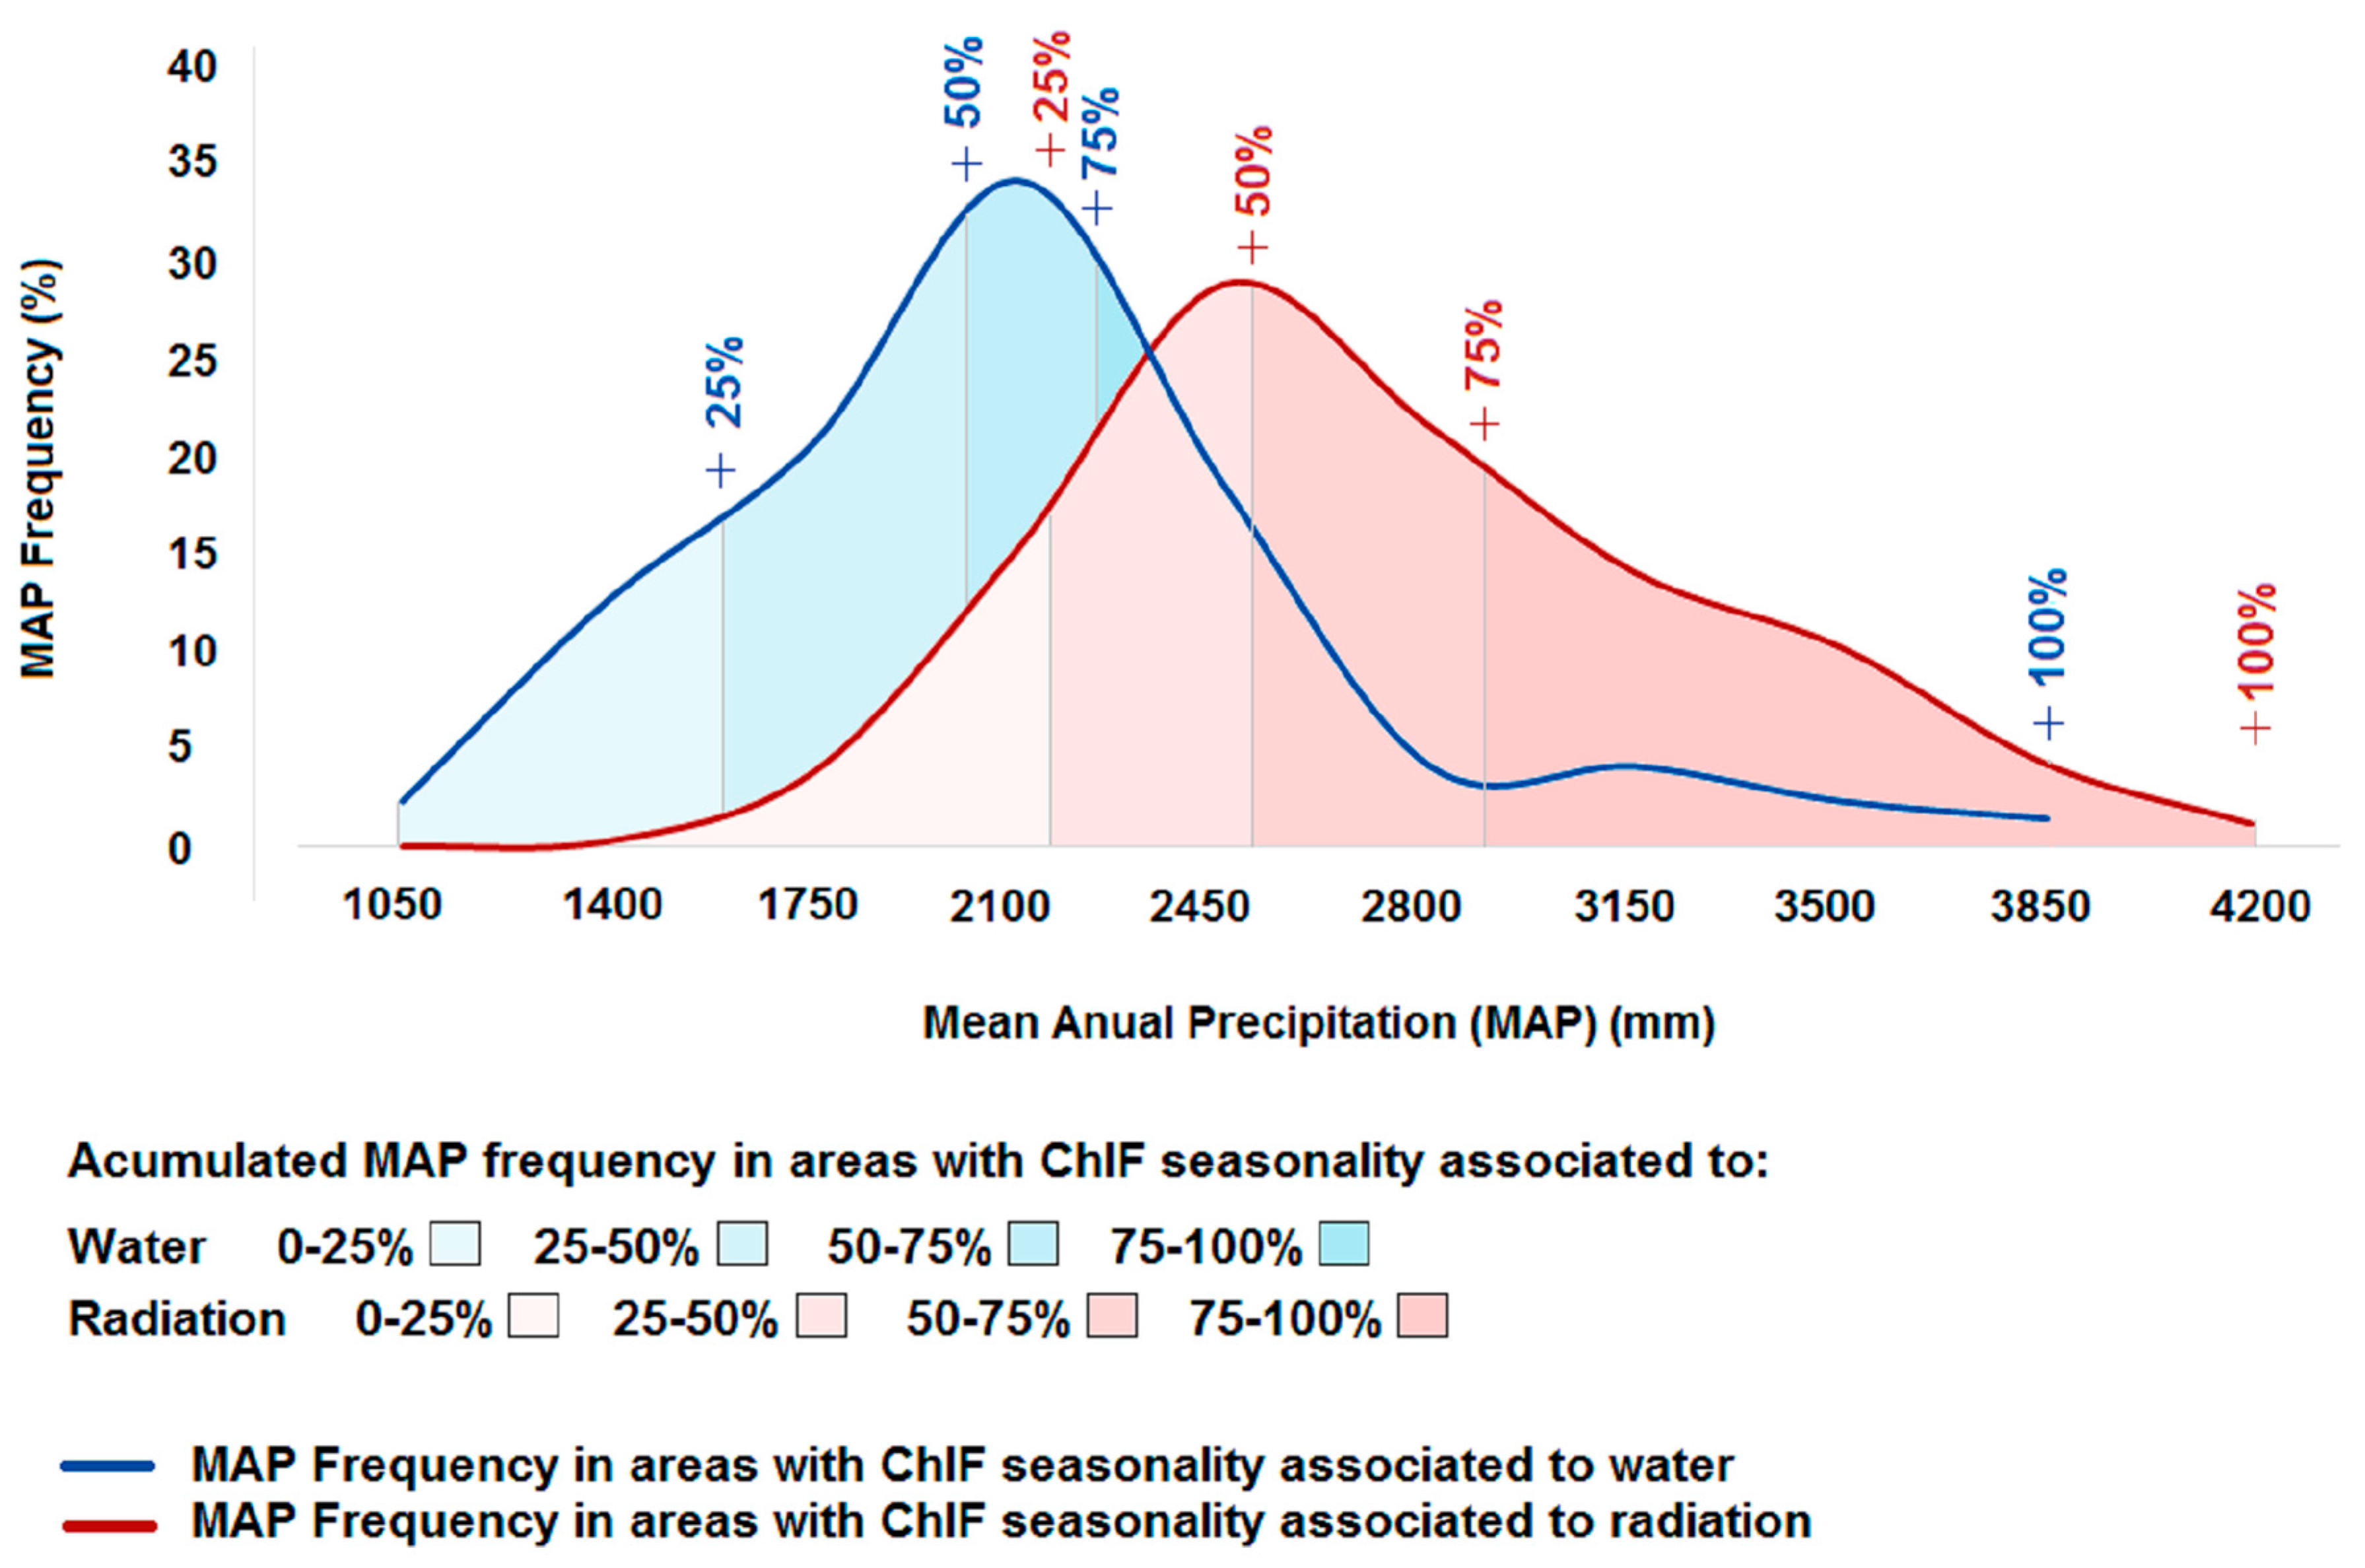
Figure 4.
(a) Last month of the dry season obtained from MMP. Dry season was defined by months with MMP below 100 mm; (b) months of the maximum ChlF in the amazon forest.
Figure 4.
(a) Last month of the dry season obtained from MMP. Dry season was defined by months with MMP below 100 mm; (b) months of the maximum ChlF in the amazon forest.

Figure 5.
Maximum ChlF seasonality and its relationship with the end of the dry season.

© 2017 by the authors. Licensee MDPI, Basel, Switzerland. This article is an open access article distributed under the terms and conditions of the Creative Commons Attribution (CC BY) license (http://creativecommons.org/licenses/by/4.0/).
Share and Cite
MDPI and ACS Style
Bertani, G.; Wagner, F.H.; Anderson, L.O.; Aragão, L.E.O.C. Chlorophyll Fluorescence Data Reveals Climate-Related Photosynthesis Seasonality in Amazonian Forests. Remote Sens. 2017, 9, 1275. https://doi.org/10.3390/rs9121275
AMA Style
Bertani G, Wagner FH, Anderson LO, Aragão LEOC. Chlorophyll Fluorescence Data Reveals Climate-Related Photosynthesis Seasonality in Amazonian Forests. Remote Sensing. 2017; 9(12):1275. https://doi.org/10.3390/rs9121275
Chicago/Turabian StyleBertani, Gabriel, Fabien H. Wagner, Liana O. Anderson, and Luiz E. O. C. Aragão. 2017. "Chlorophyll Fluorescence Data Reveals Climate-Related Photosynthesis Seasonality in Amazonian Forests" Remote Sensing 9, no. 12: 1275. https://doi.org/10.3390/rs9121275
Note that from the first issue of 2016, this journal uses article numbers instead of page numbers. See further details here.