Analysis of Suspended Particulate Matter and Its Drivers in Sahelian Ponds and Lakes by Remote Sensing (Landsat and MODIS): Gourma Region, Mali

 and
and
Abstract
:
- Extremely high and varying amounts of suspended particulate matter found in Sahelian ponds and lakes.
- The near infrared band is well suited to retrieve suspended particulate matter and turbidity from both MODIS and Landsat.
- An important increase in suspended particulate matter due to resuspension mechanisms is driven by wind in the dry season.
- A significant upward trend in suspended particulate matter is found for the Agoufou Lake between 2000 and 2016.
1. Introduction
2. Material and Methods
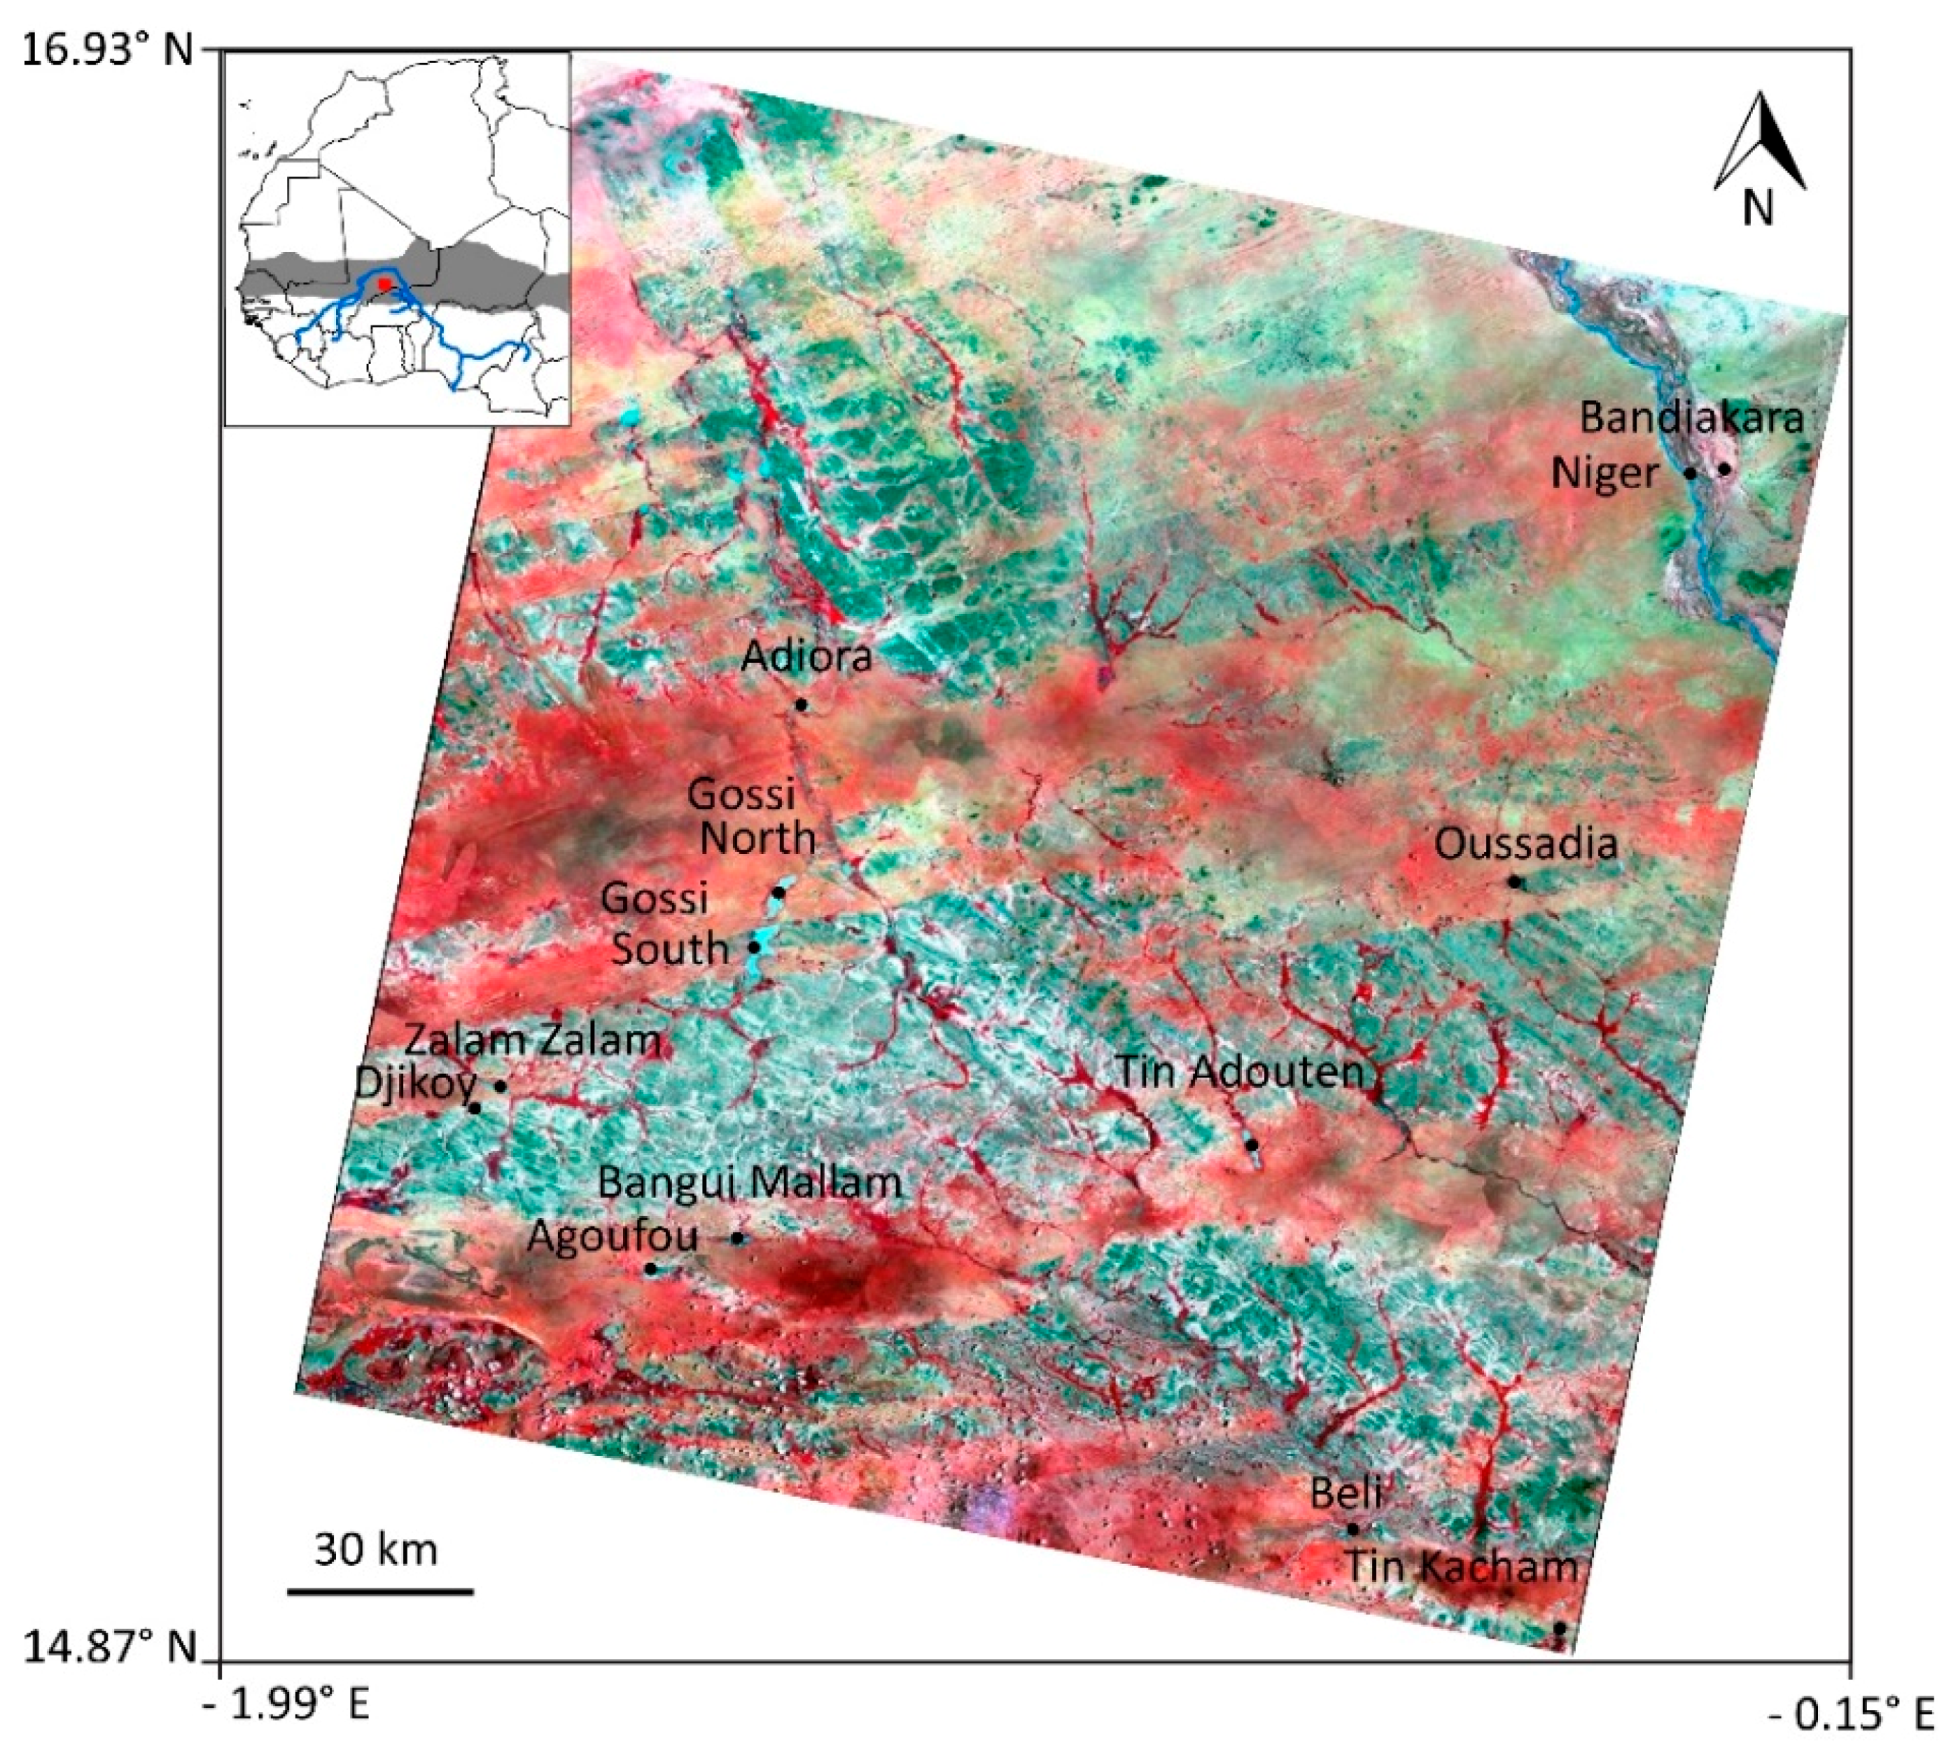
2.1. Study Area
2.2. In-Situ Measurements
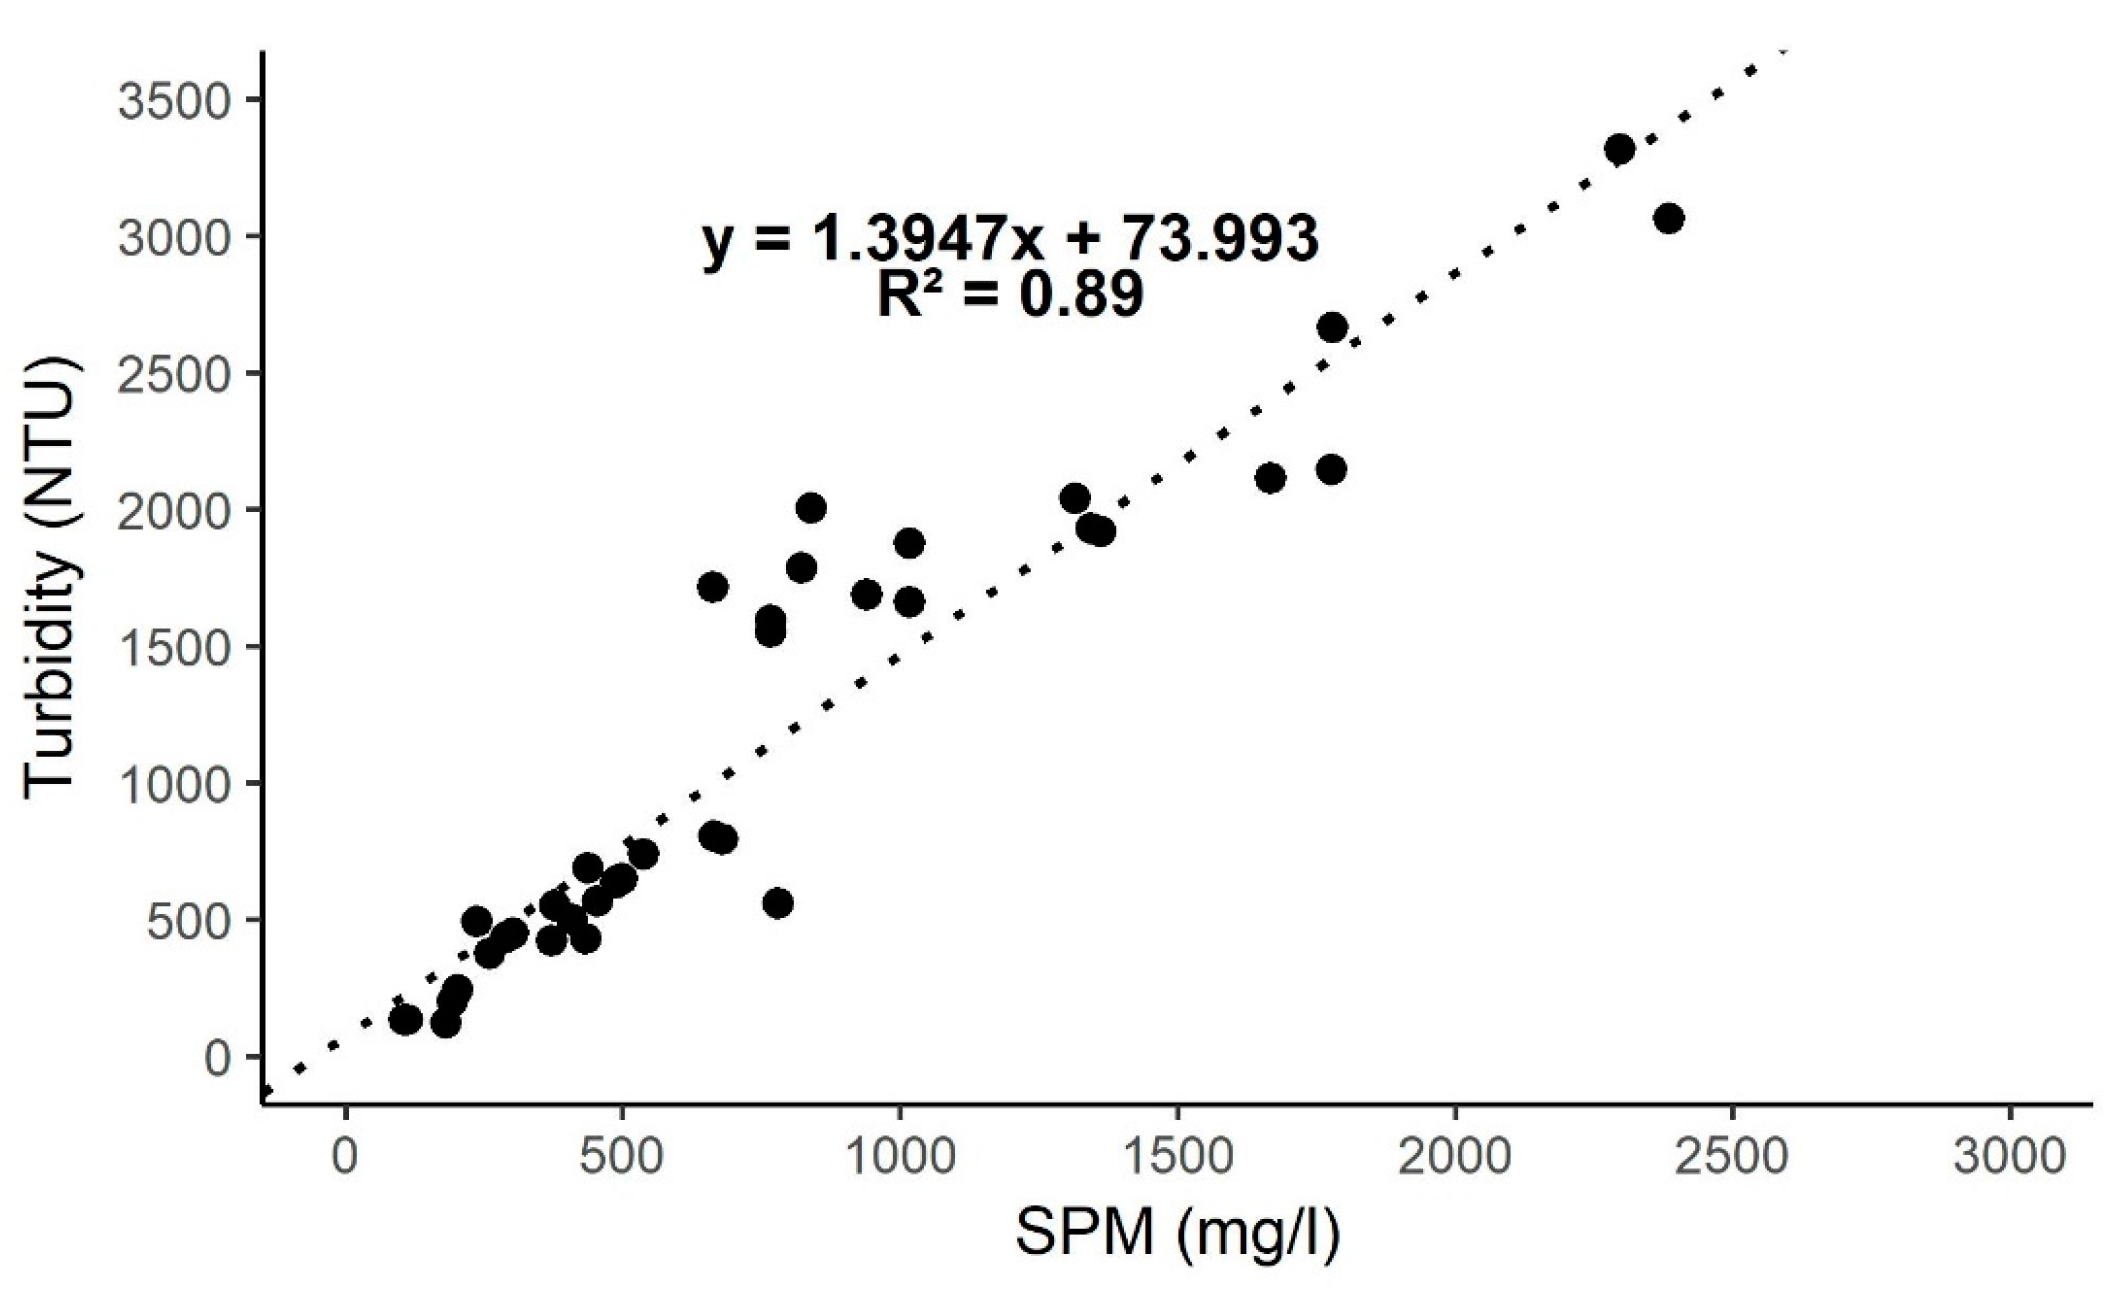
2.2.1. Turbidity, SPM and Granulometry
2.2.2. Water Level
2.2.3. Precipitation
2.2.4. Wind
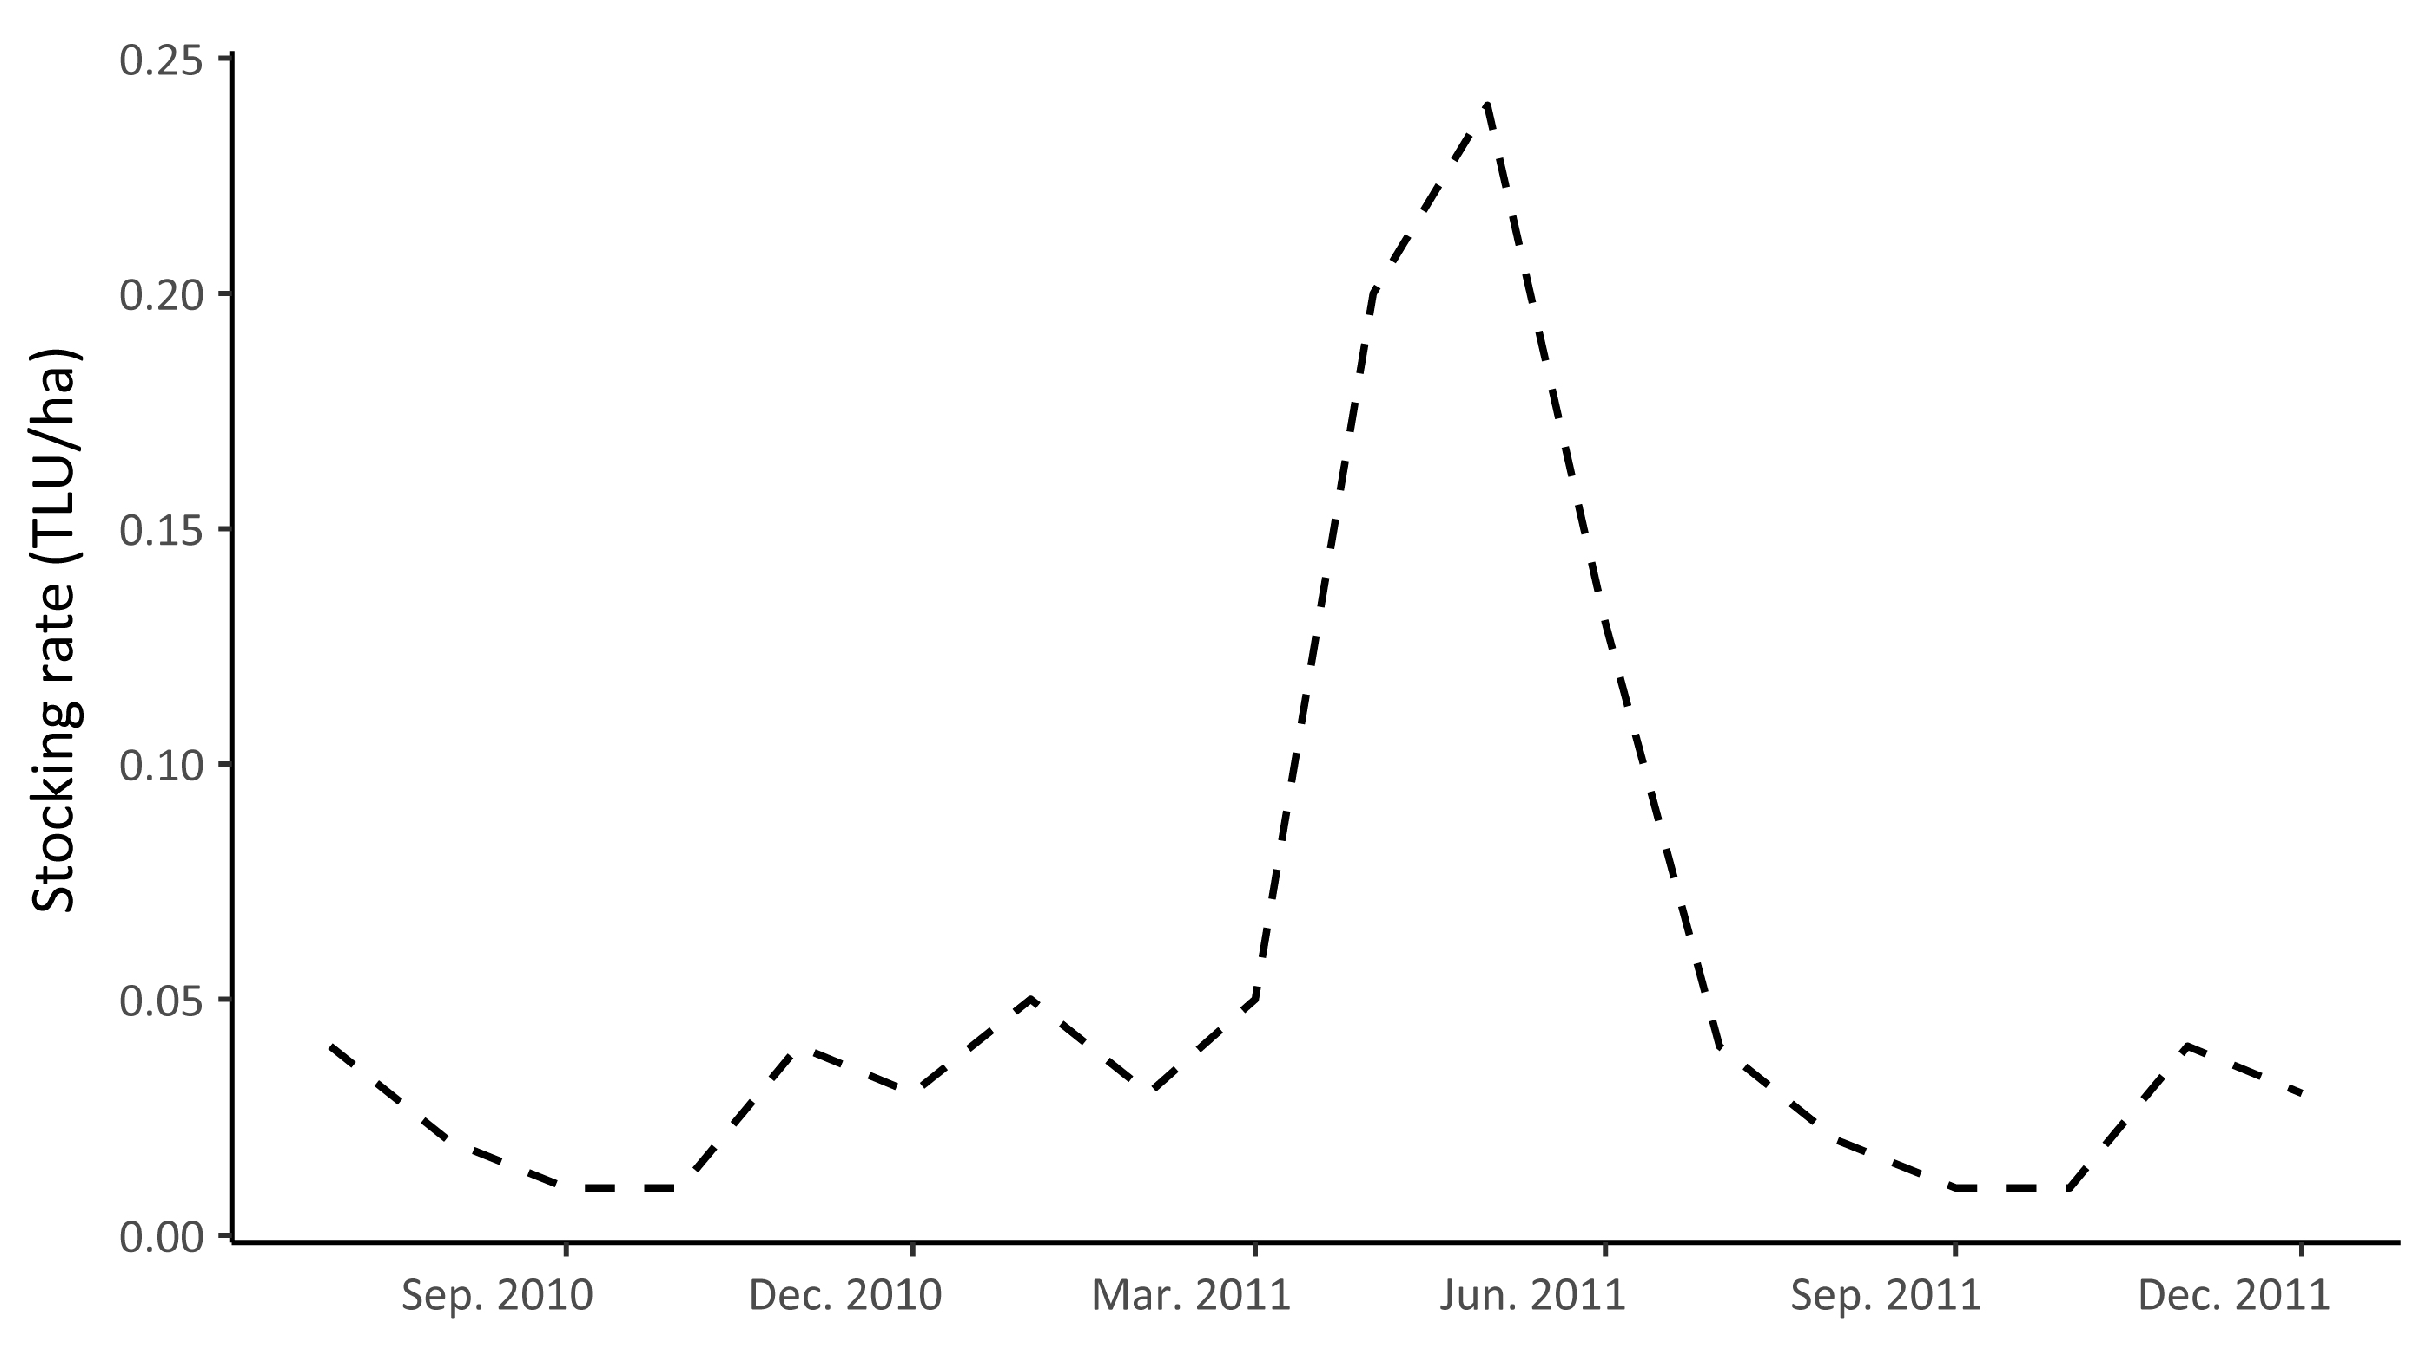
2.2.5. Livestock
2.3. Satellite Data
2.4. Methods
3. Results
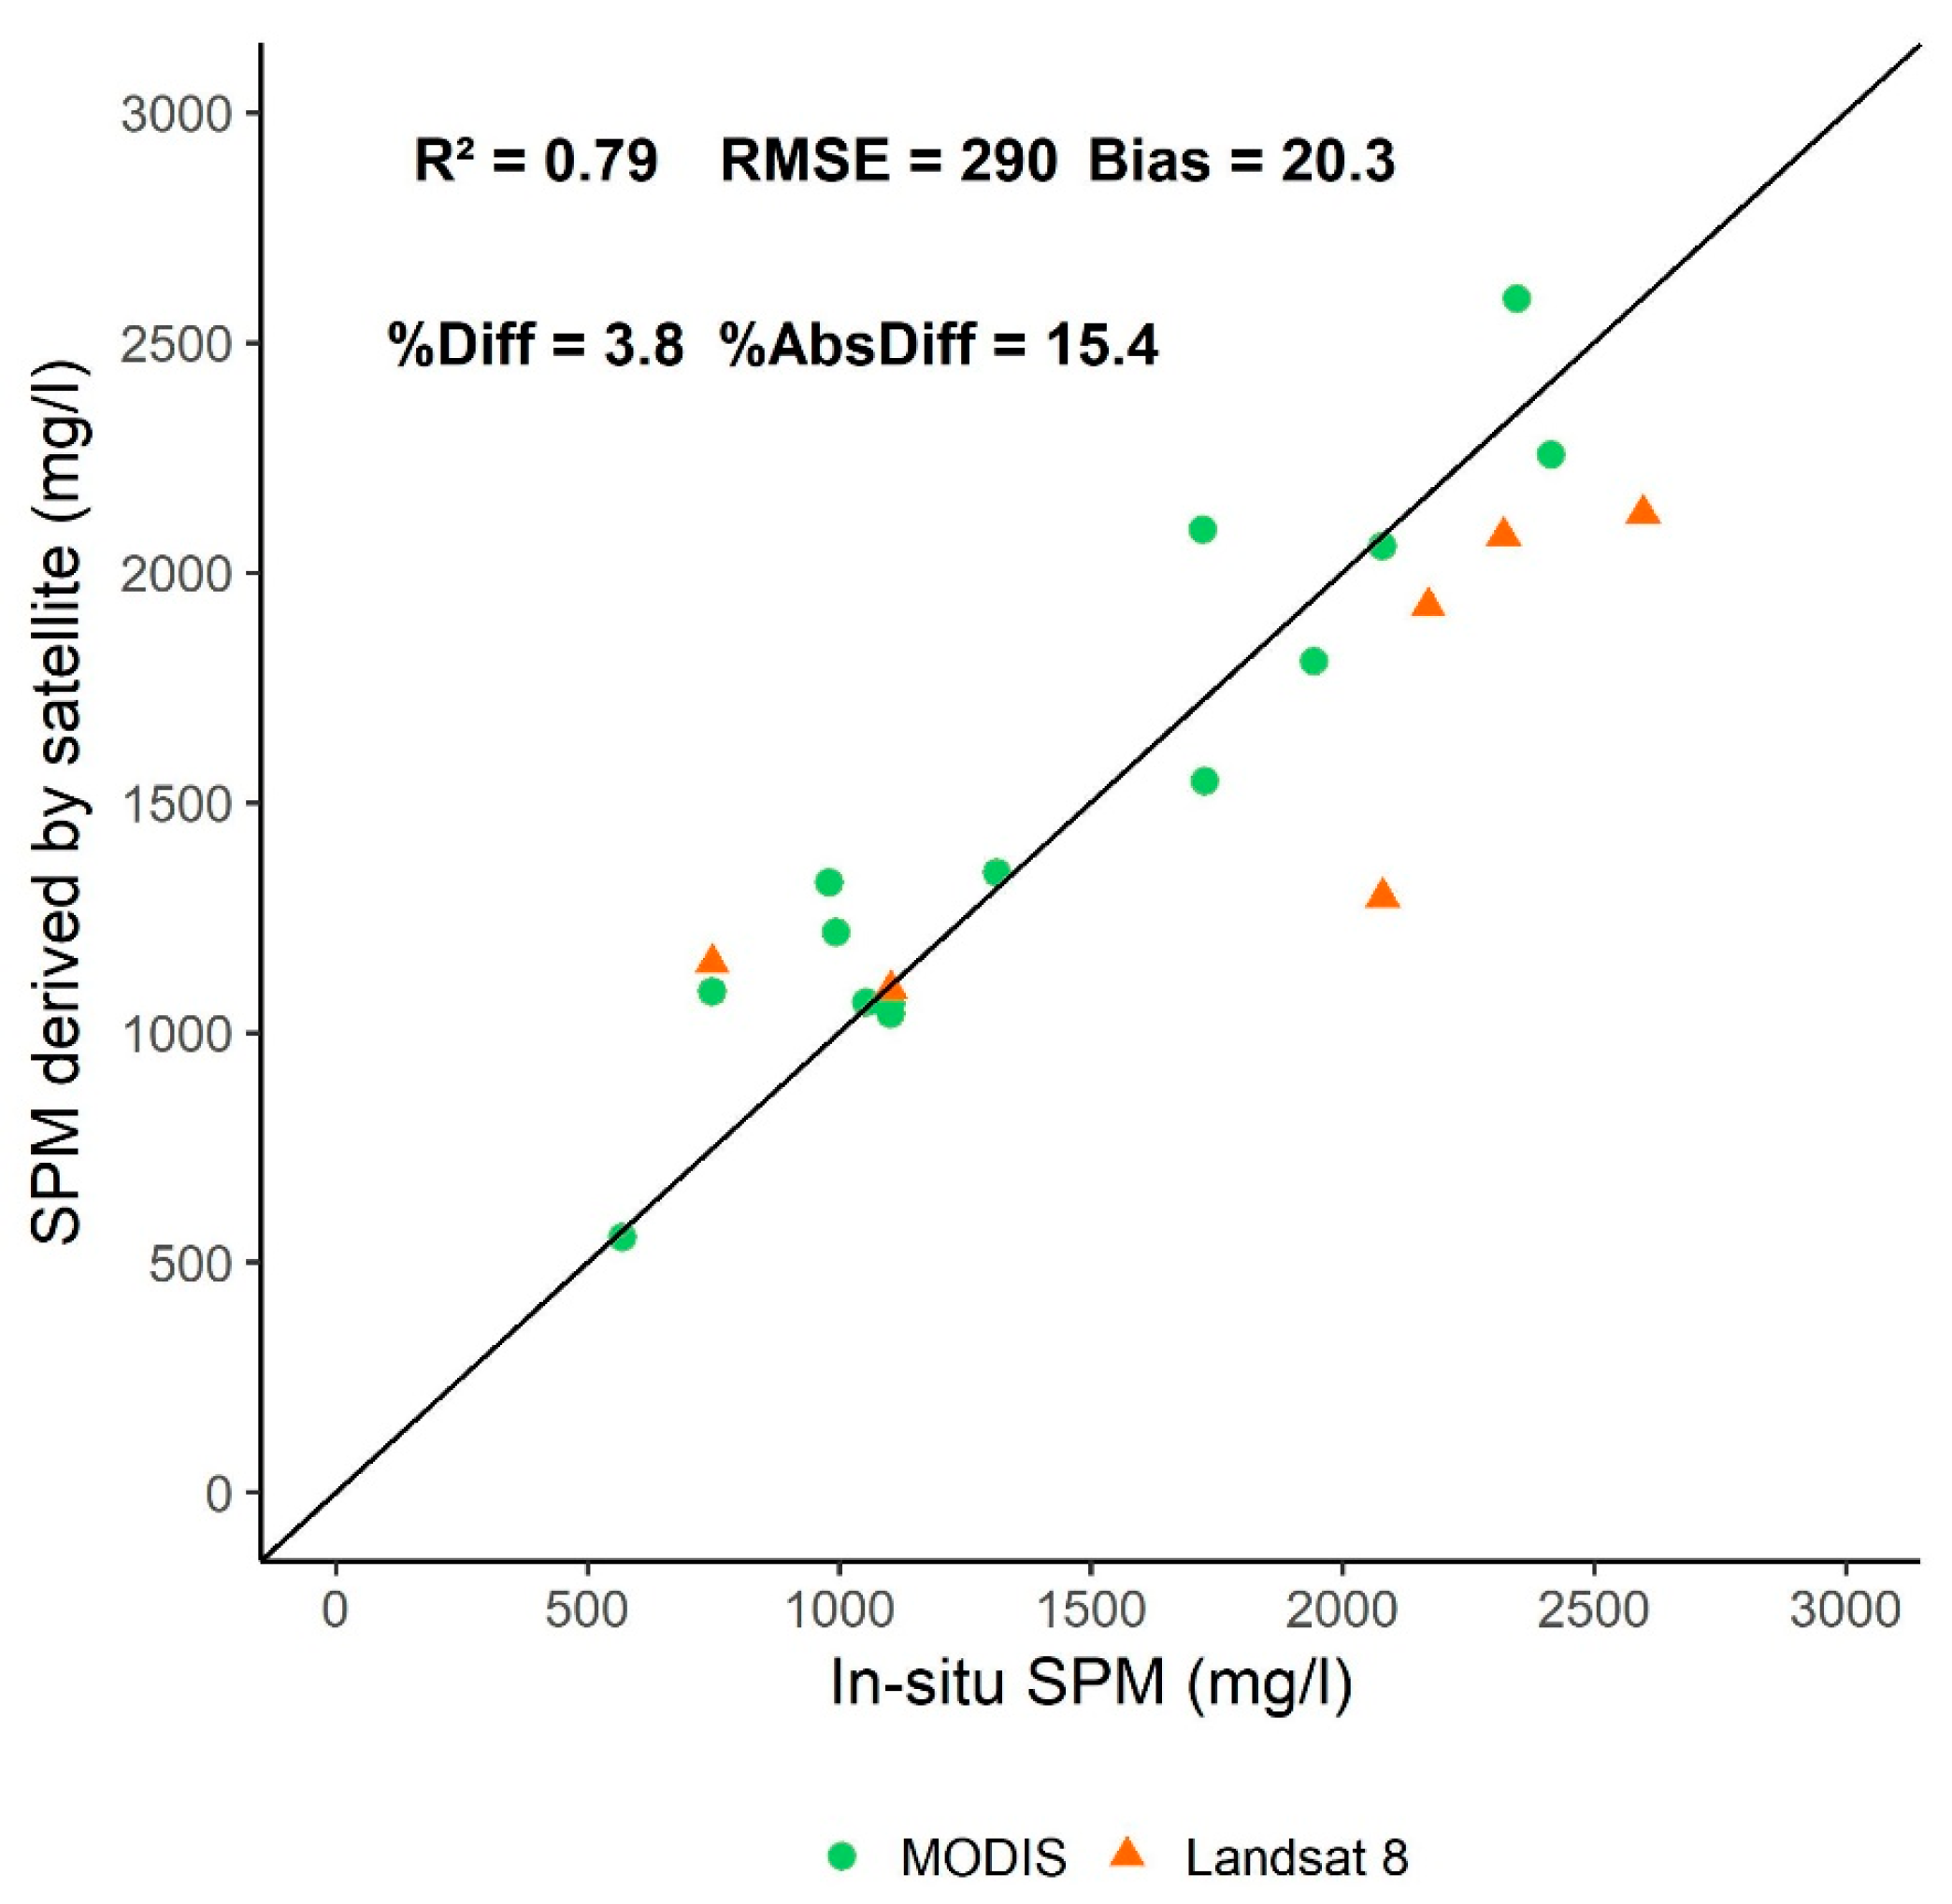
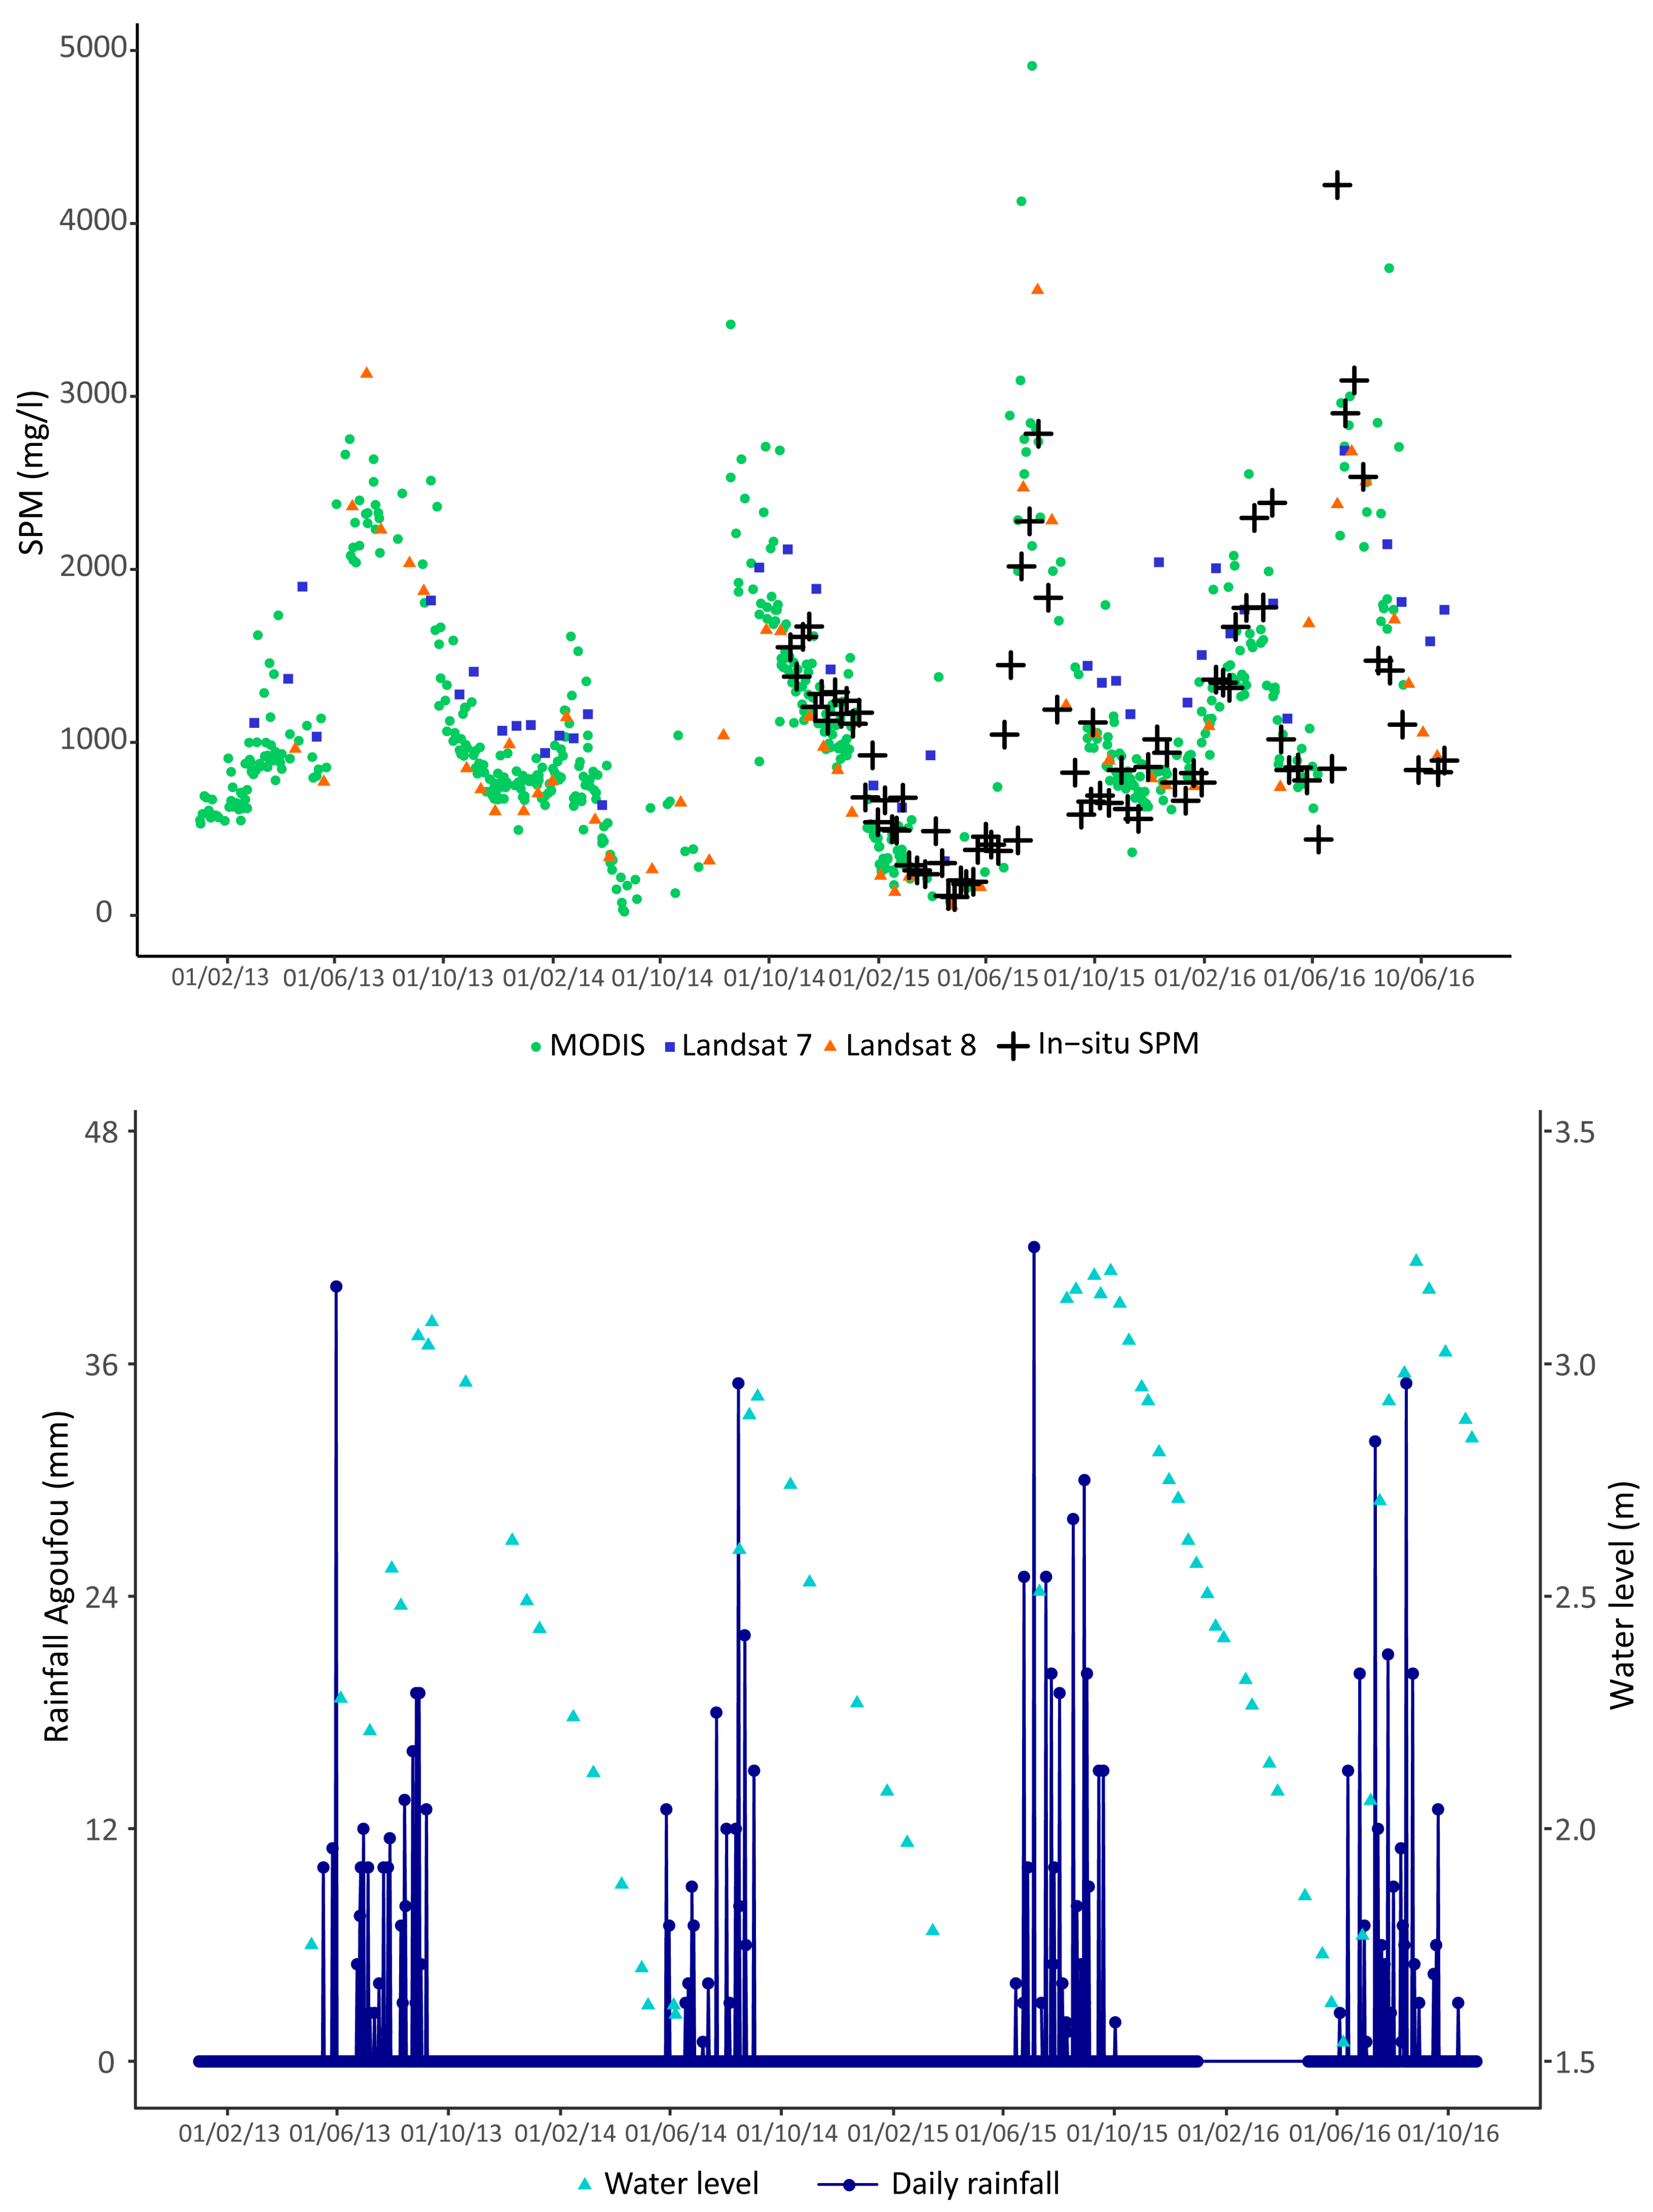
3.1. Relationship between In-Situ Data and Satellite Data
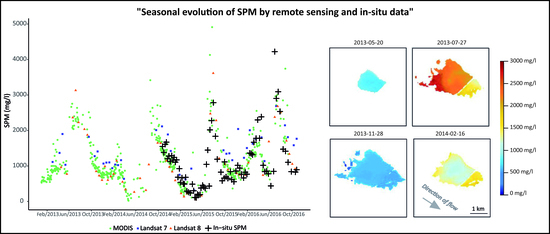
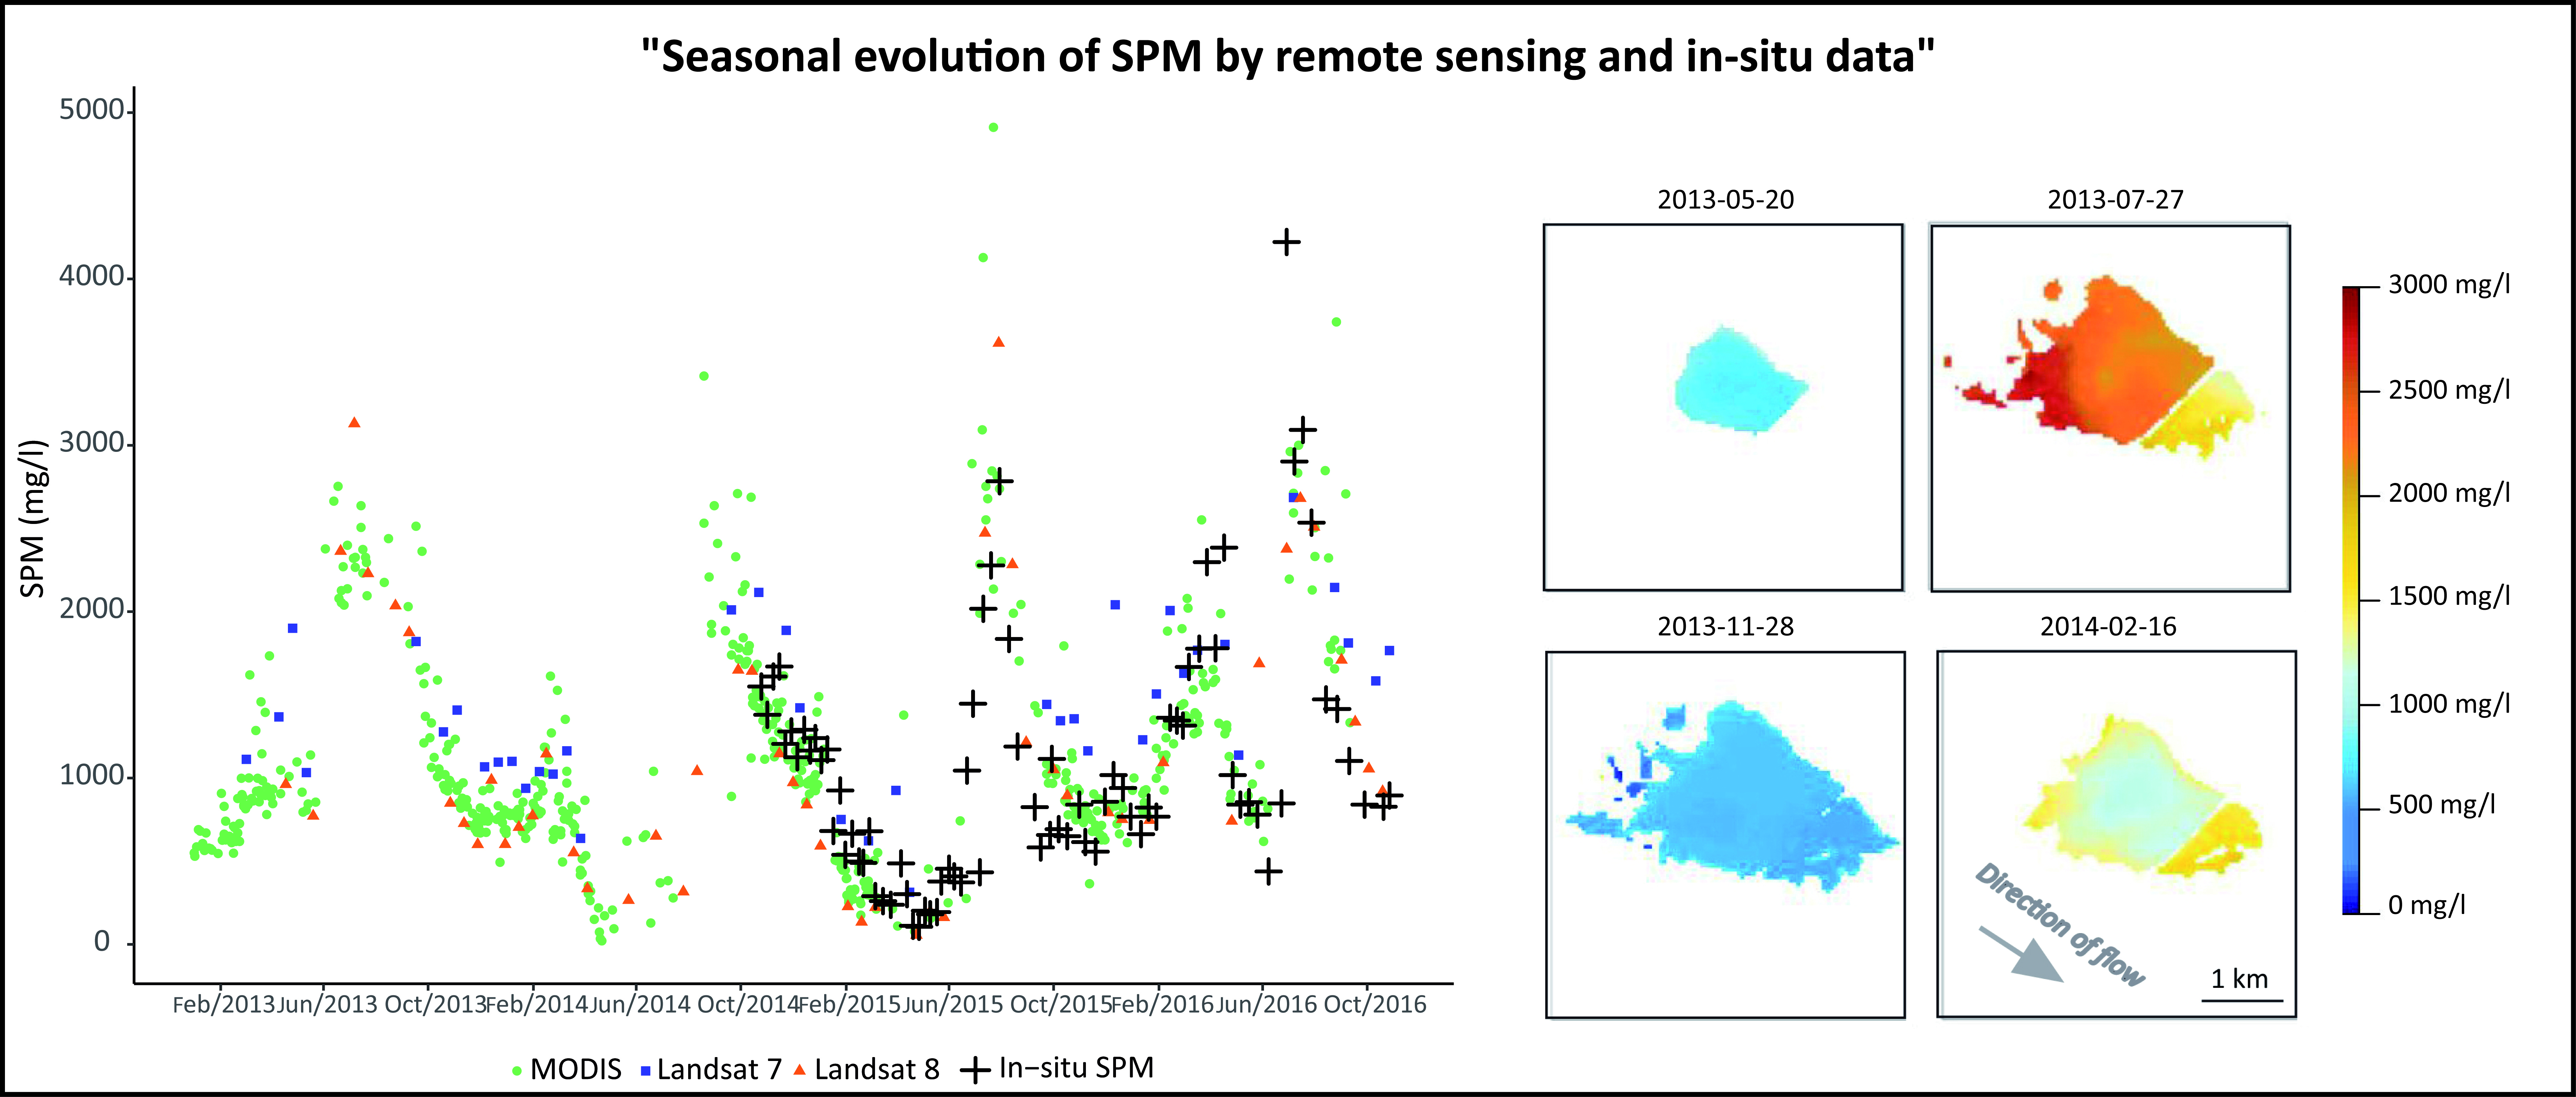
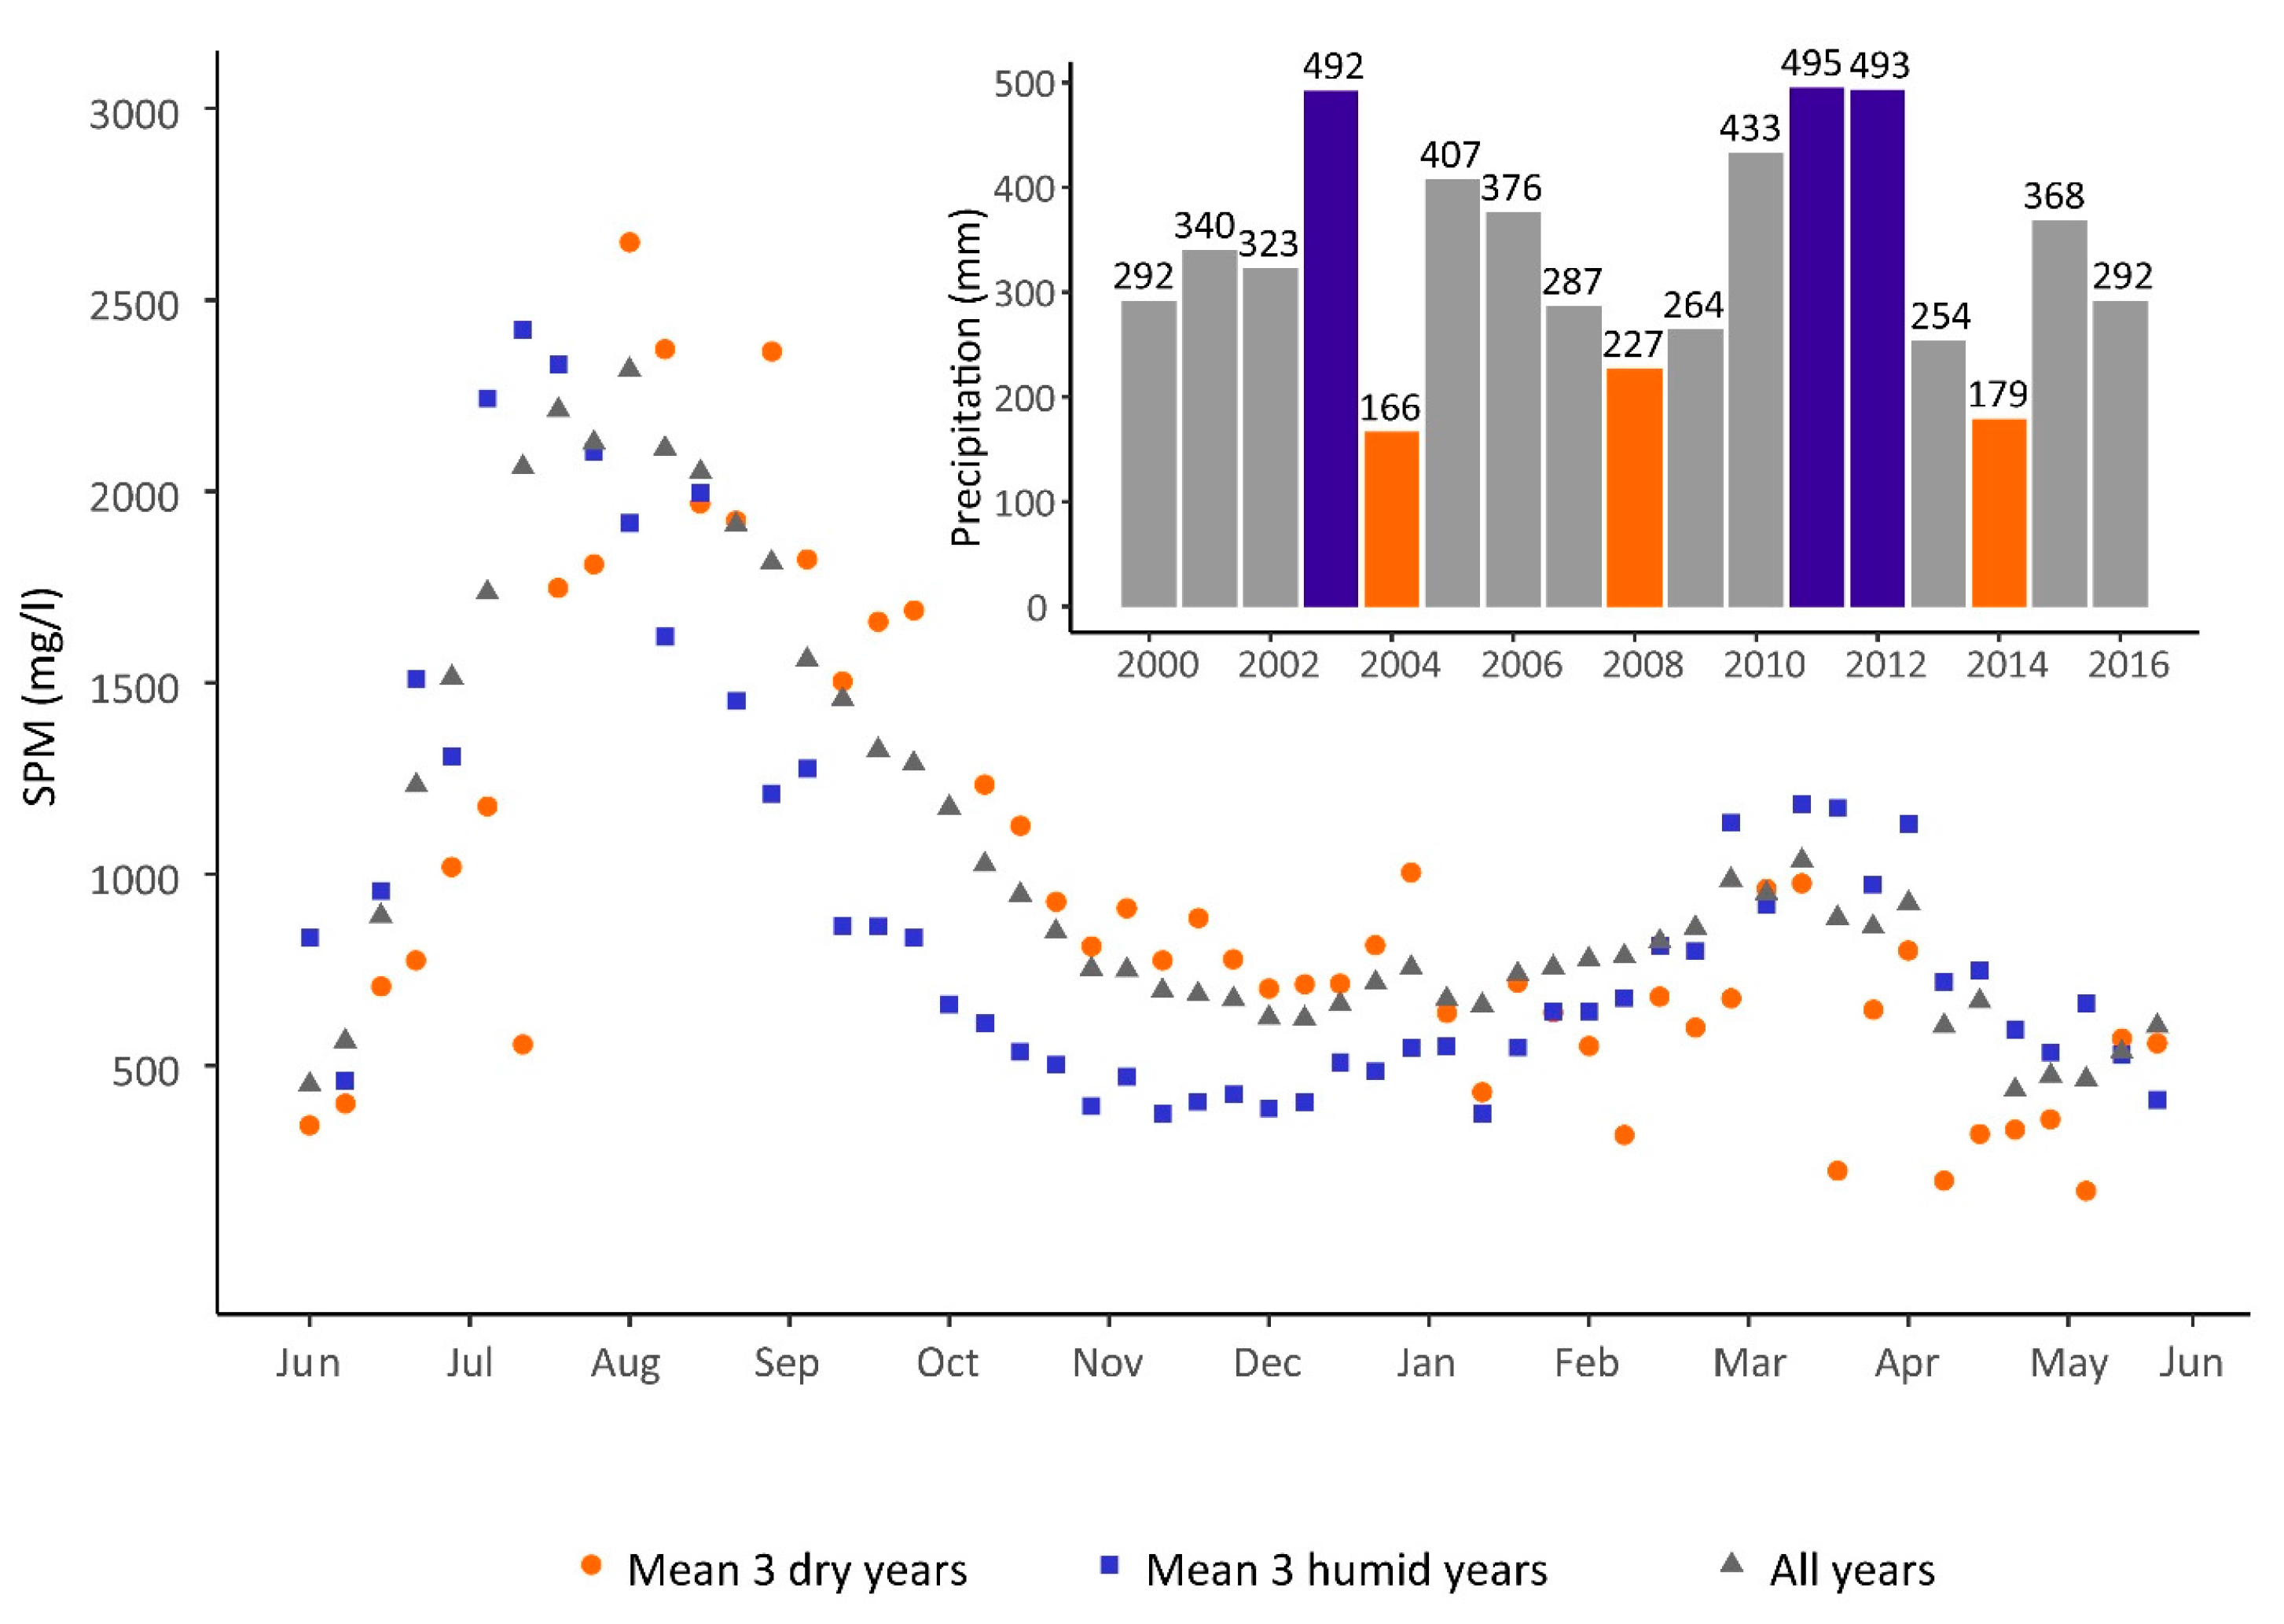
3.2. Seasonal and Interannual Dynamics
3.3. Impact of Meteorological, Hydrological and Anthropogenic Factors on the SPM Variability
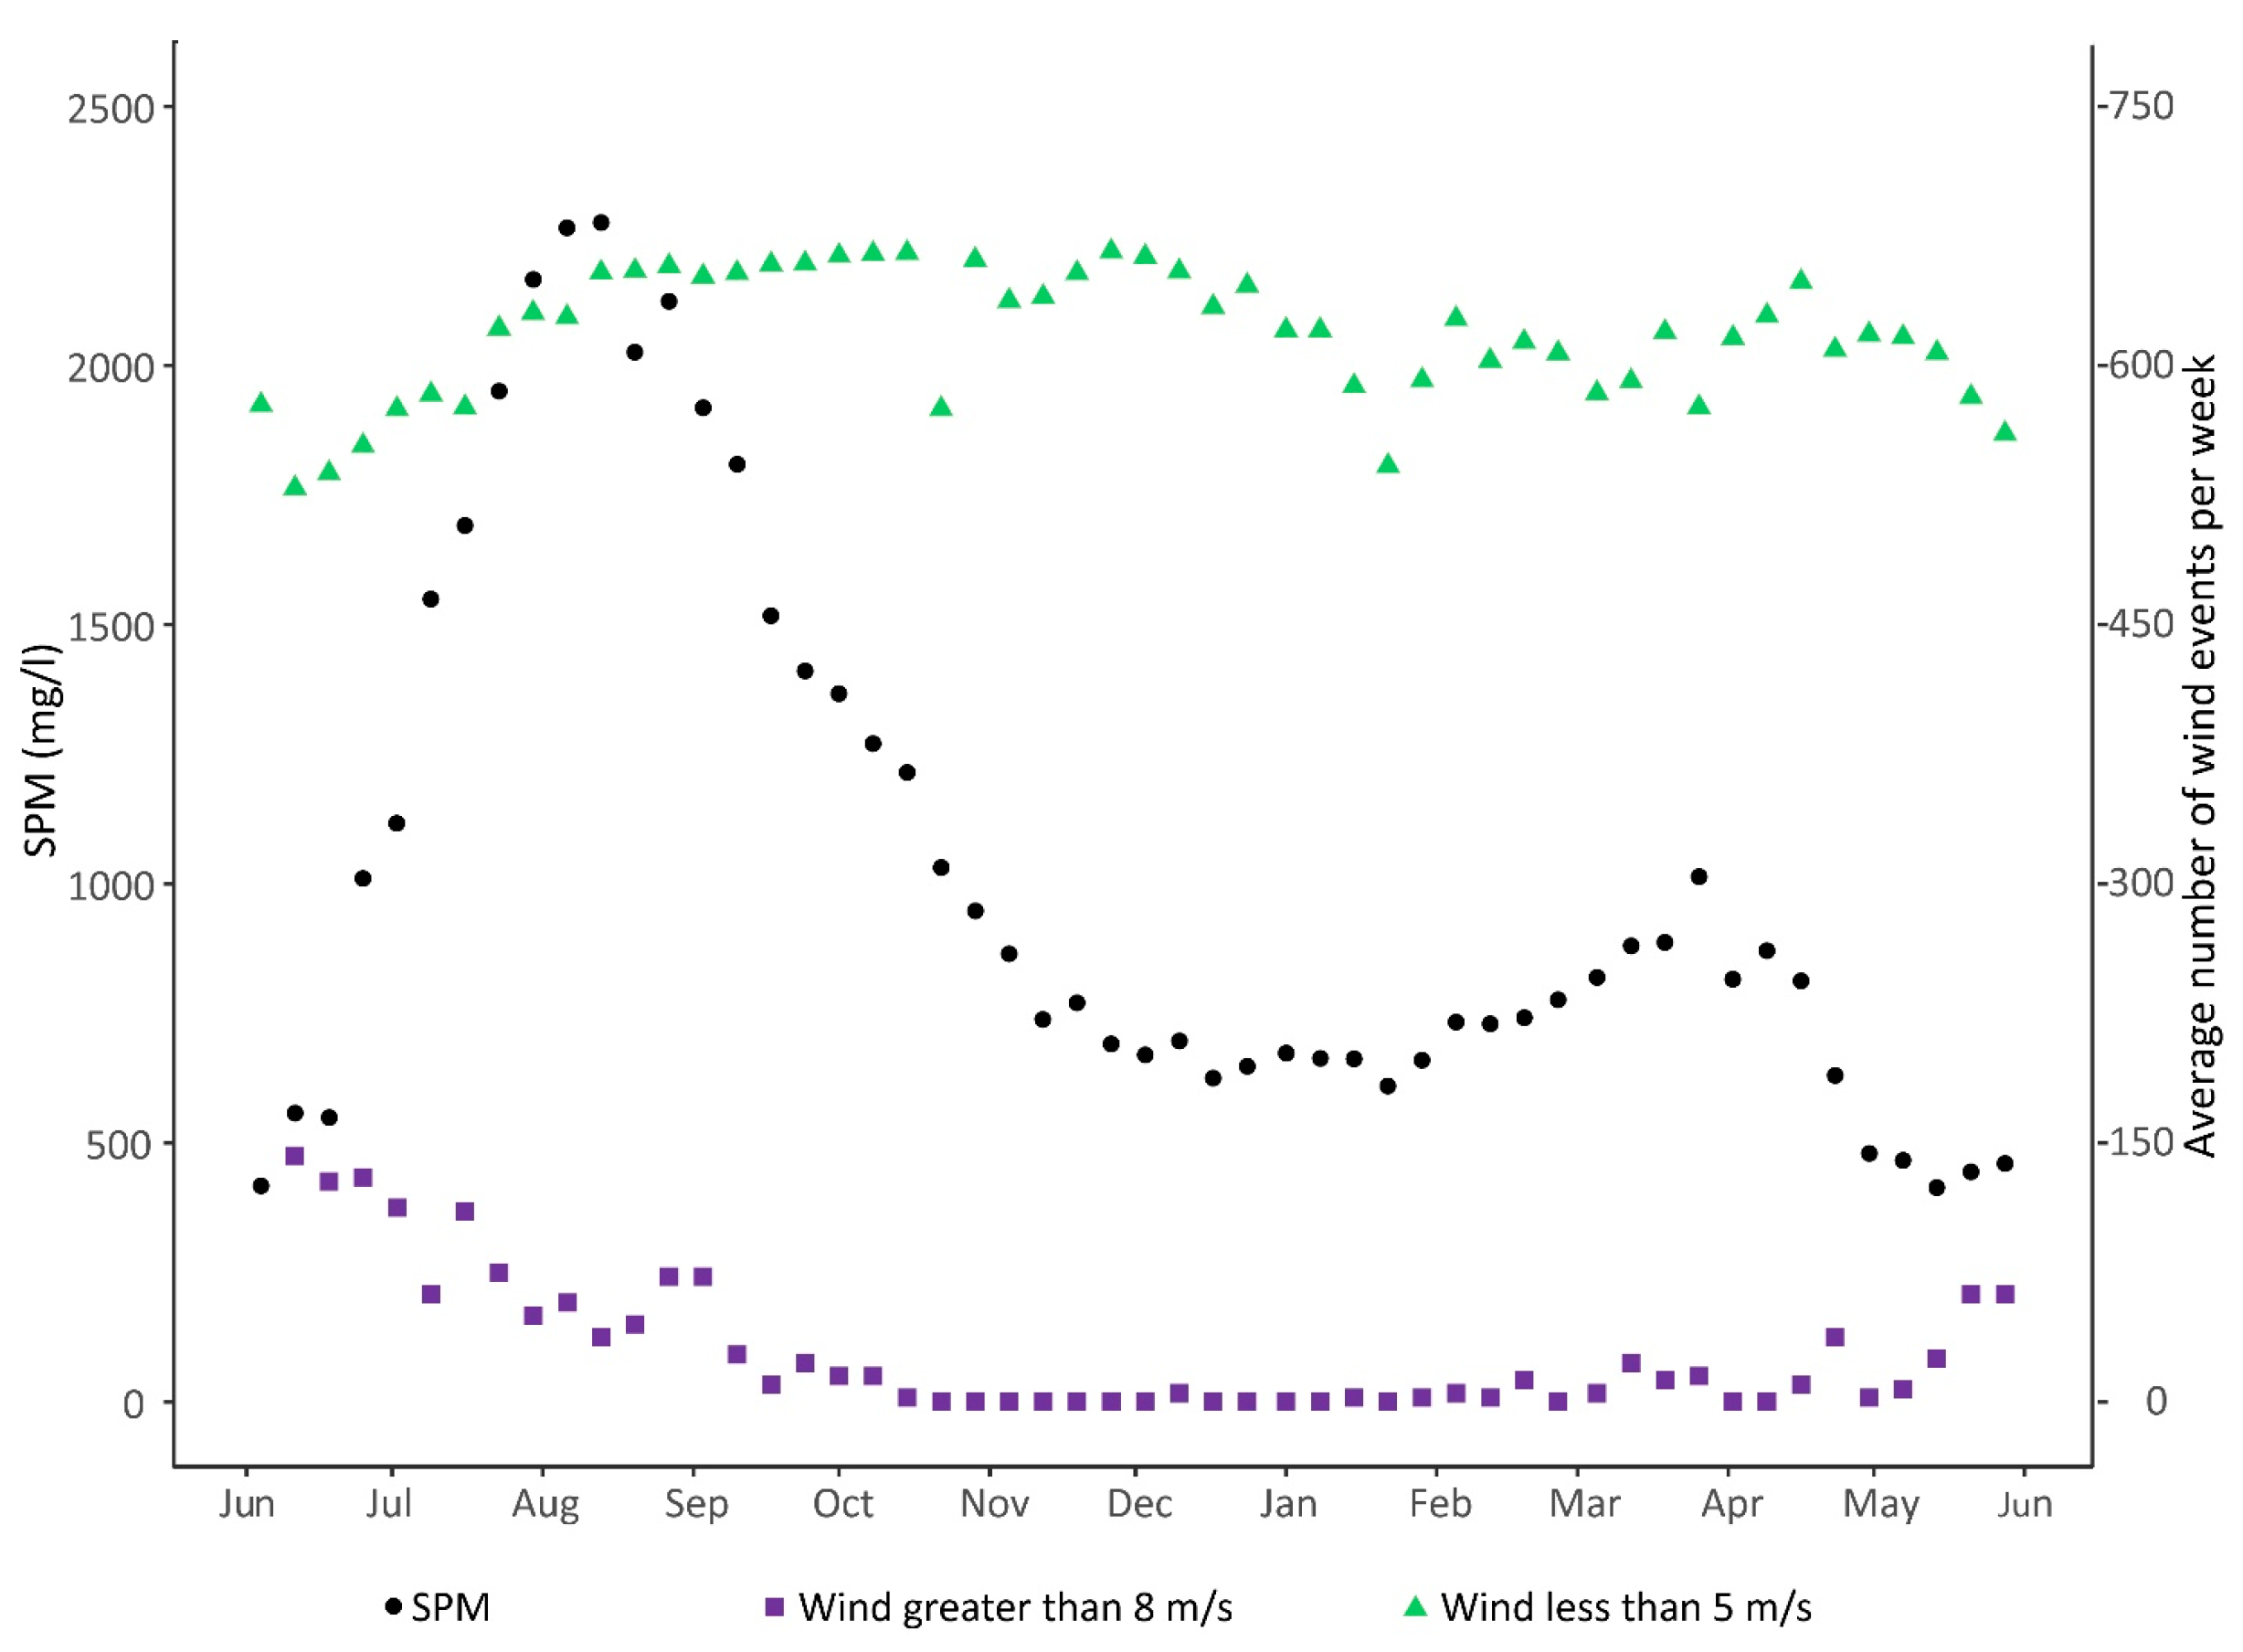
3.3.1. Factors Impacting Dry Season SPM Variability
- -
- Particle resuspension caused by livestock gathering around and in the lake during the dry season.
- -
- Seasonal variations in wind speed, favoring particle remobilization between mid-February and mid-April: sustained high winds are required for particle resuspension, whereas calm winds facilitate particle deposition. Wind direction may also play a role.
- -
- Dust deposition at the lake surface.
- -
3.3.2. Factors Impacting Rainy Season SPM Variability
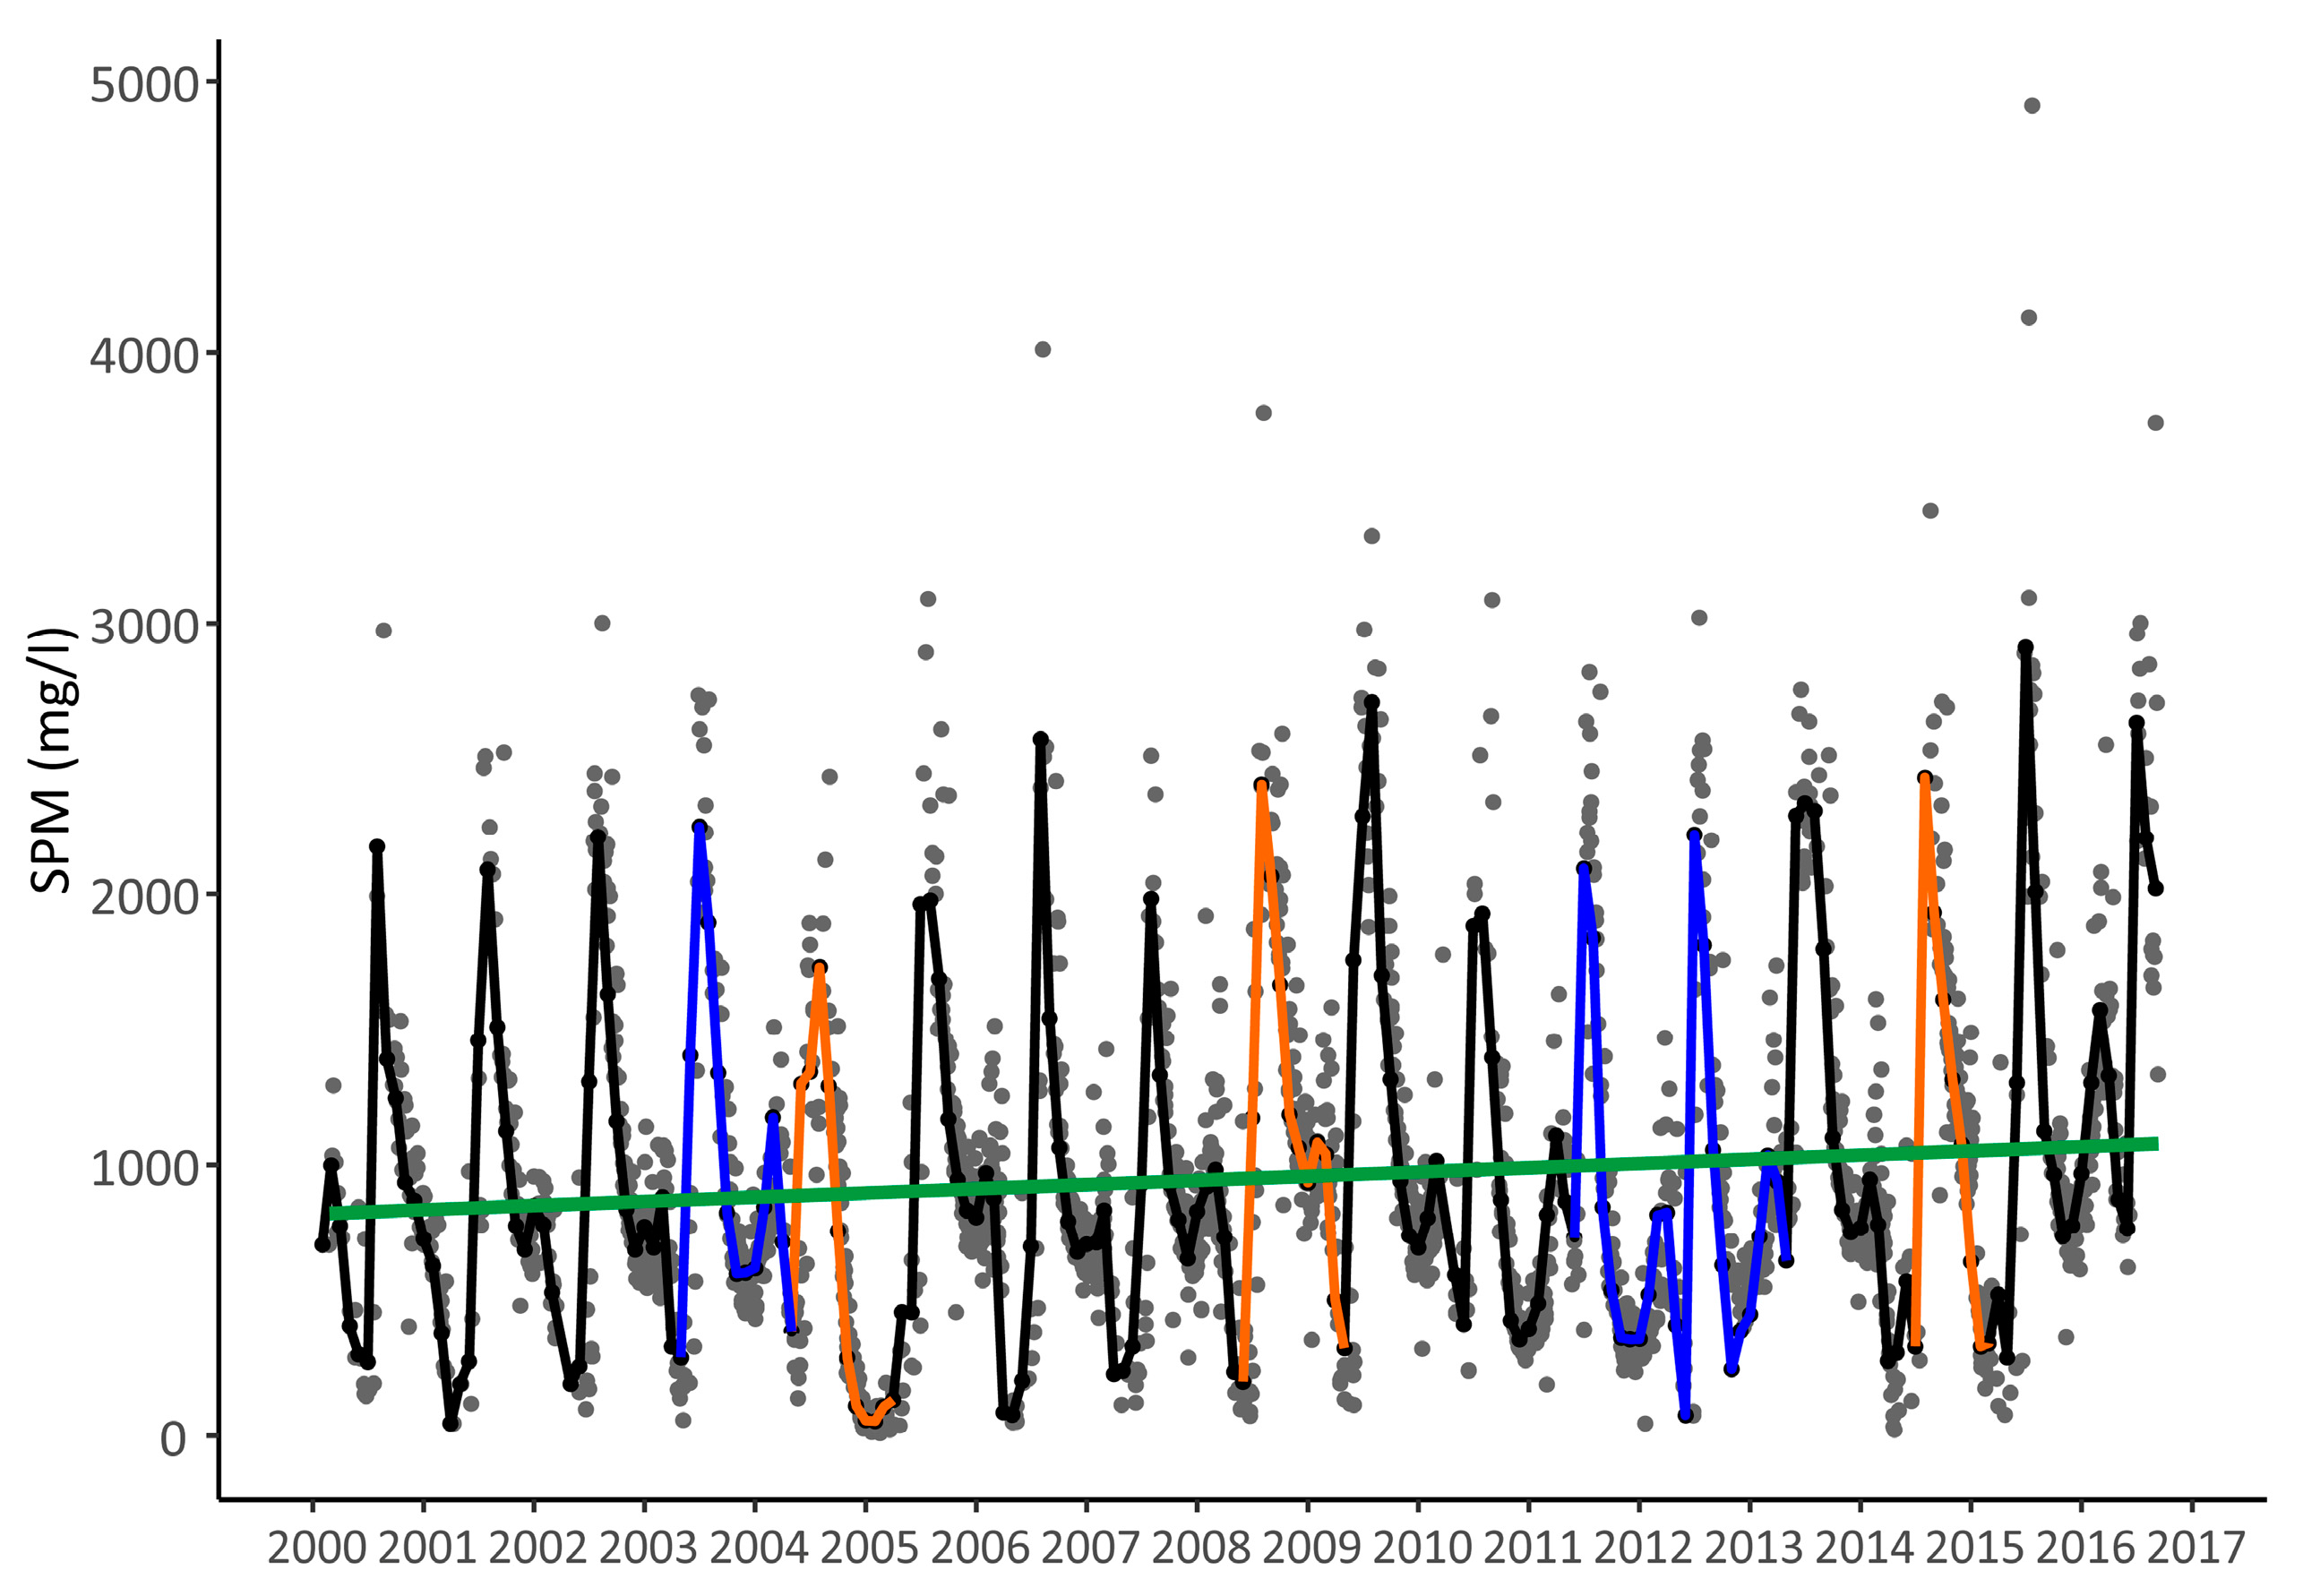
3.4. Trends over 2000–2016
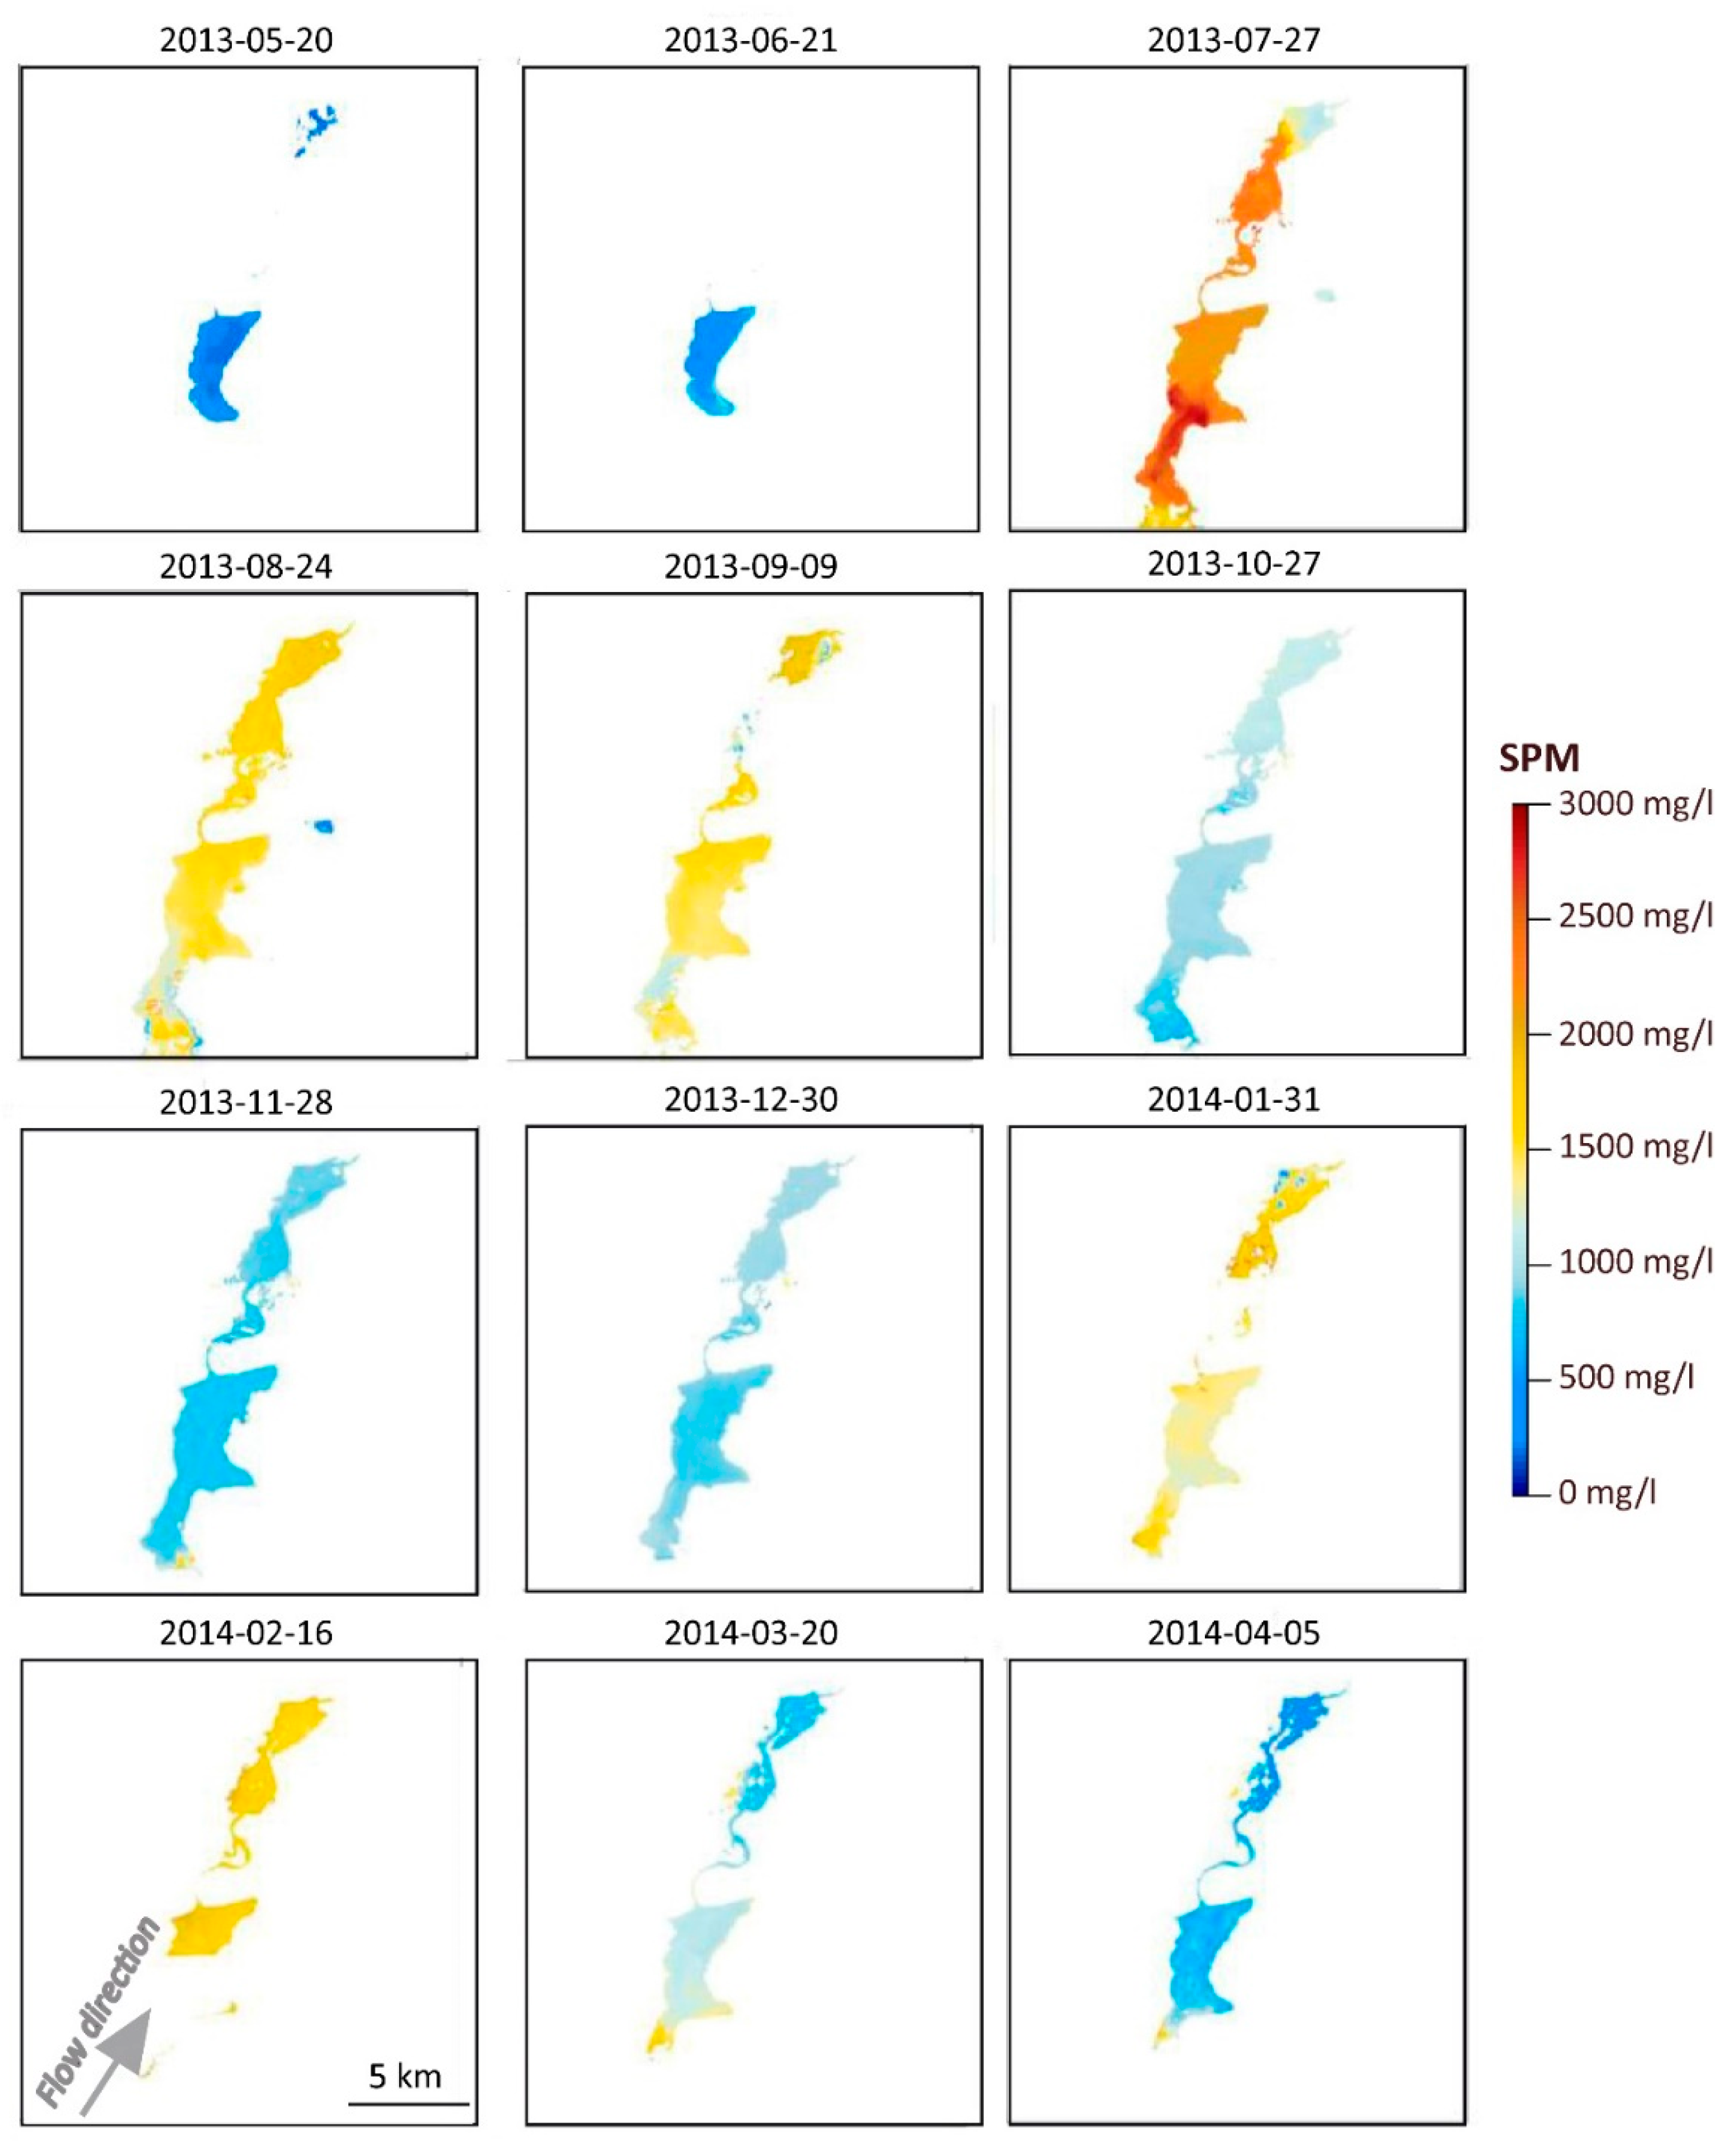
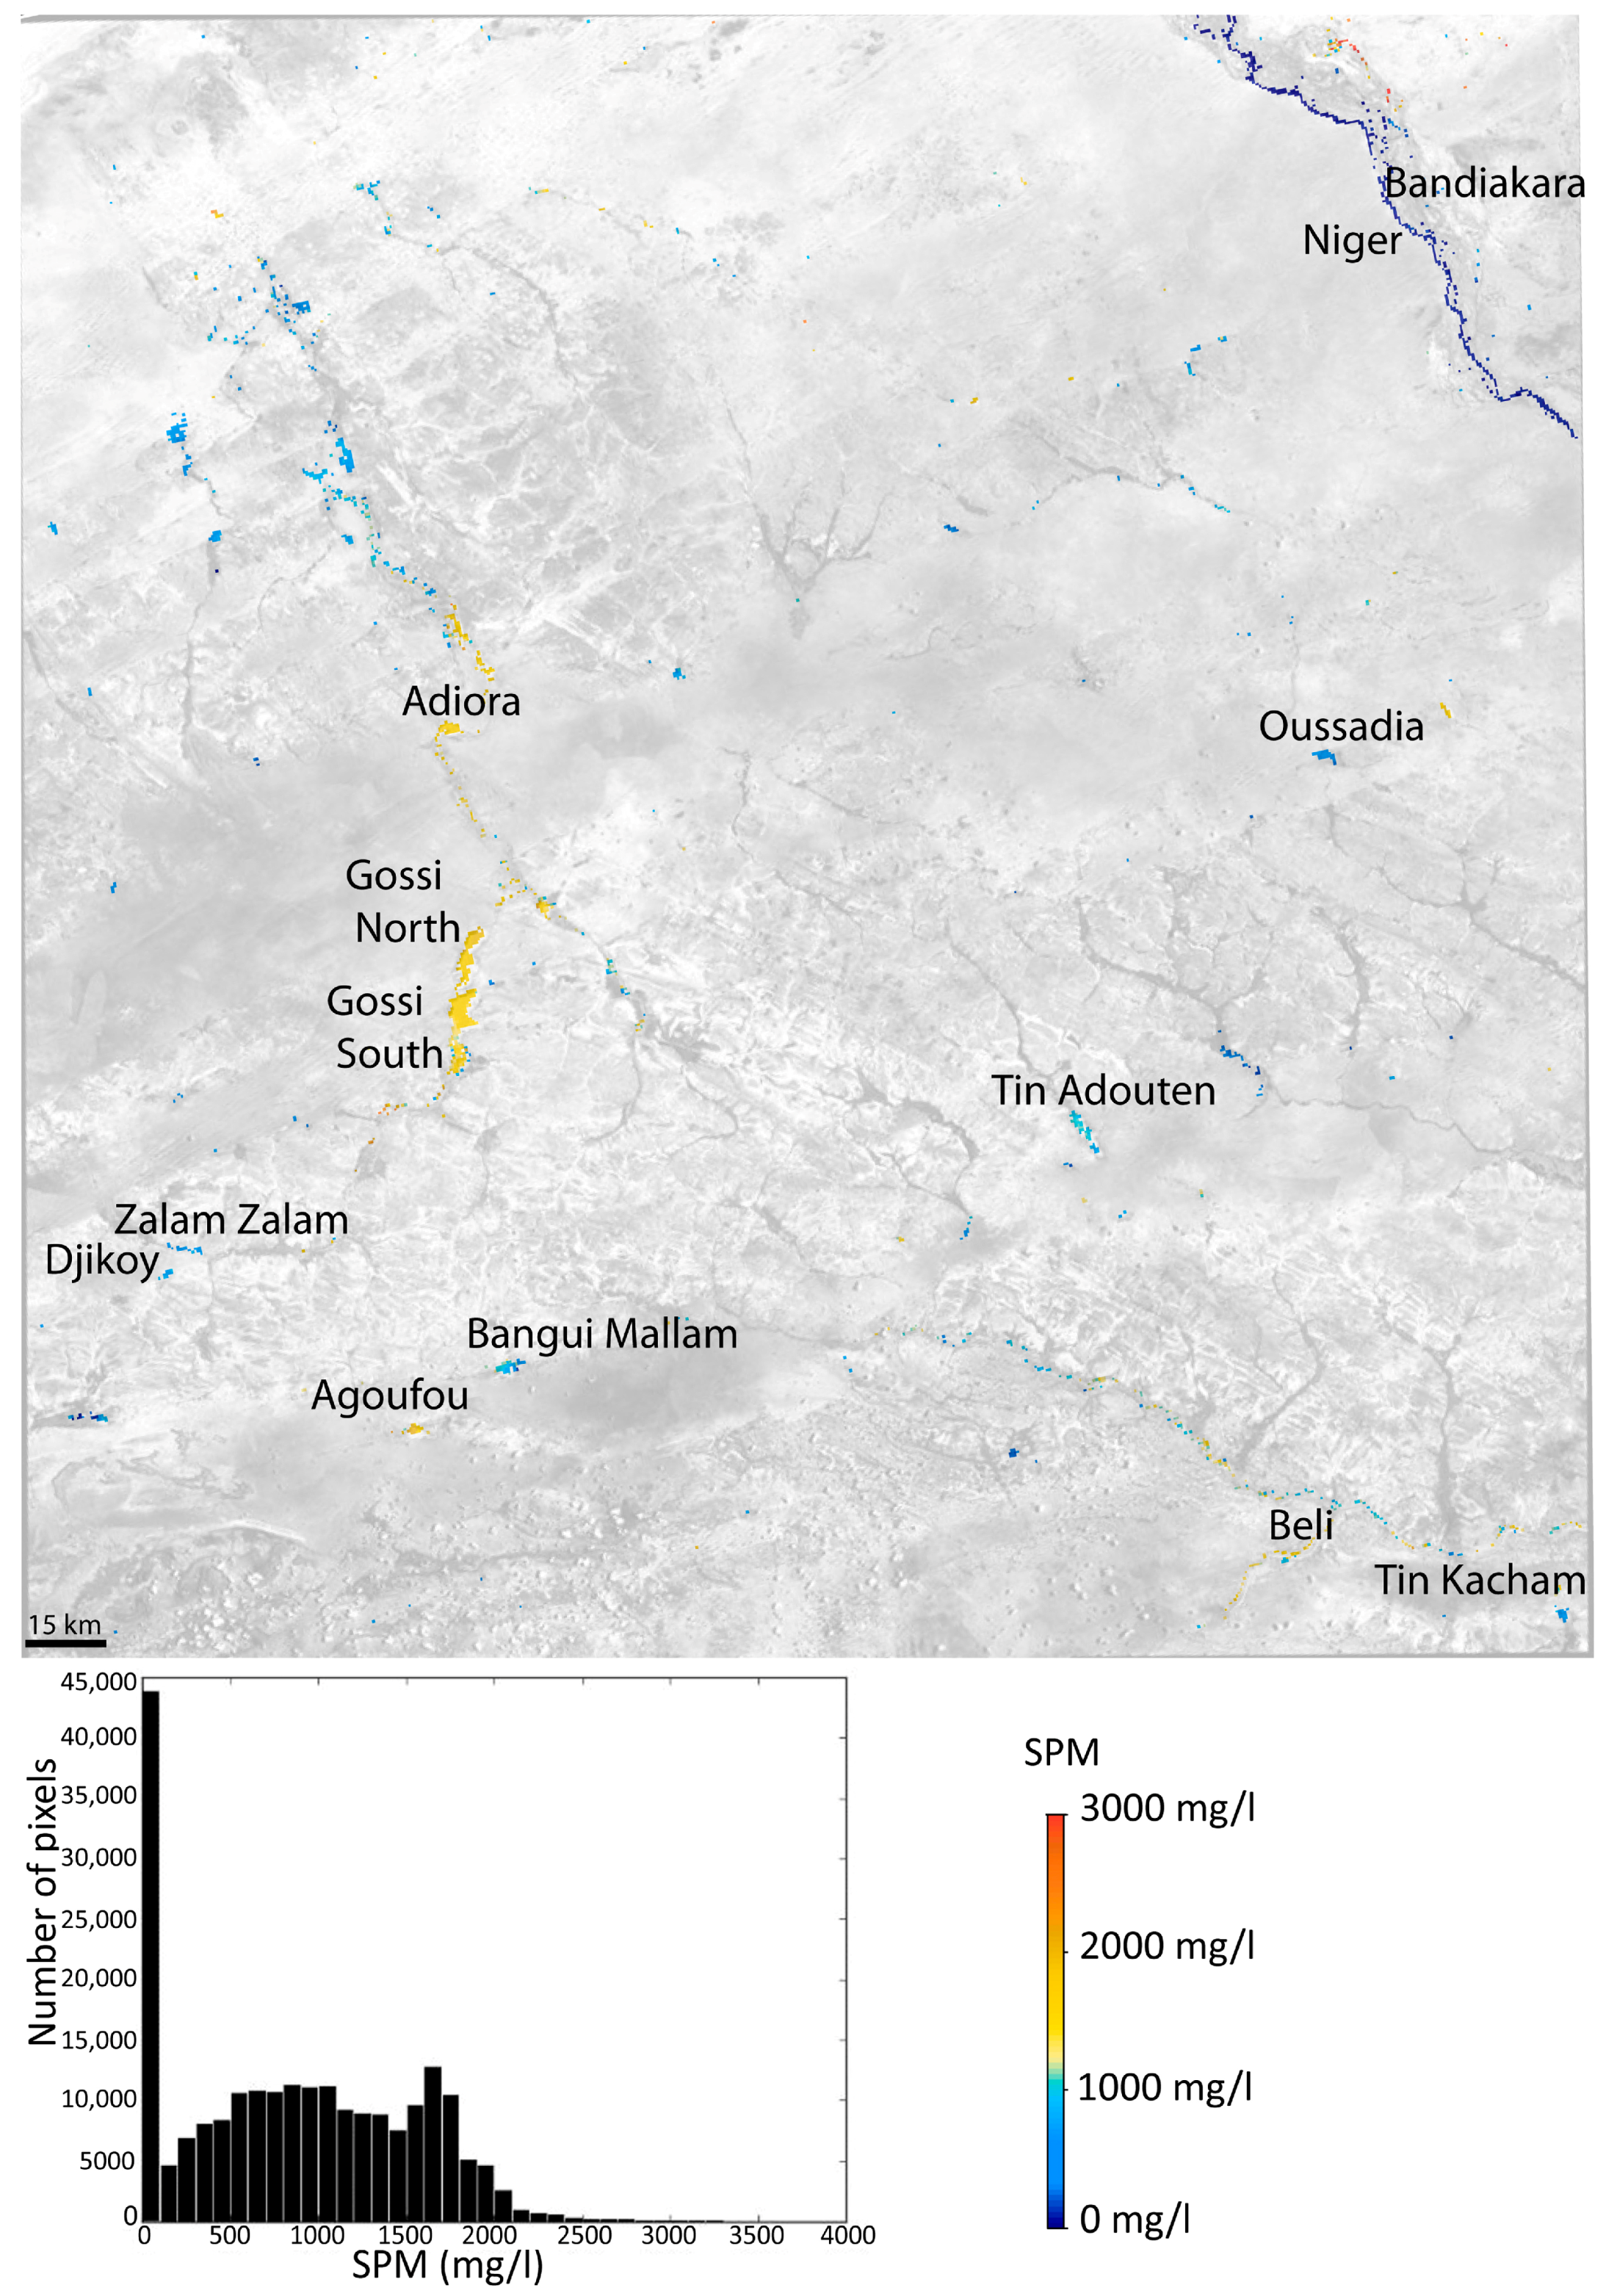
3.5. Spatial Variability within and across Ponds and Lakes in the Gourma Region
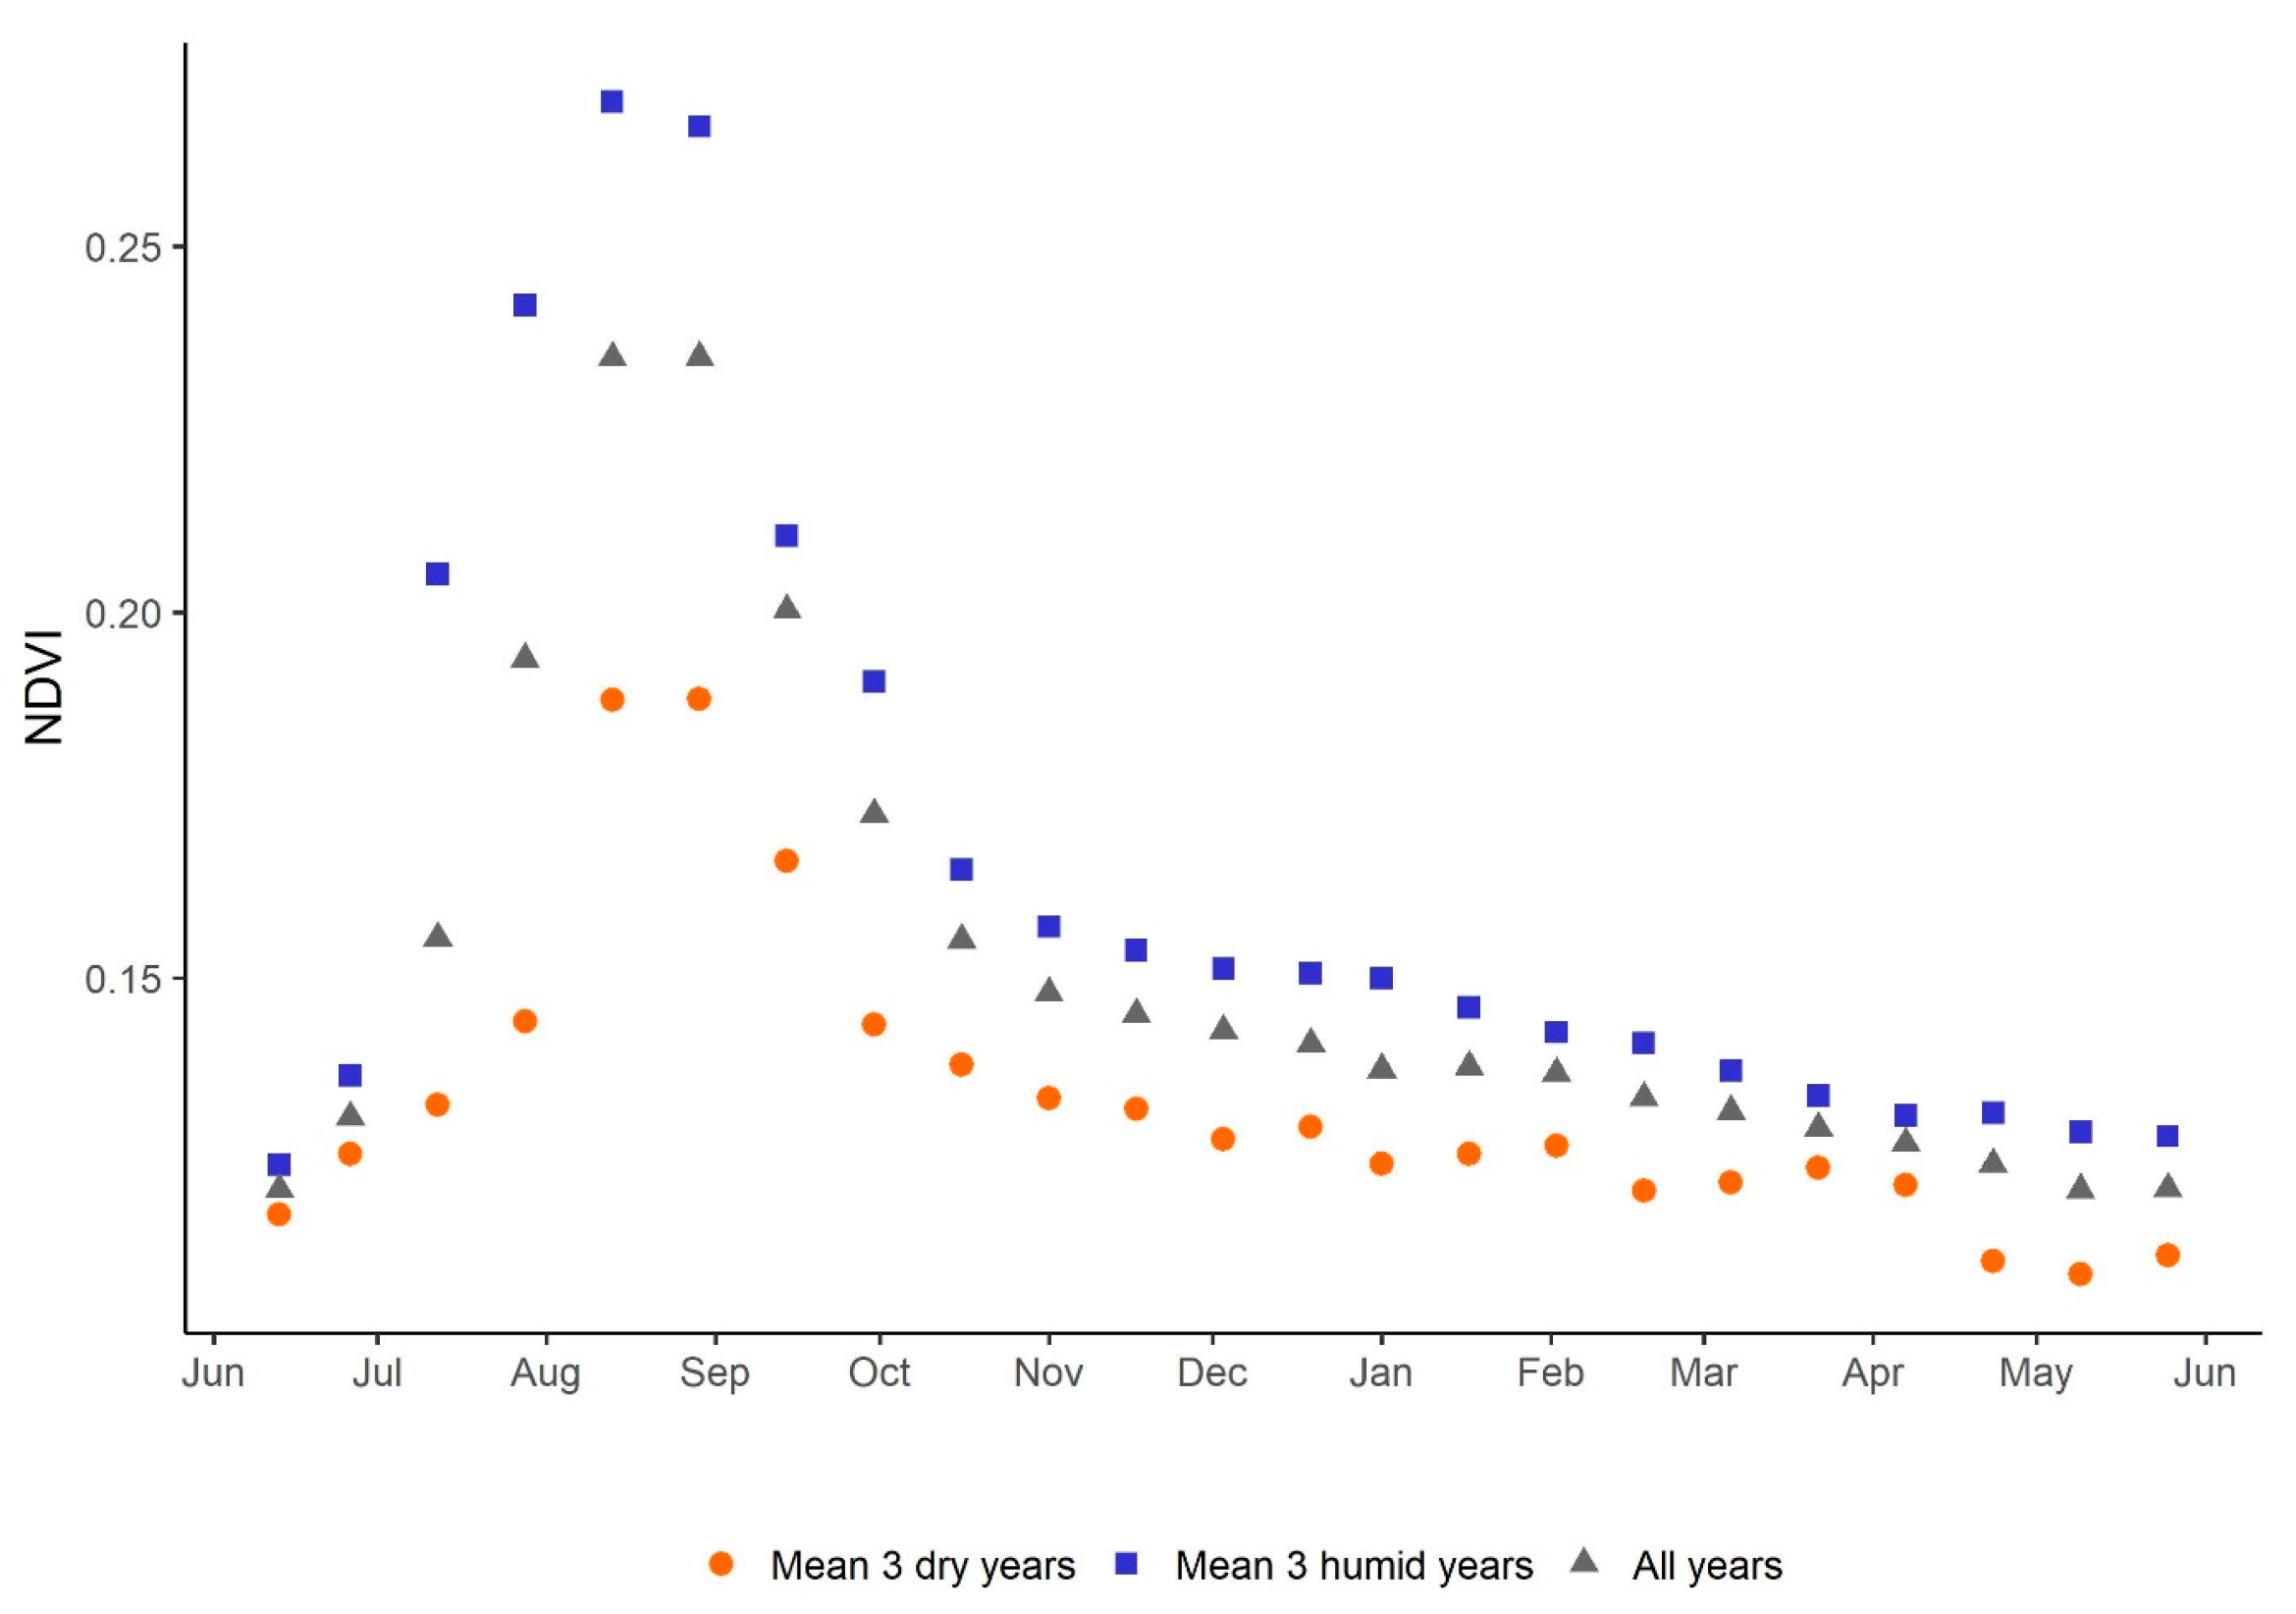
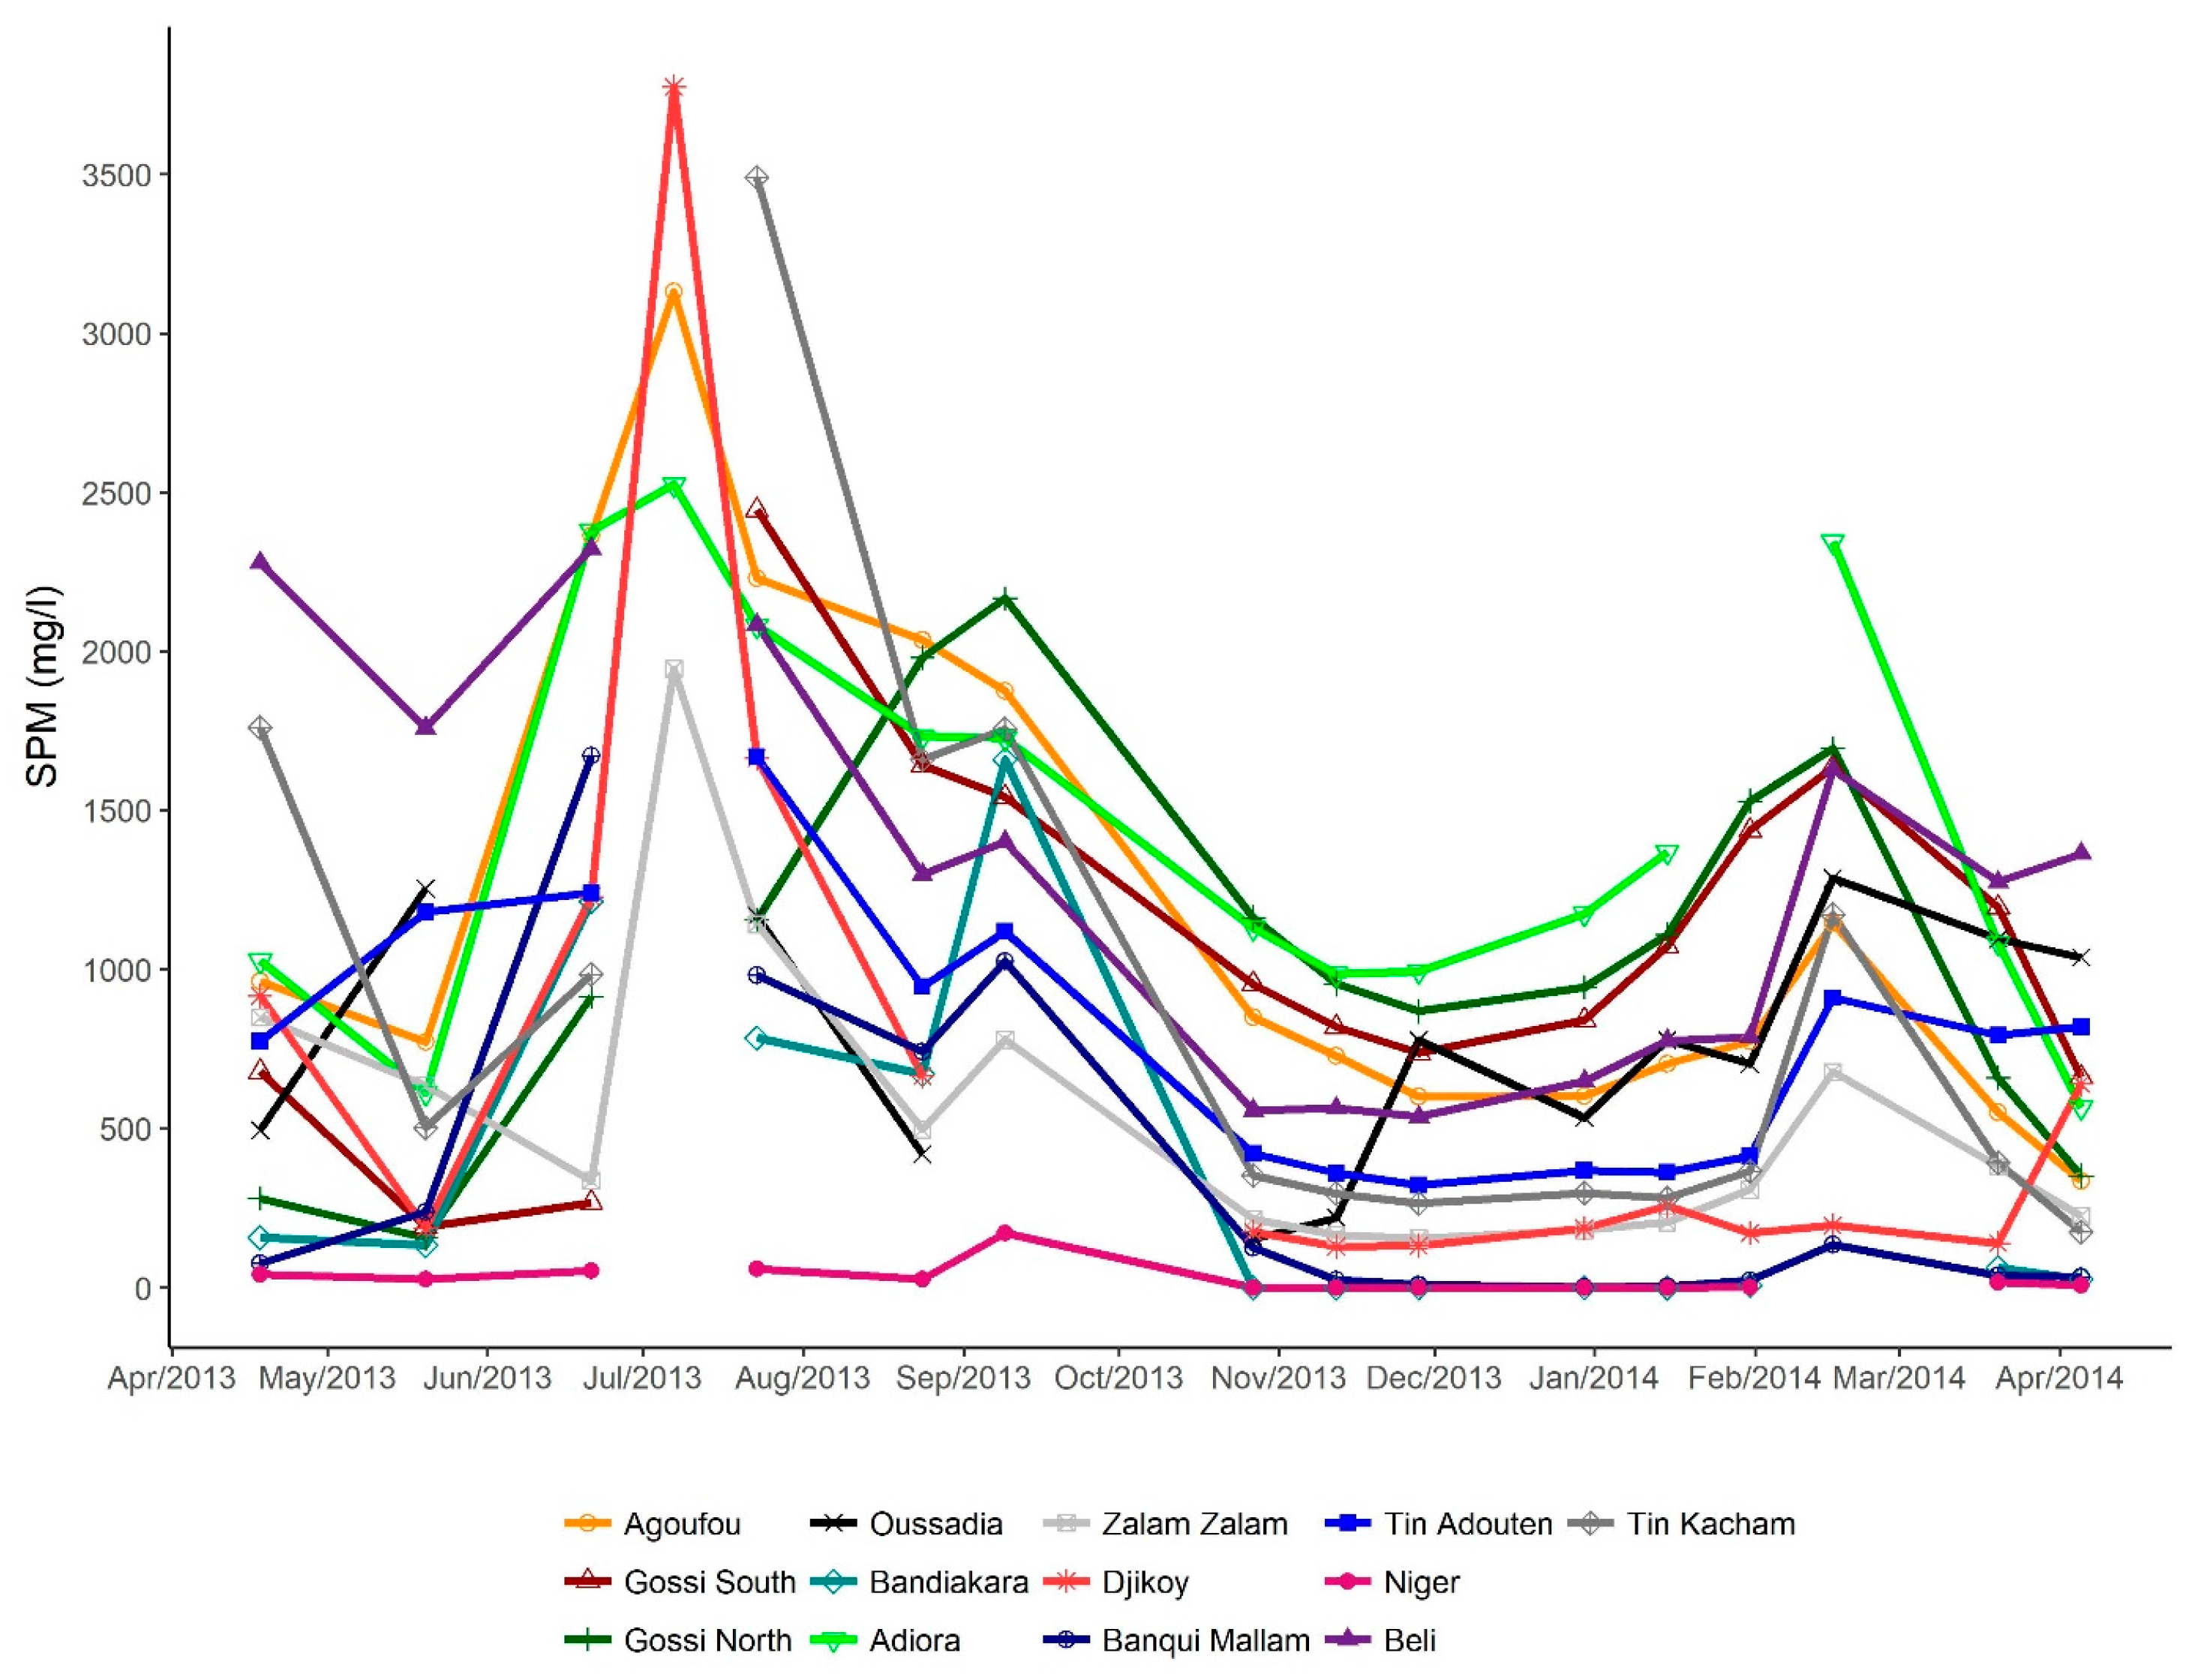
3.5.1. SPM Seasonal Cycle of Quasi Permanent Water Bodies in the Region
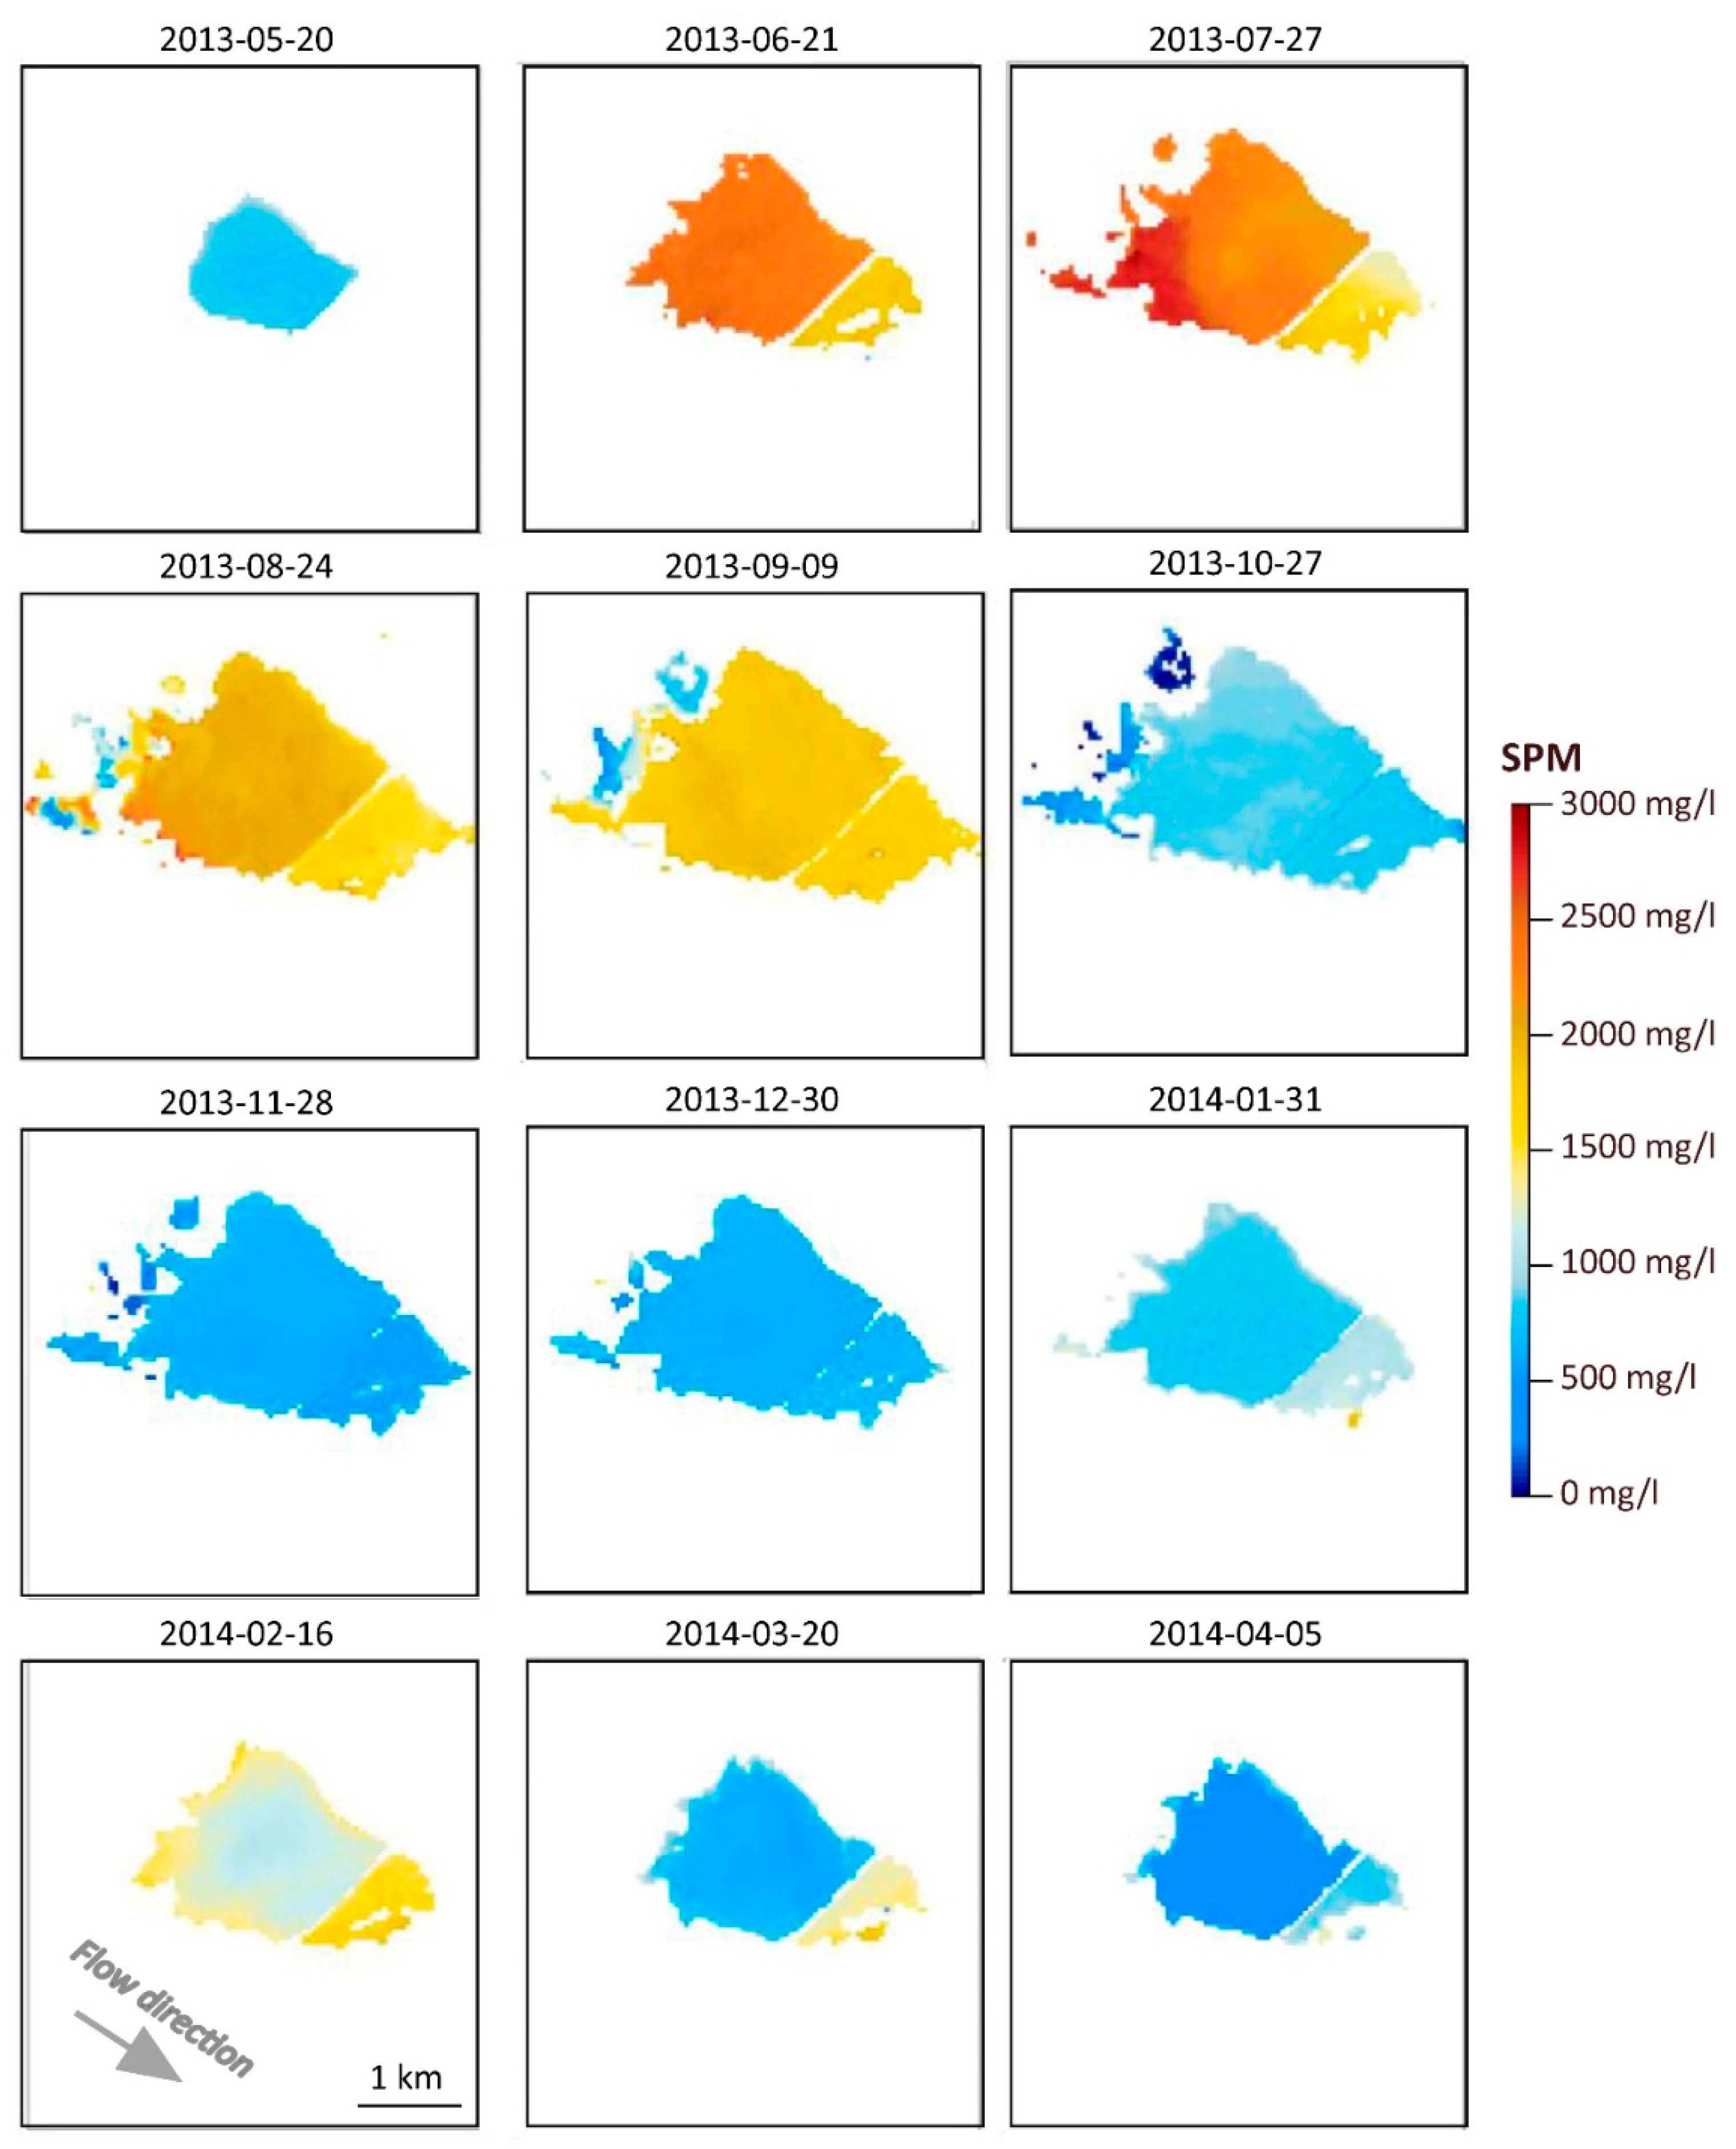
3.5.2. Spatial Distribution within Lakes
3.5.3. Spatial Variability across Water Bodies in the Region
4. Discussion
5. Conclusions
Acknowledgments
Author Contributions
Conflicts of Interest
References
- Descroix, L.; Mahé, G.; Lebel, T.; Favreau, G.; Galle, S.; Gautier, E.; Olivry, J.; Albergel, J.; Amogu, O.; Cappelaere, B.; et al. Spatio-temporal variability of hydrological regimes around the boundaries between Sahelian and Sudanian areas of West Africa: A synthesis. J. Hydrol. 2009, 375, 1–2. [Google Scholar] [CrossRef]
- Favreau, G.; Cappelaere, B.; Massuel, S.; Leblanc, M.; Boucher, M.; Boulain, N.; Leduc, C. Land clearing, climate variability, and water resources increase in semiarid southwest Niger: A review. Water Resour. Res. 2009, 45, 1–18. [Google Scholar] [CrossRef]
- Leblanc, M.J.; Favreau, G.; Massuel, S.; Tweed, S.O.; Loireau, M.; Cappelaere, B. Land clearance and hydrological change in the Sahel: SW Niger. Glob. Planet. Chang. 2008, 61, 135–150. [Google Scholar] [CrossRef]
- Gardelle, J.; Hiernaux, P.; Kergoat, L.; Grippa, M. Less rain, more water in ponds : A remote sensing study of the dynamics of surface waters from 1950 to present in pastoral Sahel (Gourma region, Mali). Hydrol. Earth Syst. Sci. 2010, 14, 309–324. [Google Scholar] [CrossRef] [Green Version]
- Gal, L.; Grippa, M.; Hiernaux, P.; Peugeot, C.; Mougin, E.; Kergoat, L. Changes in lakes water volume and runoff over ungauged Sahelian watersheds. J. Hydrol. 2016, 540, 1176–1188. [Google Scholar] [CrossRef]
- Dardel, C.; Kergoat, L.; Hiernaux, P.; Grippa, M.; Mougin, E.; Ciais, P.; Nguyen, C.-C. Rain-Use-Efficiency: What it Tells about the Conflicting Sahel Greening and Sahelian Paradox. Remote Sens. 2014, 6, 1–26. [Google Scholar] [CrossRef] [Green Version]
- Gal, L.; Grippa, M.; Hiernaux, P.; Pons, L.; Kergoat, L. Modeling the paradoxical evolution of runoff in pastoral Sahel. The case of the Agoufou watershed, Mali. Hydrol. Earth Syst. Sci. 2017, 21, 4591–4613. [Google Scholar] [CrossRef]
- Frappart, F.; Hiernaux, P.; Guichard, F.; Mougin, E.; Kergoat, L.; Arjounin, M.; Lavenu, F.; Koité, M.; Paturel, J.-E.; Lebel, T. Rainfall regime across the Sahel band in the Gourma region, Mali. J. Hydrol. 2009, 375, 128–142. [Google Scholar] [CrossRef] [Green Version]
- Panthou, G.; Vischel, T.; Lebel, T. Recent trends in the regime of extreme rainfall in the Central Sahel. Int. J. Climatol. 2014, 34, 3998–4006. [Google Scholar] [CrossRef]
- Taylor, C.; Belušić, D.; Guichard, F.; Parker, D.J.; Vischel, T.; Bock, O.; Harris, P.P.; Janicot, S.; Klein, C.; Panthou, G. Frequency of extreme Sahelian storms tripled since 1982 in satellite observations. Nature 2017, 544, 475–478. [Google Scholar] [CrossRef] [PubMed]
- Rochelle-Newall, E.; Nguyen, T.M.H.; Le, T.P.Q.; Sengtaheuanghoung, O.; Riblozi, O. A short review of fecal indicator bacteria in tropical aquatic ecosystem: Knowledge gaps and future directions. Front. Microbiol. 2015, 6, 1–15. [Google Scholar] [CrossRef] [PubMed]
- Troeger, C.; Forouzanfar, M.; Rao, P.C.; Khalil, I.; Brown, A.; Reiner, R.C.; Fullman, N., Jr.; Thompson, R.L.; Abajobir, A.; Ahmed, M.; et al. Estimates of global, regional, and national morbidity, mortality, and aetiologies of diarrhoeal diseases: A systematic analysis for the Global Burden of Disease Study 2015. Lancet Infect. Dis. 2017. [Google Scholar] [CrossRef]
- Gangneron, F.; Becerra, S.; Dia, A.H. Des pompes et des hommes. État des lieux des pompes à motricité humaine d’une commune du Gourma malien. Autrepart 2010, 3, 39–56. [Google Scholar] [CrossRef]
- Gangneron, F.; Becerra, S.; Dia, A.H. L’étonnante diversité des ressources en eau à Hombori. Entre contrastes environnementaux, pratiques locales et technologies extérieures. Revue Tiers Monde 2010, 4, 109–128. [Google Scholar] [CrossRef]
- Doxaran, D.; Ruddick, K.; McKee, D.; Gentili, B.; Tailliez, D.; Chami, M.; Babin, M. Spectral variations of light scattering by marine particles in coastal waters, from visible to near infrared. Limnol. Oceanogr. 2009, 54, 1257–1271. [Google Scholar] [CrossRef]
- Petus, C.; Chust, G.; Gohin, F.; Doxaran, D.; Froidefond, J.M.; Sagarminaga, Y. Estimating turbidity and total suspended matter in the Adour River plume (South Bay of Biscay) using MODIS 250-m imagery. Cont. Shelf Res. 2010, 30, 379–392. [Google Scholar] [CrossRef]
- Babin, M.; Morel, A.; Fournier-Sicre, V.; Fell, F.; Stramski, D. Light scattering properties of marine particles in coastal and open ocean waters as related to the particle mass concentration. Limnol. Oceanogr. 2003, 48, 843–859. [Google Scholar] [CrossRef]
- Dogliotti, A.I.; Ruddick, K.G.; Nechad, B.; Doxaran, D.; Knaeps, E. A single algorithm to retrieve turbidity from remotely-sensed data in all coastal and estuarine waters. Remote Sens. Environ. 2015, 156, 157–168. [Google Scholar] [CrossRef]
- Moore, G.K. Satellite remote sensing of water turbidity/Sonde de télémesure par satellite de la turbidité de l’eau. Hydrol. Sci. Bull. 1980, 25, 407–421. [Google Scholar] [CrossRef]
- Morel, A.; Prieur, L. Analysis of variation in ocean color. Lymnol. Oceanogr. 1977, 22, 709–722. [Google Scholar] [CrossRef]
- Morel, A.; Gentili, B. Diffuse reflectance of oceanic waters. III. Implication of bidirectionality for the remote-sensing problem. Appl. Opt. 1996, 35, 4850–4862. [Google Scholar] [CrossRef] [PubMed]
- Nechad, B.; Ruddick, K.G.; Park, Y. Calibration and validation of a generic multisensor algorithm for mapping of total suspended matter in turbid waters. Remote Sens. Environ. 2010, 114, 854–866. [Google Scholar] [CrossRef]
- Novoa, S.; Doxaran, D.; Ody, A.; Vanhellemont, Q.; Lafon, V.; Lubac, B.; Gernez, P. Atmospheric corrections and multi-conditional algorithm for multi-sensor remote sensing of suspended particulate matter in low-to-high turbidity levels coastal waters. Remote Sens. 2017, 9, 61. [Google Scholar] [CrossRef]
- Martinez, J.-M.; Guyot, J.-L.; Filizola, N.; Sondag, F. Increase in suspended sediment discharge of the Amazon River assessed by monitoring network and satellite data. Catena 2009, 79, 257–264. [Google Scholar] [CrossRef]
- Martinez, J.-M.; Espinoza-Villar, R.; Armijos, E.; Silva Moreira, L. The optical properties of river and floodplain waters in the Amazon River Basin: Implications for satellite-based measurements of suspended particulate matter. J. Geophys. Res. 2015, 120, 1274–1287. [Google Scholar] [CrossRef]
- Feng, L.; Hu, C.; Chen, X.; Tian, L.; Chen, L. Human induced turbidity changes in Poyang Lake between 2000 and 2010: Observations from MODIS. J. Geophys. Res. 2012, 117, 1–19. [Google Scholar] [CrossRef]
- Kaba, E.; Philpot, W.; Steenhuis, T. Evaluating suitability of MODIS-Terra images for reproducing historic sediment concentrations in water bodies: Lake Tana, Ethiopia. Int. J. Appl. Earth Obs. Geoinform. 2014, 26, 286–297. [Google Scholar] [CrossRef]
- Robert, E.; Grippa, M.; Kergoat, L.; Pinet, S.; Gal, L.; Cochonneau, G.; Martinez, J.-M. Monitoring water turbidity and surface suspended sediment concentration of the Bagre Reservoir (Burkina Faso) using MODIS and field reflectance data. Int. J. Appl. Earth Obs. Geoinform. 2016, 52, 243–251. [Google Scholar] [CrossRef]
- Janicot, S.; Ali, A.; Asencio, N.; Berry, G.; Bock, O.; Bourles, B.; Caniaux, G.; Chauvin, F.; Deme, A.; Kergoat, L.; et al. Large-scale overview of the summer monsoon over West and Central Africa during the AMMA field experiment in 2006. Ann. Geophys. 2008, 26, 2569–2595. [Google Scholar] [CrossRef] [Green Version]
- Gernez, P.; Lafon, V.; Lerouxel, A.; Curti, C.; Lubac, B.; Cerisier, S.; Barill, L. Toward sentinel-2 high resolution remote sensing of suspended particulate matter in very turbid waters: SPOT4 (Take5) experiment in the Loire and Gironde estuaries. Remote Sens. 2015, 7, 9507–9528. [Google Scholar] [CrossRef]
- Wang, J.-J.; Lu, X.X.; Liew, S.C.; Zhou, Y. Retrieval of suspended sediment concentrations in large turbid rivers using Landsat ETM+: An example from the Yangtze River, China. Earth Surface Process. Landf. 2009, 34, 1082–1092. [Google Scholar] [CrossRef]
- Soti, V.; Puech, C.; Lo Seen, D.; Bertran, A.; Vignolles, C.; Mondet, B.; Dessay, N.; Tran, A. The potential for remote sensing and hydrologic modelling to assess the spatio-temporal dynamics of ponds in the Ferlo Region (Senegal). Hydrol. Earth Syst. Sci. 2010, 14, 1449–1464. [Google Scholar] [CrossRef] [Green Version]
- Haas, E.M.; Bartholomé, E.; Combal, B. Time series analysis of optical remote sensing data for the mapping of temporary surface water bodies in sub-Saharan western Africa. J. Hydrol. 2009, 370, 52–63. [Google Scholar] [CrossRef]
- Mougin, E.; Hiernaux, P.; Kergoat, L.; Grippa, M.; de Rosnay, P.; Timouk, F.; Le Dantec, V.; Demarez, V.; Lavenu, F.; Arjounin, M.; et al. The AMMA-CATCH Gourma observatory site in Mali: Relating climatic variations to changes in vegetation, surface hydrology, fluxes and natural resources. J. Hydrol. 2009, 375, 14–33. [Google Scholar] [CrossRef] [Green Version]
- Lebel, T.; Cappelaere, B.; Galle, S.; Hanan, N.; Kergoat, L.; Levis, S.; Vieux, B.; Descroix, L.; Gosset, M.; Mougin, E.; et al. AMMA-CATCH studies in the Sahelian region of West-Africa: An overview. J. Hydrol. 2009, 375, 1–2. [Google Scholar] [CrossRef] [Green Version]
- Gal, L. Modélisation de L’évolution Paradoxale de l’hydrologie Sahélienne: Application au Bassin d’Agoufou (Mali). In Interfaces Continentales, Environnement; Université Paul Sabatier: Toulouse, France, 2016; Available online: https://tel.archives-ouvertes.fr/tel-01484584v2/document (accessed on 6 November 2017).
- Diawara, M.O. Impact de la Variabilité Climatique au Nord Sahel (Gourma, Mali) sur la Dynamique des Ressources Pastorales, Conséquences sur les Productions Animales. Ph.D. Thesis, Université Toulouse 3, Toulouse, France, 2015. [Google Scholar]
- Prévost, Y. Analyse spatiale de la pression animale comme facteur de désertification dans le nord du Sénégal. In Apports de la Télédétection à la Lutte Contre La Sécheresse; Compte-rendu Des Journées Scientifiques de Thies: Thies, Sénégal, 1989. [Google Scholar]
- Rokni, K.; Ahmad, A.; Selamat, A.; Hazini, S. Water Feature Extraction and Change Detection Using Multitemporal Landsat Imagery. Remote Sens. 2014, 6, 4173–4189. [Google Scholar] [CrossRef]
- Xu, H. Modification of normalised difference water index (NDWI) to enhance open water features in remotely sensed imagery. Int. J. Remote Sens. 2006, 27, 3025–3033. [Google Scholar] [CrossRef]
- Carper, G.L.; Bachmann, R.W. Wind Resuspension of Sediments in a Prairie Lake. J. Can. Sci. Halieut. Aquat. 1984, 41, 1763–1767. [Google Scholar] [CrossRef]
- Sané, S.; Ba, N.; Samb, P.I.; Noba, K.; Arfi, R. Moteurs et conséquences de la resuspension dans un lac sahélien peu profond: Le lac de Guiers au Sénégal. Int. J. Biol. Chem. Sci. 2015, 9, 927–943. [Google Scholar] [CrossRef]
- Lövstedt, C.B.; Bengtsson, L. The role of non-prevailing wind direction on resuspension and redistribution of sediments in a shallow lake. Aquat. Sci. 2008, 70, 304–313. [Google Scholar] [CrossRef]
- Guichard, F.; Kergoat, L.; Mougin, E.; Timouk, F.; Baup, F.; Hiernaux, P.; Lavenu, F. Surface thermodynamics and radiative budget in the Sahelian Gourma: Seasonal and diurnal cycles. J. Hydrol. 2009, 375, 161–177. [Google Scholar] [CrossRef]
- Sterk, G. Causes, consequences and control of wind erosion in Sahelian Africa: A review. Land. Degrad. Dev. 2003, 14, 95–108. [Google Scholar] [CrossRef]
- Green, M.O.; Coco, G. Review of wave-driven sediment resuspension and transport in estuaries. Rev. Geophys. 2014, 52, 77–117. [Google Scholar] [CrossRef]
- Dardel, C.; Kergoat, L.; Hiernaux, P.; Mougin, E.; Grippa, M.; Tucker, C.J. Re-greening Sahel: 30 years of remote sensing data and field observations (Mali, Niger). Remote Sens. Environ. 2014, 140, 340–364. [Google Scholar] [CrossRef]
- Doelling, D.R.; Wu, A.; Xiong, X.; Scarino, B.R.; Bhatt, R.; Haney, C.O.; Morstad, D.; Gopalan, A. The radiometric stability and scaling of collection 6 Terra-and Aqua-MODIS VIS, NIR, and SWIR spectral bands. IEEE Trans. Geosci. Remote Sens. 2015, 53, 4520–4535. [Google Scholar] [CrossRef]
- Beuselinck, L.; Govers, G.; Steegen, A.; Hairsine, P.B.; Poesen, J. Evaluation of the simple settling theory for predicting sediment deposition by overland flow. Earth Surface Process. Landf. 1999, 24, 993–1007. [Google Scholar] [CrossRef]
- Brune, G.M. Trap efficiency of reservoirs. Trans. Am. Geophys. Union 1953, 34, 407–418. [Google Scholar] [CrossRef]
- Pinet, S.; Martinez, J.M.; Gosset, C.; Grippa, M.; Robert, E.; Ouillon, S.; Kergoat, L. Monitoring of suspended particulate matter concentration using sentinel-2, landsat-8 and spot-5 data over highly turbid waters in a West African reservoir. In preparation.
- Doxaran, D.; Froidefond, J.M.; Lavender, S.; Castaing, P. Spectral signature of highly turbid waters: Application with SPOT data to quantify suspended particulate matter concentrations. Remote Sens. Environ. 2002, 81, 149–161. [Google Scholar] [CrossRef]
- Knaeps, E.; Ruddick, K.G.; Doxaran, D.; Dogliotti, A.I.; Nechad, B.; Raymaekers, D.; Sterckx, S. A SWIR based algorithm to retrieve total suspended matter in extremely turbid waters. Remote Sens. Environ. 2015, 168, 66–79. [Google Scholar] [CrossRef]


| Spectral Band (μm) | Landsat-7 ETM+ | Landsat-8 OLI | MODIS |
|---|---|---|---|
| Red | 0.631–0.692 | 0.636–0.673 | 0.620–0.670 |
| NIR | 0.772–0.898 | 0.851–0.879 | 0.841–0.876 |
| Landsat 7 and Landsat 8 Images | MODIS Images | ||||||
|---|---|---|---|---|---|---|---|
| Time difference | 0 day | 1 day | 2 days | 3 days | 0 day | 1 day | 2 days |
| SPM | 10 | 16 | 13 | 8 | 26 | 32 | 16 |
| Band | R2: Landsat 7 Data vs. SPM | R2: Landsat 8 Data vs. SPM | R2: Landsat 7 and Landsat 8 Data vs. SPM | R2: MODIS Data vs. SPM | R2: MODIS and Landsat Data vs. SPM |
|---|---|---|---|---|---|
| NIR | 0.42 | 0.83 | 0.73 | 0.68 | 0.70 |
| NIR + R | 0.44 | 0.84 | 0.76 | 0.64 | 0.67 |
© 2017 by the authors. Licensee MDPI, Basel, Switzerland. This article is an open access article distributed under the terms and conditions of the Creative Commons Attribution (CC BY) license (http://creativecommons.org/licenses/by/4.0/).
Share and Cite
Robert, E.; Kergoat, L.; Soumaguel, N.; Merlet, S.; Martinez, J.-M.; Diawara, M.; Grippa, M. Analysis of Suspended Particulate Matter and Its Drivers in Sahelian Ponds and Lakes by Remote Sensing (Landsat and MODIS): Gourma Region, Mali. Remote Sens. 2017, 9, 1272. https://doi.org/10.3390/rs9121272
Robert E, Kergoat L, Soumaguel N, Merlet S, Martinez J-M, Diawara M, Grippa M. Analysis of Suspended Particulate Matter and Its Drivers in Sahelian Ponds and Lakes by Remote Sensing (Landsat and MODIS): Gourma Region, Mali. Remote Sensing. 2017; 9(12):1272. https://doi.org/10.3390/rs9121272
Chicago/Turabian StyleRobert, Elodie, Laurent Kergoat, Nogmana Soumaguel, Sébastien Merlet, Jean-Michel Martinez, Mamadou Diawara, and Manuela Grippa. 2017. "Analysis of Suspended Particulate Matter and Its Drivers in Sahelian Ponds and Lakes by Remote Sensing (Landsat and MODIS): Gourma Region, Mali" Remote Sensing 9, no. 12: 1272. https://doi.org/10.3390/rs9121272