Evaluation and Comparison of Long-Term MODIS C5.1 and C6 Products against AERONET Observations over China
by

Aiping Fan
1, 
Wei Chen
1,2,*,
Long Liang
1,
Wenbin Sun
1,
Yi Lin
2,
Huizheng Che
3 and
Xuesheng Zhao
1 1
College of Geoscience and Surveying Engineering, China University of Mining & Technology, Beijing 100083, China
2
Institute of Remote Sensing and GIS, Peking University, Beijing 100871, China
3
Institute of Atmospheric Composition, Chinese Academy of Meteorological Sciences, China Meteorological Administration, Beijing 100081, China
*
Author to whom correspondence should be addressed.
Remote Sens. 2017, 9(12), 1269; https://doi.org/10.3390/rs9121269
Submission received: 26 October 2017
/
Revised: 23 November 2017
/
Accepted: 30 November 2017
/
Published: 7 December 2017
(This article belongs to the Section Atmospheric Remote Sensing)
Abstract
:MODIS (MODerate Resolution Imaging Spectroradiometer) aerosol products are the most widely used satellite retrieved aerosol optic depth (AOD) products, which compensate for the spatial lack of ground-based sun photometer observations. The newly released Collection 6 (C6) aerosol products have some improvements compared to the Collection 5.1 (C5.1) products with optimized algorithms and newly revised upstream products. Additionally, a three-kilometer resolution AOD product was added in the C6 product. In this study, the accuracies and regional applicability of long-term (2001–2015) different MODIS C5.1 and C6 aerosol products in China were evaluated against the 16 AERONET (Aerosol Robotic Network) observations with observations over more than three years. The overall analysis indicates that the C6 DT (Dark Target) 10 km products slightly improved the retrieval accuracies, with about 3% more data falling within the Expected Error (EE) envelope. However, for Deep Blue (DB) products, the C6 algorithm significantly improved the accuracy over all of China, and increased the successful retrieval number by extending retrieval coverages. Regional analysis demonstrated that the C6 DT 10 km product did not perform well in East China, with only 33.5% of retrievals falling within the EE envelope. For the DB product, the C6 algorithm significantly increased the number successfully retrieved, and was more accurate in all four regions in China. The validation of the DT 3 km product suggests large differences existed between the Terra and Aqua results. The accuracy of the Aqua DT 3 km product is obviously higher than that of the Terra DT 3 km product. The results of the study suggest that proper AOD products need to be considered when evaluating aerosol loading situations in different regions in China.
1. Introduction
Aerosols are small, suspended liquid and solid particles in the atmosphere that affect weather [1], climate [2], and human health [3]. Acting as cloud condensation nuclei, they can affect the formation and life of the cloud and increase precipitation [4]. By changing the global energy budget and perturbing the hydrological cycle, the global climate could be influenced by aerosols [5,6]. The fine particles of aerosol particles, PM2.5 and PM10 (particles with aerodynamic diameters less than 2.5 and 10 μm, respectively), penetrate into lungs and seriously affect human health if the concentrations are too high [7,8,9].
Considering the importance of aerosols for the climate, the environment, and public health, the monitoring of aerosol properties with remote sensing techniques have been widely investigated since the 1970s. For example, the Total Ozone Monitoring Suite (TOMS) and Ozone Monitoring Instrument (OMI) have been providing aerosol monitoring products for over 30 years, although the spatial resolution is relatively coarse, as both instruments were initially developed to monitor ozone and other trace gases [10,11]. The Advanced Spaceborne Thermal Emission and Reflection Radiometer (ASTER) has also been used to retrieve aerosol optic depth with its dual-angle view capabilities [12]. Sea-Viewing Wide Field-of-View Sensor (SeaWiFS) measurements were seen as high quality with unprecedented accuracy and long-term stability of its radiometric calibration, and thus provided relatively long-term worldwide AOD measurements to evaluate the aerosol variation trends [13]. The Multi-angle Imaging Spectroradiometer (MIS) provides multi-angular observations and is useful to obtain surface reflectance information in aerosol retrieval [14]. The Advanced Very High Resolution Radiometer (AVHRR) is able to provide a relatively fine resolution aerosol product over oceans [15]. The limitation is that the calibration accuracy of AVHRR is relatively low, restricting the application of AVHRR to aerosol products. Furthermore, for land surface where people live, AVHRR is not able to obtain effective retrievals. Unlike a surface deployed sun-photometer, which is aimed directly at sun and obtains aerosol optic depth (AOD) by the attenuation of solar incidents, the satellite-based remote sensing sensor relies on the reflective and scattering light in the earth-atmosphere system [16]. Thus a problem was created: how to decouple the contribution of the surface and atmosphere. Over an ocean surface, the ocean could be treated as black body for most visible and infrared bands, meaning that the signal received by satellite sensors was mostly contributed by atmosphere components, including molecules and aerosols. Therefore, the retrieval of AOD over an ocean is relatively easy. However, land surfaces are complex as the reflectance over land is heterogeneous, various, and changeable. The retrieval of AOD must obtain the surface reflectance information to decouple the atmosphere and surface contributions. This case has been partly solved by the MODerate resolution Imaging Spectroradiometer (MODIS) Dart Target (DT) algorithm [17]. The DT algorithm found that a relatively stable linear relationship exists between surface reflectances of 0.47, 0.66, and 2.1 μm bands over dark dense vegetation through flight experiments [18]. The MODIS DT AOD results had achieved relatively high accuracy over land and it has been widely used to evaluate the aerosol loading and air quality on regional, country, and global scales [19].
The twin MODIS sensors have been flying on Terra since 2000 and Aqua since 2002, providing wide spectral range (0.45 to 14.5 μm in 36 bands), broad swath coverage (2330 km), high temporal resolution (twice a day), and relatively fine spatial resolution for the monitoring of the global environment. Considering the success of land aerosol retrieval, the MODIS products have been widely applied and evaluated. The DT algorithm has also been updated. The major updates of the MODIS DT algorithm were in the transition from C4 to C5/5.1 [20]. The C5.1 DT AOD was evaluated as a relatively highly accurate. Although widely used, DT AOD only covers land surface with vegetation, so for arid or urban regions, the DT algorithm often fails to obtain effective retrievals. To overcome this problem, the Deep Blue (DB) algorithm was developed to obtain a relatively less accurate AOD product to fill these gaps to provide larger spatial coverage of MODIS AOD [21,22]. Through evaluating the performance of different AOD retrieval schemes, a new MODIS aerosol product, Collection 6 (C6), was developed and released with only “maintenance and modest improvement” [23,24]. In C6 aerosol products, the following major changes were made: (1) the DT algorithm schemes have been slightly changed; (2) the DB algorithm was greatly improved; (3) a kind of DT 3 km AOD product was provided in addition to DT 10 km AOD [25,26]. The C6 algorithm has already been applied to all archived MODIS data and will be applied to the future collected data, whereas the C5.1 algorithm data also will exist. This means that the current archived MODIS aerosol products contain both C5.1 and C6, which provide a unique data source for the evaluation of the new MODIS aerosol products.
In this paper, all MODIS C5.1 and C6 L2 AOD data in China were collected and compared against Aerosol Robotic Network (AEREONET). Observations from 2001 to 2015 were used to evaluate the different aerosol products. Furthermore, the performance of DT 3 km product in C6 was also evaluated over China. The regional differences are included in this paper to evaluate the accuracies of different AOD products in different regions. The results of this paper will provide a comprehensive analysis of the performance of the C6 products over China, where the aerosol loading is very high.
2. Materials and Methods
2.1. MODIS AOD Data
The core data used in this study were the level-2 MODIS/Terra (MOD04) and MODIS/Aqua(MYD04), including Collection C5.1 and 6 daily DT 10 km, DB 10 km and DT 3 km (only for C6) products. The basic principle of DT algorithms is using the relatively stable relationship between shortwave infrared band (2.13 μm) and two visible bands (0.47 μm and 0.66 μm) over dense vegetated land surface to obtain the surface reflectance accompanied with Normalized Difference Vegetation Index (NDVI). After continuous developments and improvements, the DT algorithms have become one of the most widely used algorithms for satellite aerosol in satellite remote sensing applications. Although MODIS DT products are relatively highly accurate satellite-based aerosol products, it is restricted to low reflectance surfaces, such as water, dense vegetation, etc. For bright surfaces, DT products often failed to obtain effective retrievals. The DB algorithm was proposed in the desert, arid, semi-arid, urban, and other areas with low reflectance in deep blue bands and high reflectance in other visible bands. With prescribed aerosol phase function and single scattering albedo, AOD over deep blue bands (e.g., 412 nm) were retrieved and then extrapolated to 550 nm. Compared to C5.1 aerosol products, C6 products have improved radiometric calibration precision. The updated central wavelengths, Rayleigh optical depth, and gas absorption correction were also applied in C6 products. For the DB algorithm, C6 has been upgraded to an enhanced hybrid algorithm, and extended from desert, arid, and semi-arid areas to cloudless, snow-free land surface, densely-vegetated and other dark areas. Furthermore, in C6 a DT and DB merged AOD product was included to cover more regions over land [20,27].
In this study, MODIS aerosol data were obtained from NASA’s Level 1 and Atmosphere Archive and Distribution System (LAADS) (http://ladsweb.nascom.nasa.gov). Terra covered the period of 2001 to 2015 and Aqua covered the period of 2003 to 2015. The MODIS DT product has two kinds of algorithms for land and oceanic surfaces. For both C5.1 and C6, the expected error of the DT 10 km product is ±(0.05 + 0.15τ) over land. The expected error of C6 DT 10 km products over ocean is different and was somewhat improved, but is not discussed in this paper. For the DT 10 km product, C6 also included a new DT 3 km product with a similar retrieval protocol as the DT 10 km product but with finer spatial resolution. The expected error of C6 DT 3 km product is ±(0.05 + 0.2τ) . The expected error of the DB product is ±(0.05 + 0.2τ) for both C5.1 and C6 for better comparisons although the expected error in C6 DB product has been improved to ±(0.03 + 0.2τ). Due to the calibration problem, the C5.1 DB product has not been updated since 2007 for Terra. The enhanced DB product, with improvements in sensor calibration and updates to other parameters, was developed in the C6 products and covered the whole period of MODIS product. In this study, only those MODIS retrievals with sufficient quality with a Quality Assurance (QA) value of 3 were included: SDS Optical_Depth_Land_And_Ocean in the DT 3 km and DT 10 km products and SDS Deep_Blue_Aerosol_Optical_Depth_550_Land in the DB 10 km product.
2.2. AERONET AOD Data
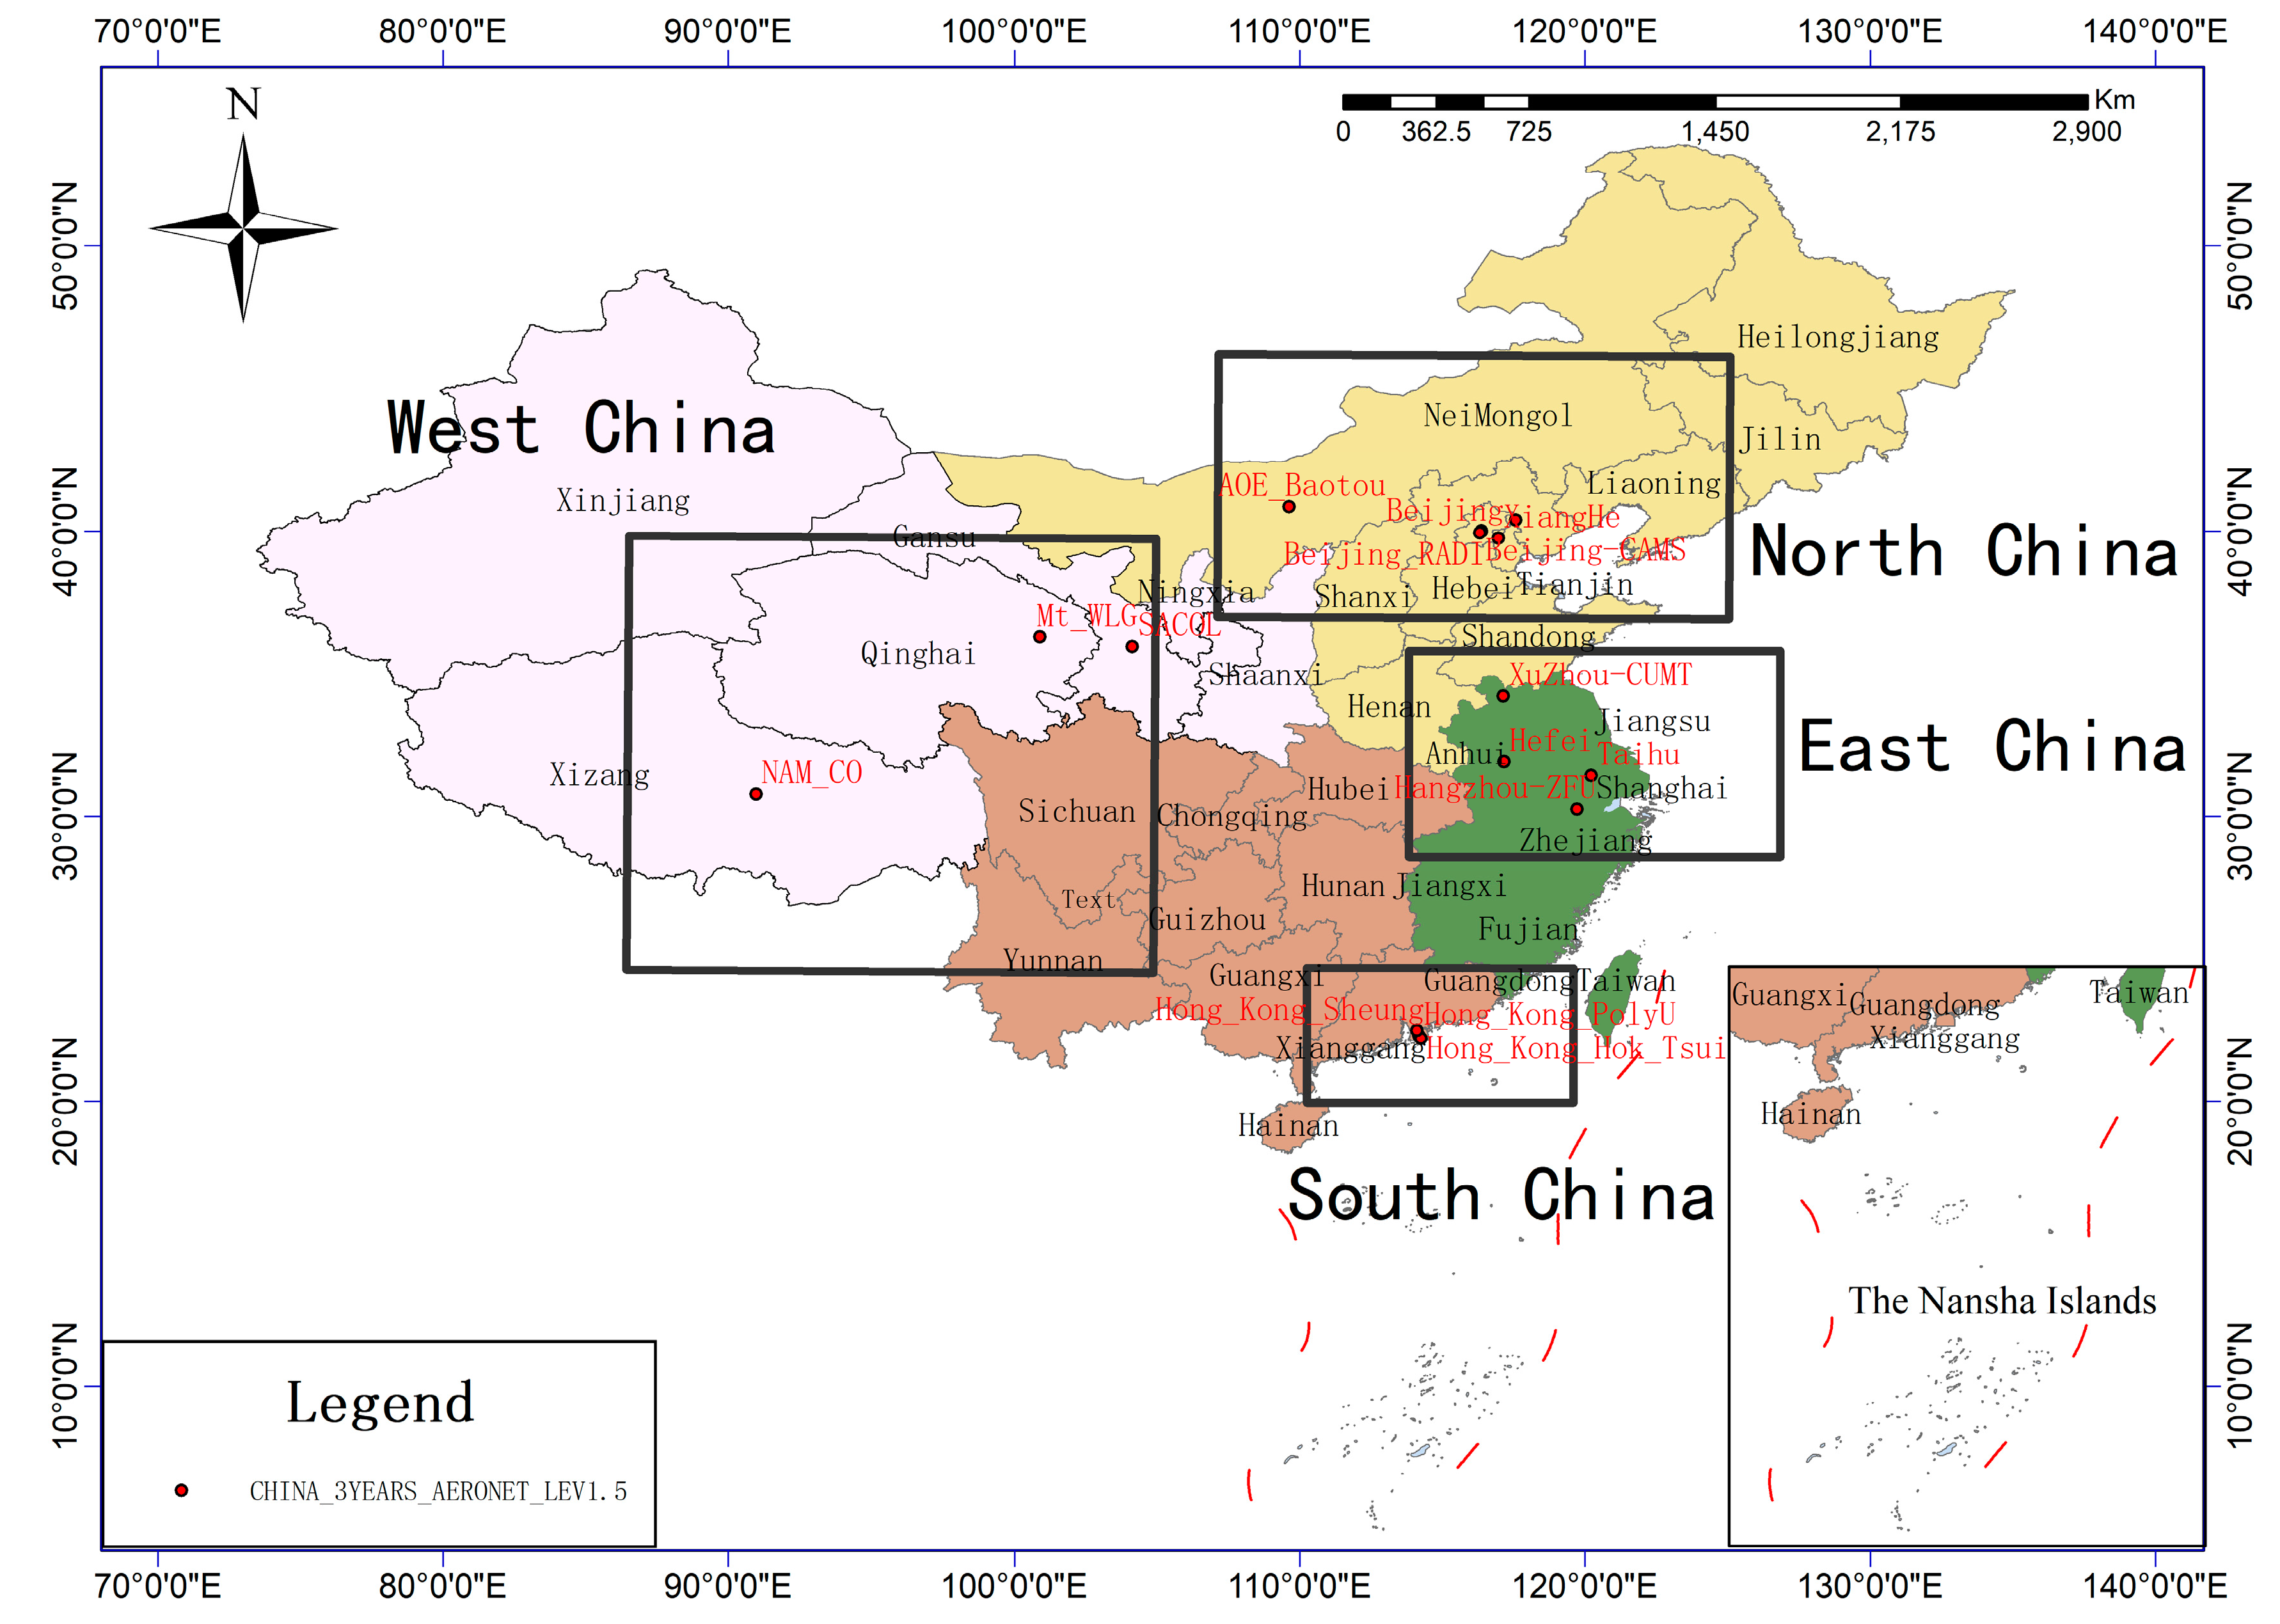
Although satellite-based remote sensing provides instantaneous observations of large areas, the accuracy of MODIS aerosol should be validated by surface-based sun-photometer observations [28,29], most of which include polarization signals to improve the retrieval accuracies. AERONET is a global aerosol properties monitoring sun-photometer network with more 500 stations worldwide. By directly aiming at the sun instead of using the backscattering signal of land-atmosphere system, the sun-photometer avoids the signal “pollution” of land surfaces and has relatively accurate aerosol optic retrievals. The released AERONET AOD products have three levels: Level 1.0 without strict quality checks, Level 1.5 with cloud screening checks, and Level 2.0 with rigorous quality checks. To provide sufficient and qualified data, AERONET stations with more than three years’ worth of Level 1.5 AOD data were selected in this research. In total, 16 stations had more than three years of Level 1.5 AOD product. The distribution of the selected AERONET stations is shown in Figure 1.
2.3. Spatial Matching Methods of MODIS and AERONET
AERONET data are currently the most accurate aerosol product and are the benchmark for verifying MODIS AOD. In this paper, AERONET Level 1.5 data were selected due to the accuracy and volume of data. The following three steps were used to match MODIS AOD and AERONET AOD, similar to a previous study [30]: (1) select an AERONET site with more than three years’ observations; (2) average the effective corresponding 10 km (3 km) MODIS AOD within 25 km (9 km) of an AERONET station; and (3) extract and average the AERONET observation parameters within a temporal interval of ±30 min of the MODIS overpass time including 870 nm AOD and Ångström parameter, and use Equation (1) to interpolate the 550 nm AOD.
where is the AOD of the corresponding wavelength and is the Ångström parameter.
2.4. Validation Methods
Linear fitting of MODIS AOD with corresponding AERONET AOD, denoted as the true value of the real AOD, is the main method for validating the precision and accuracy of MODIS AOD. Due to the systematic observation error and inversion algorithm error, MODIS-retrieved AOD has certain deviations from AERONET AOD. By analyzing the results between different MODIS AOD products and AERONET AOD, several parameters, including determining coefficients R2, ratio falling within the expected error (EE) envelope, root mean square error (RMSE), slope, and intercept, were selected to quantitatively evaluate accuracy and precision of MODIS AOD products.
According to the worldwide evaluation of different MODIS AOD products against sun-photometers, the EE of these MODIS AOD products were acquired. EE is defined by the standard where at least 67% of the global validation data pairs fall within the range [16,24]. In this paper, the accuracy of different MODIS AOD were evaluated with the following criteria: data pairs falling within the corresponding EE envelope were regarded as qualified data, whereas those falling outside the corresponding EE envelope were treated as low accuracy data. According to the validation of different MODIS AOD products, the EEs of MODIS C5.1 DB 10 km, and C6 DT 3 km were the same (). The EE of MODIS DB 10 km was slightly higher to (), but was treated as () for better comparison with the corresponding C5.1 DB product. C5.1 DT 10 km, C6 DT 10 km had higher accuracies of (EE = ) [27,31]. When the MODIS AOD falls within the expected error envelope, it is considered accurate. Root mean square errors (RMSE) were also as according to Equation (2).
3. Results
3.1. Evaluations of MODIS C5.1 and C6 DT 10 km AOD products
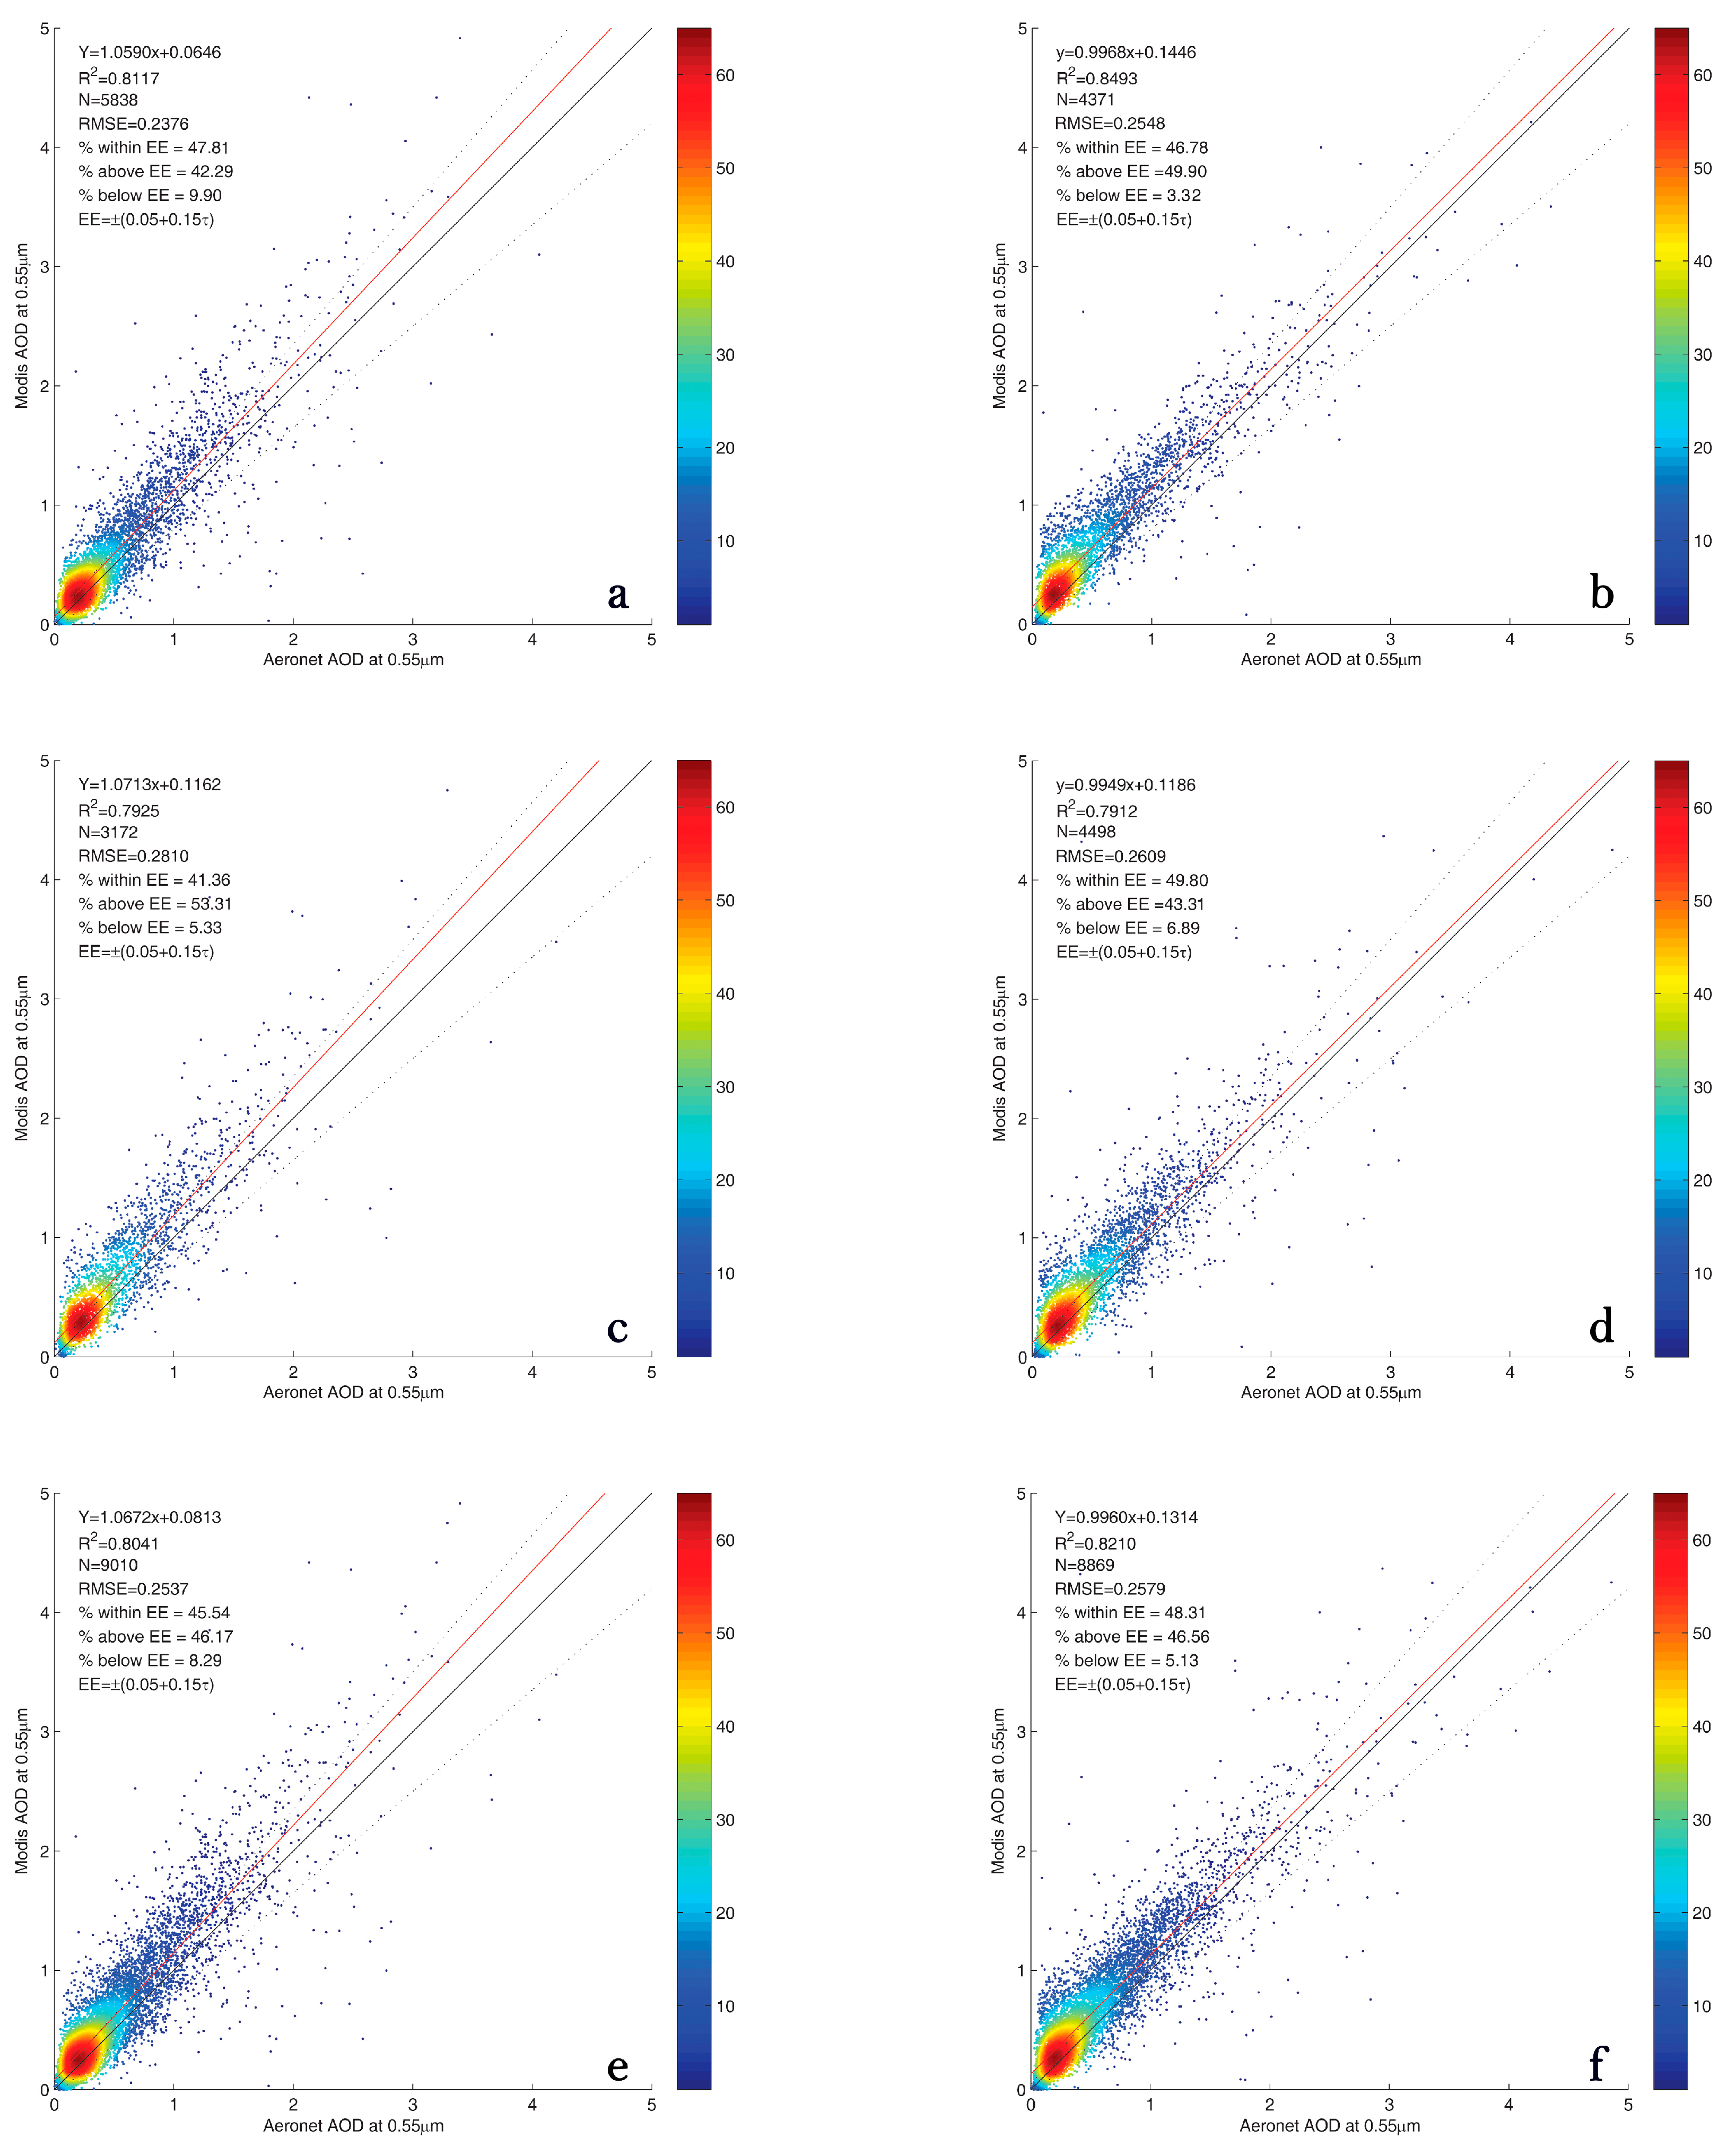
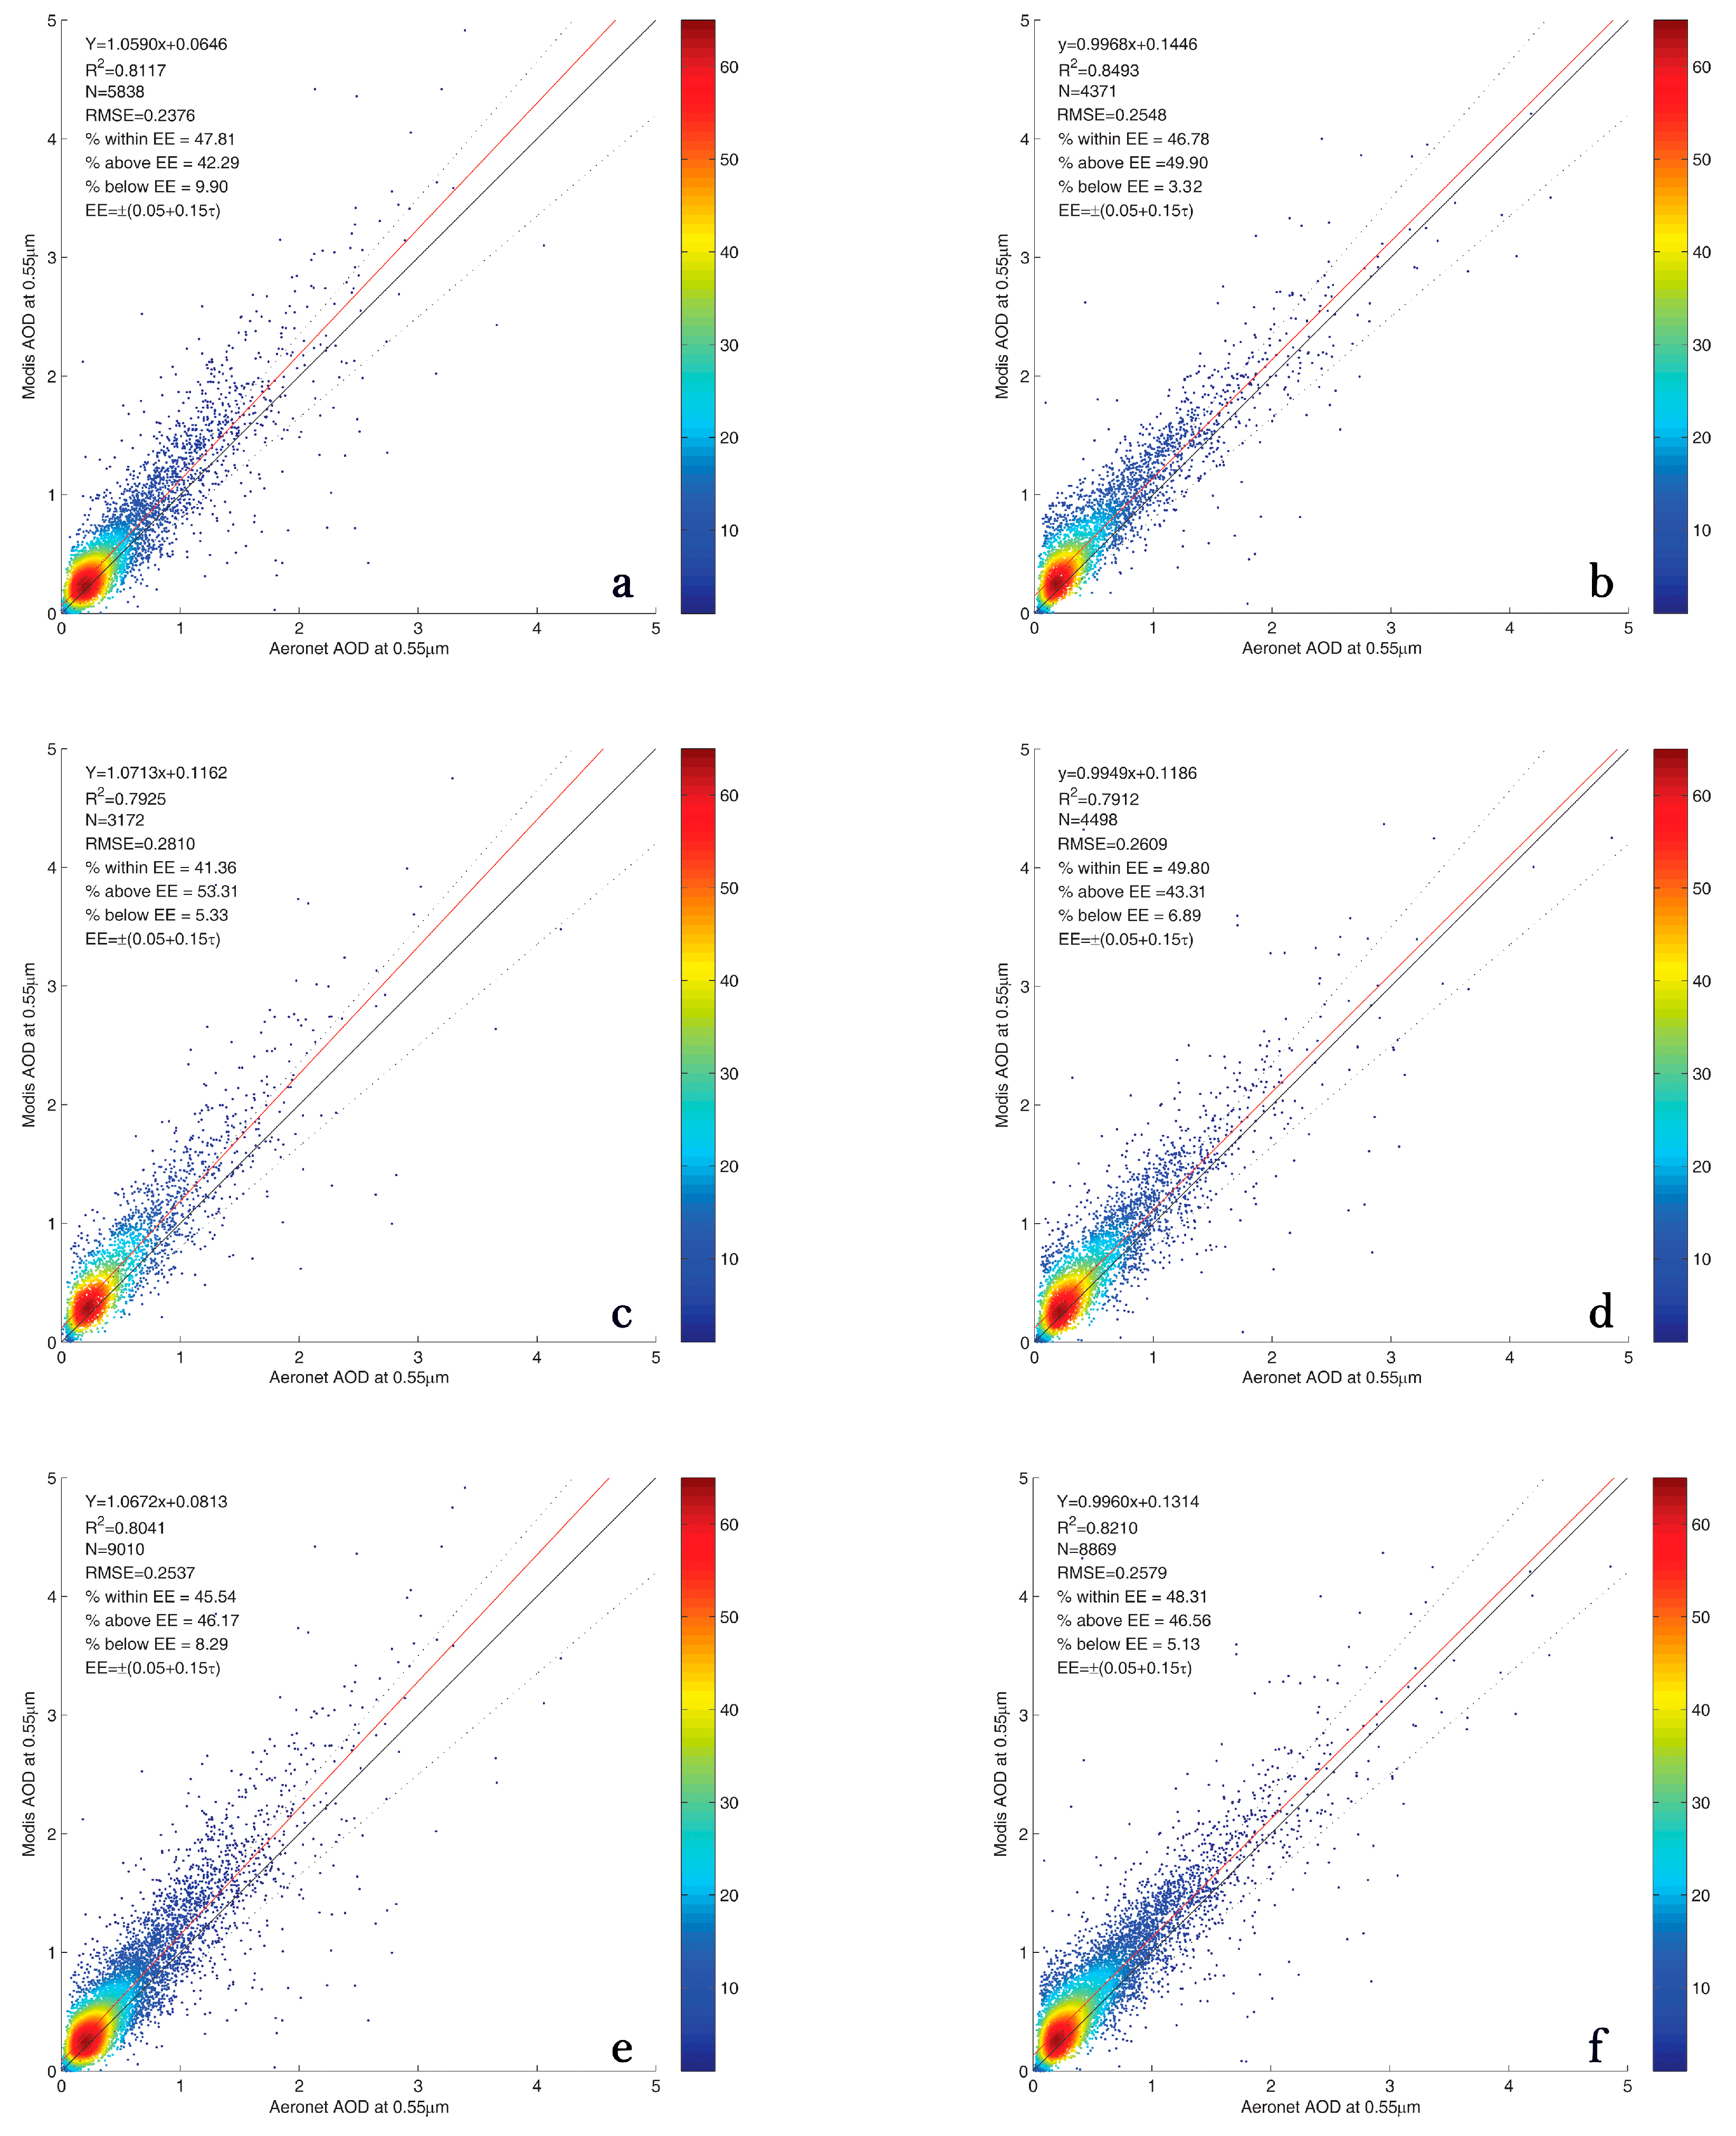
The DT 10 km product is the classic AOD product used in many studies. The validations of Terra (Aqua) C5.1, and C6 DT 10 km AOD products compared to AERONET AOD are shown in Figure 2a,b (Figure 2c,d). For Terra (Aqua), the C6 algorithm has changed the successful retrievals from 5838 (3172) to 4371 (4498), and the percentage of data falling within the EE envelope from 47.81% (41.36%) to 46.78% (49.80%).
Figure 2e,f demonstrate the accuracies of Terra and Aqua combined MODIS DT 10 km products against the observations of the 16 AERONET stations. Overall, C6 10 km AOD had slightly higher accuracy with a larger determination coefficient (0.8210 vs. 0.8041), a larger percentage within EE envelope (48.3% vs. 45.5%), but had a lower total successful retrieval number (8869 vs. 9010) and a higher RMSE (0.2579 vs. 0.2537). The comparison demonstrated that the C6 DT 10 km product is a slight improvement over C5.1 DT 10 km product; but the performance of C6 DT 10 km product in China is still below the global average. The detailed validation results of the C5.1 and C6 DT 10 km products are shown in Table 1.
3.2. Evaluations of MODIS C5.1 and C6 DB 10 km AOD Products
The DB product was initially developed to obtain an AOD value over bright surfaces, such as deserts and other arid regions where DT algorithm usually fails. Figure 3 shows the validation of the C5.1 and C6 DB 10 km products for Terra and Aqua. Due to calibration problems, C5.1 DB AOD for Terra has stopped updating since 2007. Therefore, the comparison of C5.1 and C6 Terra DB AOD was restricted to data before 2007, and Aqua was not affected. Figure 3 indicates that the C6 Terra (Aqua) DB 10 km products have improved percentage of data falling within the EE envelope from 41.72% (40.60%) to 66.70% (61.97%). Determination coefficients in C6 DB 10 km have also significantly improved. Figure 3e,f show the Terra and Aqua combined validations of C5.1 and C6 DB 10 km products. Overall, the C6 DB 10 km products have considerably reduced the overestimation in C5.1 DB 10 km products, with the slope decreasing from 1.2097 to 1.0068. Furthermore, a larger proportion of DB data in the C6 algorithm fell within the EE envelope. These results suggest that the enhanced Deep Blue algorithm adopted in the C6 DB 10 km products has considerably improved accuracy for both Terra and Aqua. The detailed validation statistical results of the C5.1 and C6 DB 10 km products are shown in Table 2.
3.3. Inter-Comparison Between C5.1 and C6 AOD Products
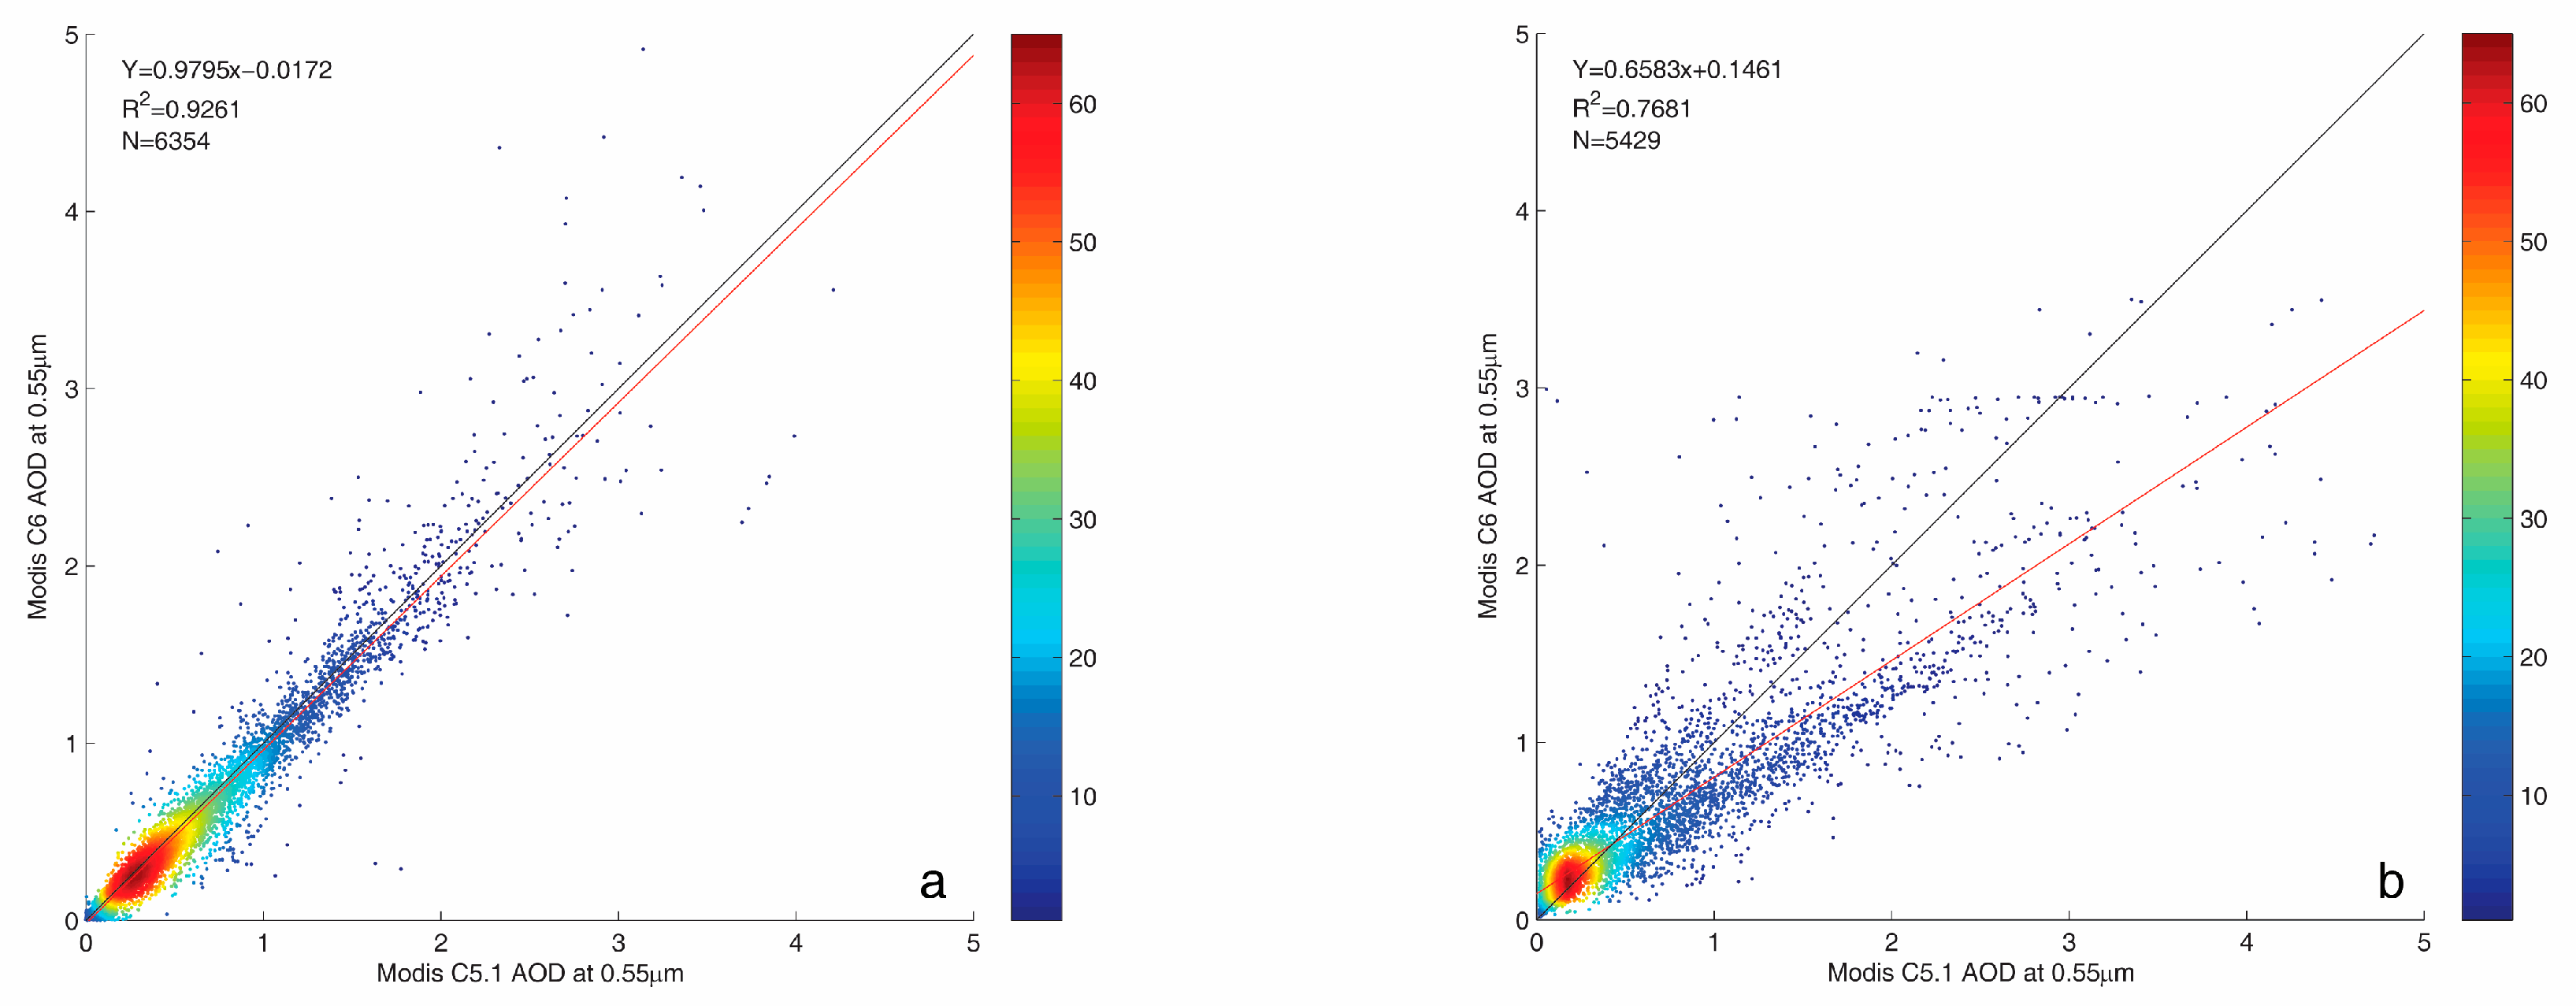
The consistencies of the C6 AOD products were analyzed by comparing the C5.1 and C6 retrievals for the selected AERONET stations. Figure 4 demonstrates the comparison of DT 10 km and DB 10 km products. The inter-comparison results suggest that the consistency of the DT 10 km products is very good, with a large determination coefficient (R2 = 0.9261) and a good linear regression result. For DB 10 km products, the differences between C5.1 and C6 were obvious. C6 DB 10 km AOD was systematically lower than C5.1 DB 10 km AOD. This result coincides with those demonstrated in the previous section: a considerable improvement has been made in the C6 DB 10 km product.
3.4. Evaluation of the DT 3 km AOD Product
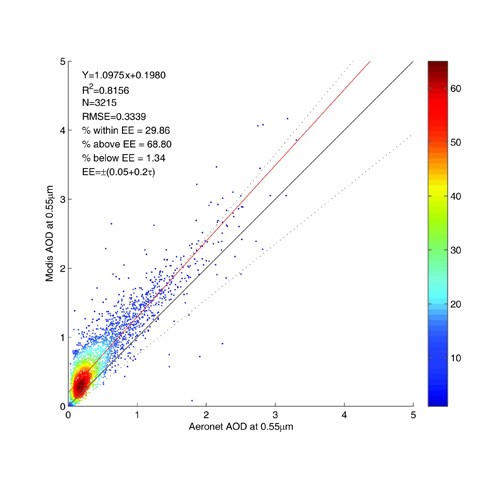
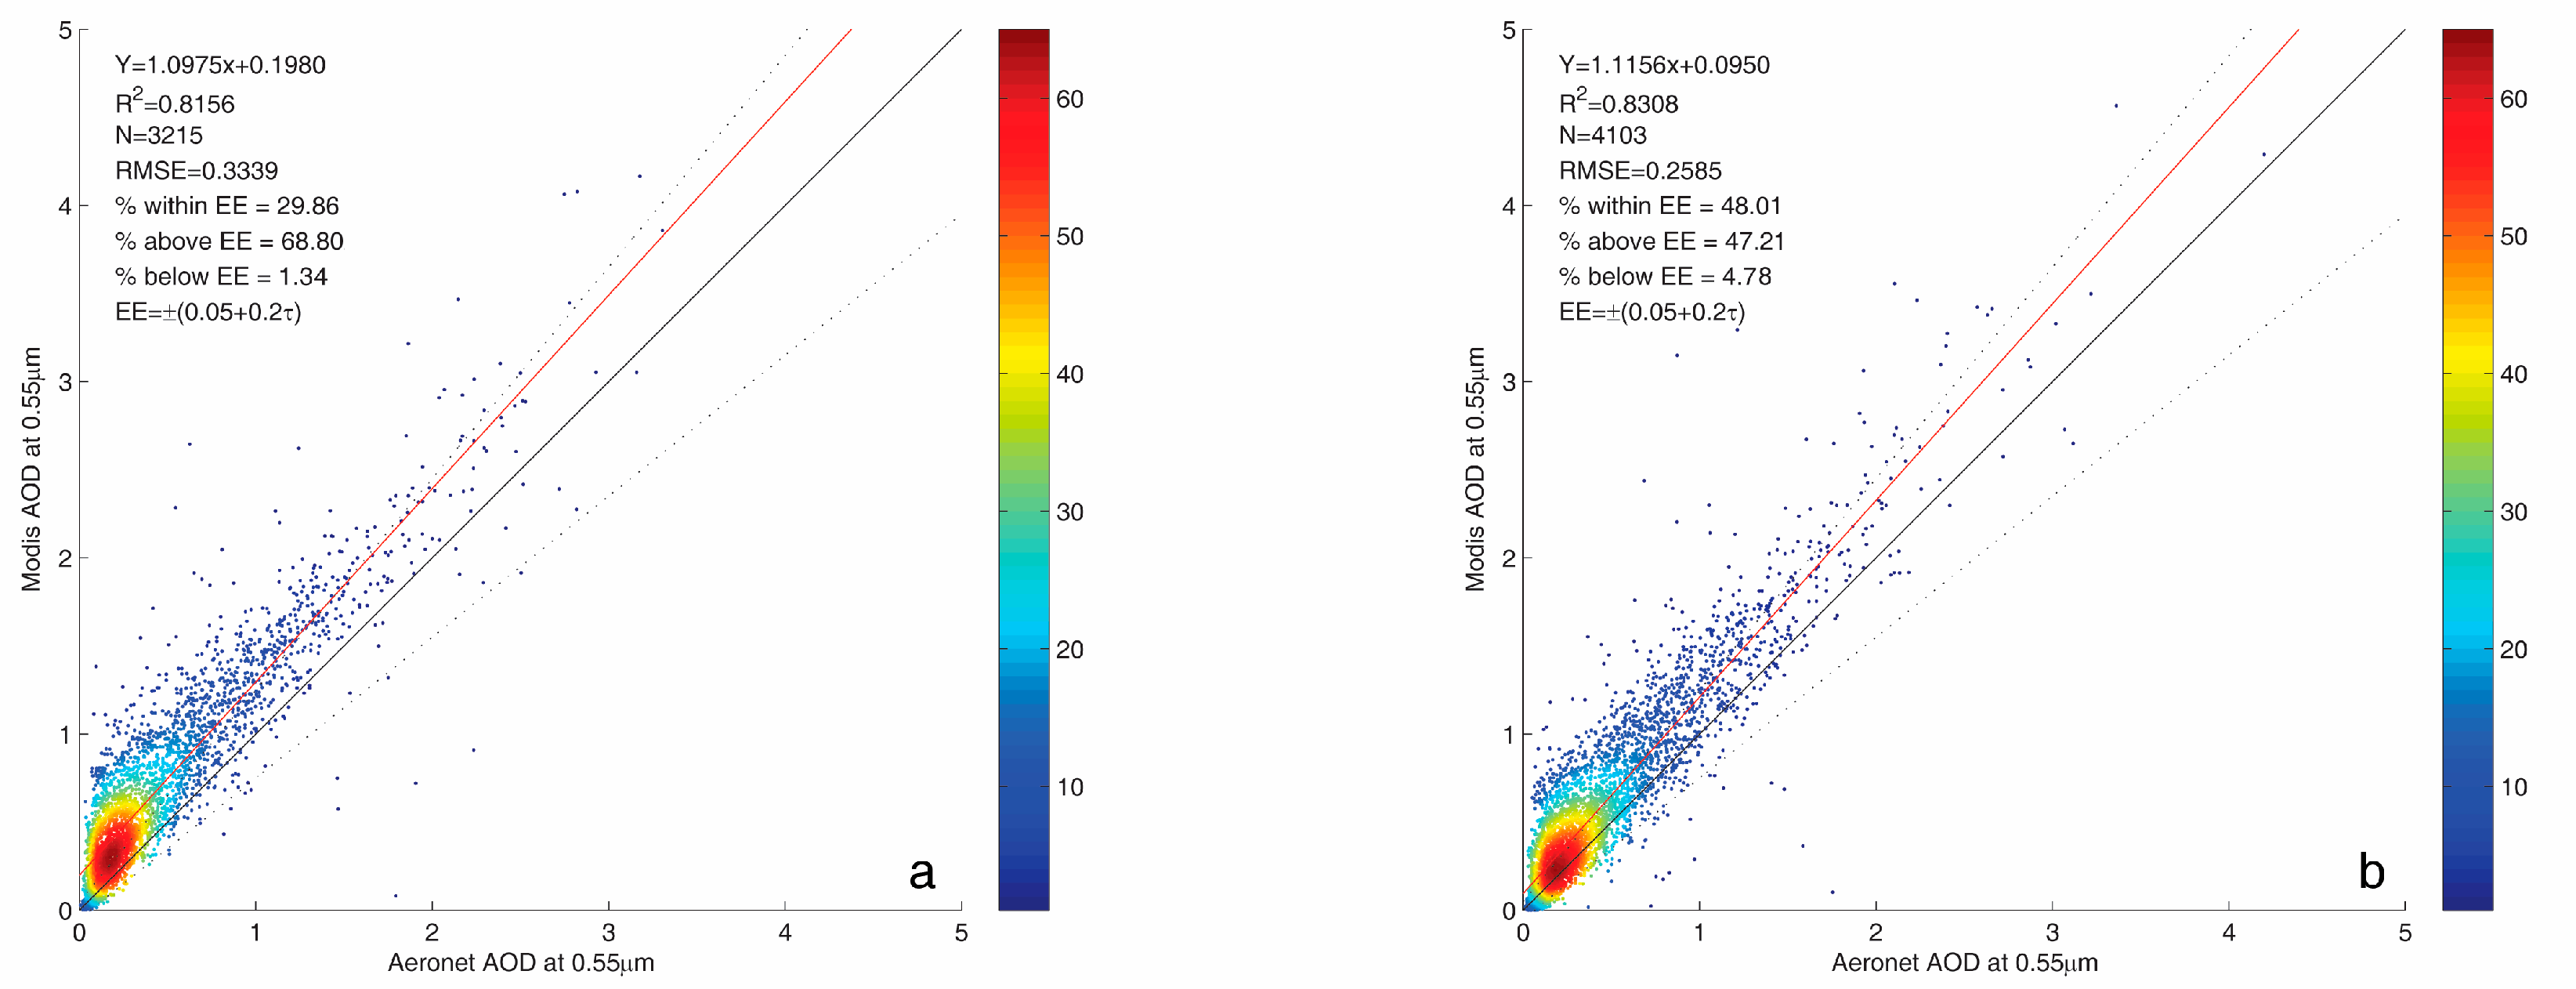
To apply MODIS AOD products to air quality communities with sufficient spatial resolution, a DT 3 km AOD product was released for C6 products. The DT 3 km AOD product has a similar algorithm to the DT 10 km AOD product. In this study, the accuracies of Terra and Aqua DT 3 km AOD product are shown in Figure 5. For Terra, only 29.86% of the retrieved DT 3 km AOD fell within the EE envelope. However, for Aqua, 48.01% of the retrieved DT 3 km AOD fell within the EE envelope. For Terra (Aqua), more than 68% (47%) of the retrieved data were above the EE; only 1.34% (4.78%) of the retrieved data were below EE. These results suggest that the accuracies of Terra and Aqua DT 3 km products over China were considerably less than global averages. Furthermore, overestimation was a serious problem as most retrieval data were above 1:1 line. The detailed validation results of the C5.1 and C6 DT 3 km products are shown in Table 3.
3.5. Regional Applicability for Different AOD Products Over China
MODIS relies on a series of predetermined parameters, such as surface reflectance parameterizations, NDVI, and aerosol model assumptions, to retrieve AOD. The surface parameters present the main restriction for accurately retrieval of AOD, as satellite remote sensing relies on a weak backscattering signal of the earth-atmosphere system. If the surface reflectance is too high, the retrieval algorithms, and especially DT algorithms, were highly likely to fail. Therefore, in arid regions with little vegetation cover, DT algorithms usually do not obtain sufficient retrievals. The DB algorithm was developed to overcome this shortfall, and was later extended to vegetated regions in C6. Due to different surface conditions and different aerosol models, the accuracy of MODIS AOD varies in different regions in China are different. Here the 16 AERONET stations were divided into four categories according to the location of these stations: North China, East China, South China, and West China, as shown in Figure 1.
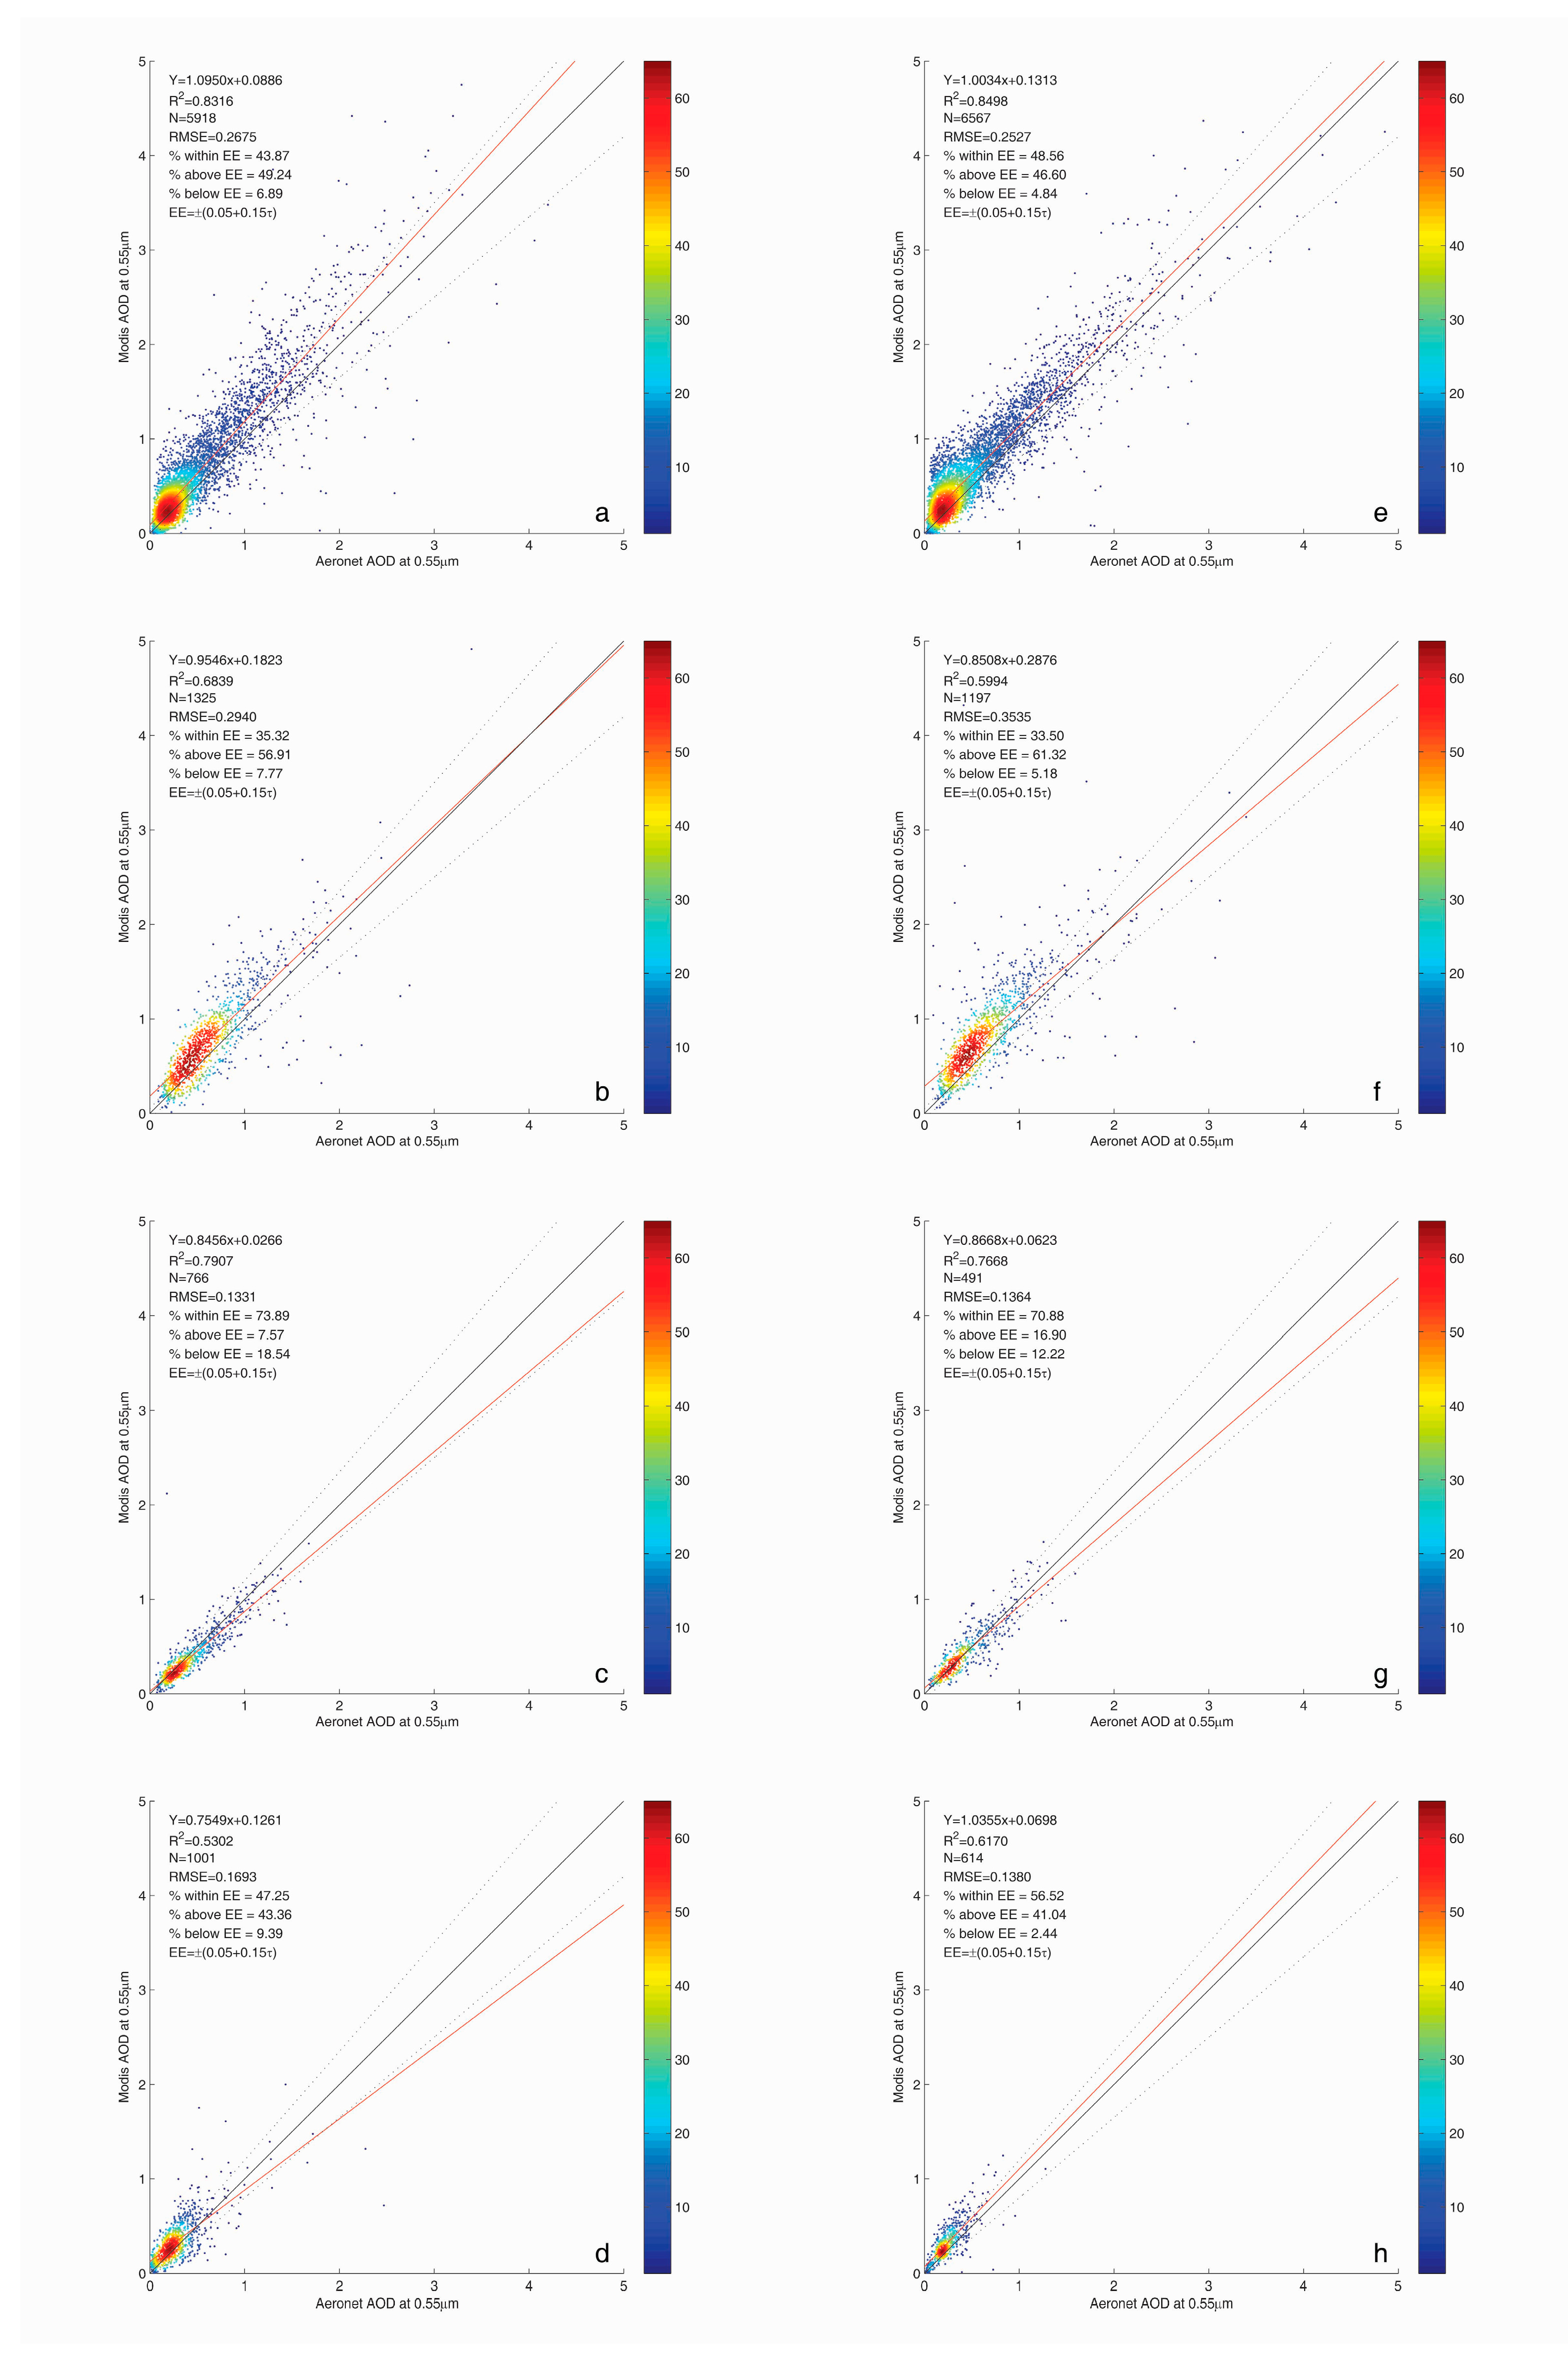
A comparison between the C5.1 and C6.1 10 km products was conducted in this study. Figure 6 demonstrated the applicability comparison of DT 10 km products in different regions. In North China, with relatively long-term monitoring data of AERONET available since 2001, a larger number of comparison data pairs were obtained than in other regions in China. The C6 DT 10 km AOD product in North China had a slightly higher retrieval number, higher determination coefficient, and 3% more data within the EE envelope, suggesting that C6 DT 10 km AOD has a slightly higher accuracy in this region. However, for East and South China region, the C5.1 DT 10 km AOD product had higher accuracy with more data within the EE envelope and a higher determination coefficient. This result suggests that C6 DT algorithm did not perform well in East and South China regions. Furthermore, less than 40% of the retrieval results for both C5.1 and C6 DT 10 km AOD fell within the EE envelope in East China. In West China, with limited vegetation coverage, the accuracy of both the C5.1 and C6 DT 10 km products were low, with the lowest determination coefficients; although a slight improvement in the C6 DT 10 km product was observed. The regional analysis suggests that the C6 DT 10 km algorithm was slightly improved in North and West China, whereas the C5.1 DT 10 km algorithm had better retrieval results in East and South China. Furthermore, C6 algorithm has decreased the successful retrieval number in east, south, and west China regions. The detailed validation statistical results of the C5.1 and C6 DT 10 km products for different regions in China are shown in Table 4.
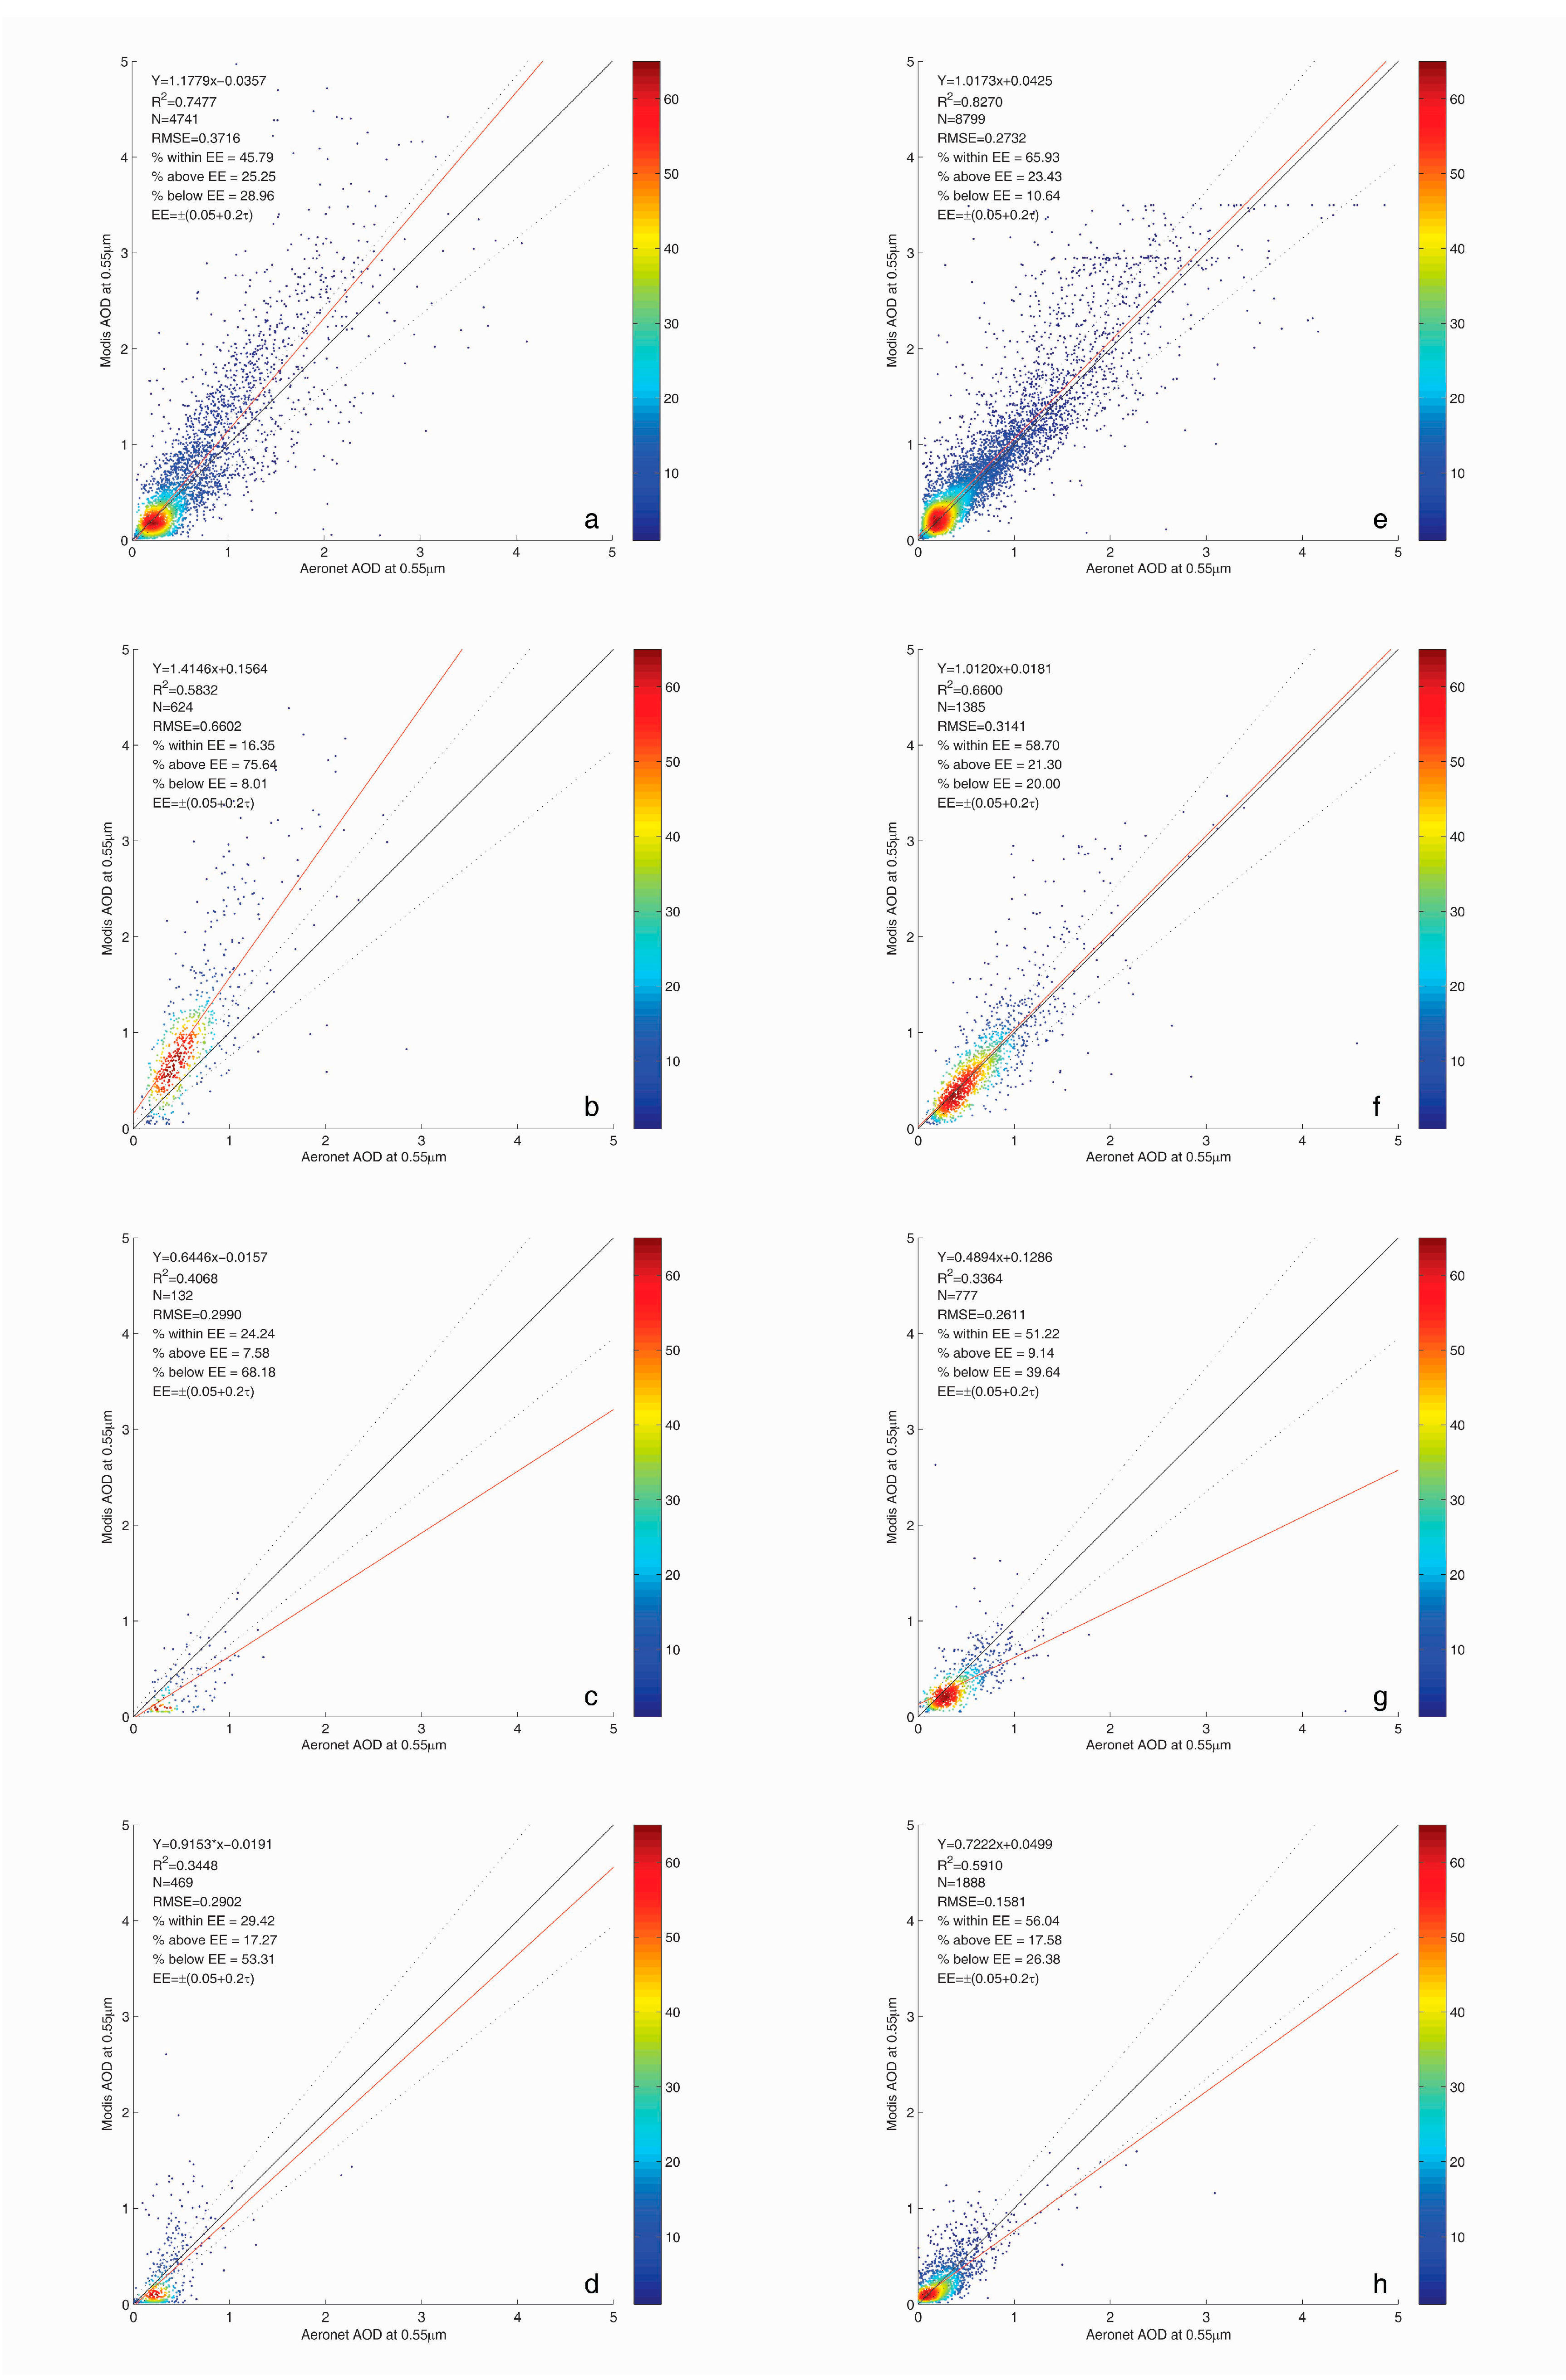
Figure 7 outlines the applicability comparison of DB 10 km products for different regions. In all four regions, the C6 DB 10 km algorithm appreciably increased the retrieval number, especially for the North China region, increasing from 4741 to 8799. The reason for this is because the DB algorithm in C6 products has been extended to vegetated and urban areas, which considerably improved the coverage of the DB AOD product. In North China, C6 DB 10 km had a much higher retrieval number, a slightly higher determination coefficient (0.8270 vs. 0.7477) and a higher percentage (65.93% vs. 45.79%) of data within the EE envelope. In East China, the retrieval accuracy of C6 DB 10 km was improved with a higher retrieval number (1385 vs. 624), higher determination coefficient (0.66 vs. 0.58), smaller RMSE (0.3141 vs. 0.6602), and more data falling within the EE envelope (58.70% vs. 16.35%). The results were different in South and West China. In South China, the determination coefficient of C6 DB 10 km was smaller than that of C5.1 DB 10 km. Whereas in West China, the regressed slope between the retrieved AOD and AERONET AOD deviated more from 1:1 line. Overall, the accuracy of the C6 DB 10 km product in South China was the worst among the four regions. Moreover, the comparisons demonstrated that the C6 DB algorithm overall has increased the successful retrieval number and accuracy in all four regions. The detailed validation results of the C5.1 and C6 DB 10 km products for different regions in China are shown in Table 5.
4. Discussion
The MODIS C6 AOD products have improved the algorithm strategies compared to the C5.1 AOD products, and have been used in regional aerosol evaluation [32,33,34], climate effects [35], and air quality monitoring [36]. To evaluate the accuracy of different MODIS C6 AOD products, a series of validations were made. Zhang et al. [37] collected 10-year C5.1 and C6 10 km AOD data for background and urban regions in Beijing, finding that over 62% of DT retrievals in both C5.1 and C6 were within the EE envelope in background stations, and in total, C6 DT and DB products had better performance than C5.1 products, which is consistent with our results. Bilal et al. [38] validated both C5.1 and C6 DT 10 km and DB 10 km products in Pakistan, finding that C6 DT 10 km products had higher accuracy by increasing the percentage of data falling within the EE envelope from 38.46 to 63.33%. Notably, C6 and C5.1 DB 10 km products had similar and low accuracies in Pakistan. Georgoulias et al. [20] suggested that MODIS C6 AOD had better retrieval accuracy against sun-photometer observations than C5.1 AOD products for the greater Mediterranean region. Tao et al. [39] compared the datasets of C6 DT 10 km and DB 10 km AOD products in China, finding that DT 10 km AOD was systematically higher than DB 10 km AOD. Furthermore, the accuracy of the DB 10 km product in North China was found to be high, but was not satisfying in Northwest and South China. Our study also demonstrated that the 10 km in North China were better than in other regions in China, but the results were all lower than the global average accuracy. Additionally, this study did not compare C6 with C5.1 DB products, and our study demonstrated that although C6 DB product had higher accuracy in North China, it had lower accuracy than the C5.1 DB product there. Nichol and Bilal [40] analyzed 13-year Aqua DT 3 km AOD in East China region, finding only 55% of retrieval data fell within the EE envelope, which is similar to our result of 48%. He et al. [41] analyzed Terra C6 DT 10 km and 3 km AOD products in China, finding that Terra C6 DT 10 km AOD had better accuracy than DT 3 km, and DT 3 km AOD systematically had larger values than DT 10 km AOD. Xiao et al. [42] compared MODIS 3 km AOD, Visible Infrared Imaging Radiometer Suite (VIIRS) AOD, and Geostationary Ocean Color Imager (GOCI) AOD with ground sun-photometer observations with 18 AERONET stations and some handheld sun photometers in east Asia regions from 2012 to 2013, finding only 26% (16%) of Terra (Aqua) 3 km AOD fell within the EE envelope of (). The results in Xiao et al. [42] for Terra were similar to our results of 29.9% within EE envelope, but our results for Aqua with 48.0% within EE envelope were considerably different. The reason for this may be that the temporal ranges and the EE envelopes that were selected in our study were different () according to Sayer et al. [43]; and the spatial coverage were different. Nevertheless, both our research and that of Xiao et al. [42] demonstrated that the accuracy of DT 3 km AOD is not high enough in China. De Leeuw et al. [27] used a DT and DB merged AOD product to obtain the long-term variations in AOD over China, finding that the MODIS AOD product slightly overestimated the AOD, but was still better than the other AOD products. By comparing results of previous researches with our results, it could be found that the C6 DT 10 km algorithm slightly increased the accuracy in China as a whole region, with a lower retrieval number and regional differences, with increased accuracy in North and West China and decreased accuracy in South and East China. However, the enhanced Deep Blue algorithm increased the accuracy and retrieval number in all four regions, whereas the accuracy in South China was not satisfactory, suggesting that present DB algorithm is not suitable for South China. Furthermore, the DT 3 km products have relatively low accuracies, especially for Terra.
5. Conclusions
Satellite remote sensing has been widely used to evaluate local, regional, and global aerosol loadings. Among the various satellite retrieved aerosol products, MODIS AOD products have been mainly used due to relatively higher accuracy, wider spatial coverage, and long-term continuous monitoring. The MODIS C6 AOD products have been updated with new upstream data, optimized algorithms, and a newly-added DT 3 km product. The previous versions of C5.1 AOD products continue to be updated for evaluations and applications. In this paper, all MODIS AOD Level 2 products, including C5.1 DT 10 km, C51. DT 10 km, C6 DT 10 km, C6 DB 10 km, and C6 DT 3 km, were collected from 2001 to 2015 in China, and the accuracies of all these products were analyzed against 16 AERONET stations with more than three years’ observations. By dividing these AERONET into four categories, North China, East China, South China, and West China, accuracies of different MODIS AOD products over different regions were obtained.
Overall comparisons of different MODIS AOD products suggests that, for the DT 10 km products, the C6 algorithm has slightly increased accuracy, with about 3% more data falling within the EE envelope, slightly higher determination coefficients, and a lower RMSE value. For DB 10 km products, the C6 algorithm has considerably increased accuracy. The successful retrieval number in C6 DB 10 km almost doubled, with 12% more data falling within the EE envelope. The linear regression slope in C6 DB 10 km was closer to the 1:1 line. Comparing the DT 3 km product against AERONET observations, the DT 3 km product systematically overestimated AOD loadings: 68.8% (47.2%) of the retrieved AOD were above the EE envelope for Terra (Aqua). The accuracy of Terra DT 3 km AOD in China is not satisfactory, with only 29.9% of retrieved AOD falling within the EE envelope.
For regional difference analysis, the C6 DT 10 km product has slightly better accuracy in North China and West China, whereas for South and East China, the C6 DT 10 km product had lower accuracy. Moreover, the C6 10 km AOD product generally had less retrievals in East, South, and West China. For the DB 10 km products, the C6 algorithm was much better than C5.1 algorithm in all four regions, with a far higher percentage of data within the EE envelope and a far more successful retrieval of data. Overall, the C6 DT 10 km algorithm had the worst performance in the East China region with only 33.5% of data falling within the EE envelope, whereas the C6 DB 10 km algorithm had the worst performance in South China with only 51.2% of data falling within the EE envelope and a R2 of 0.3364. These results demonstrate that the C6 algorithms have improved in DB AOD products but limited improvements in DT AOD products. For regional analysis, the accuracy of different AOD products must first be evaluated to select the best AOD product to analyze aerosol loading conditions.
Acknowledgments
This research was supported by National Natural Science Foundation of China under Grant 41701391 and 41671383, the Open Fund of State Key Laboratory of Remote Sensing Science under Grant OFSLRSS201623, Open Fund of State Key Laboratory of Information Engineering in Surveying, Mapping and Remote Sensing under Grant 16R01.
Author Contributions
Aiping Fan processed dataset and wrote the paper, Wei Chen designed the whole paper; Long Liang made some figures for this paper; Yi Lin, Xuesheng Zhao and Huizheng Che provided key dataset for this paper.
Conflicts of Interest
The authors declare no conflict of interest.
References
- Ruiz-Arias, J.A.; Dudhia, J.; Gueymard, C.A.; Pozo-Vazquez, D. Assessment of the level-3 modis daily aerosol optical depth in the context of surface solar radiation and numerical weather modeling. Atmos. Chem. Phys. 2013, 13, 675–692. [Google Scholar] [CrossRef]
- Cui, X.; Wang, X.; Yang, L.; Chen, B.; Chen, J.; Andersson, A.; Gustafsson, O. Radiative absorption enhancement from coatings on black carbon aerosols. Sci. Total Environ. 2016, 551, 51–56. [Google Scholar] [CrossRef] [PubMed]
- Lu, X.C.; Lin, C.Q.; Li, Y.; Yao, T.; Fung, J.C.H.; Lau, A.K.H. Assessment of health burden caused by particulate matter in southern china using high-resolution satellite observation. Environ. Int. 2017, 98, 160–170. [Google Scholar] [CrossRef] [PubMed]
- Gopal, K.R.; Reddy, K.R.O.; Balakrishnaiah, G.; Arafath, S.M.D.; Reddy, N.S.K.; Rao, T.C.; Reddy, T.L.; Reddy, R.R. Regional trends of aerosol optical depth and their impact on cloud properties over southern india using modis data. J. Atmos. Sol. Terr. Phys. 2016, 146, 38–48. [Google Scholar] [CrossRef]
- Kan, H.; Chen, R.; Tong, S. Ambient air pollution, climate change, and population health in china. Environ. Int. 2012, 42, 10–19. [Google Scholar] [CrossRef] [PubMed]
- Che, H.; Xia, X.; Zhu, J.; Li, Z.; Dubovik, O.; Holben, B.; Goloub, P.; Chen, H.; Estelles, V.; Cuevas-Agullo, E.; et al. Column aerosol optical properties and aerosol radiative forcing during a serious haze-fog month over north china plain in 2013 based on ground-based sunphotometer measurements. Atmos. Chem. Phys. 2014, 14, 2125–2138. [Google Scholar] [CrossRef] [Green Version]
- Janssen, N.A.H.; Fischer, P.; Marra, M.; Ameling, C.; Cassee, F.R. Short-term effects of pm2.5, pm10 and pm2.5–10 on daily mortality in the netherlands. Sci. Total Environ. 2013, 463, 20–26. [Google Scholar] [CrossRef] [PubMed]
- Bergen, S.; Sheppard, L.; Sampson, P.D.; Kim, S.Y.; Richards, M.; Vedal, S.; Kaufman, J.D.; Szpiro, A.A. A national prediction model for pm2.5 component exposures and measurement error-corrected health effect inference. Environ. Health Perspect. 2013, 121, 1017–1025. [Google Scholar] [CrossRef] [PubMed]
- Matus, K.; Nam, K.-M.; Selin, N.E.; Lamsal, L.N.; Reilly, J.M.; Paltsev, S. Health damages from air pollution in china. Glob. Environ. Chang. 2012, 22, 55–66. [Google Scholar] [CrossRef]
- Hatzianastassiou, N.; Gkikas, A.; Mihalopoulos, N.; Torres, O.; Katsoulis, B.D. Natural versus anthropogenic aerosols in the eastern mediterranean basin derived from multiyear toms and modis satellite data. J. Geophys. Res. Atmos. 2009, 114. [Google Scholar] [CrossRef]
- Wong, M.S.; Shahzad, M.I.; Nichol, J.E.; Lee, K.H.; Chan, P.W. Validation of modis, misr, omi, and calipso aerosol optical thickness using ground-based sunphotometers in hong kong. Int. J. Remote Sens. 2013, 34, 897–918. [Google Scholar] [CrossRef]
- Guang, J.; Xue, Y.; Wang, Y.; Li, Y.J.; Mei, L.L.; Xu, H.; Liang, S.L.; Wang, J.D.; Bai, L.Y. Simultaneous determination of aerosol optical thickness and surface reflectance using aster visible to near-infrared data over land. Int. J. Remote Sens. 2011, 32, 6961–6974. [Google Scholar] [CrossRef]
- Hsu, N.C.; Gautam, R.; Sayer, A.M.; Bettenhausen, C.; Li, C.; Jeong, M.J.; Tsay, S.C.; Holben, B.N. Global and regional trends of aerosol optical depth over land and ocean using seawifs measurements from 1997 to 2010. Atmos. Chem. Phys. 2012, 12, 8037–8053. [Google Scholar] [CrossRef]
- Kang, N.; Kumar, K.R.; Hu, K.; Yu, X.N.; Yin, Y. Long-term (2002–2014) evolution and trend in collection 5.1 level-2 aerosol products derived from the modis and misr sensors over the chinese yangtze river delta. Atmos. Res. 2016, 181, 29–43. [Google Scholar] [CrossRef]
- Hauser, A.; Oesch, D.; Foppa, N. Aerosol optical depth over land: Comparing aeronet, avhrr and modis. Geophys. Res. Lett. 2005, 32. [Google Scholar] [CrossRef]
- Remer, L.A.; Kaufman, Y.J.; Tanre, D.; Mattoo, S.; Chu, D.A.; Martins, J.V.; Li, R.R.; Ichoku, C.; Levy, R.C.; Kleidman, R.G.; et al. The modis aerosol algorithm, products, and validation. J. Atmos. Sci. 2005, 62, 947–973. [Google Scholar] [CrossRef]
- Levy, R.C.; Remer, L.A.; Kleidman, R.G.; Mattoo, S.; Ichoku, C.; Kahn, R.; Eck, T.F. Global evaluation of the collection 5 modis dark-target aerosol products over land. Atmos. Chem. Phys. 2010, 10, 10399–10420. [Google Scholar] [CrossRef] [Green Version]
- Kaufman, Y.J.; Tanré, D.; Remer, L.A.; Vermote, E.F.; Chu, A.; Holben, B.N. Operational remote sensing of tropospheric aerosol over land from eos moderate resolution imaging spectroradiometer. J. Geophys. Res. Atmos. 1997, 102, 17051–17067. [Google Scholar] [CrossRef]
- Mao, K.B.; Ma, Y.; Xia, L.; Chen, W.Y.; Shen, X.Y.; He, T.J.; Xu, T.R. Global aerosol change in the last decade: An analysis based on modis data. Atmos. Environ. 2014, 94, 680–686. [Google Scholar] [CrossRef]
- Georgoulias, A.; Alexandri, G.; Kourtidis, K.; Lelieveld, J.; Zanis, P.; Amiridis, V. Differences between the modis collection 6 and 5.1 aerosol datasets over the greater mediterranean region. Atmos. Environ. 2016, 147, 310–319. [Google Scholar] [CrossRef]
- Hsu, N.C.; Tsay, S.C.; King, M.D.; Herman, J.R. Aerosol properties over bright-reflecting source regions. IEEE Trans. Geosci. Remote Sens. 2004, 42, 557–569. [Google Scholar] [CrossRef]
- Bilal, M.; Nichol, J.E.; Wang, L.C. New customized methods for improvement of the modis c6 dark target and deep blue merged aerosol product. Remote Sens. Environ. 2017, 197, 115–124. [Google Scholar] [CrossRef]
- Sayer, A.M.; Munchak, L.A.; Hsu, N.C.; Levy, R.C.; Bettenhausen, C.; Jeong, M.J. Modis collection 6 aerosol products: Comparison between aqua’s e-deep blue, dark target, and “merged” data sets, and usage recommendations. J. Geophys. Res. 2014, 119, 13965–13989. [Google Scholar] [CrossRef]
- Levy, R.C.; Mattoo, S.; Munchak, L.A.; Remer, L.A.; Sayer, A.M.; Patadia, F.; Hsu, N.C. The collection 6 modis aerosol products over land and ocean. Atmos. Meas. Tech. 2013, 6, 2989–3034. [Google Scholar] [CrossRef]
- Hsu, N.C.; Jeong, M.J.; Bettenhausen, C.; Sayer, A.M.; Hansell, R.; Seftor, C.S.; Huang, J.; Tsay, S.C. Enhanced deep blue aerosol retrieval algorithm: The second generation. J. Geophys. Res. Atmos. 2013, 118, 9296–9315. [Google Scholar] [CrossRef]
- Remer, L.A.; Mattoo, S.; Levy, R.C.; Munchak, L.A. Modis 3 km aerosol product: Algorithm and global perspective. Atmos. Meas. Tech. 2013, 6, 1829–1844. [Google Scholar] [CrossRef]
- De Leeuw, G.; Sogacheva, L.; Rodriguez, E.; Kourtidis, K.; Georgoulias, A.K.; Alexandri, G.; Amiridis, V.; Proestakis, E.; Marinou, E.; Xue, Y.; et al. Two decades of satellite observations of aod over mainland china. Atmos. Chem. Phys. Discuss. 2017, 2017, 1–33. [Google Scholar] [CrossRef]
- Che, H.; Zhang, X.Y.; Xia, X.; Goloub, P.; Holben, B.; Zhao, H.; Wang, Y.; Zhang, X.C.; Wang, H.; Blarel, L.; et al. Ground-based aerosol climatology of china: Aerosol optical depths from the china aerosol remote sensing network (carsnet) 2002–2013. Atmos. Chem. Phys. 2015, 15, 7619–7652. [Google Scholar] [CrossRef]
- Che, H.Z.; Zhang, X.Y.; Chen, H.B.; Damiri, B.; Goloub, P.; Li, Z.Q.; Zhang, X.C.; Wei, Y.; Zhou, H.G.; Dong, F.; et al. Instrument calibration and aerosol optical depth validation of the china aerosol remote sensing network. J. Geophys. Res. Atmos. 2009, 114. [Google Scholar] [CrossRef]
- Georgoulias, A.K.; Alexandri, G.; Kourtidis, K.A.; Lelieveld, J.; Zanis, P.; Poeschl, U.; Levy, R.; Amiridis, V.; Marinou, E.; Tsikerdekis, A. Spatiotemporal variability and contribution of different aerosol types to the aerosol optical depth over the eastern mediterranean. Atmos. Chem. Phys. 2016, 16, 13853–13884. [Google Scholar] [CrossRef]
- Sayer, A.M.; Hsu, N.C.; Bettenhausen, C.; Jeong, M.J.; Meister, G. Effect of modis terra radiometric calibration improvements on collection 6 deep blue aerosol products: Validation and terra/aqua consistency. J. Geophys. Res. Atmos. 2015, 120. [Google Scholar] [CrossRef]
- Saponaro, G.; Kolmonen, P.; Sogacheva, L.; Rodriguez, E.; Virtanen, T.; de Leeuw, G. Estimates of the aerosol indirect effect over the baltic sea region derived from 12 years of modis observations. Atmos. Chem. Phys. 2017, 17, 3133–3143. [Google Scholar] [CrossRef]
- Che, H.Z.; Wang, Y.Q.; Sun, J.Y.; Zhang, X.C.; Zhang, X.Y.; Guo, J.P. Variation of aerosol optical properties over the taklimakan desert in china. Aerosol Air Qual. Res. 2013, 13, 777–785. [Google Scholar] [CrossRef]
- Che, H.Z.; Wang, Y.Q.; Sun, J.Y. Aerosol optical properties at mt. Waliguan observatory, china. Atmos. Environ. 2011, 45, 6004–6009. [Google Scholar] [CrossRef]
- Cheng, F.; Zhang, J.H.; He, J.L.; Zha, Y.; Li, Q.N.; Li, Y.M. Analysis of aerosol-cloud-precipitation interactions based on modis data. Adv. Space Res. 2017, 59, 63–73. [Google Scholar] [CrossRef]
- Xie, Y.; Wang, Y.; Zhang, K.; Dong, W.; Lv, B.; Bai, Y. Daily estimation of ground-level pm2.5 concentrations over beijing using 3 km resolution modis aod. Environ. Sci. Technol 2015, 49, 12280–12288. [Google Scholar] [CrossRef] [PubMed]
- Zhang, Q.; Xin, J.Y.; Yin, Y.; Wang, L.L.; Wang, Y.S. The variations and trends of modis c5 & c6 products’ errors in the recent decade over the background and urban areas of north china. Remote Sens. 2016, 8, 754. [Google Scholar] [CrossRef]
- Bilal, M.; Nichol, J.E.; Nazeer, M. Validation of aqua-modis c051 and c006 operational aerosol products using aeronet measurements over pakistan. IEEE J. Sel. Top. Appl. Earth Obs. Remote Sens. 2016, 9, 2074–2080. [Google Scholar] [CrossRef]
- Tao, M.; Chen, L.; Wang, Z.; Tao, J.; Che, H.; Wang, X.; Wang, Y. Comparison and evaluation of the modis collection 6 aerosol data in china. J. Geophys. Res. Atmos. 2015, 120, 6992–7005. [Google Scholar] [CrossRef]
- Nichol, J.E.; Bilal, M. Validation of modis 3 km resolution aerosol optical depth retrievals over asia. Remote Sens. 2016, 8, 328. [Google Scholar] [CrossRef]
- He, Q.Q.; Zhang, M.; Huang, B.; Tong, X.L. Modis 3 km and 10 km aerosol optical depth for china: Evaluation and comparison. Atmos. Environ. 2017, 153, 150–162. [Google Scholar] [CrossRef]
- Xiao, Q.; Zhang, H.; Choi, M.; Li, S.; Kondragunta, S.; Kim, J.; Holben, B.; Levy, R.C.; Liu, Y. Evaluation of viirs, goci, and modis collection 6 aod retrievals against ground sunphotometer observations over east asia. Atmos. Chem. Phys. 2016, 16, 1255–1269. [Google Scholar] [CrossRef]
- Sayer, A.M.; Hsu, N.C.; Bettenhausen, C.; Jeong, M.J. Validation and uncertainty estimates for modis collection 6 “deep blue” aerosol data. J. Geophys. Res. Atmos. 2013, 118, 7864–7872. [Google Scholar] [CrossRef]
Figure 1.
Distribution of Aerosol Robotic Network (AERONET) Stations in China with at least three years’ of observations data. The 16 AERONET stations were divided into four regional groups: North China, East China, South China, and West China.
Figure 1.
Distribution of Aerosol Robotic Network (AERONET) Stations in China with at least three years’ of observations data. The 16 AERONET stations were divided into four regional groups: North China, East China, South China, and West China.

Figure 2.
Validations of (a) Terra C5.1, (b) Terra C6, (c) Aqua C5.1, (d) Aqua C6, (e) Terra and Aqua combined C5.1, and (f) Terra and Aqua combined C6 DT 10 km AOD products against AERONET AOD. The dashed, black solid, and red solid lines represent the expected error range, 1:1 line, and linear regression of the scattering dots, respectively.

Figure 3.
Validations for (a) Terra C5.1, (b) Terra C6, (c) Aqua C5.1, (d) Aqua C6, (e) Terra and Aqua combined C5.1, and (f) Terra and Aqua combined C6 10 km Deep Blue (DB) AOD Products against AERONET AOD. The dashed, black solid, and red solid lines represent the expected error range, 1:1 line, and linear regression of the scattering dots, respectively.

Figure 4.
Inter-comparison of (a) DT 10 km AOD and (b) DB 10 km AOD. The black solid and red solid lines represent the 1:1 line and linear regression of the scattering dots, respectively.
Figure 4.
Inter-comparison of (a) DT 10 km AOD and (b) DB 10 km AOD. The black solid and red solid lines represent the 1:1 line and linear regression of the scattering dots, respectively.

Figure 5.
Validations of (a) Terra and (b) Aqua MODIS DT 3 km AOD products against AERONET AOD. The dashed, black solid, and red solid lines represent the expected error range, the 1:1 line, and the linear regression of the scattering dots, respectively.
Figure 5.
Validations of (a) Terra and (b) Aqua MODIS DT 3 km AOD products against AERONET AOD. The dashed, black solid, and red solid lines represent the expected error range, the 1:1 line, and the linear regression of the scattering dots, respectively.

Figure 6.
Validations of MODIS Terra and Aqua combined C5.1 and C6 DT 10 km AOD products compared to AERONET AOD in different China regions. (a) C5.1 North China; (b) C5.1 East China; (c): C5.1 South China; (d) C5.1 West China; (e) C6 North China; (f) C6 East China; (g) C6 South China; and (h) C6 West China. The dashed, black solid, and red solid lines represent the expected error range, the 1:1 line, and the linear regression of the scattering dots, respectively.

Figure 7.
Validations of MODIS Terra and Aqua combined C5.1 and C6 DB 10 km AOD products against AERONET AOD in different regions in China: (a) C5.1 North China; (b) C5.1 East China; (c) C5.1 South China; (d) C5.1 West China; (e) C6 North China; (f) C6 East China; (g) C6 South China; and (h) C6 West China. The dashed, black solid, and red solid lines represent the expected error range, the 1:1 line, and the linear regression of the scattering dots, respectively.


Table 1.
Validation statistics of Collection 5.1 (C5.1) and Collection 6 (C6) Dark Target (DT) 10 km aerosol optic depth (AOD) products.
Table 1.
Validation statistics of Collection 5.1 (C5.1) and Collection 6 (C6) Dark Target (DT) 10 km aerosol optic depth (AOD) products.
| Terra C5.1 | Terra C6 | Aqua C5.1 | Aqua C6 | Combined C5.1 | Combined C6 | |
|---|---|---|---|---|---|---|
| Slope | 1.0590 | 0.9968 | 1.0713 | 0.9949 | 1.0672 | 0.9960 |
| Intercept | 0.0646 | 0.1446 | 0.1162 | 0.1186 | 0.0813 | 0.1314 |
| R2 | 0.8117 | 0.8493 | 0.7925 | 0.7912 | 0.8041 | 0.8210 |
| N | 5838 | 4371 | 3172 | 4498 | 9010 | 8869 |
| RMSE | 0.2376 | 0.2548 | 0.2810 | 0.2609 | 0.2537 | 0.2579 |
| Within EE | 47.81% | 46.78% | 41.36% | 49.80% | 45.54% | 48.31% |
| Above EE | 42.29% | 49.90% | 53.31% | 43.31% | 46.17% | 46.56% |
| Below EE | 9.90% | 3.32% | 5.33% | 6.89% | 8.29% | 5.13% |
Table 2.
Validation statistics of C5.1 and C6 DB 10 km AOD products.
| Terra C5.1 | Terra C6 | Aqua C5.1 | Aqua C6 | Combined C5.1 | Combined C6 | |
|---|---|---|---|---|---|---|
| Slope | 1.1421 | 0.9588 | 1.2457 | 1.0225 | 1.2097 | 1.0068 |
| Intercept | −0.0101 | 0.0370 | 0.0357 | 0.0238 | −0.0268 | 0.0273 |
| R2 | 0.7062 | 0.8383 | 0.7087 | 0.7934 | 0.7065 | 0.8020 |
| N | 1867 | 2282 | 4099 | 10567 | 5966 | 12849 |
| RMSE | 0.3889 | 0.2508 | 0.4120 | 0.2664 | 0.4049 | 0.2637 |
| Within EE | 41.72% | 66.70% | 40.60% | 61.97% | 40.95% | 62.81% |
| Above EE | 28.34% | 18.62% | 30.03% | 22.10% | 29.50% | 21.48% |
| Below EE | 29.94% | 14.68% | 29.37% | 15.94% | 29.55% | 15.71% |
Table 3.
Validation statistics of C6 DT 3 km AOD products.
| Terra C6 | Aqua C6 | |
|---|---|---|
| Slope | 1.0975 | 1.1156 |
| Intercept | 0.1980 | 0.0950 |
| R2 | 0.8156 | 0.8308 |
| N | 3215 | 4103 |
| RMSE | 0.3339 | 0.2585 |
| Within EE | 29.86% | 48.01% |
| Above EE | 68.80% | 47.21% |
| Below EE | 1.34% | 4.78% |
Table 4.
Validation statistics of C5.1 and C6 DT 10 km AOD products in different regions.
| C5.1 North China | C5.1 East China | C5.1 South China | C5.1 West China | C6 North China | C6 East China | C6 South China | C6 West China | |
|---|---|---|---|---|---|---|---|---|
| Slope | 1.0950 | 0.9546 | 0.8456 | 0.7549 | 1.0034 | 0.8508 | 0.8668 | 1.0355 |
| Intercept | 0.0886 | 0.1823 | 0.0266 | 0.1261 | 0.1313 | 0.2876 | 0.0623 | 0.0698 |
| R2 | 0.8316 | 0.6839 | 0.7907 | 0.5302 | 0.8498 | 0.5994 | 0.7668 | 0.6170 |
| N | 5918 | 1325 | 766 | 1001 | 6567 | 1197 | 491 | 614 |
| RMSE | 0.2675 | 0.2940 | 0.1331 | 0.1693 | 0.2527 | 0.3535 | 0.1364 | 0.1380 |
| Within EE | 43.87% | 35.32% | 73.89% | 47.25% | 48.56% | 33.50% | 70.88% | 56.52% |
| Above EE | 49.24% | 56.91% | 7.57% | 43.36% | 46.60% | 61.32% | 16.90% | 41.02% |
| Below EE | 6.89% | 7.77% | 18.54% | 9.39% | 4.84% | 5.18% | 12.22% | 2.44% |
Table 5.
Validation statistics of C5.1 and C6 DB 10 km AOD products in different regions.
| C5.1 North China | C5.1 East China | C5.1 South China | C5.1 West China | C6 North China | C6 East China | C6 South China | C6 West China | |
|---|---|---|---|---|---|---|---|---|
| Slope | 1.1779 | 1.4146 | 0.6446 | 0.9153 | 1.0173 | 1.0120 | 0.4894 | 0.7222 |
| Intercept | −0.0357 | 0.1564 | −0.0157 | −0.0191 | 0.0425 | 0.0181 | 0.1286 | 0.0499 |
| R2 | 0.7477 | 0.5832 | 0.4068 | 0.3448 | 0.8270 | 0.6600 | 0.3364 | 0.5910 |
| N | 4741 | 624 | 132 | 469 | 8799 | 1385 | 777 | 1888 |
| RMSE | 0.3716 | 0.6602 | 0.2990 | 0.2902 | 0.2732 | 0.3141 | 0.2611 | 0.1581 |
| Within EE | 45.79% | 16.35% | 24.24% | 29.42% | 65.93% | 58.70% | 51.22% | 56.04% |
| Above EE | 25.25% | 75.64% | 7.58% | 17.27% | 23.43% | 21.30% | 9.14% | 17.58% |
| Below EE | 28.96% | 8.01% | 68.18% | 53.31% | 10.64% | 20.00% | 39.64% | 26.38% |
© 2017 by the authors. Licensee MDPI, Basel, Switzerland. This article is an open access article distributed under the terms and conditions of the Creative Commons Attribution (CC BY) license (http://creativecommons.org/licenses/by/4.0/).
Share and Cite
MDPI and ACS Style
Fan, A.; Chen, W.; Liang, L.; Sun, W.; Lin, Y.; Che, H.; Zhao, X. Evaluation and Comparison of Long-Term MODIS C5.1 and C6 Products against AERONET Observations over China. Remote Sens. 2017, 9, 1269. https://doi.org/10.3390/rs9121269
AMA Style
Fan A, Chen W, Liang L, Sun W, Lin Y, Che H, Zhao X. Evaluation and Comparison of Long-Term MODIS C5.1 and C6 Products against AERONET Observations over China. Remote Sensing. 2017; 9(12):1269. https://doi.org/10.3390/rs9121269
Chicago/Turabian StyleFan, Aiping, Wei Chen, Long Liang, Wenbin Sun, Yi Lin, Huizheng Che, and Xuesheng Zhao. 2017. "Evaluation and Comparison of Long-Term MODIS C5.1 and C6 Products against AERONET Observations over China" Remote Sensing 9, no. 12: 1269. https://doi.org/10.3390/rs9121269
Note that from the first issue of 2016, this journal uses article numbers instead of page numbers. See further details here.