Examining the Influence of Crop Residue Burning on Local PM2.5 Concentrations in Heilongjiang Province Using Ground Observation and Remote Sensing Data

 , ,
, ,
Abstract
:
1. Introduction
2. Materials
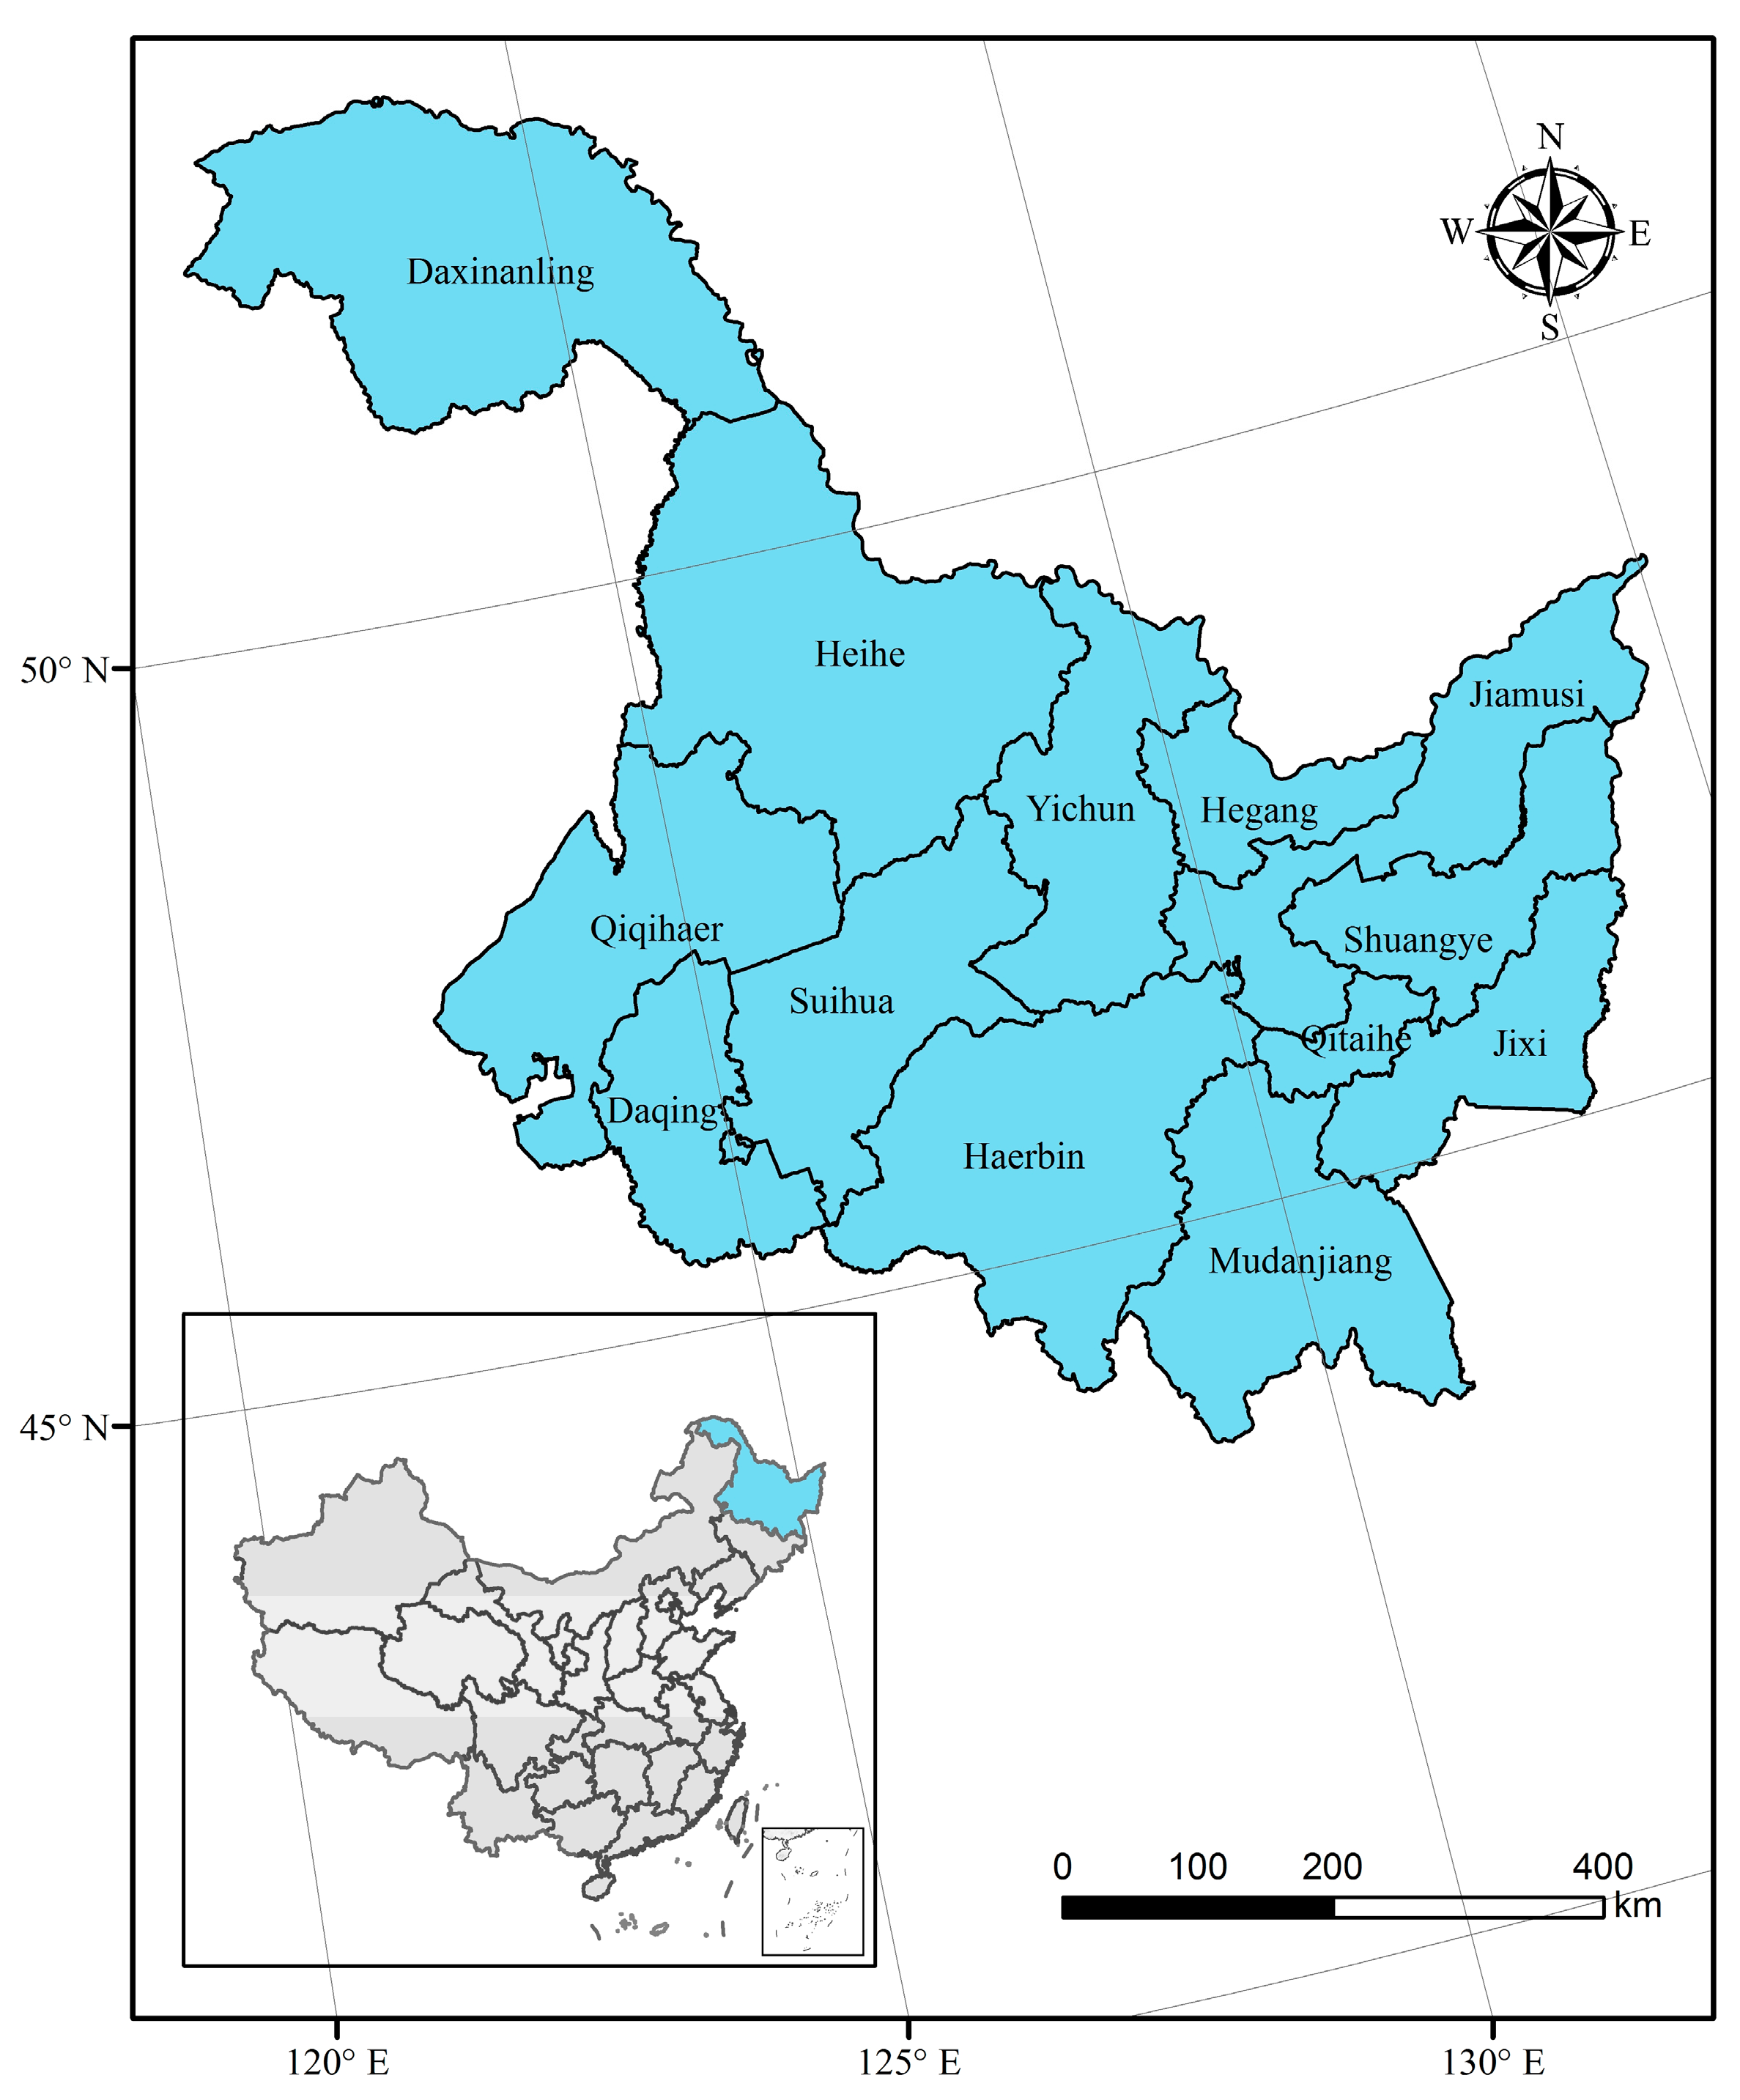
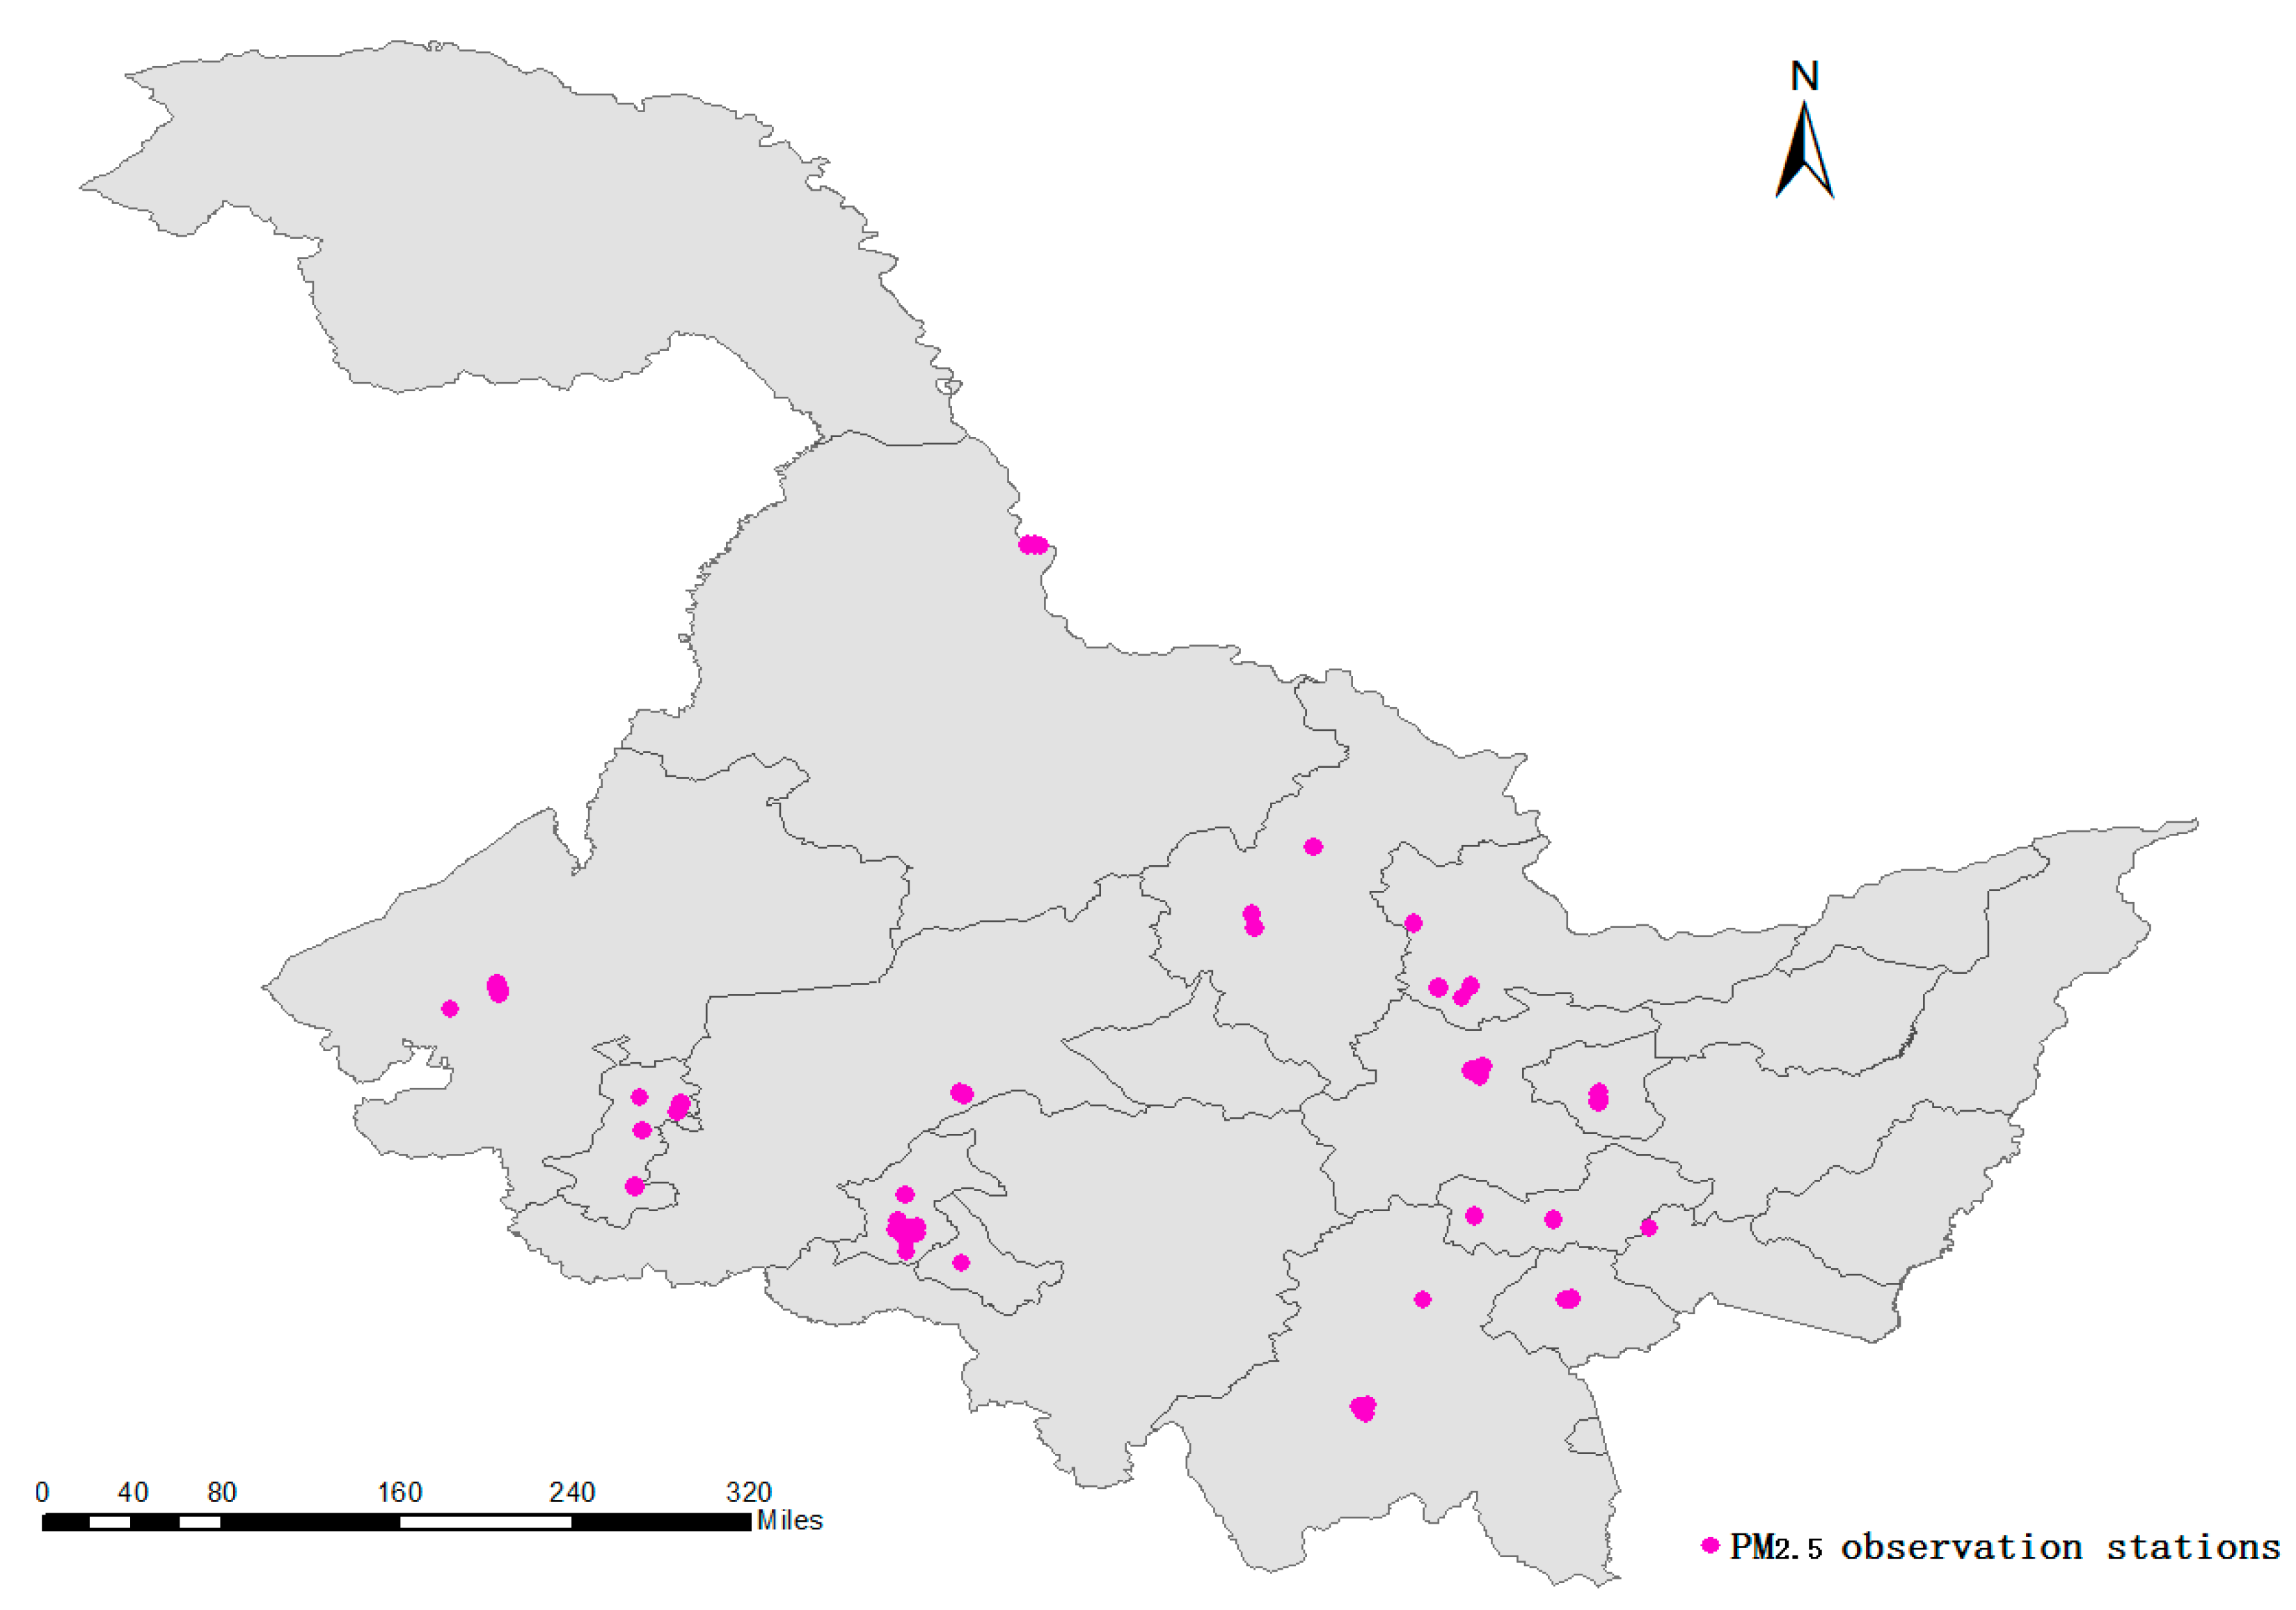
2.1. Study Sites
2.2. Data Sources
2.2.1. Ground PM2.5 Concentrations Data
2.2.2. Remote Sensing Data
2.2.3. Land Cover Data
3. Methods
4. Results
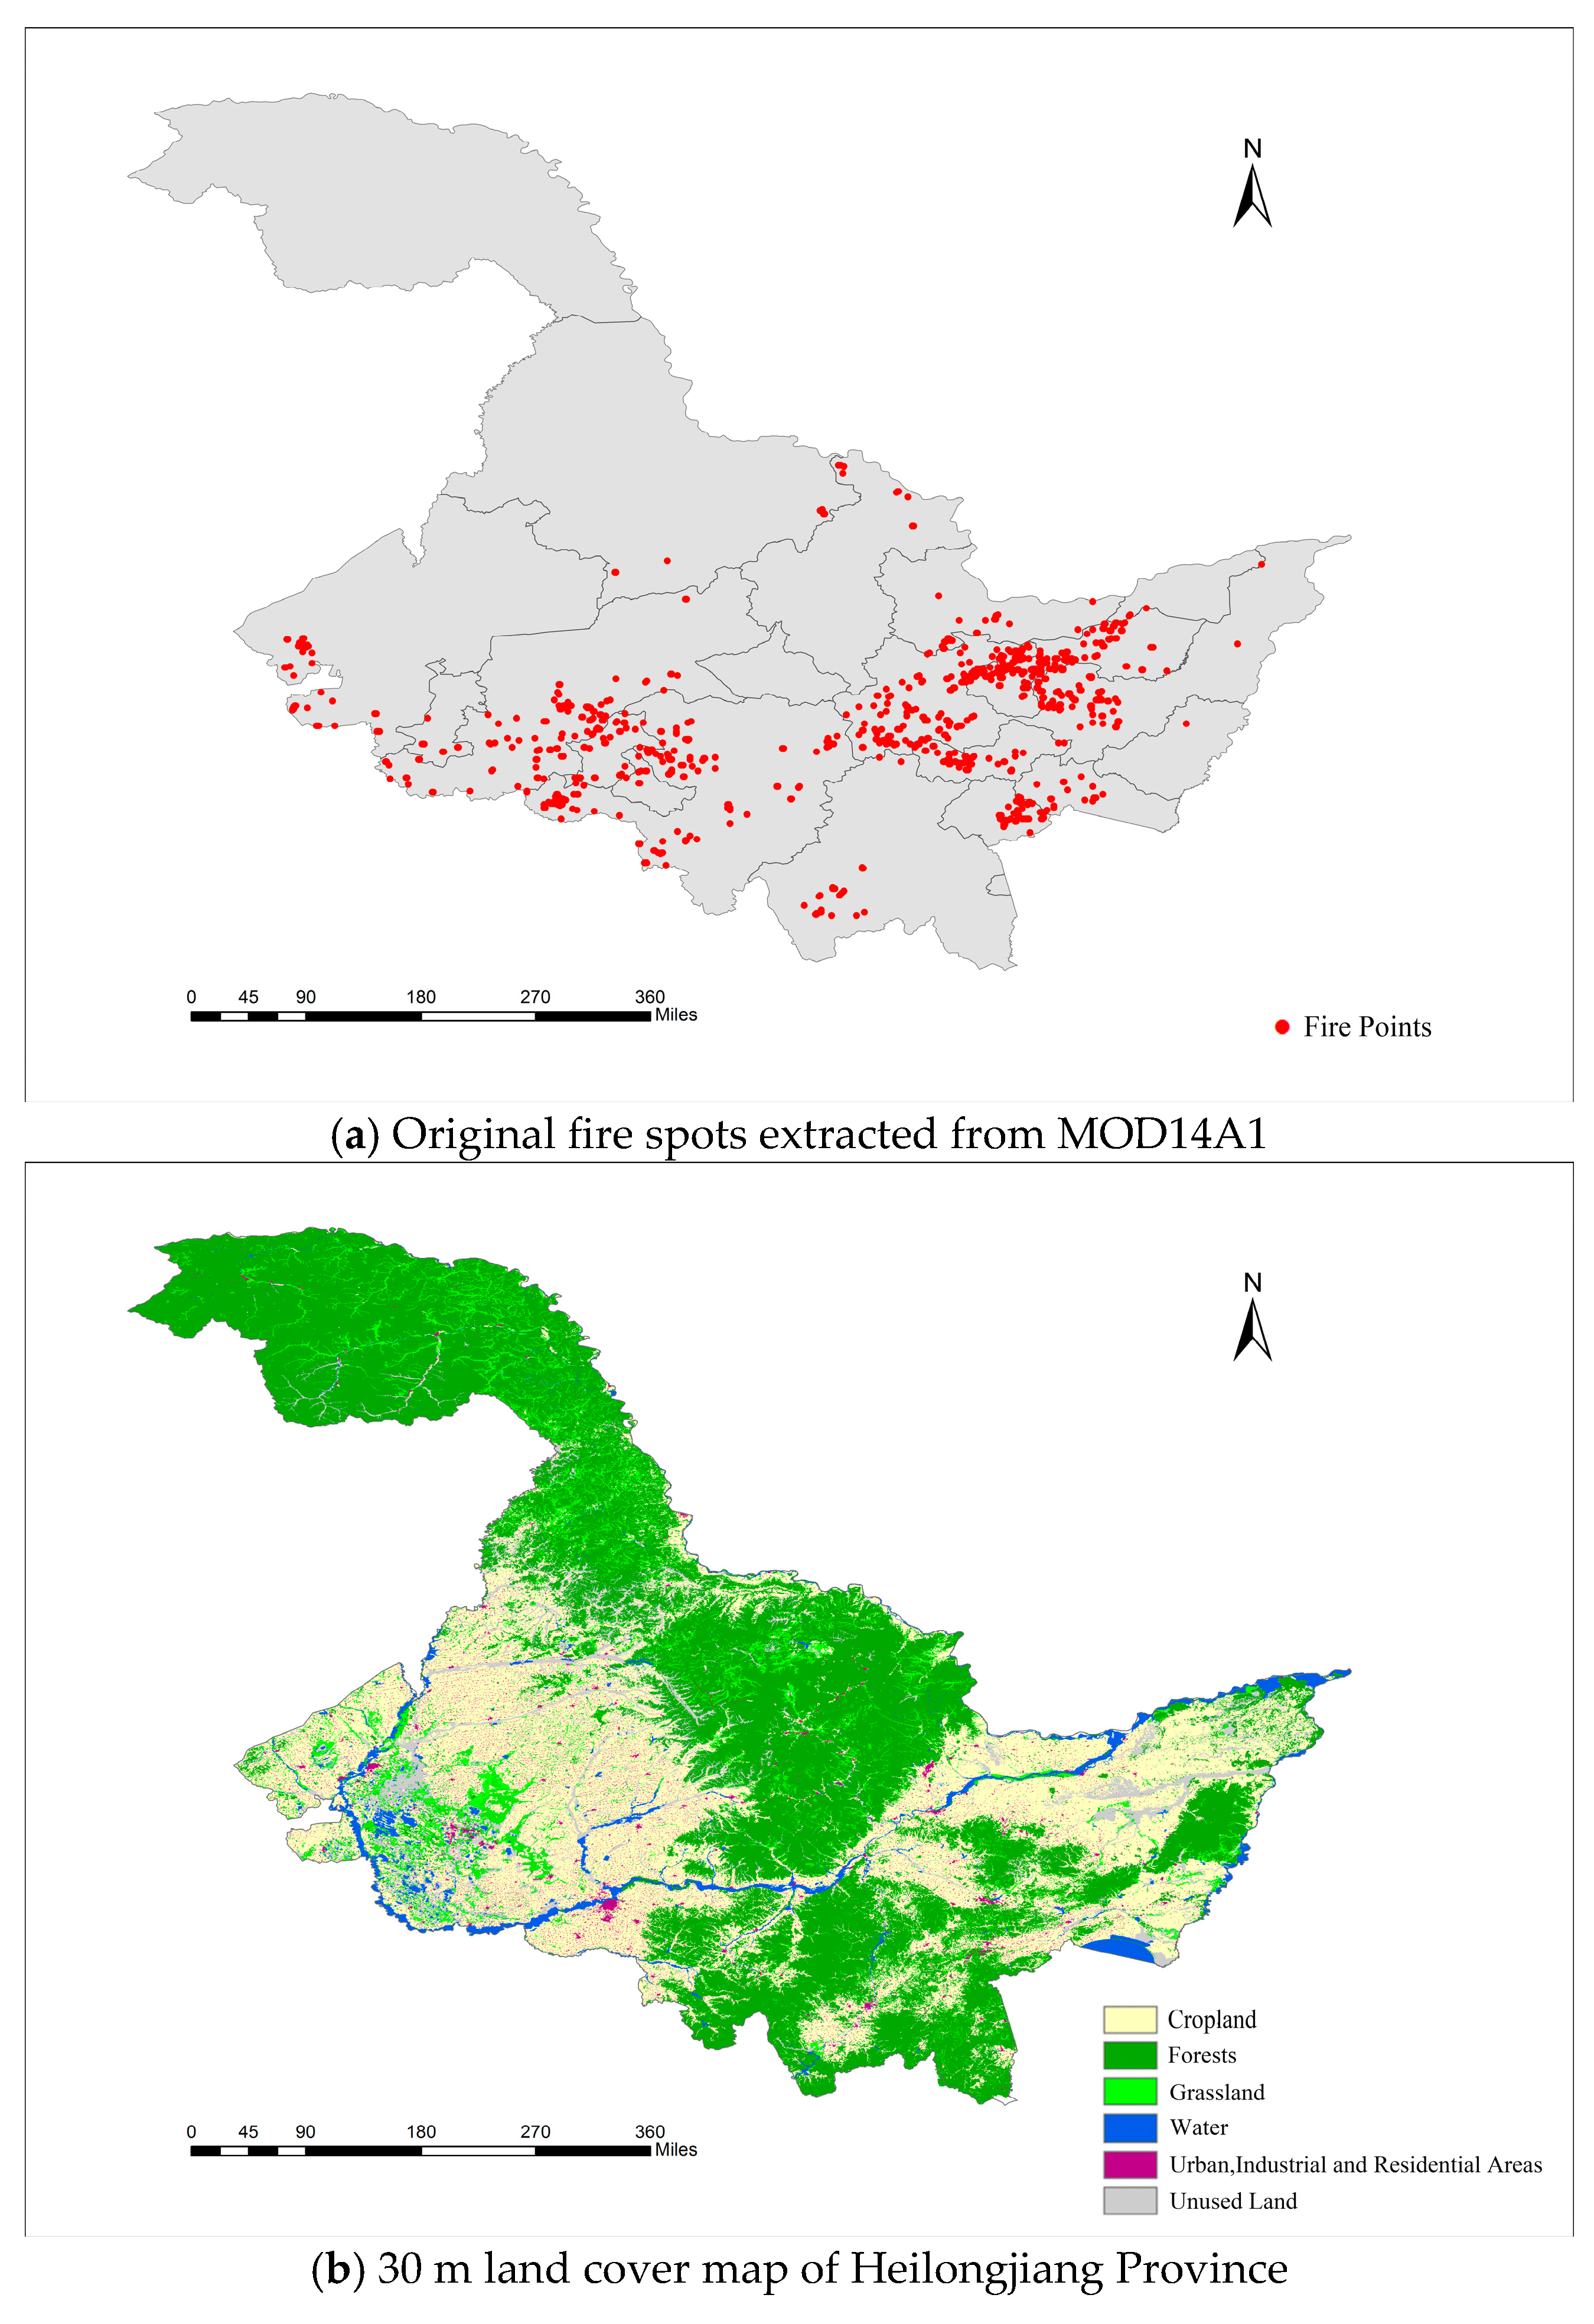
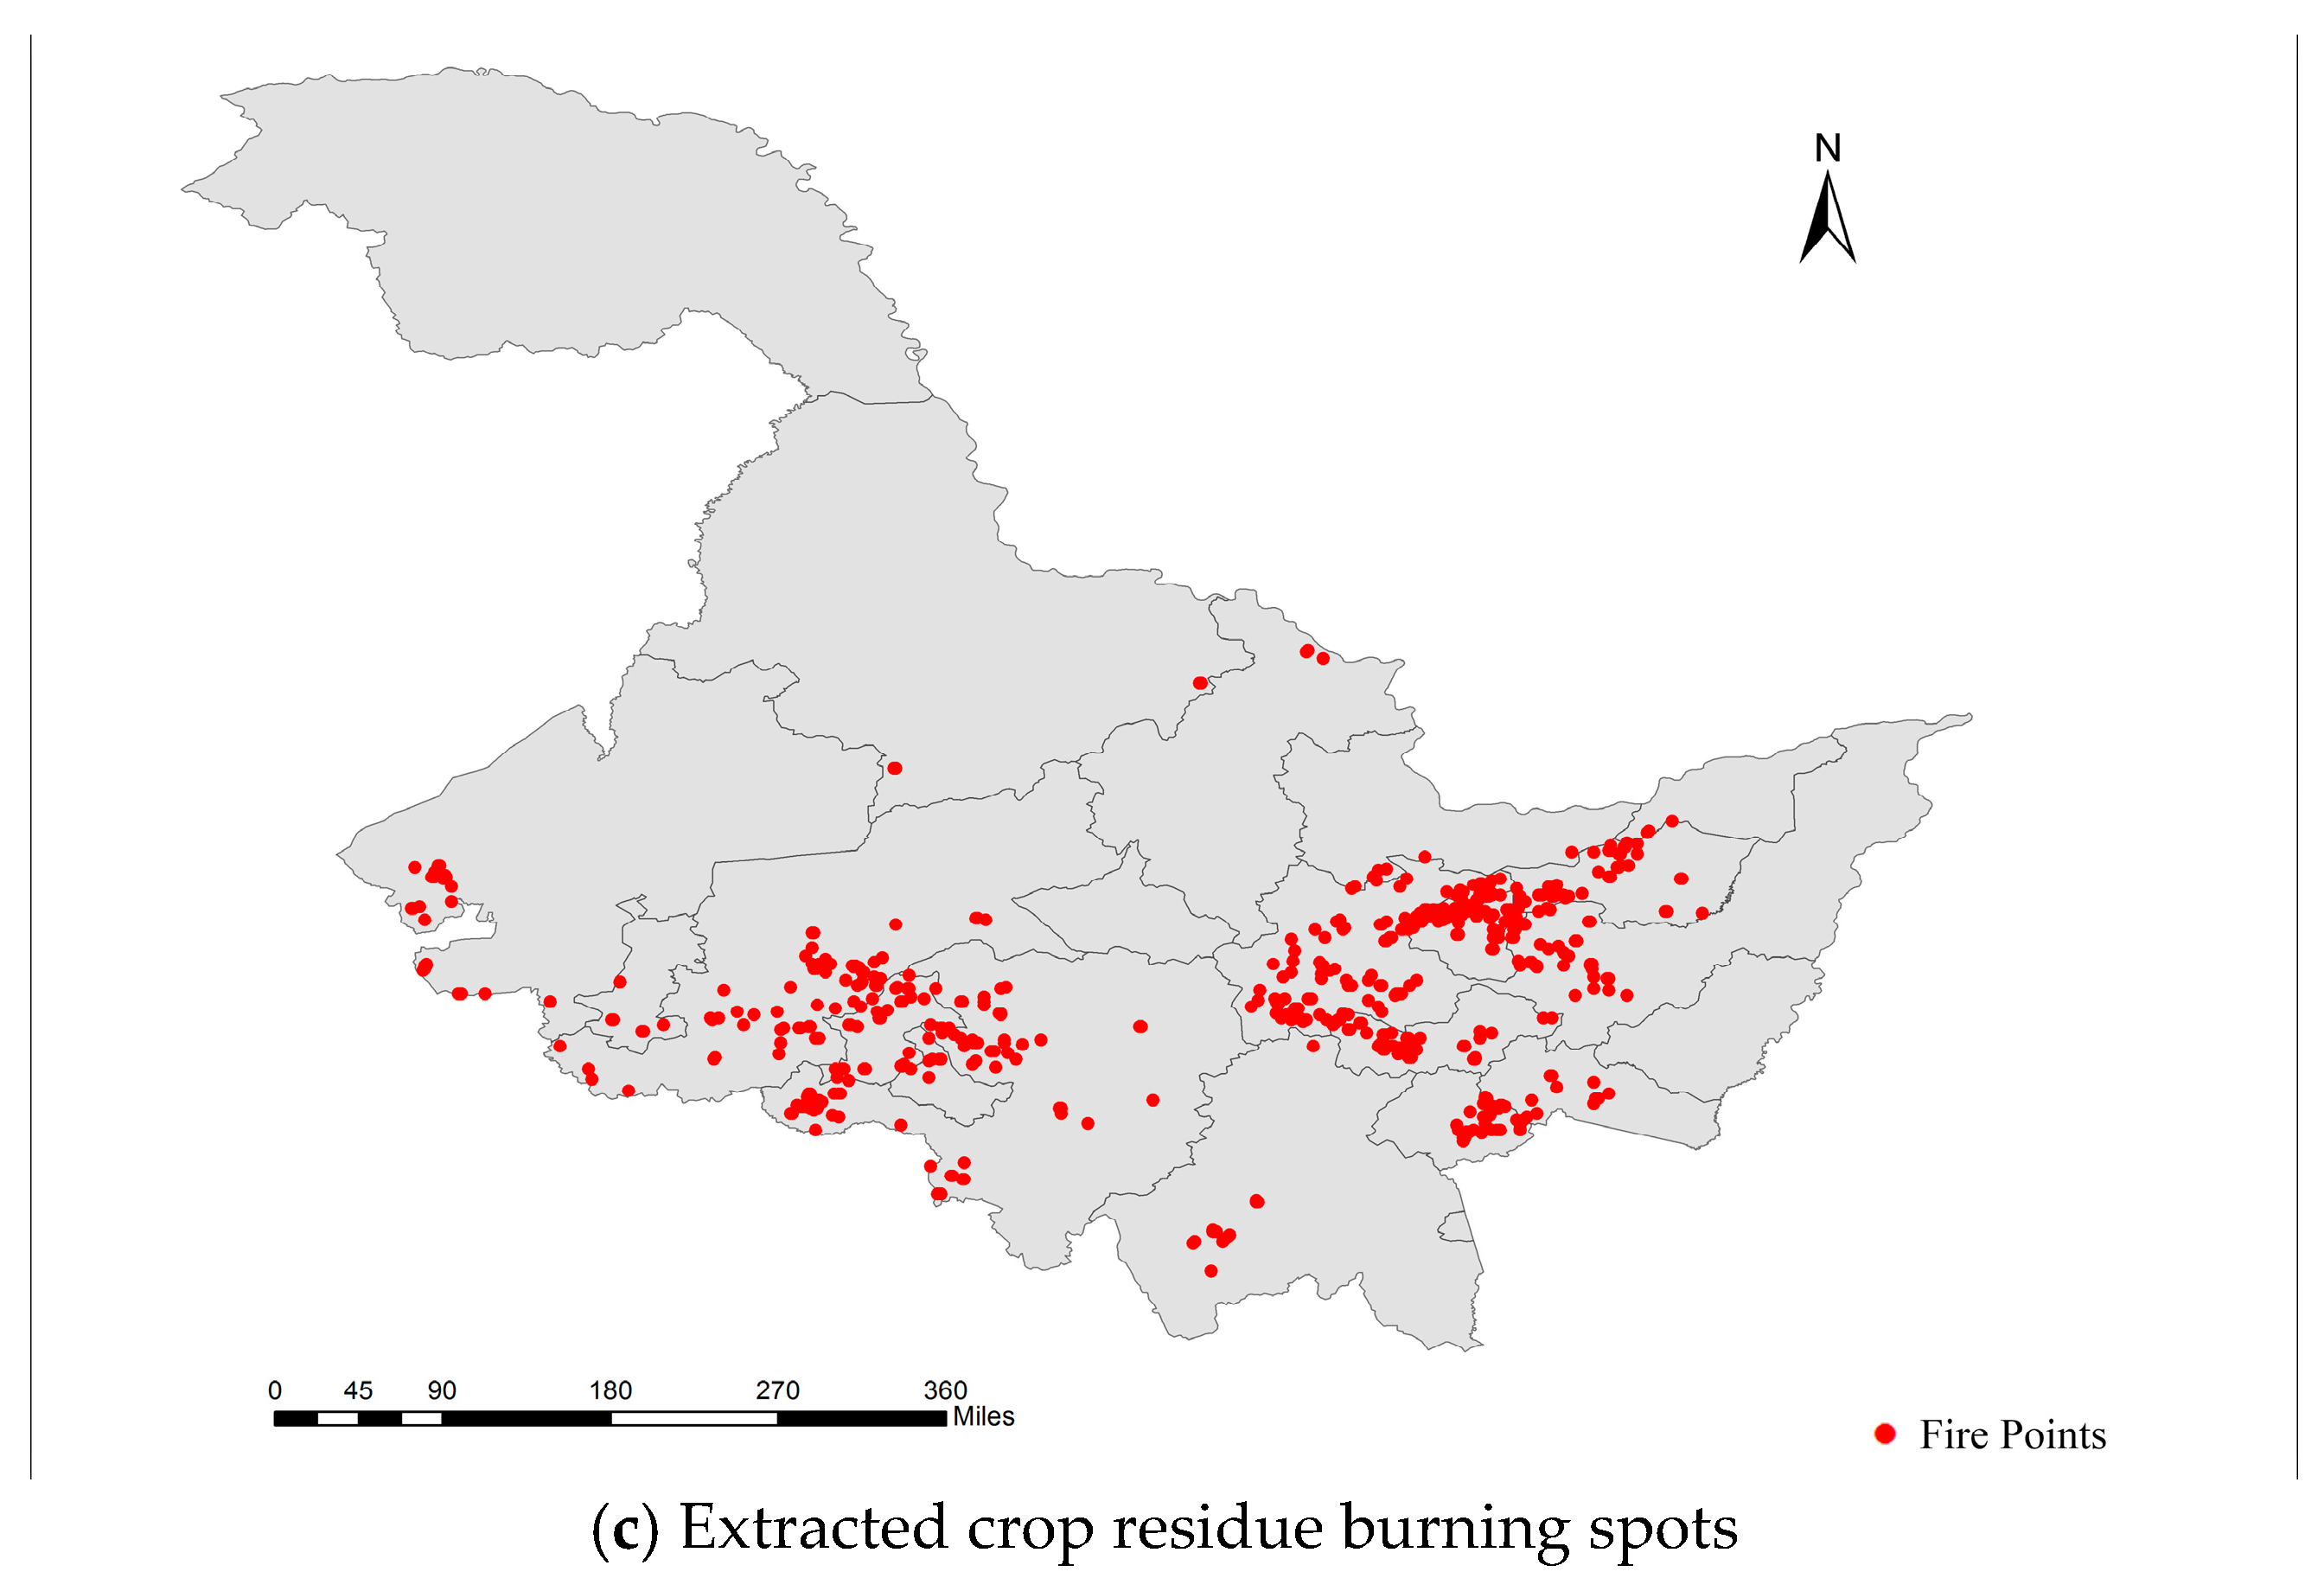
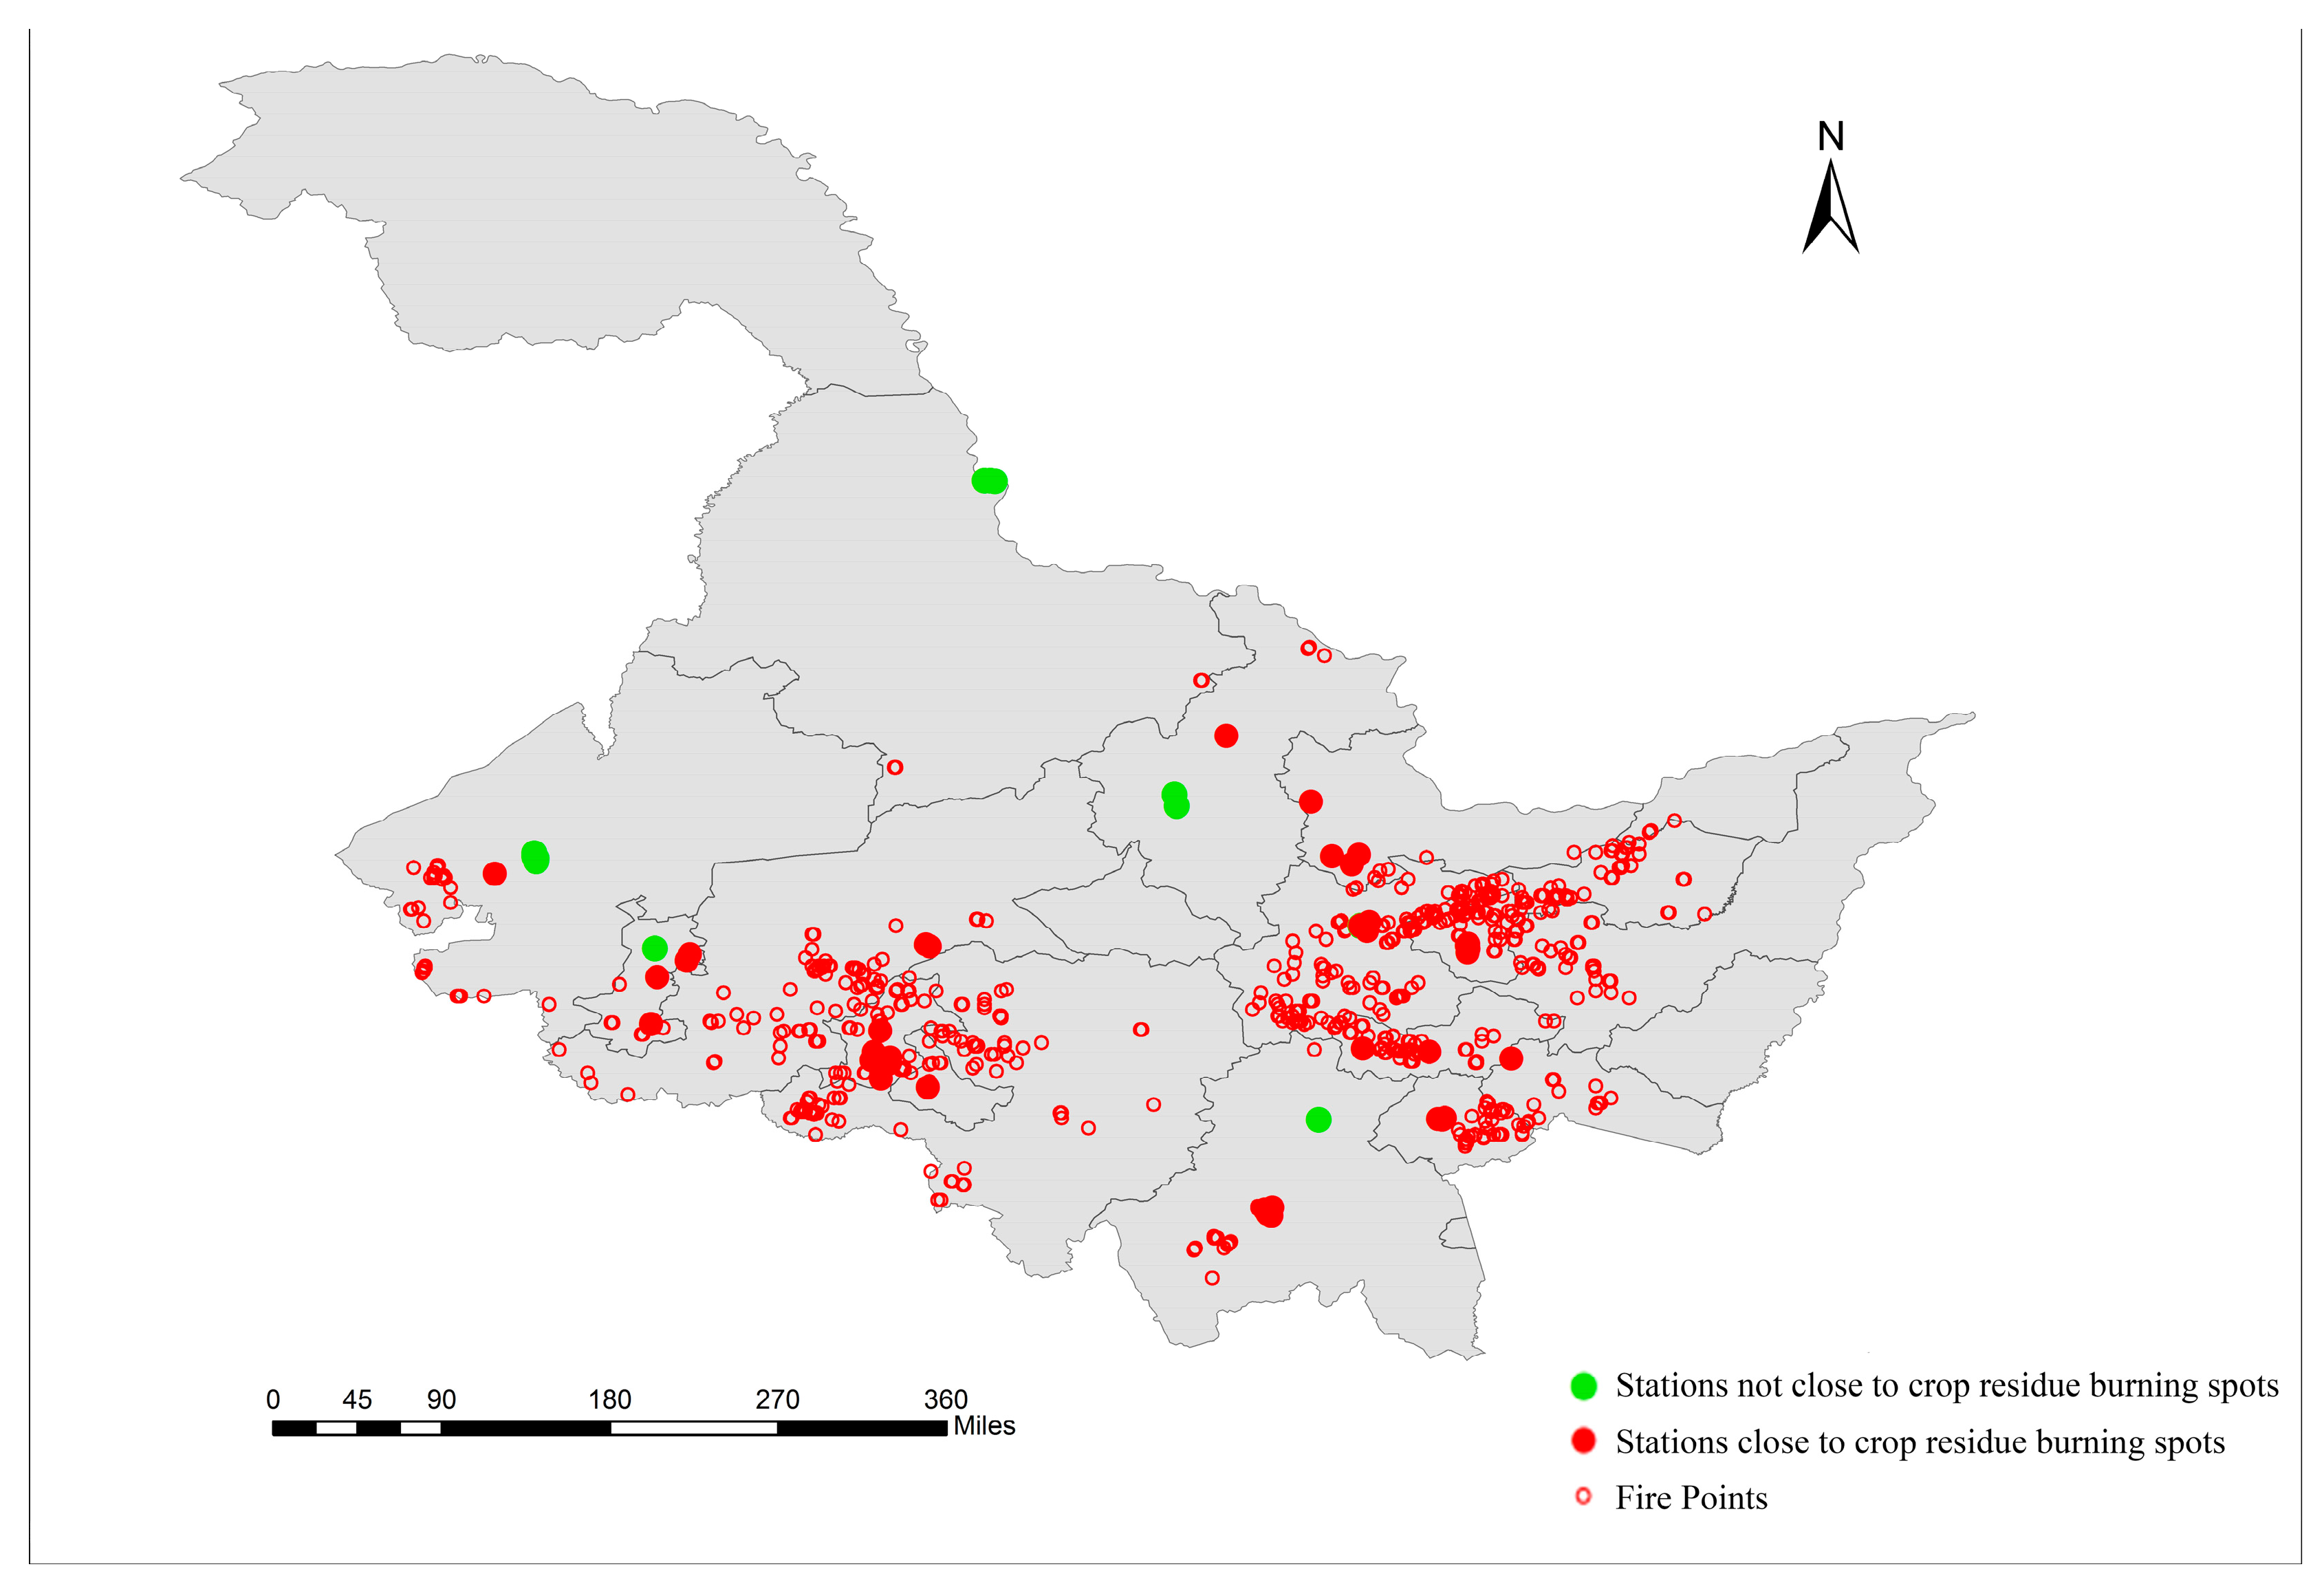
4.1. Extraction of Crop Residue Burning Spots
4.2. The Influence of Crop Residue Burning on Local PM2.5 Concentrations
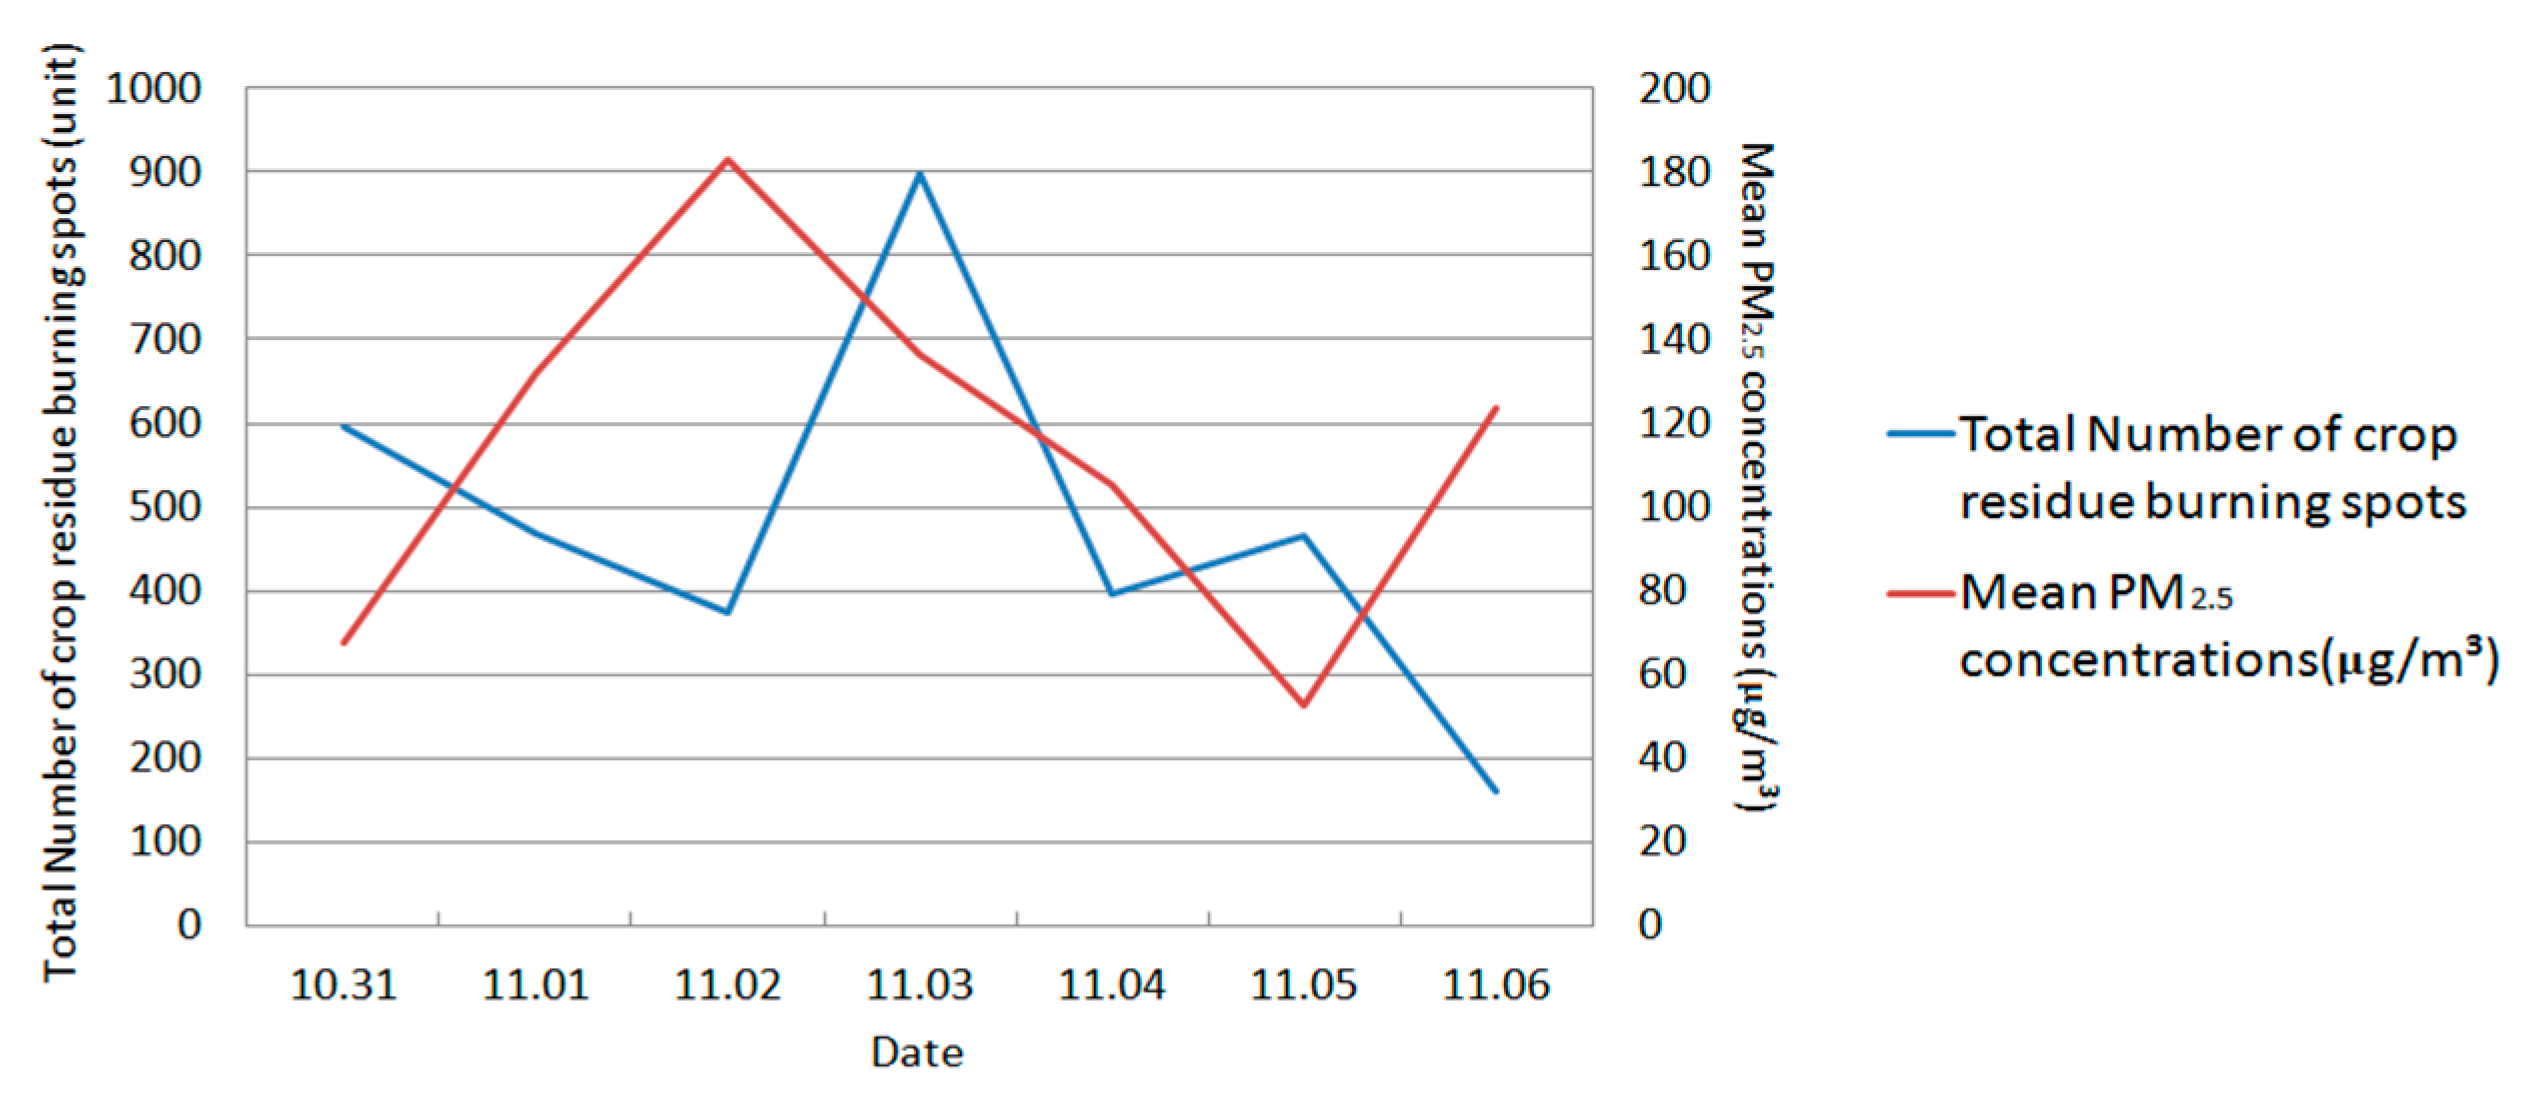
4.2.1. Total Number of Crop Residue Burning Spots and Mean PM2.5 Concentrations within Heilongjiang Province
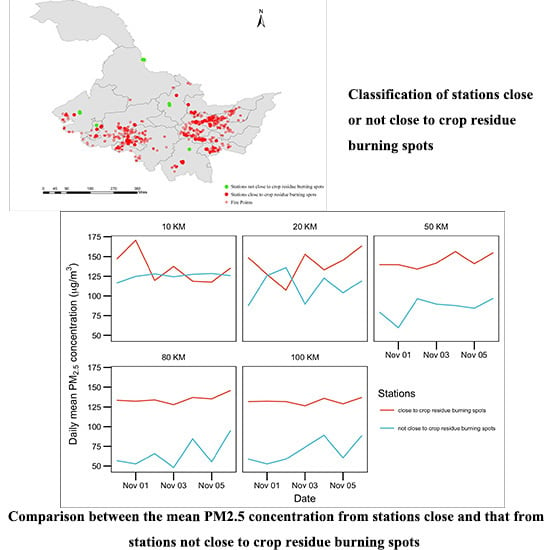
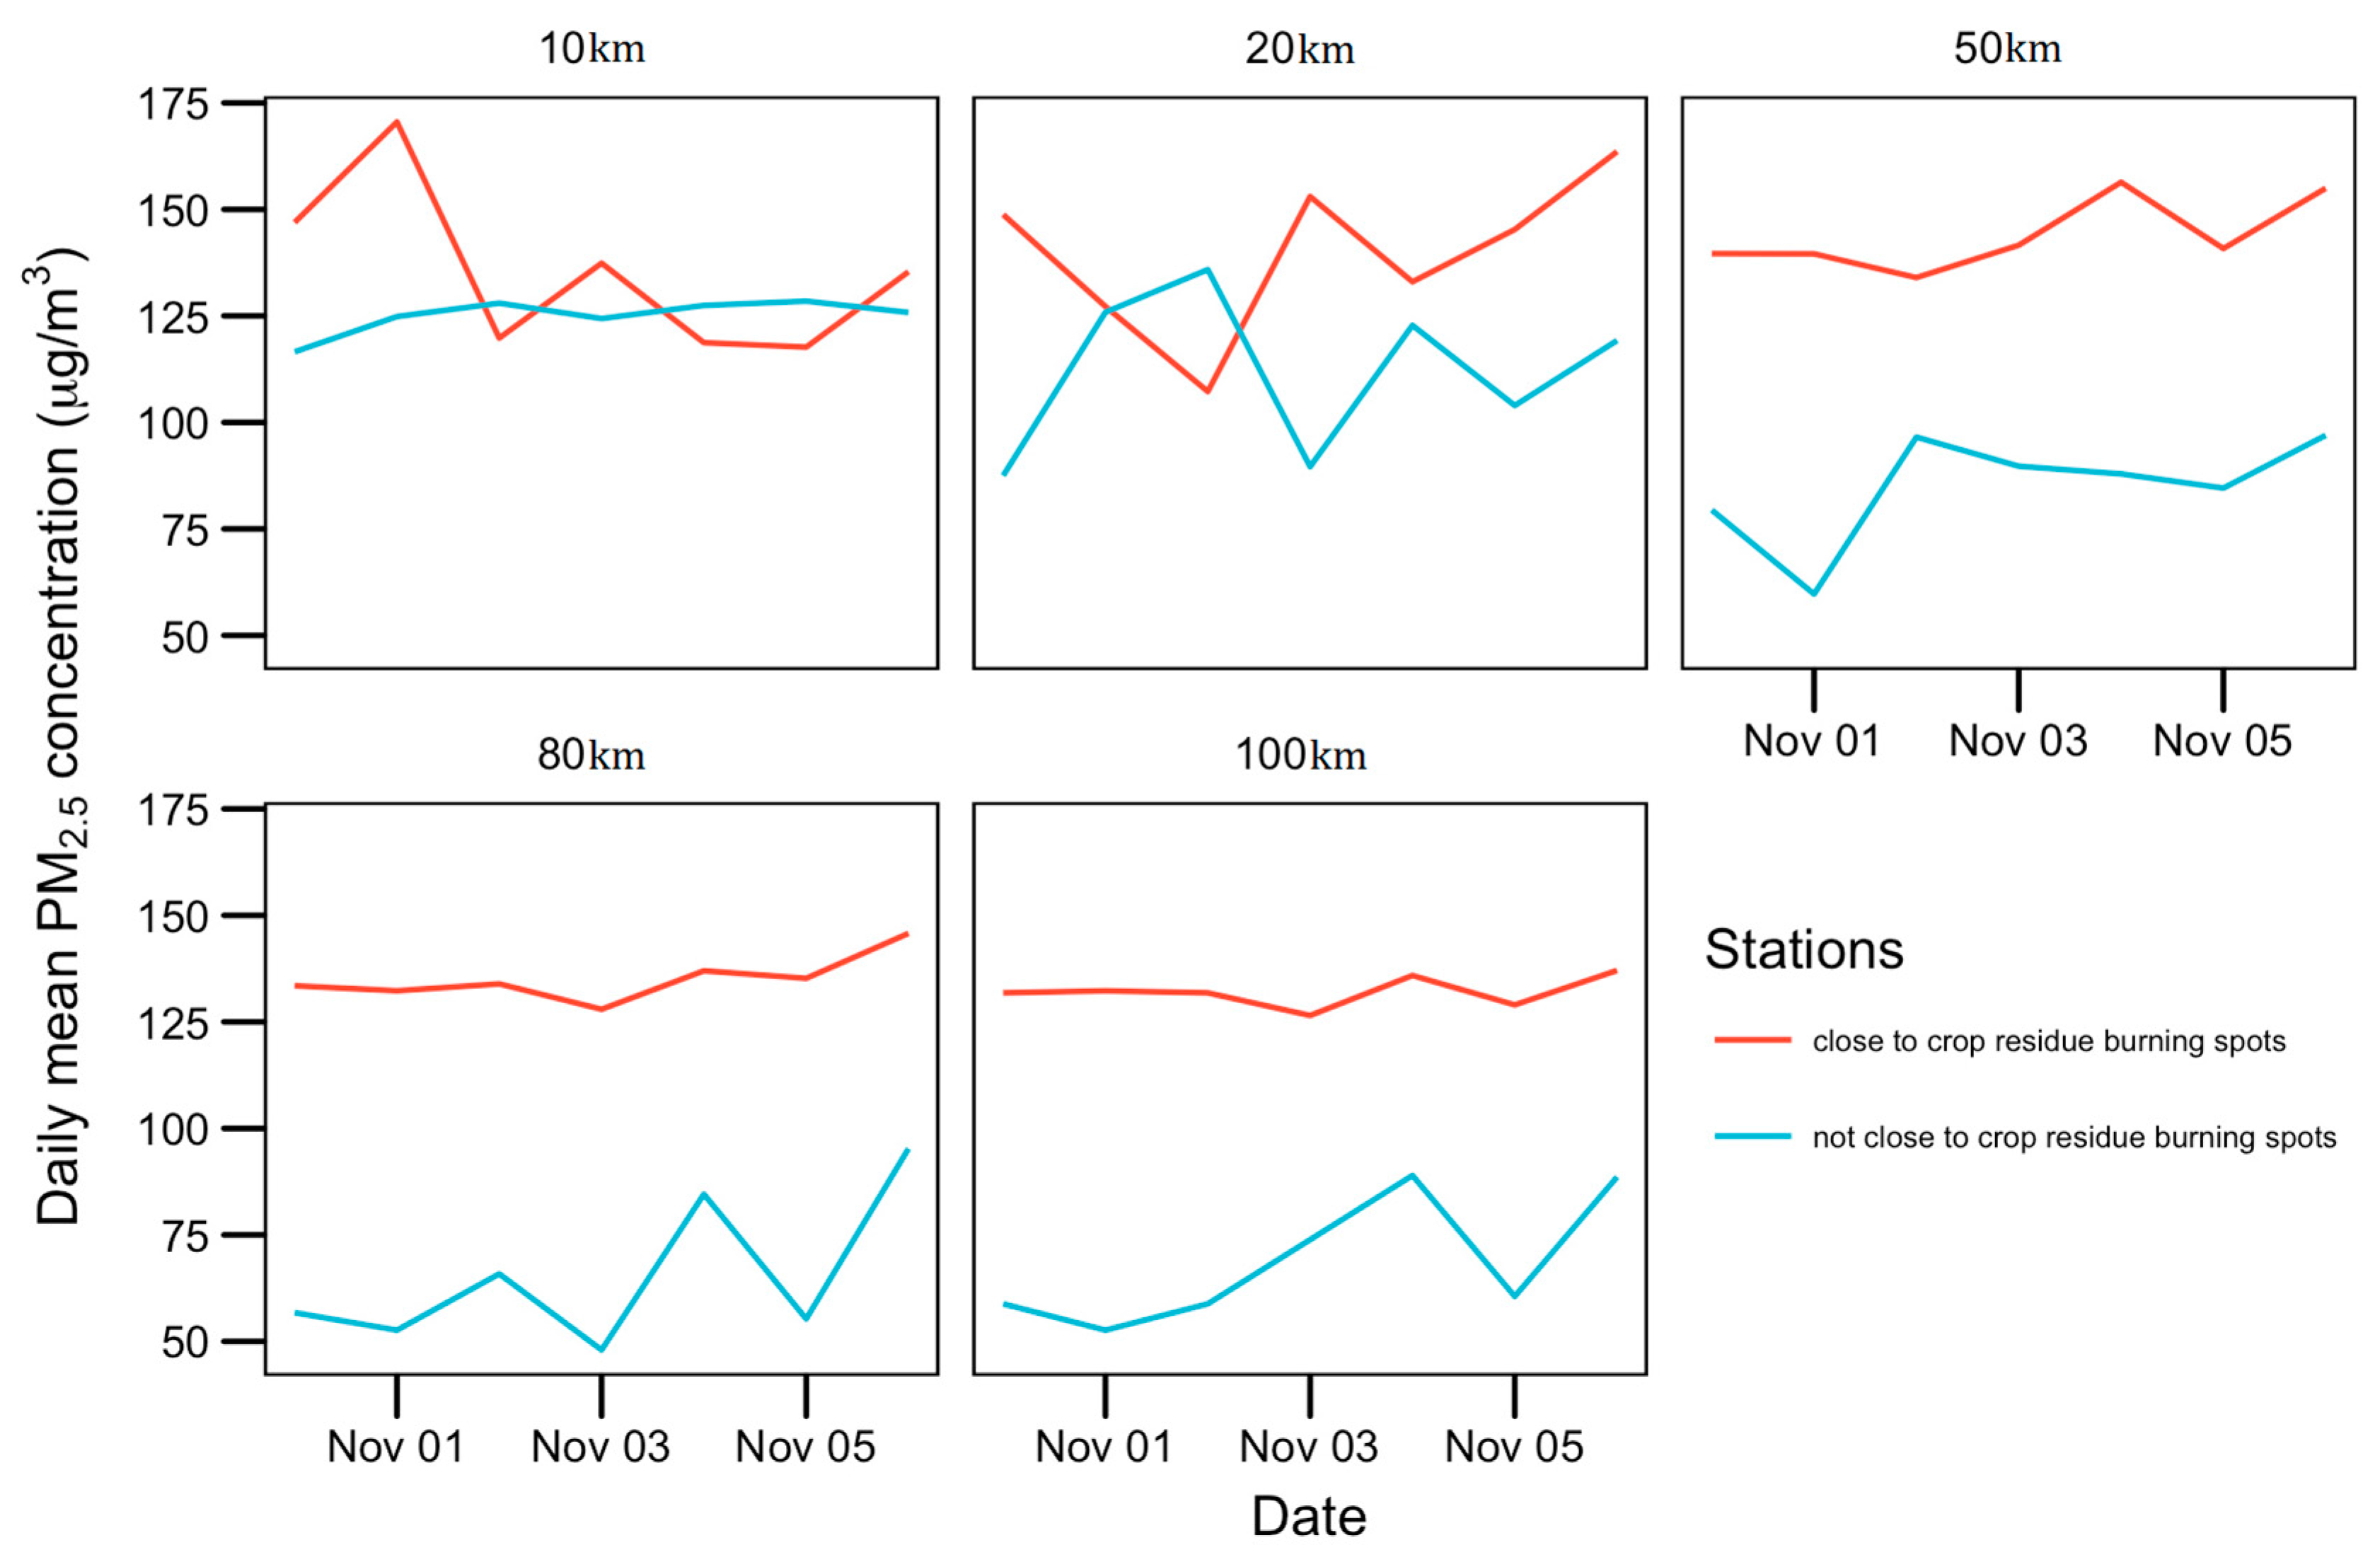
4.2.2. The Influence of Crop Residue Burning on Local PM2.5 Concentrations
5. Discussion
5.1. More Field Experiments are Required for Validating Fire Products
5.2. Source Apportionment Methods Should Be Employed to Quantify the Relative Contribution of Crop Residue Burning to Local PM2.5 Concentrations
5.3. Accumulation and Dispersion of PM2.5 Concentrations Should Be Considered to Understand the Influence of Crop Residue Burning on Simultaneous Variations of PM2.5 Concentrations
5.4. More PM2.5 Observation Stations Are Required to Better Understand the Correlations between Crop Residue Burning and Local PM2.5 Concentrations
6. Conclusions
Acknowledgments
Author Contributions
Conflicts of Interest
References
- Zhang, R.; Jing, J.; Tao, J.; Hsu, S.C.; Wang, G.; Cao, J.; Shen, Z. Chemical characterization and source apportionment of PM2.5 in Beijing: Seasonal perspective. Atmos. Chem. Phys. 2013, 13, 7053–7074. [Google Scholar] [CrossRef]
- Huang, R.J.; Zhang, Y.; Bozzetti, C.; Ho, K.F.; Cao, J.J.; Han, Y.; Zotter, P. High secondary aerosol contribution to particulate pollution during haze events in China. Nature 2014, 514, 218. [Google Scholar] [CrossRef] [PubMed] [Green Version]
- Gu, J.; Du, S.; Han, D.; Hou, L.; Yi, J.; Xu, J.; Liu, G.; Bai, Z.P. Major chemical compositions, possible sources, and mass closure analysis of PM2.5 in Jinan, China. Air Qual. Atmos. Health 2014, 7, 251–262. [Google Scholar] [CrossRef]
- Cao, C.; Jiang, W.; Wang, B.; Fang, J.; Lang, J.; Tian, G.; Jiang, J.; Zhu, T.F. Inhalable Microorganisms in Beijing’s PM2.5 and PM10 Pollutants during a Severe Smog Event. Environ. Sci. Technol. 2014, 48, 1499–1507. [Google Scholar] [CrossRef] [PubMed]
- News about Heilongjiang Province. Available online: http://news.sina.com.cn/c/2016-11-09/doc-ifxxneua4559801.shtml (accessed on 2 July 2017).
- News about Beijing-Tianjin-Hebei Region. Available online: http://hebei.ifeng.com/app/detail_2015_10/21/4466280_0.shtml (accessed on 2 July 2017).
- Gao, R.; Jiang, W.; Gao, W.; Sun, S. Emission inventory of crop residue open burning and its high-resolution spatial distribution in 2014 for Shandong province, China. Atmos. Pollut. Res. 2016, 8, 545–554. [Google Scholar] [CrossRef]
- Li, J.; Bo, Y.; Xie, S. Estimating emissions from crop residue open burning in china based on statistics and modis fire products. J. Environ. Sci. 2016, 44, 158–170. [Google Scholar] [CrossRef] [PubMed]
- Zhang, H.; Hu, J.; Qi, Y.; Li, C.; Chen, J.; Wang, X.; Zhang, L. Emission characterization, environmental impact, and control measure of PM2.5, emitted from agricultural crop residue burning in China. J. Clean. Prod. 2017, 149, 629–635. [Google Scholar] [CrossRef]
- Wang, B.; Liu, Y.; Shao, M.; Lu, S.; Wang, M.; Yuan, B.; Zhang, Y. The contributions of biomass burning to primary and secondary organics: A case study in Pearl River delta (prd), China. Sci. Total Environ. 2016, 548, 569–570. [Google Scholar] [CrossRef] [PubMed]
- Ni, H.; Han, Y.; Cao, J.; Chen, L.W.A.; Tian, J.; Wang, X.; Li, H. Emission characteristics of carbonaceous particles and trace gases from open burning of crop residues in China. Atmos. Environ. 2015, 123, 399–406. [Google Scholar] [CrossRef]
- Zhang, T.; Wooster, M.J.; Green, D.C.; Main, B. New field-based agricultural biomass burning trace gas, PM2.5, and black carbon emission ratios and factors measured in situ, at crop residue fires in eastern China. Atmos. Environ. 2015, 121, 22–34. [Google Scholar] [CrossRef]
- Zhao, J.N.; Ye, Y.; Ren, Y.L.; Wang, H.C. Environmental assessment of crop residue processing methods in rural areas of northeast China. Renew. Energy 2015, 84, 22–29. [Google Scholar] [CrossRef]
- Zong, Z.; Chen, Y.; Tian, C.; Fang, Y.; Wang, X.; Huang, G.; Zhang, G. Radiocarbon-based impact assessment of open biomass burning on regional carbonaceous aerosols in north China. Sci. Total Environ. 2015, 518–519, 1–7. [Google Scholar] [CrossRef] [PubMed]
- Fushimi, A.; Saitoh, K.; Hayashi, K.; Ono, K.; Fujitani, Y.; Villalobos, A.M.; Shelton, B.R.; Takami, A.; Tanabe, K.; Schauer, J.J. Chemical characterization and oxidative potential of particles emitted from open burning of cereal straws and rice husk under flaming and smoldering conditions. Atmos. Environ. 2017, in press. [Google Scholar] [CrossRef]
- Yin, S.; Wang, X.; Xiao, Y.; Tani, H.; Zhong, G.S.; Sun, Z.Y. Study on spatial distribution of crop residue burning and PM2.5 change in China. Environ. Pollut. 2017, 220, 204–221. [Google Scholar] [CrossRef] [PubMed]
- MTAF (MODIS Thermal Anomalies/Fire Products). Data Center. 2015. Available online: http://modis.gsfc.nasa.gov/data/dataprod/mod14.php (accessed on 2 July 2017).
- Giglio, L.; Descloitres, J.; Justice, C.O.; Kaufman, Y.J. An enhanced contextual fire detection algorithm for MODIS. Remote Sens. Environ. 2003, 87, 273–282. [Google Scholar] [CrossRef]
- NLW (NASA’s LAADS Web). Data Center. 2015. Available online: https://ladsweb.nascom.nasa.gov/data/search.html (accessed on 2 July 2017).
- Chen, Z.Y.; Xu, B.; Cai, J.; Gao, B.B. Understanding temporal patterns and characteristics of air quality in Beijing: A local and regional perspective. Atmos. Environ. 2016, 127, 303–315. [Google Scholar] [CrossRef]
- Chen, Z.Y.; Cai, J.; Gao, B.B.; Xu, B.; Dai, S.; He, B.; Xie, X.M. Detecting the causality influence of individual meteorological factors on local PM2.5 concentration in the Jing-Jin-Ji region. Sci. Rep. 2017, 7, 40735. [Google Scholar] [CrossRef] [PubMed]
- Bessho, K.; Date, K.; Hayashi, M.; Ikeda, A.; Imai, T.; Inoue, H.; Okuyama, A. An introduction to Himawari-8/9—Japan’s new-generation geostationary meteorological satellites. J. Meteorol. Soc. Japan Ser. II 2016, 94, 151–183. [Google Scholar] [CrossRef]


| Date | Total Number of Crop Residue Burning Spots | Mean PM2.5 Concentrations (μg/m3) |
|---|---|---|
| 2015/10/31 | 597 | 67.84 |
| 2015/11/01 | 469 | 132.06 |
| 2015/11/02 | 373 | 182.79 |
| 2015/11/03 | 899 | 136.15 |
| 2015/11/04 | 397 | 105.55 |
| 2015/11/05 | 466 | 52.49 |
| 2015/11/06 | 161 | 123.64 |
| Day | Buffer: 50 km | Buffer: 80 km | Buffer: 100 km | |||
|---|---|---|---|---|---|---|
| Not Close | Close | Not Close | Close | Not Close | Close | |
| 2015/10/31 | 79.44 | 139.63 | 56.74 | 133.47 | 58.82 | 131.81 |
| 2015/11/01 | 59.71 | 139.57 | 52.64 | 132.29 | 52.64 | 132.29 |
| 2015/11/02 | 96.55 | 133.99 | 65.85 | 133.93 | 58.82 | 131.81 |
| 2015/11/03 | 89.71 | 141.59 | 48 | 127.95 | 75.99 | 126.50 |
| 2015/11/04 | 87.91 | 156.37 | 84.55 | 136.99 | 88.95 | 135.89 |
| 2015/11/05 | 84.58 | 140.81 | 55.28 | 135.22 | 60.57 | 128.99 |
| 2015/11/06 | 96.97 | 154.97 | 95.28 | 145.78 | 88.61 | 137.07 |
| overall | 84.98 | 143.85 | 65.48 | 135.09 | 69.20 | 132.05 |
| difference | 58.86 | 69.61 | 62.85 | |||
| Existence of Nearby Crop Residue Burning Spots | ||||||
|---|---|---|---|---|---|---|
| 10 km | 20 km | 50 km | 80 km | 100 km | ||
| PM2.5 concentrations | 2015/10/31 | 0.190 | 0.078 | 0.154 | 0.216 | 0.210 |
| 2015/11/01 | 0.008 | 0.120 | 0.352 ** | 0.213 | 0.213 | |
| 2015/11/02 | 0.065 | −0.170 | 0.191 | 0.157 | 0.152 | |
| 2015/11/03 | −0.094 | 0.088 | 0.199 | 0.037 | 0.124 | |
| 2015/11/04 | −0.084 | 0.214 | 0.270 * | 0.067 | 0.038 | |
| 2015/11/05 | −0.100 | 0.191 | 0.229 | 0.426 ** | 0.230 | |
| 2015/11/06 | 0.050 | 0.146 | 0.434 ** | 0.368 ** | 0.257 | |
© 2017 by the authors. Licensee MDPI, Basel, Switzerland. This article is an open access article distributed under the terms and conditions of the Creative Commons Attribution (CC BY) license (http://creativecommons.org/licenses/by/4.0/).
Share and Cite
Chen, Z.; Chen, D.; Zhuang, Y.; Cai, J.; Zhao, N.; He, B.; Gao, B.; Xu, B. Examining the Influence of Crop Residue Burning on Local PM2.5 Concentrations in Heilongjiang Province Using Ground Observation and Remote Sensing Data. Remote Sens. 2017, 9, 971. https://doi.org/10.3390/rs9100971
Chen Z, Chen D, Zhuang Y, Cai J, Zhao N, He B, Gao B, Xu B. Examining the Influence of Crop Residue Burning on Local PM2.5 Concentrations in Heilongjiang Province Using Ground Observation and Remote Sensing Data. Remote Sensing. 2017; 9(10):971. https://doi.org/10.3390/rs9100971
Chicago/Turabian StyleChen, Ziyue, Danlu Chen, Yan Zhuang, Jun Cai, Na Zhao, Bin He, Bingbo Gao, and Bing Xu. 2017. "Examining the Influence of Crop Residue Burning on Local PM2.5 Concentrations in Heilongjiang Province Using Ground Observation and Remote Sensing Data" Remote Sensing 9, no. 10: 971. https://doi.org/10.3390/rs9100971