Long-Term, High-Resolution Survey of Atmospheric Aerosols over Egypt with NASA’s MODIS Data


1
Faculty of Engineering, Cairo University, Giza, Egypt
2
Department of Physics, American University in Cairo, New Cairo, Egypt
3
Department of Climate and Space Sciences and Engineering, University of Michigan, Ann Arbor, MI 48109-2143, USA
*
Author to whom correspondence should be addressed.
Remote Sens. 2017, 9(10), 1027; https://doi.org/10.3390/rs9101027
Submission received: 26 August 2017
/
Revised: 26 September 2017
/
Accepted: 29 September 2017
/
Published: 6 October 2017
(This article belongs to the Special Issue Aerosol Remote Sensing)
Abstract
:A decadal survey of atmospheric aerosols over Egypt and selected cities and regions is presented using daily aerosol optical depth (AOD) data from NASA’s Moderate Resolution Imaging Spectroradiometer (MODIS) at 550 nm wavelength onboard the Aqua satellite. We explore the AOD spatio-temporal variations over Egypt during a 12-year record (2003 to 2014) using the MODIS high-resolution (10 km) Level 2 data product. Five cities and two geographic regions that feature different landscape and human activities were selected for detailed analysis. For most of the examined areas, AOD is found to be most frequent in the 0.2–0.3 range, and the highest mean AOD was found to be over Cairo, Alexandria, and the Nile Delta region. Severe events are identified based on AOD higher than a selected threshold. Most of these events are engendered by sand and dust storms that originate from the Western Desert during January–April. Spatial analysis indicates that they cover the Nile Delta region, including cities of Cairo and Alexandria, on the same day. Examination of the spatial gradient of AOD along the four cardinal directions originating from the city’s center reveals seasonally dependent gradients in some cases. The gradients have been linked to locations of industrial activity. No trend of AOD has been observed in the studied areas during the study period, though data from Cairo and Asyut reveal a slight linear increase of AOD. Considering Cairo is commonly perceived as a city of poor air quality, the results show that local events are fairly constrained. The study highlights spatial and seasonal distributions of AOD and links them to geographic and climatic conditions across the country.
1. Introduction
Atmospheric aerosols (also known in the meteorological field as particulate matter) are liquid or solid particles suspended in the atmosphere [1]. They are emitted from the Earth’s surface both naturally (e.g., dust, sea salt, biogenic emissions, etc.) and as a result of human activities (products of combustion such as smoke and ashes). They can also be created and modified by chemical processes in the atmosphere. Aerosols play a key role in determining the atmospheric chemistry and energy balance of the Earth system [2,3]. In addition, certain types have negative impact on public health [4]. Aerosols comprise a broad collection of particles with different sizes and properties, with the fine particles (<2.5 microns) having a detrimental impact on human health [4].
Depending on their composition, aerosols can scatter and/or absorb incoming solar radiation. Scattering aerosols (e.g., large dust particles) reflect incoming solar radiation and therefore have a cooling effect. On the other hand, absorbing aerosols (e.g., carbon emissions from combustion processes) contribute to local warming of the atmosphere [1]. The primary parameters that determine the environmental and health impacts of the aerosols include their concentration, size distribution, chemical composition, and optical properties. The latter includes aerosol optical depth (AOD), which is a metric for the total extinction of incoming solar radiation at the surface due to the presence of aerosols and clouds.
Egypt has the ninth highest mean annual concentration of PM10 (<10 microns in diameter) in the world [5]. Sources of aerosols over Egypt comprise blown sand and dust from the Sahara, pollutants originating in Europe and carried with sea salt over the Mediterranean by northerly winds, burning of agriculture residues (e.g., rice straw in the Nile Delta region), and the emission of gases and aerosols in urbanized and industrial regions. Anthropogenic sources have become increasingly important in Egypt, as the population of the country (now close to 92 million, living on almost 7% of the country’s area) is growing at nearly 2.5% annually. Most of the aerosol studies over Egypt concentrate on Cairo (near 20 million in habitants, including those in adjacent areas), which is one of the most populated and highest polluted cities in the world [6,7]. A few studies have also been conducted over Alexandria (the second largest city in the country) and the Nile Delta (ND) regions [8,9,10]. Most of these studies relied mainly on remote sensing data and partly on ground measurements. With the growing human activities in a few cities, especially in Upper Egypt, and the advent of the national land reclamation project in the western desert, a need has been identified to study aerosols over other cities and regions in the country.
Historically, AOD has been calculated over the ocean from reflectance measured by a single channel sensor onboard the Geostationary Operational Environmental Satellite (GOES) series and Meteosat series or a dual-channel sensor such as the Advanced Very High Resolution Radiometer (AVHRR) [11]. In the past two decades, various satellite platforms were launched carrying sensors capable of measuring aerosol parameters in multispectral, multi-angular, and multi-polarization modes. A widely-used sensor for AOD retrieval is the Moderate-Resolution Imaging Spectroradiometer (MODIS), launched onboard NASA’s Terra satellite in 1999 and Aqua satellite in 2002. NASA offers a suite of aerosol products from this sensor, with AOD provided at three visible wavelengths over land and seven wavelengths over ocean [12]. Other NASA sensors are used to derive AOD, include the Multi-angle Imaging SpectroRadiometer (MISR) with its multispectral and multi-angle capabilities that are used to retrieve AOD over ocean and land [13]. This sensor, however, has a limited swath of 360 km, which limits the global coverage to once every 7–8 days. The Sea-Viewing Wide Field-of-view Sensors (SeaWiFS; 1997–2010) also retrieves aerosol parameters as a by-product [14]. The POLarization and Directionality of the Earth’s Reflectance (POLDER; 1996–2003) was a joint project between French and Japanese space agencies that retrieved AOD using polarization and directionality of earth reflectance over land [15]. Background information on using remote sensing for aerosol measurements can be found in Kaufman et al., [1,16,17,18].
AOD is derived from MODIS and SeaWiFS using one of two algorithms. Over dark surfaces such as water bodies and dark soil or vegetation it is estimated using the dark target algorithm [16]. Over bright-reflecting targets (most land surface, especially desert), the measured radiance by the sensor in the red and infrared wavelength bands is dominated by surface contributions that makes it difficult to separate the aerosol contribution. To resolve this problem, the blue wavelength measurements are used because the reflectance over land in this wavelength is much lower than for longer wavelengths. This is the essence of the deep blue algorithm (NASA’s Collection 6) to infer AOD over bright-reflective surfaces [19]. Recently, an enhanced version of this algorithm was developed [20] to replace the use of the static surface reflectance database with a hybrid approach that employs pre-calculated surface reflectance along with normalized difference vegetation index. This has extended the use of the algorithm from arid and semiarid areas to areas of mixed surface cover of all types. MODIS products from both dark target and combined dark target and deep blue algorithms are used in this study.
In this study, MODIS AOD product from Collection 6 level 2 is used to pursue two objectives. (1) To examine seasonal and spatial distribution of AOD over Egypt during the 12-year study period (2003–2014) in order to ascertain key climatological information; (2) to compare the temporal/seasonal variation of the aerosol loading over different regions and urban areas throughout Egypt in order to assess the relative level of air quality. Additionally, we examined the urban-to-rural gradient around selected cities to improve our understanding of aerosol sources. The presented survey offers a valuable resource for investigating the air quality and the climate impact of aerosols over Egypt and North Africa.
2. Selected Sites
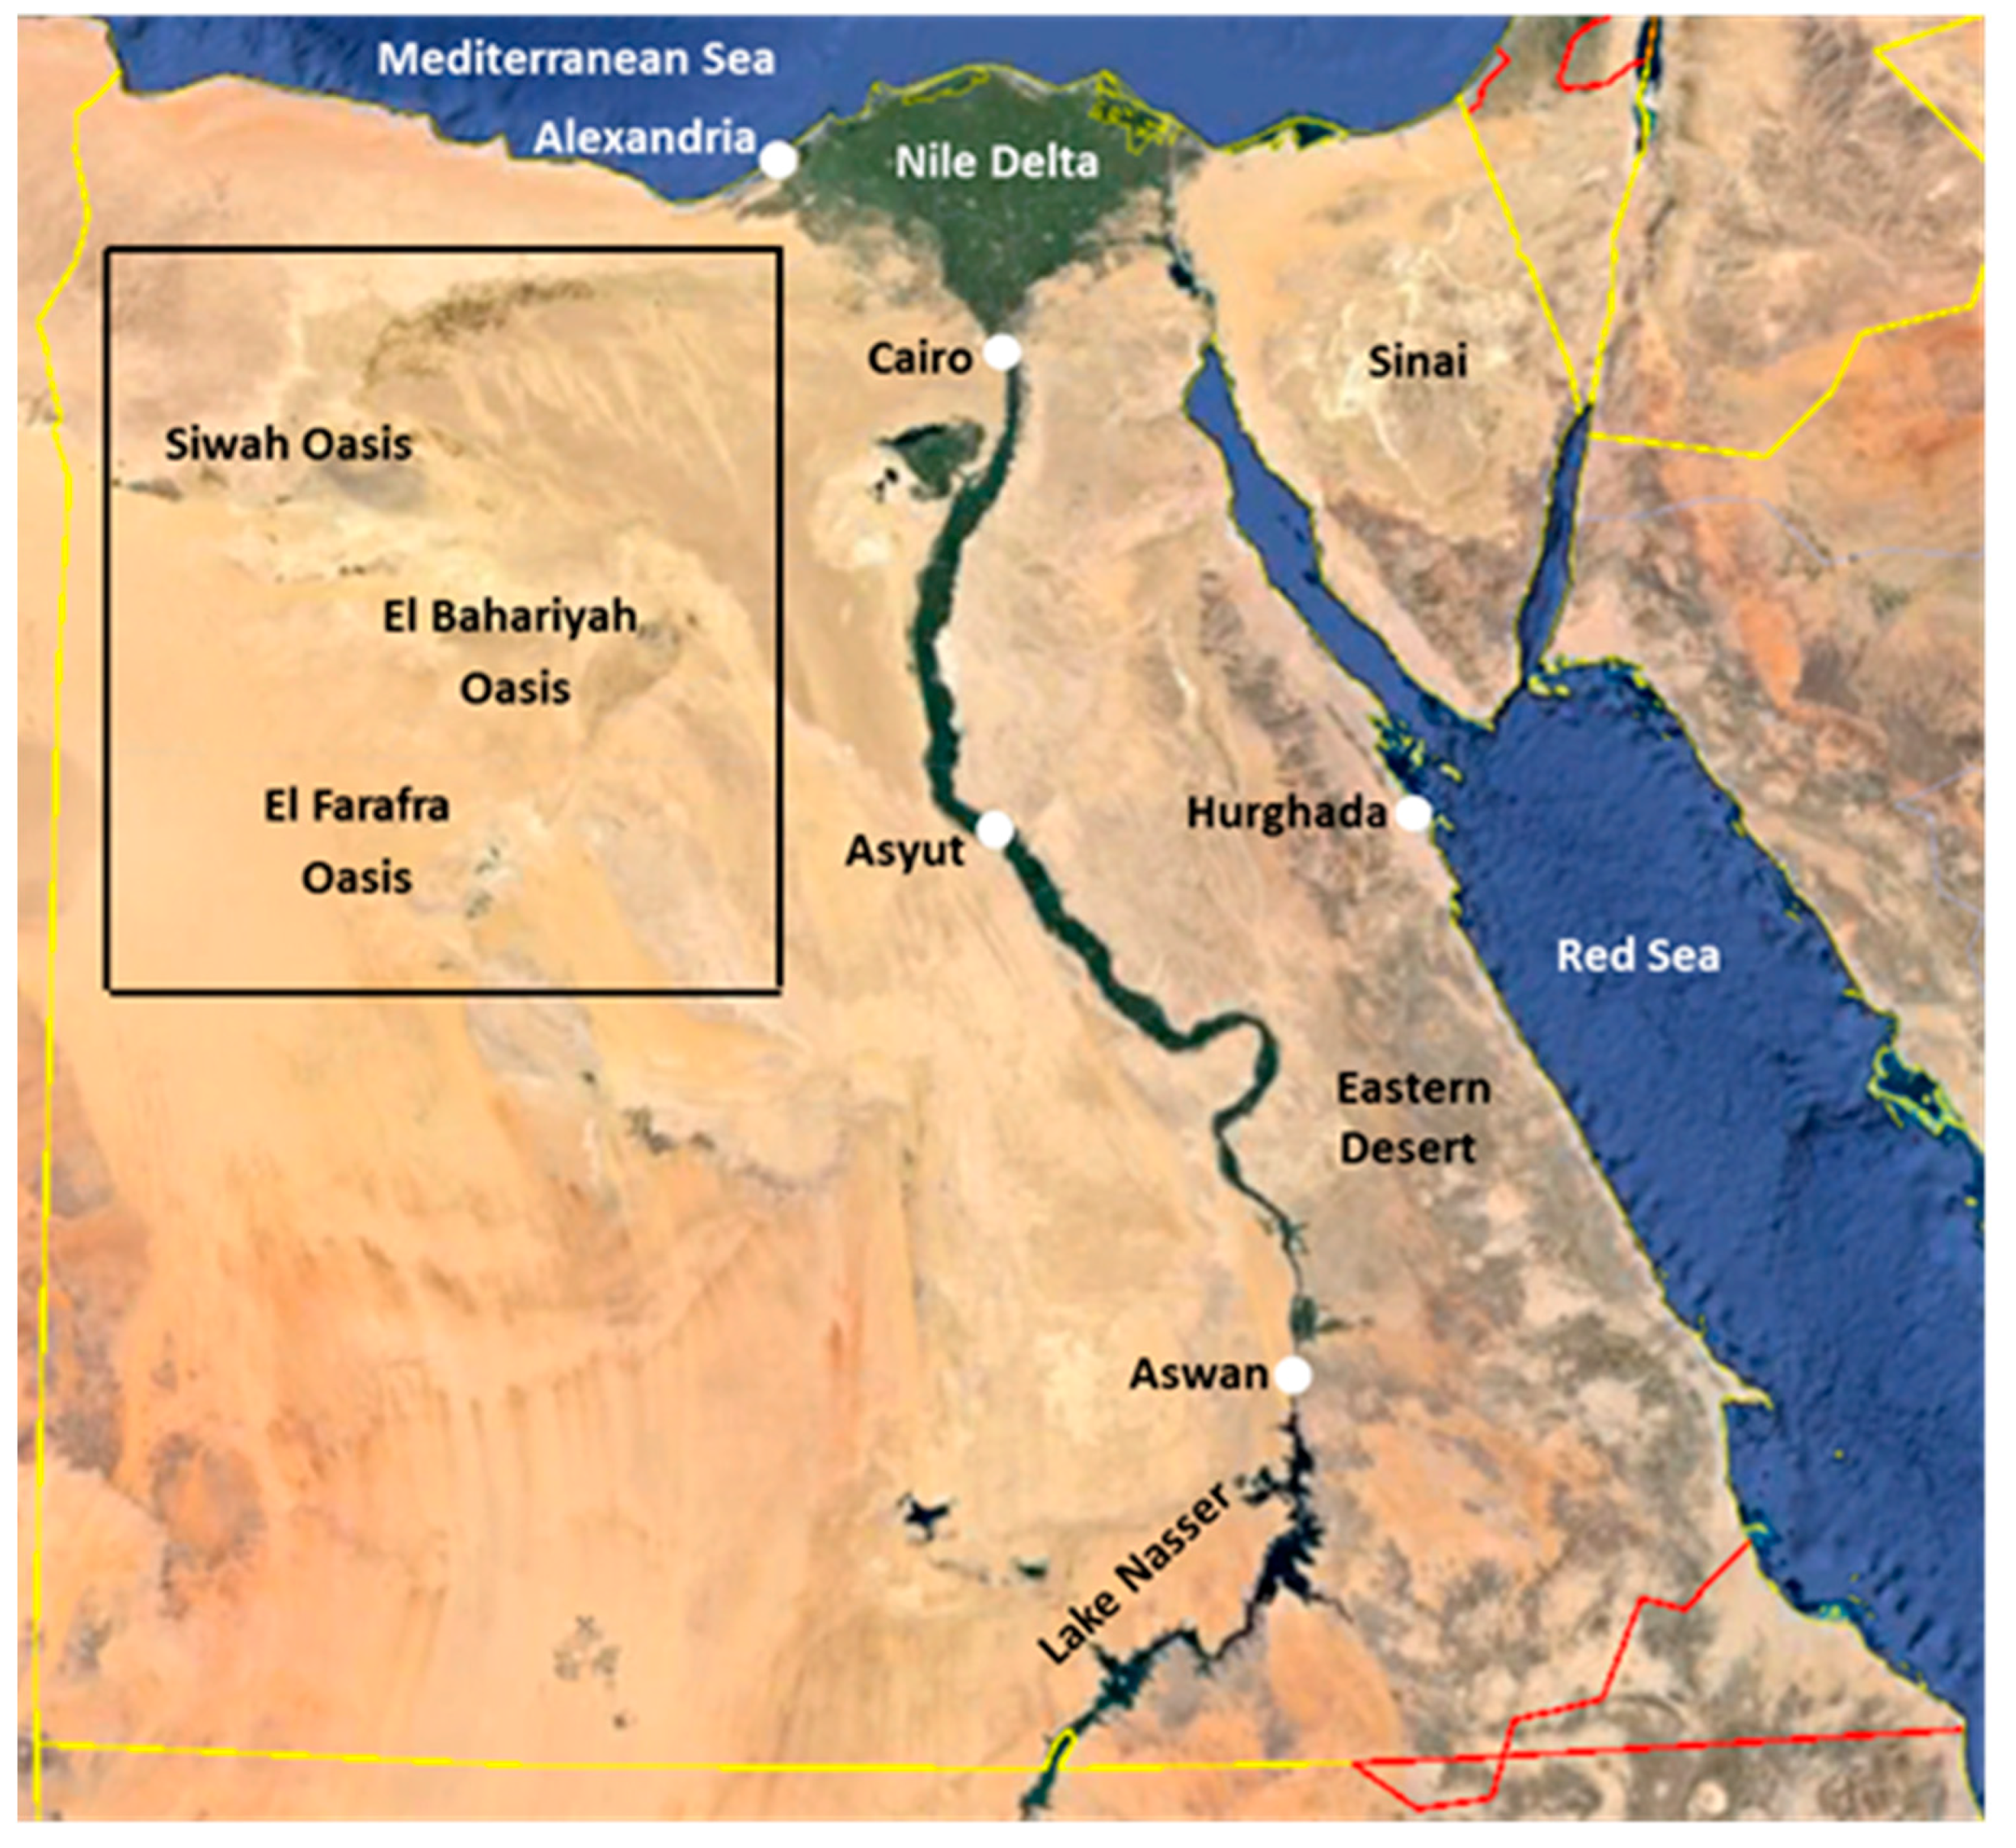
The spatial and temporal AOD are examined over the entire country, the two regions of northern Western Desert (WD) and Nile Delta (ND), and five cities (from north to south): Alexandria, Cairo, Asyut, Hurghada, and Aswan (Figure 1). The cities feature different aerosol climatology related to the primary industrial/human activities and surrounding landscape. Information about each city is included in Table 1. The WD region encompasses the Oasis of Siwah, El-Bahariyah, and El-Farafra. Evaluated over space and time, the satellite-derived aerosol data provide information about the effects of the demographic variation and growth of Egypt on its anthropogenic pollution.
Alexandria, the second largest city in Egypt, is a Mediterranean coastal city. It houses about 55% of the national industry in Egypt and suffers from pollution episodes, though not as intensive as those observed over Cairo and other cities in the ND. Atmospheric aerosol loadings are affected by pollutants transferred from Europe, sea salt from the Mediterranean Sea, and dust from the WD and Sahara Desert during the spring and the transitional seasons. Cairo is one of the highly populated cities in the world with population density of nearly 46,000 per square kilometer [21]. With its industrial activities estimated to make up one-third of the national total, Cairo is one of the most polluted megacities in the world [22,23]. The increasing local anthropogenic activities have added to gas-phase composition of the atmosphere in the form of carbon monoxide, nitrogen oxides, and sulfur dioxide [10,24,25]. Moreover, Cairo’s low topography with respect to the surrounding highlands (Giza in the west and Mokattam in the east) suppresses the motion of air pollutants and confines them within the urban boundary layer. Moreover, the combined effect of decreased wind and increased humidity in summer and part of the fall make Cairo and its surroundings a possible sink for sand and dust storms blowing from the Western Desert [26].
Asyut and Aswan, both located in Upper Egypt, have sparse data on their air quality but both cities feature a dry, desert climate. Asyut is the driest city in Egypt (Egypt Climate Index http://www.climate-charts.com/Locations/u/UB62393.php), with the greatest diurnal temperature range. Aswan is considered to be an unpolluted arid city with significantly lower air pollutant levels than Cairo [27]. That is mainly due to its low population (around 270,000) and limited industrial and urbanization activities. Aerosol concentrations increase in Asyut during the spring and summer due to Khamsin sand storms blowing from Sahara in the west, and in Aswan during the summer and autumn due to northward extension of Sudan monsoon trough [27]. Hurghada is a coastal city and a tourist resort located on the Red Sea. It is another lightly populated (around 300,000), unpolluted city. Aerosols take mainly the form of dust and sand, carried by high-pressure winds especially in the summer. The WD and ND regions were selected because the former is a major source of sand and dust storms, and the latter represents a sink of those pollutants as well as a source of local pollutants resulting from the dense population activities and seasonal biomass burning in summer and fall. The boundary of the selected WD area is marked in Figure 1.
3. Data Sets and Analysis Methods
Daily MODIS data from NASA’s Aqua satellite were used to examine AOD over the entire country and the selected cities and regions during the 12-year period from 2003 to 2014. Level 2 (10 km resolution) non-gridded MODIS aerosol product at 550 nm wavelength was used because this resolution can capture the spatial gradient of the AOD in urban areas. AOD was calculated using the Collection 6 aerosol product, which combines the dark target (DT) and deep blue (DB) algorithms. The former approach uses seven well-calibrated spectral channels (0.47–2.1 μm) and can be used only over dark targets such as water bodies and dark vegetation [16]. The Deep Blue approach is more sensitive to aerosols over bright surfaces because it employs two blue channels (0.412 and 0.470 μm) for which surface reflectance is typically small enough to infer aerosol properties [19]. Further details of the development of the aerosol retrieval algorithm over land are presented in [12] and discussions on further improvements of the DB algorithm are given in [20]. Selection between DT and DB is based on the climatological normalized differential vegetation index (NDVI), with DP implemented if NDVI < 0.2 and DT implemented if NDVI > 0.3. Because the landscape of Egypt includes both categories (mostly desert with very low NDVI and limited agricultural areas with relatively high NDVI), it is necessary to use the combined algorithm (DT and DB) to ensure a more spatially complete dataset.
Daily MODIS AOD data over the entire country were downloaded (http://ladsweb.nascom.nasa.gov/data/search.html) and gridded to allow calculations of the spatial gradient of AOD in the vicinity of each city. Before gridding, all passes from the same day were combined in one set to facilitate analysis of wider coverage. Evaluation of accuracy of retrieved AOD from MODIS is outside the scope of this study but it has been reported in previous studies to be around ±(0.05 + 0.15τ) over land and ±(0.03 + 0.05τ) over the ocean, where τ is the actual AOD [28,29,30]. According to [20], the error of the AOD using the DP algorithm is estimated to be better than 0.05 + 20%. It should be noted that more accurate spatial distribution of aerosol data, and particularly gradients around local sources, can be obtained using a finer resolution product such as the MODIS 3-km resolution data.
4. Results and Discussion
Statistics of AOD over the entire country and each one of the selected sites are presented in terms of background AOD and severe air pollution episodes (SAPE) AOD. Background AOD data includes all points in the daily record that fall below the average AOD plus one standard deviation; i.e., have where and are the average and the standard deviation, respectively. SAPE include all occurrences with [31]. Background AOD represents the normal level triggered by local emissions (e.g., anthropogenic activities throughout the year) or by aerosols transported from other regions. On the other hand, SAPEs are major aerosols events that may originate either from a distant source (e.g., dust storms originating in a bordering desert west of Egypt) or a local emission event. The thresholds of AOD that define SAPE in each selected area are included in Table 2.
4.1. Spatial and Temporal Aerosol Variations over Egypt
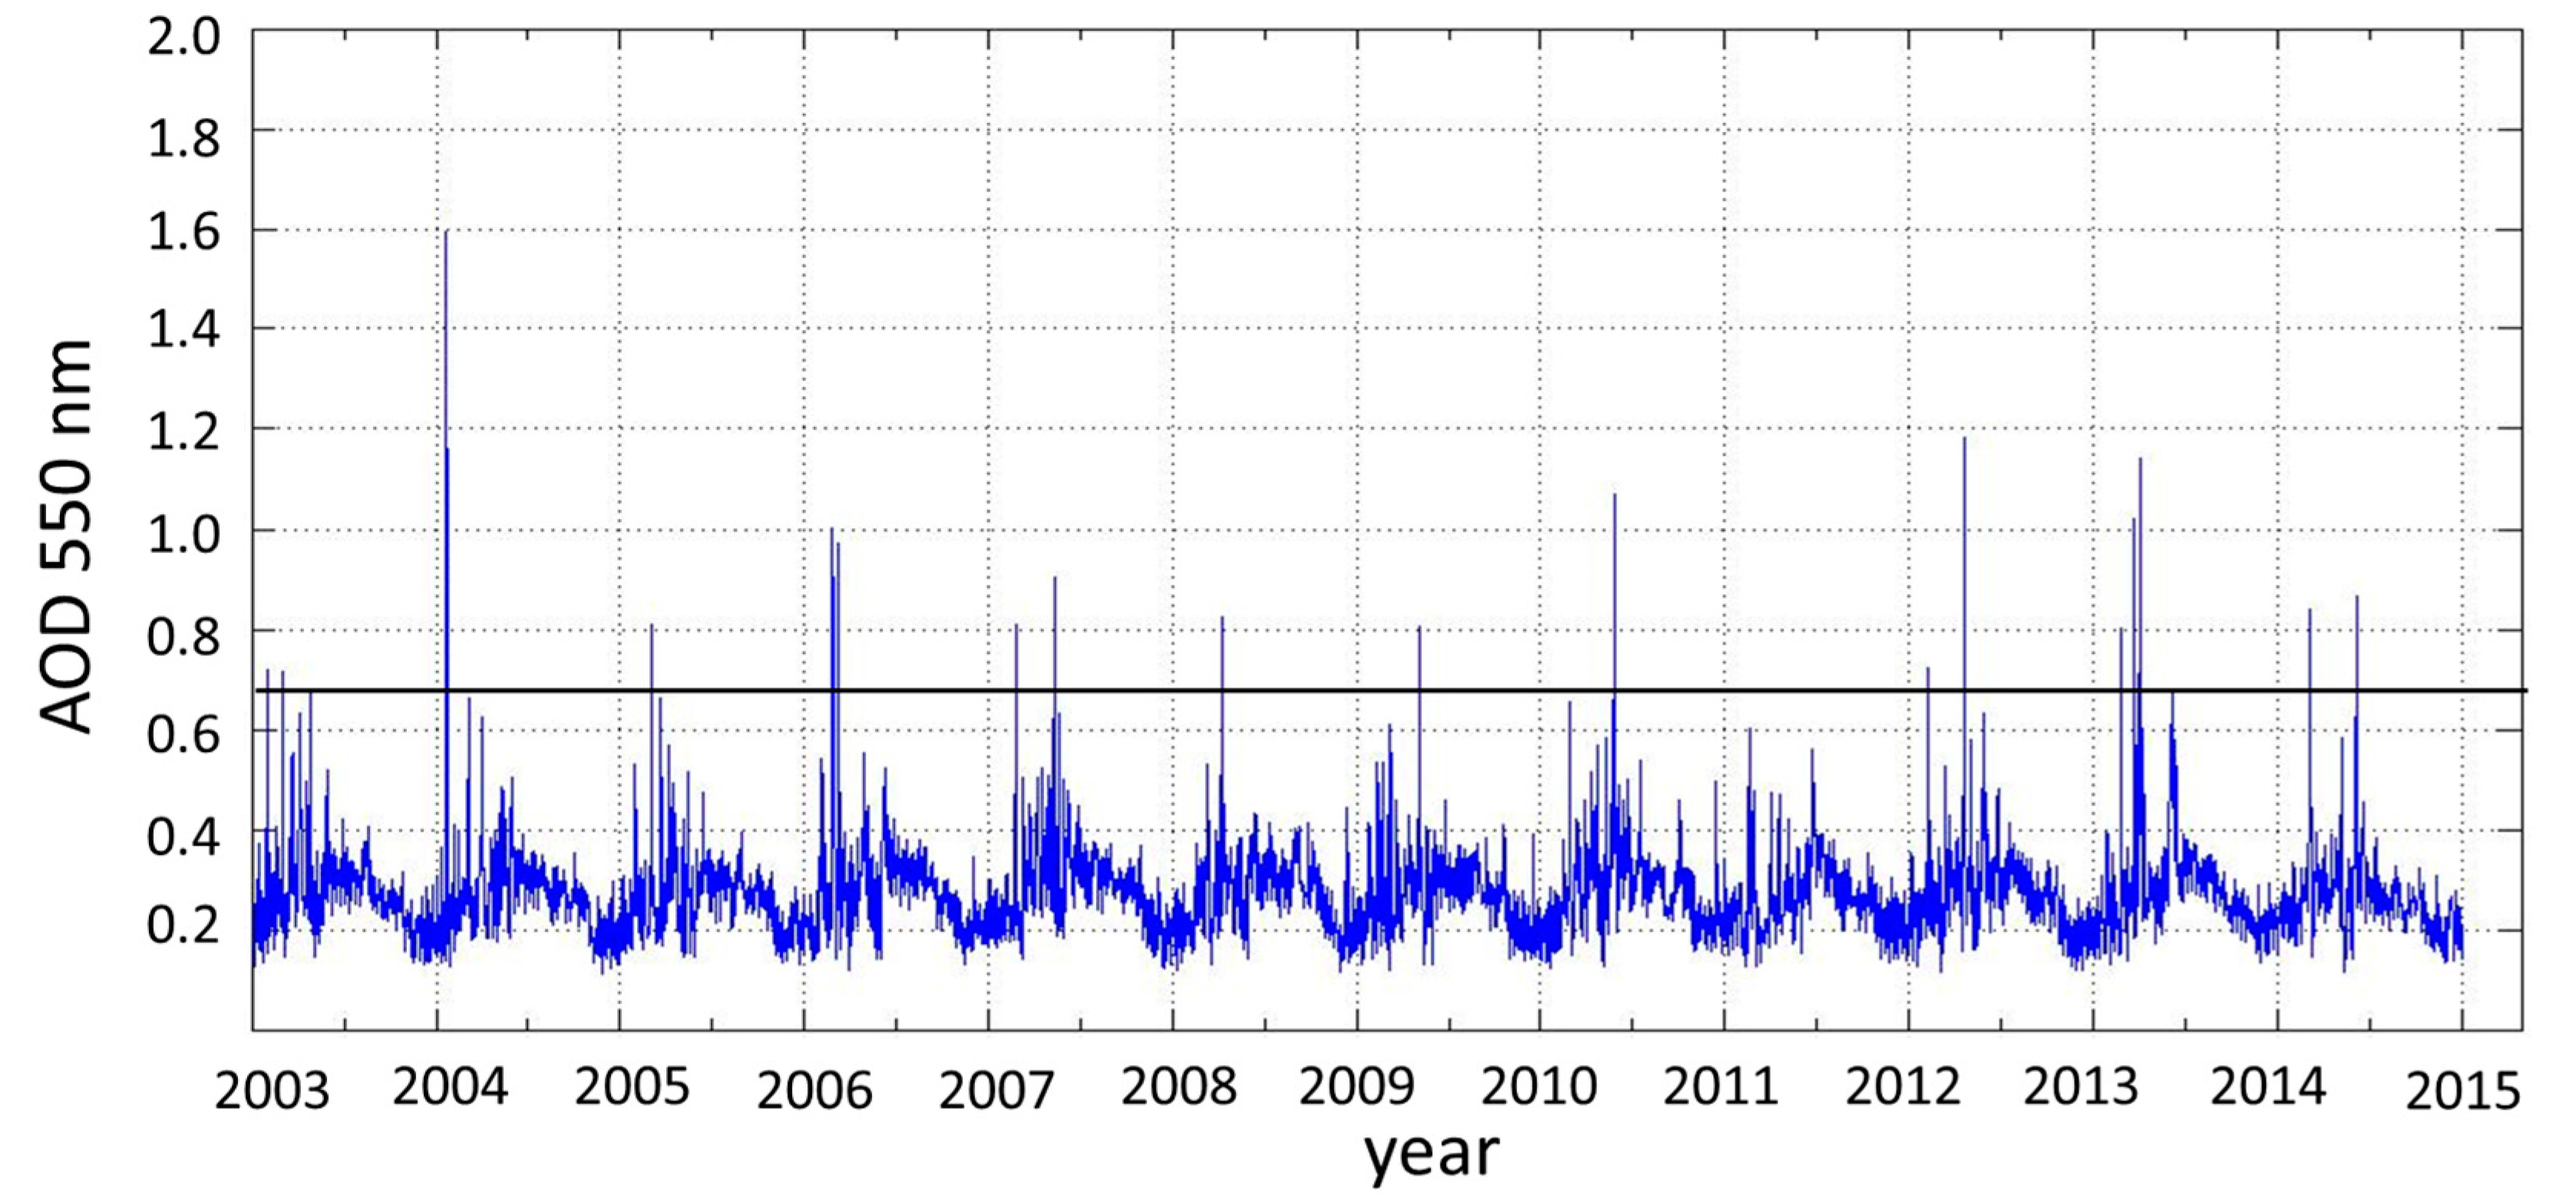
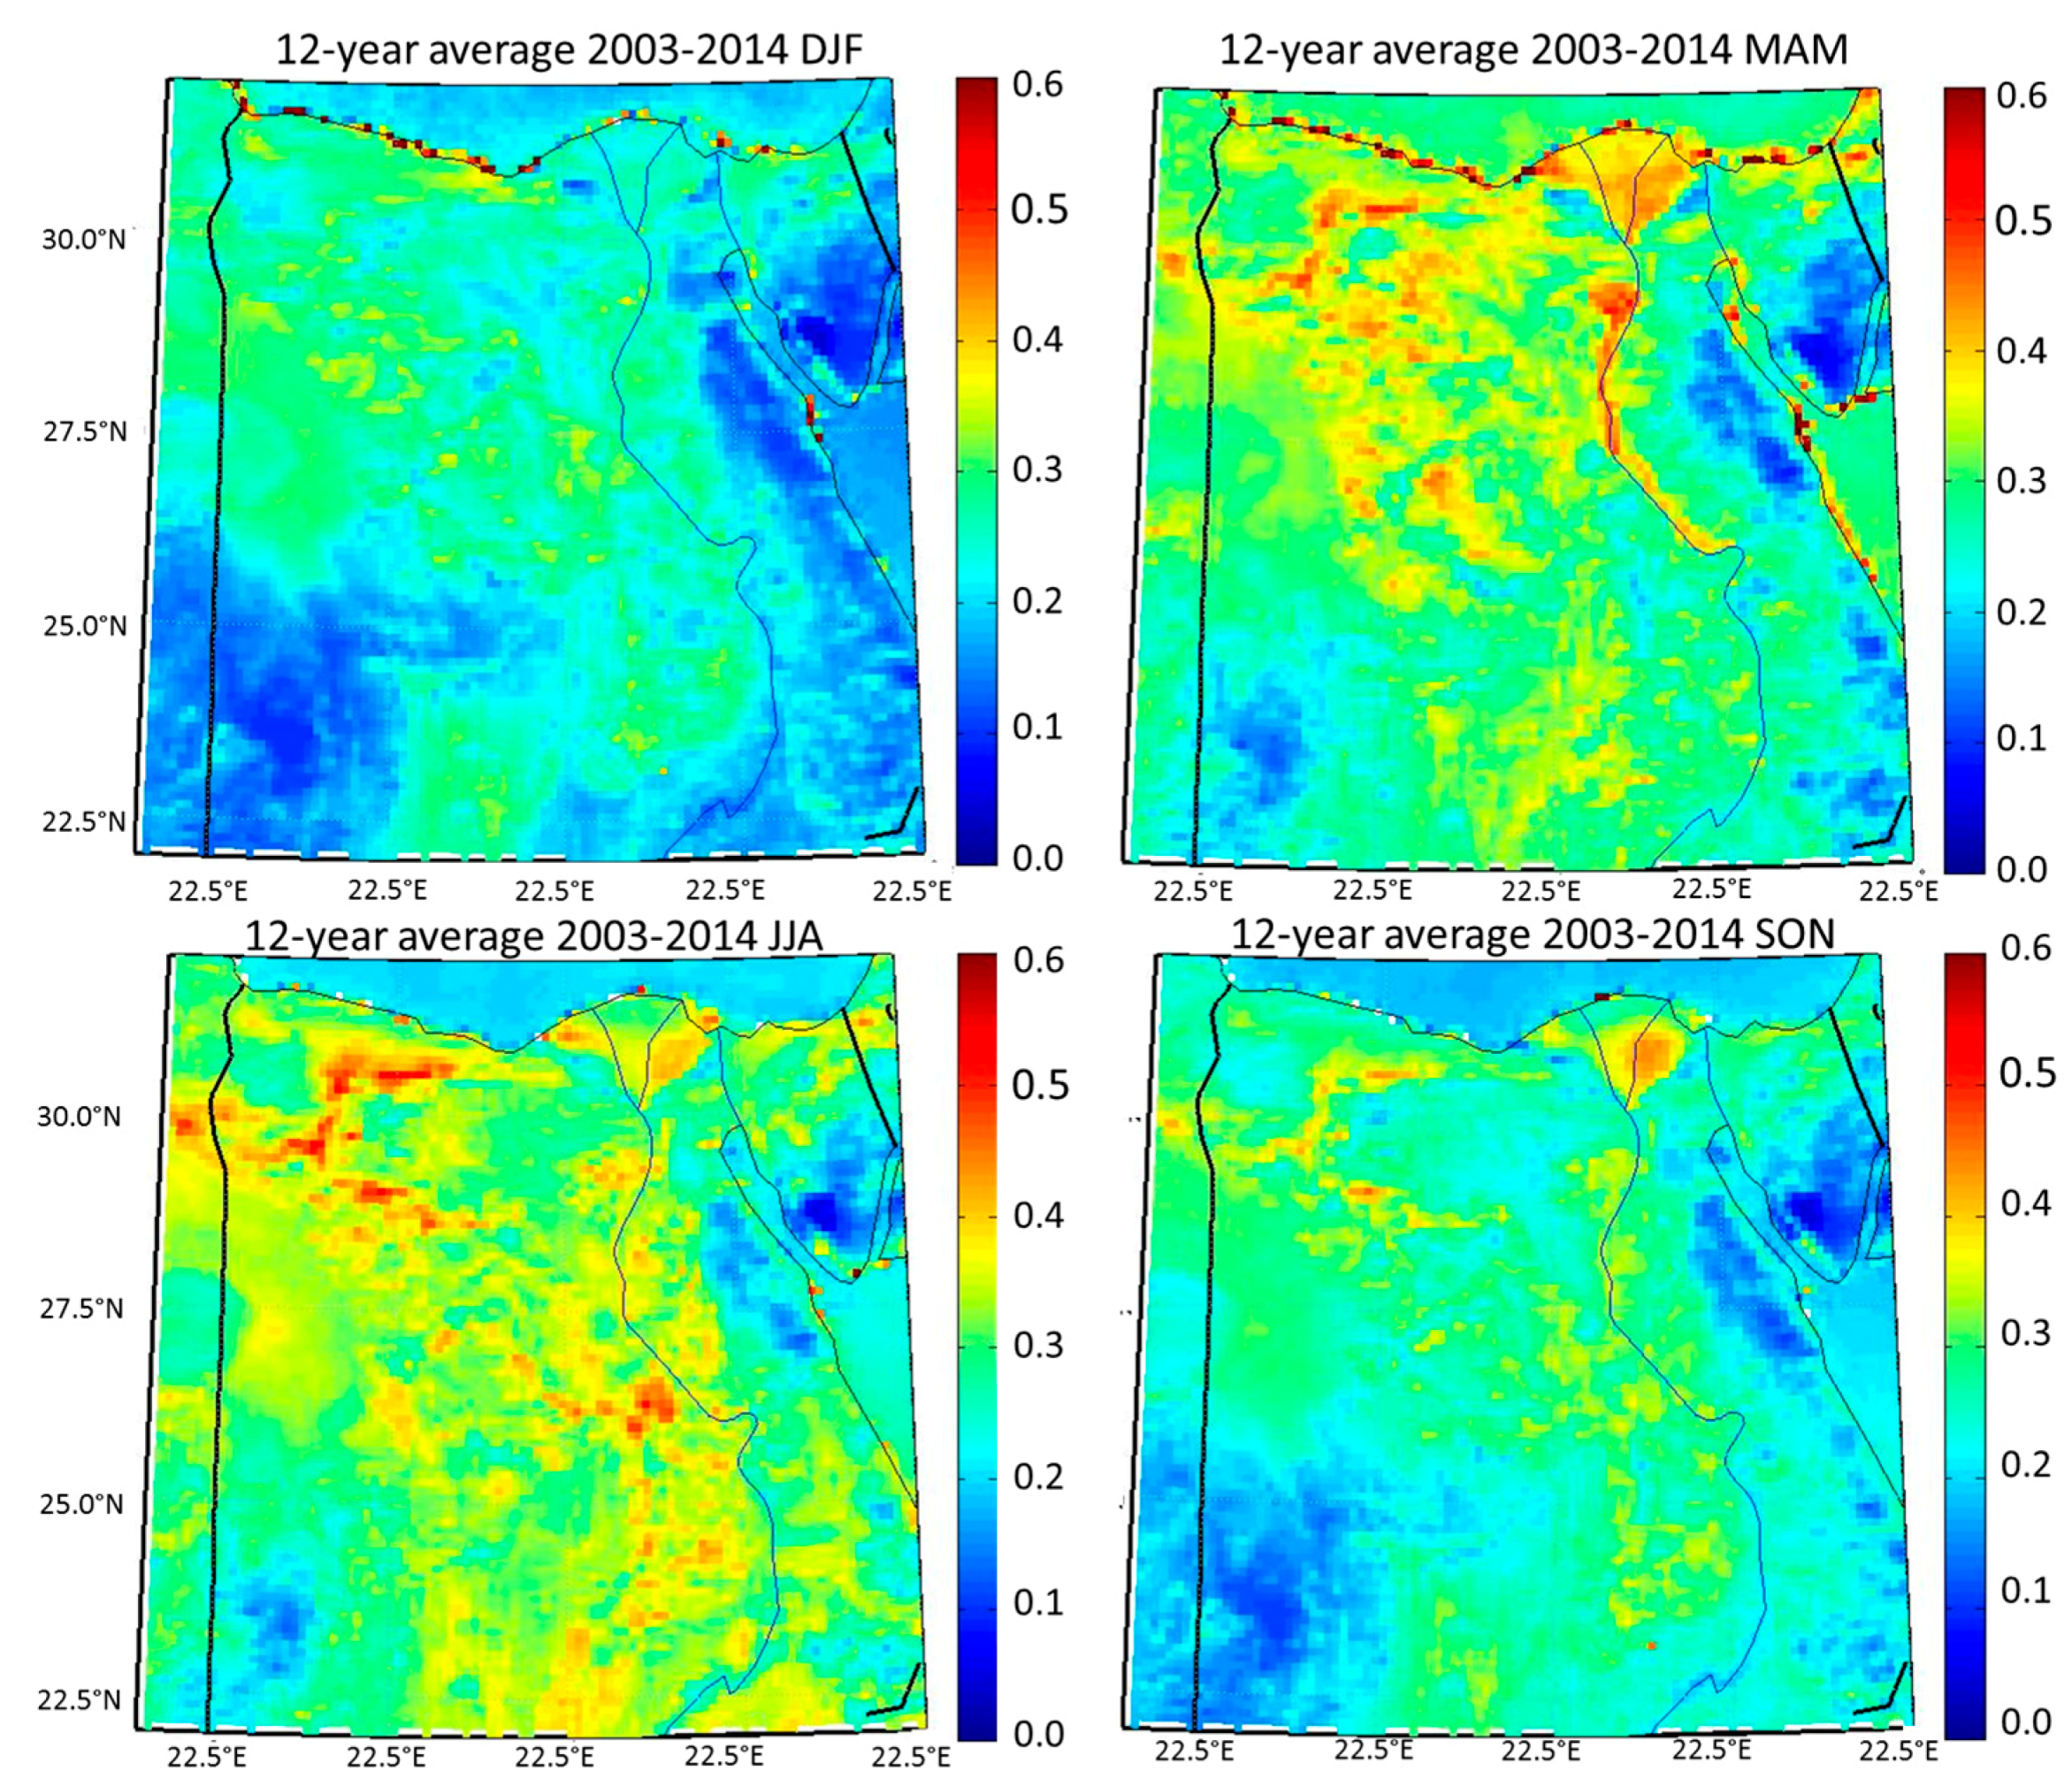
Daily evolution of AOD within the geographic boundaries of Egypt for the 12 years is shown in Figure 2. It reveals recurring SAPEs with high AOD (≥0.64) typically occurring in winter or early spring. The chronology of those events is presented in Table 3. Each event usually lasts one day though it occasionally extends over two to three days. Figure 3 shows the seasonal average of AOD from the 12-year data. The seasonal cycle includes a peak in the spring and early summer with values between 0.4 and 0.5, and a minimum in early winter with values less than 0.35. In the WD region, seasonal maxima are triggered by dust storms, with similar seasonal values noted in previous studies [6,9,10,31]. It is interesting to note the “patches” of high AOD during JJA in the WD region appear in same locations in the spring and summer seasons, suggesting that this region is providing a dust source throughout most of the year.
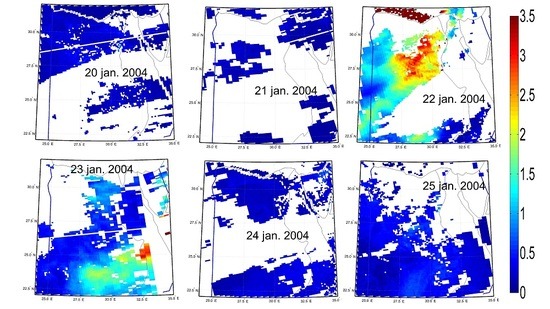
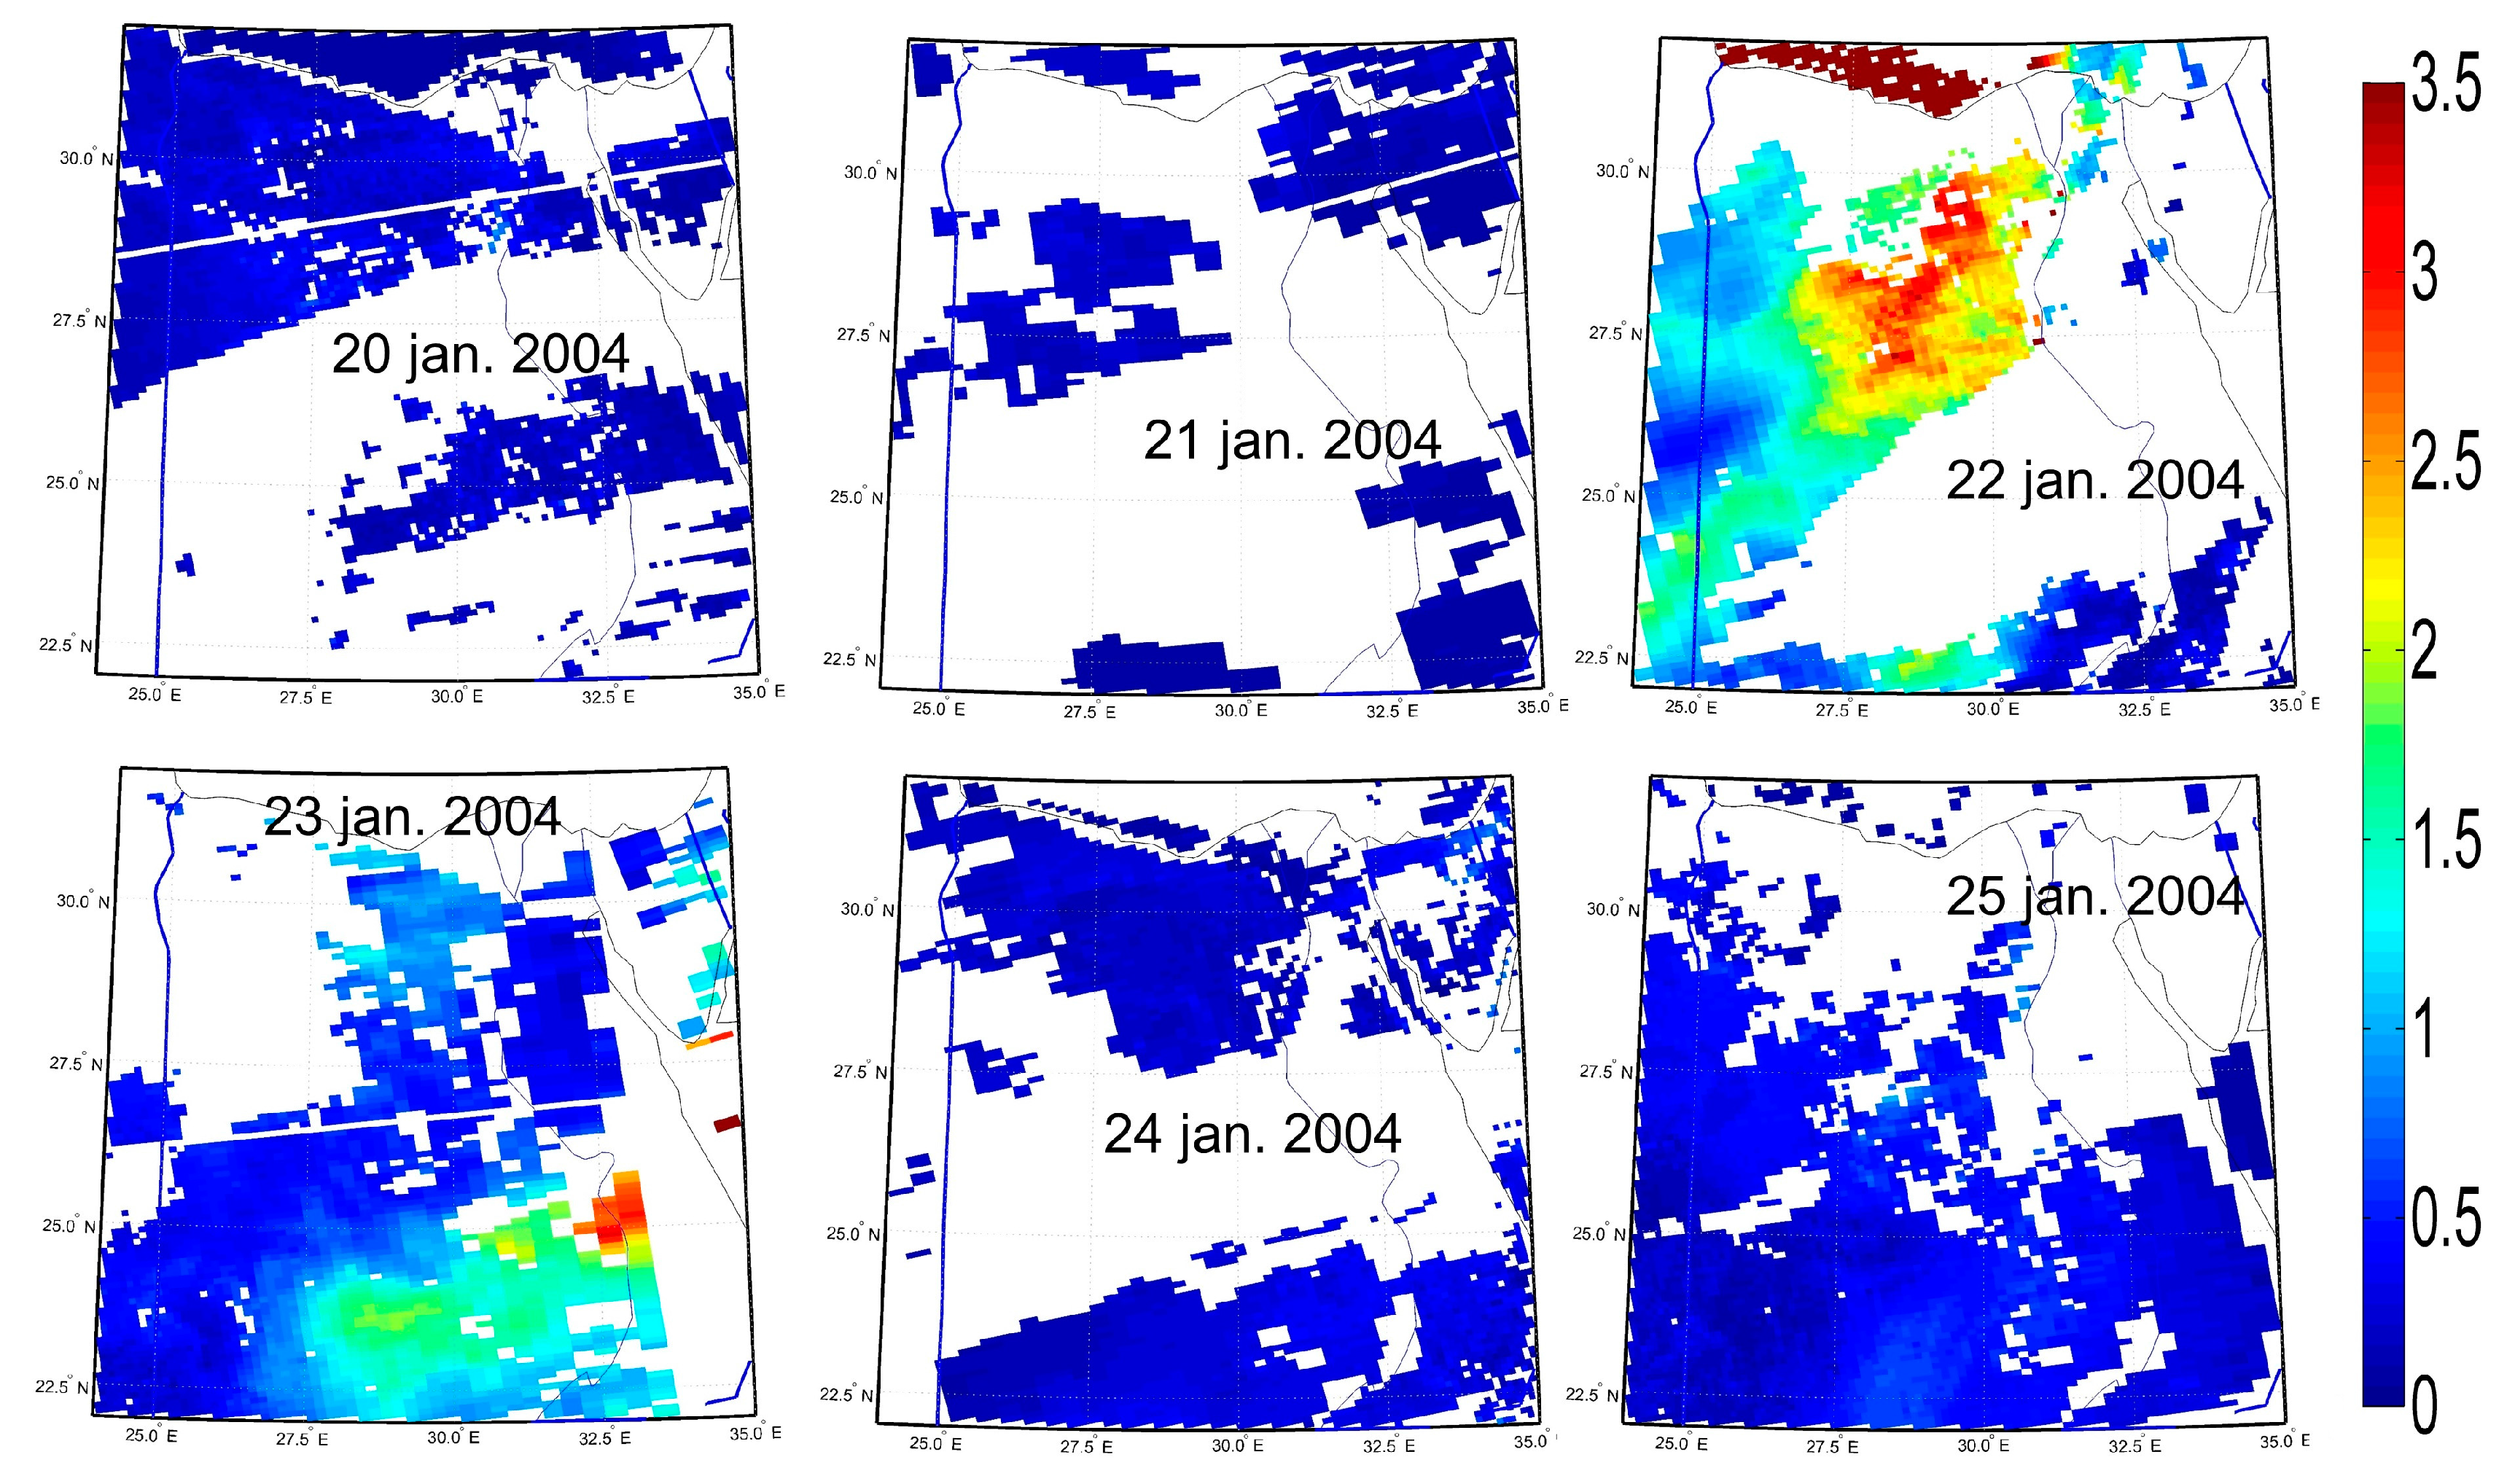
Figure 3 confirms the distribution of high AOD values in the WD region compared to the eastern desert. This is caused by repeated events of sand and dust storms in the former region. An example of this type of events is shown in the spatial maps of AOD in Figure 4 for 20–25 January 2004, which include the highest observed SAPE over the period of investigation. Some maps are combinations of two orbits acquired at different times on the same day. The area of high AOD on 22 January 2004 extends over parts of the WD that include El-Bahariyah and the El-Farafra Oasis (Figure 1). More southern areas are affected by dust on 23 January although the severe event has visibly subsided before its termination on 24 January. It is worth noting the extremely high AOD (~3.5) over the coast of the Mediterranean on 22 January, which is discernible by the coastline. The accuracy of these data is unclear and may be a function of unresolved output pixels from the DT algorithm over ocean and the DB algorithm over land. Therefore, these data (over the Mediterranean just north of the northern coast of Egypt) were not included in the AOD statistics.
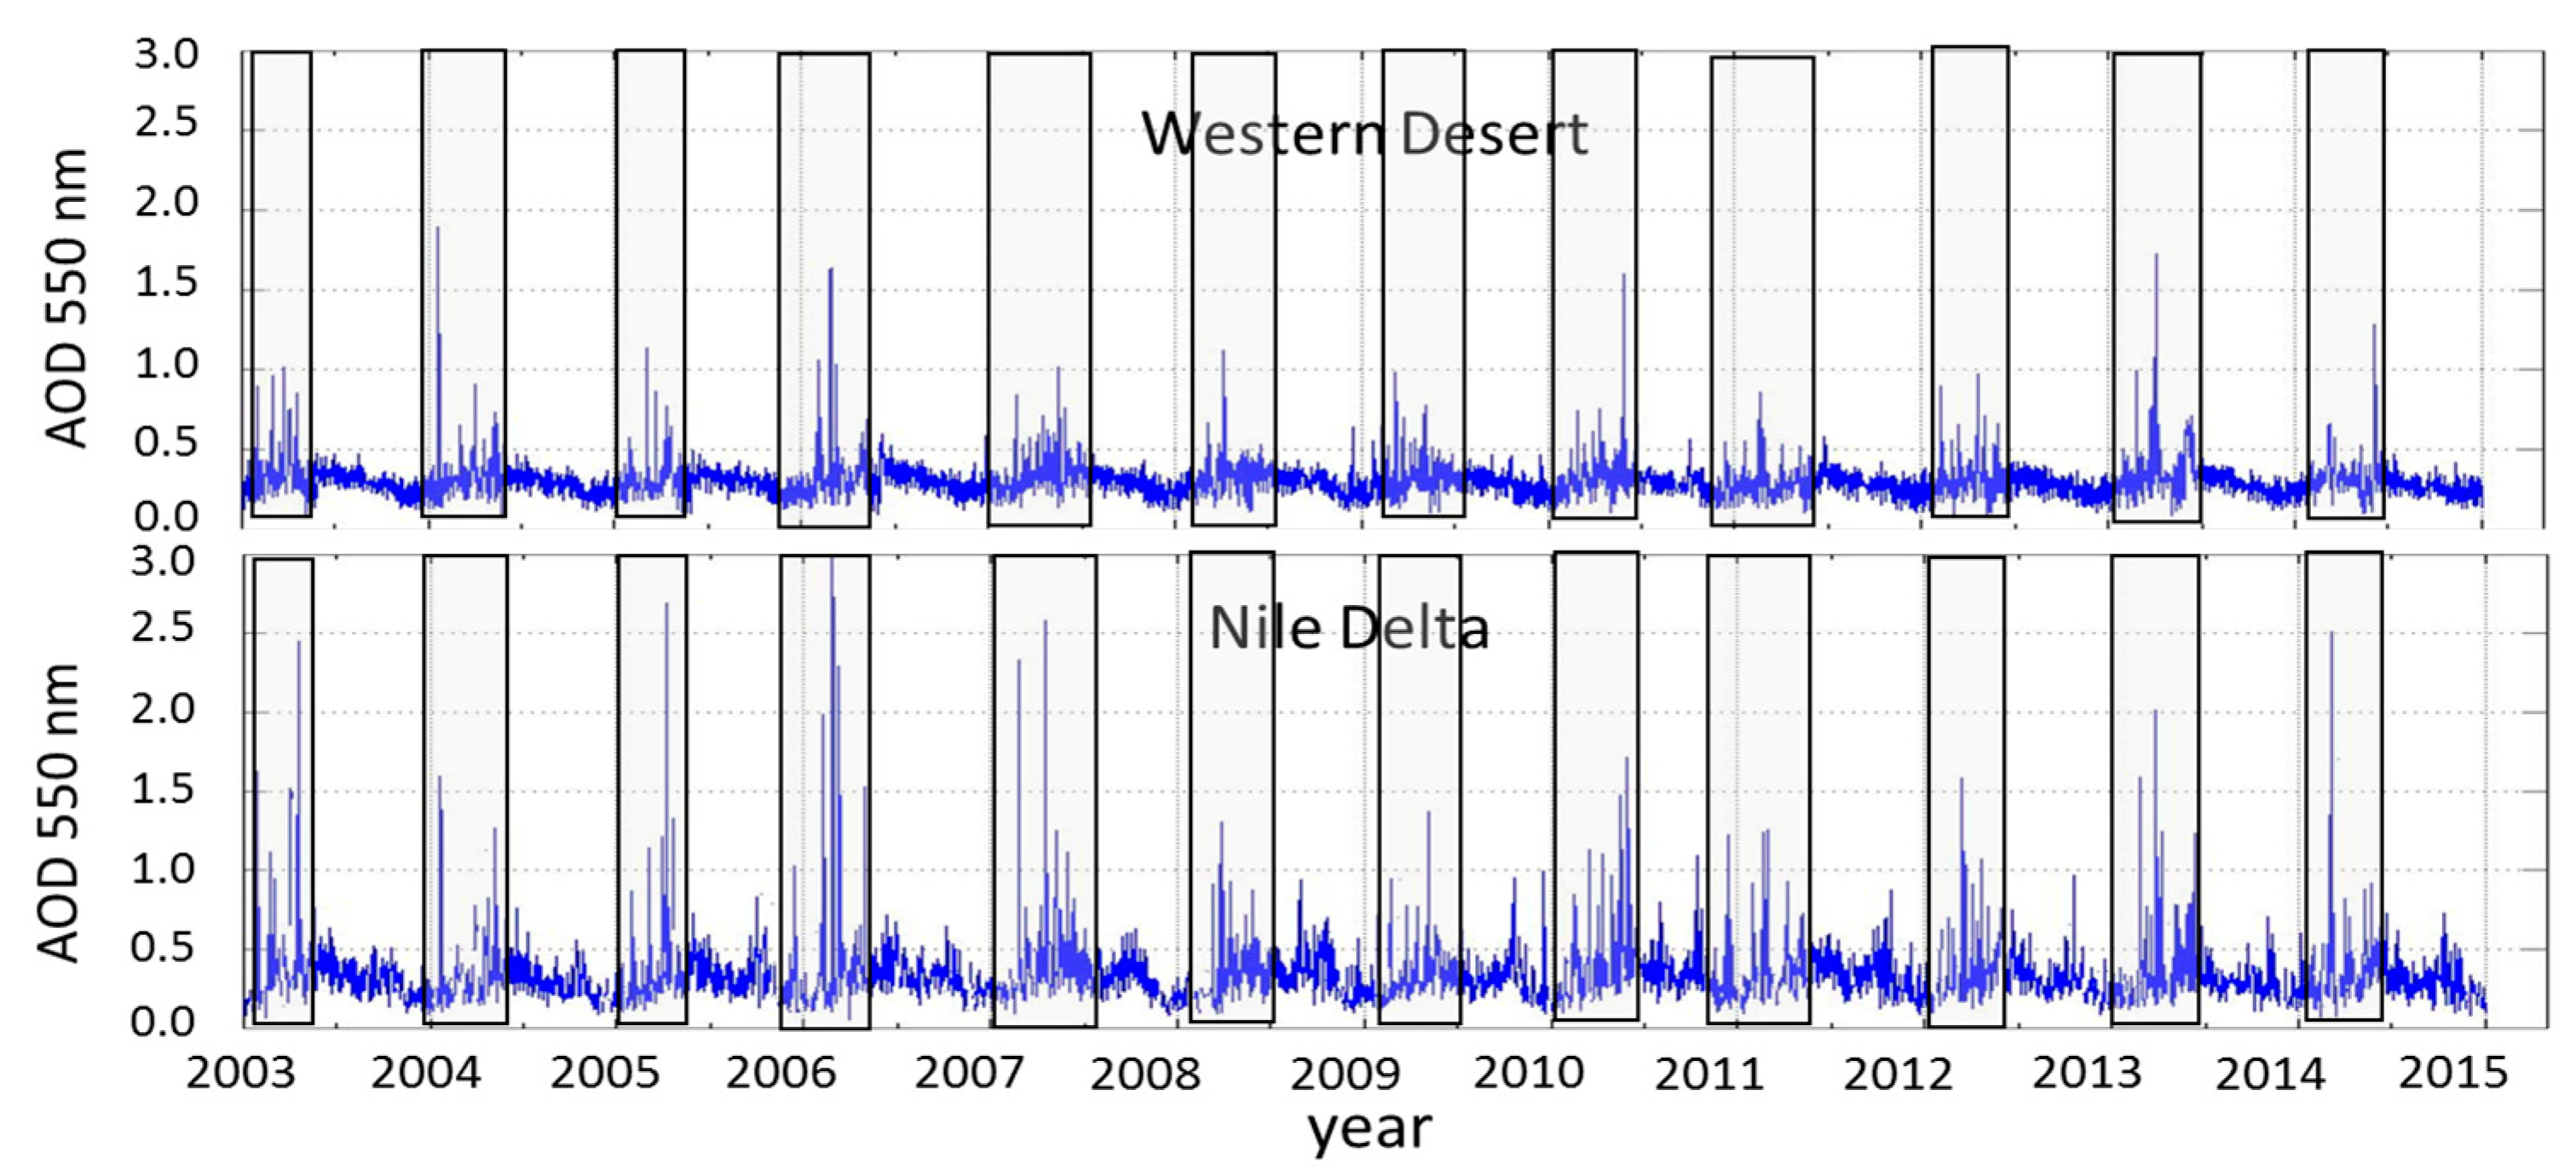
Prior studies have identified the WD region as a secondary source of dust in North Africa, with the primary Saharan source in northwest Africa [32]. In [33], the authors used NOAA’s HYSPLIT back trajectory model to examine the pathway of a similar event occurring in the fall of 2008, and confirmed that long range eastward transport of dust aerosols (at altitude 2.5–6 km) from the Western Sahara potentially affects the ND region. This can be confirmed by visually examining the two time-series of AOD over the WD and ND region (Figure 5). Coincident events of high AOD between the two regions are almost always observed in the first few months of the year (shaded areas). It is interesting to note in these cases that the AOD from the ND region is always higher than the WD region (delineated in Figure 1). The southwesterly wind carries most dust by the time it reaches the ND. There are a few high AOD events observed in the ND region with no parallel in the WD, which could be attributed to anthropogenic aerosol sources from urban activities and biomass burning in the ND region [8,10]. For the AOD in the ND region is generally higher and more erratic than the ND region. The relationship between ND and WD is further discussed in Section 4.2.5.
4.2. Aerosol Parameters over the Selected Sites
4.2.1. Time Series of AOD
Time series of AOD over the selected cities were calculated using five domains centered at the city’s core. The domains are squares with dimensions 20, 50, 100, 150, and 200 km (Figure 6). Tracking the AOD calculated from successive domains helps us to decide whether the source of the aerosols is local or not. Data from successive domains are also used to estimate the spatial gradients of AOD in each of the four cardinal directions away from the center of the city (Section 4.2.3).
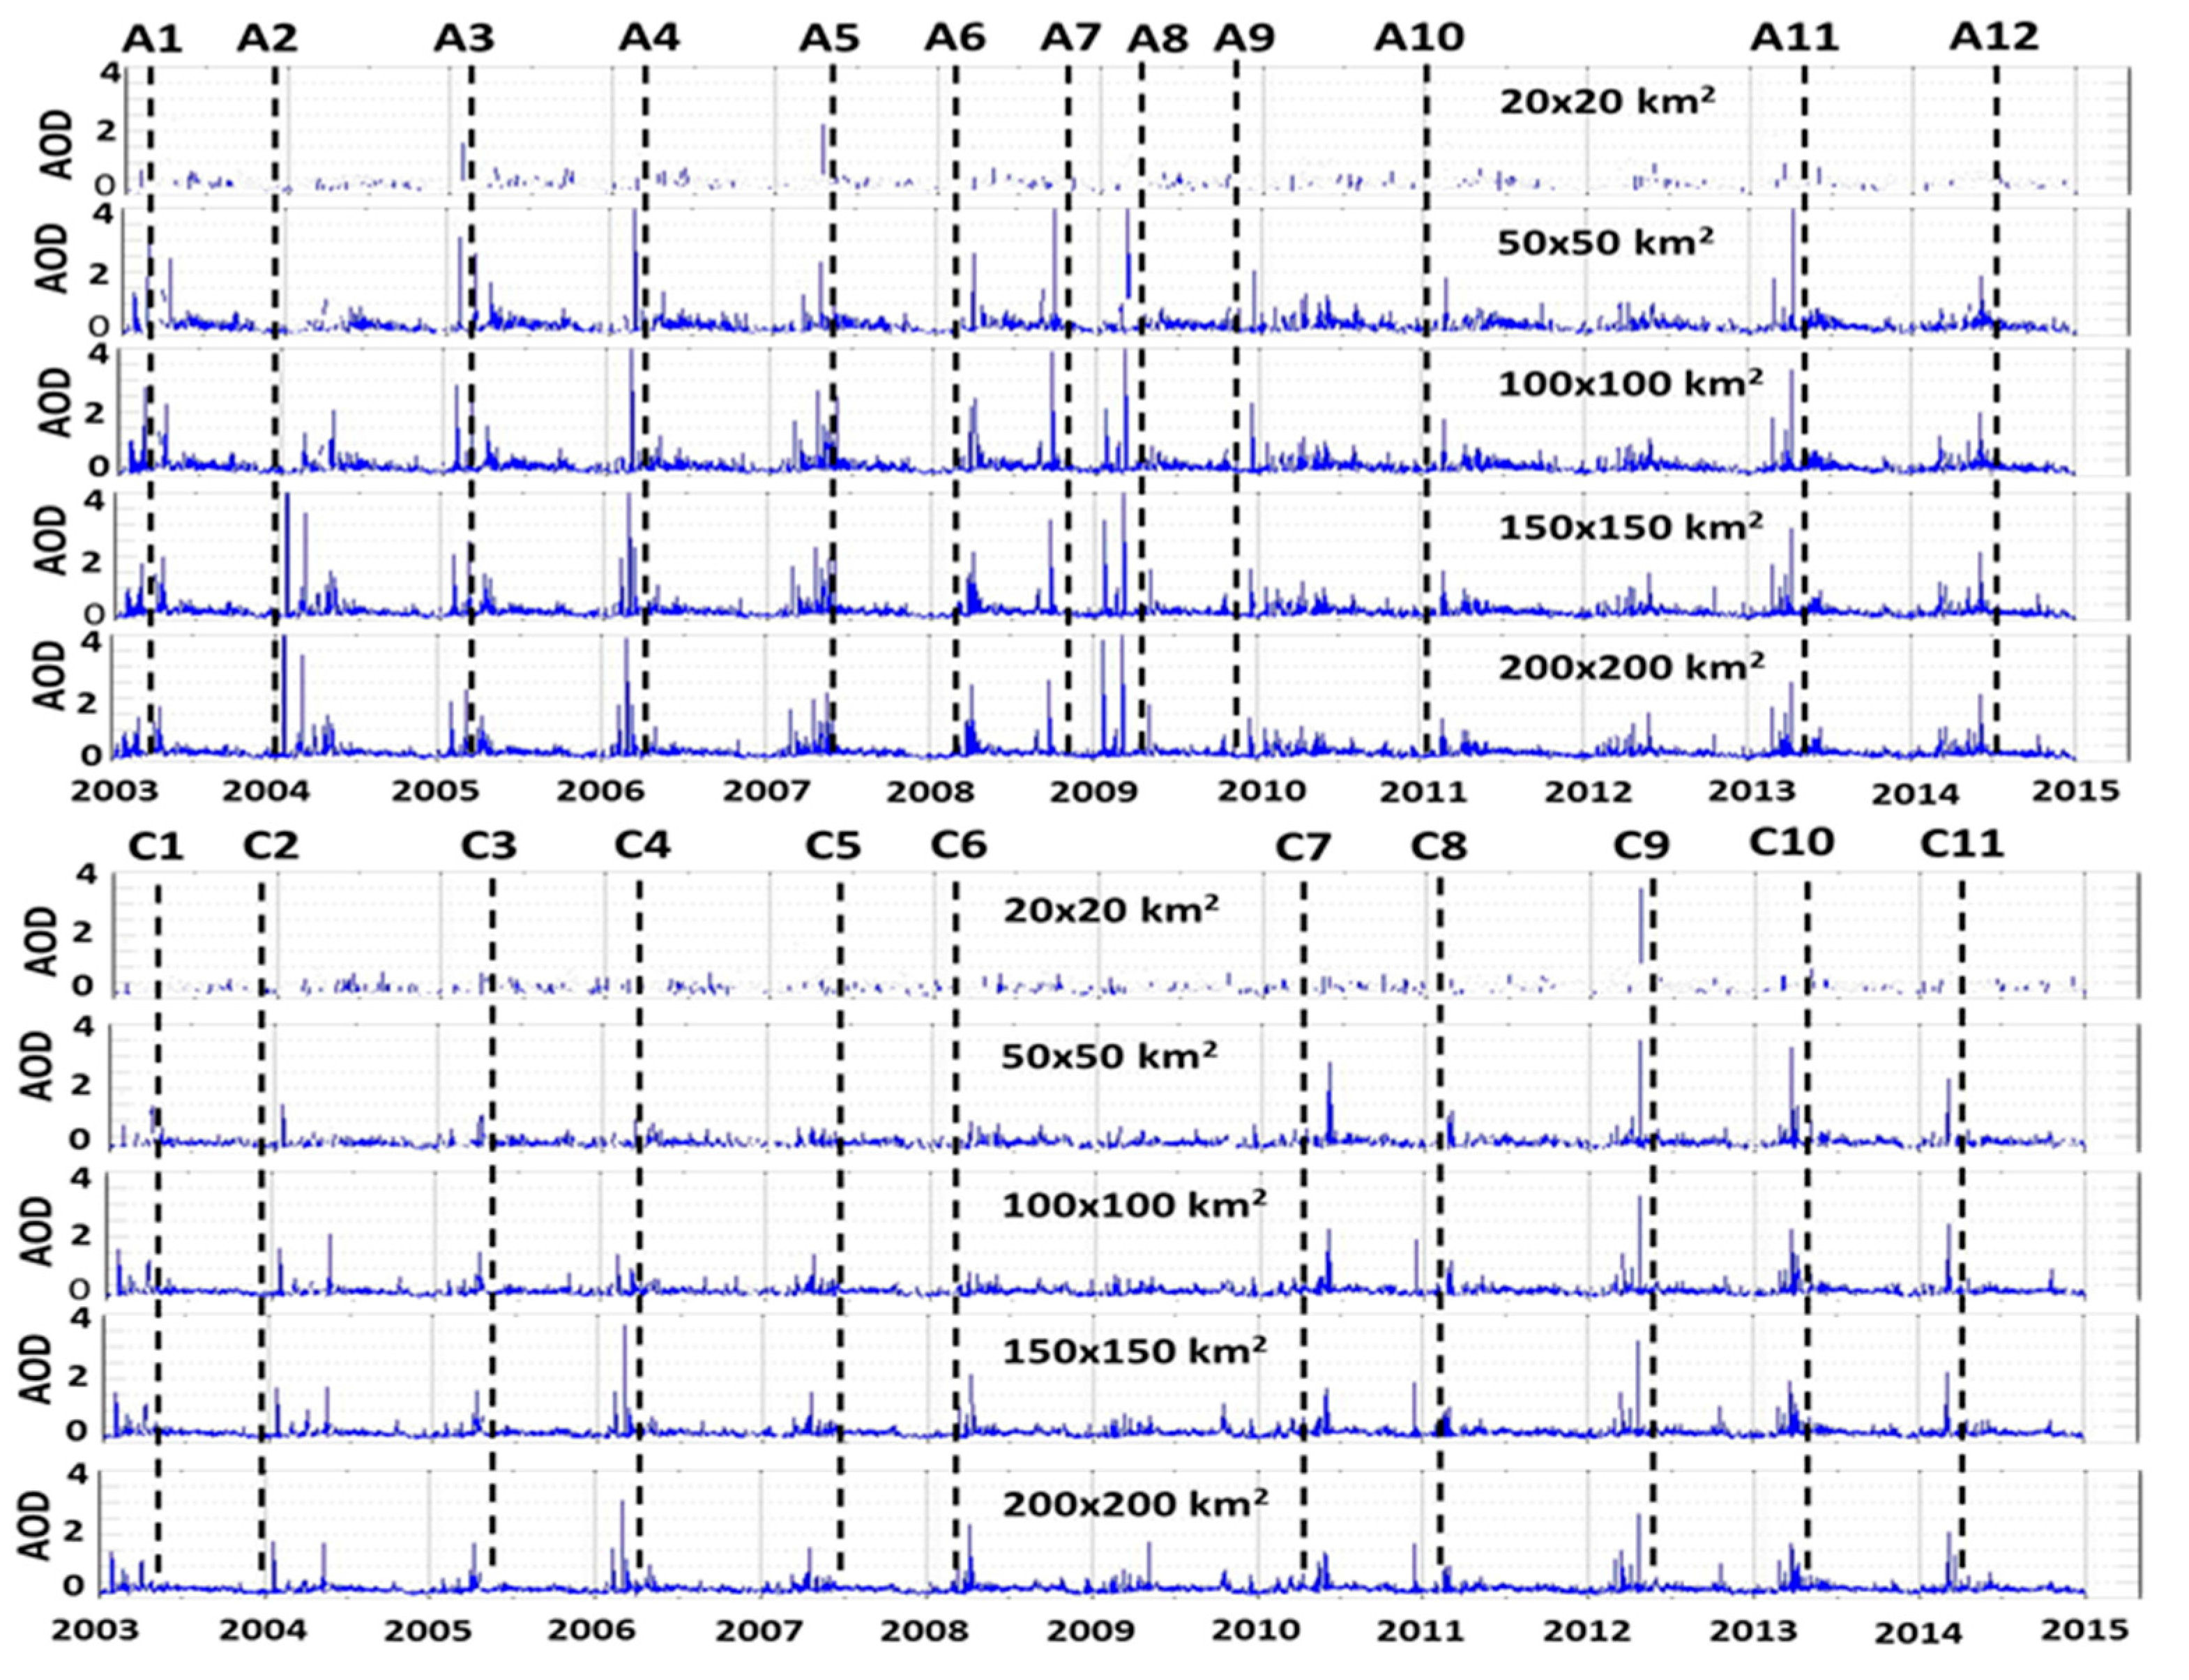
Daily time series of AOD from the five domains centered at Alexandria and Cairo are presented in Figure 7. Selected dates of severe events (SAPEs) are marked in the figure (A1 to A11 for Alexandria and C1 to C11 for Cairo). Since the 20 × 20 km2 domain has maximum of four points from the 10 km grid data, more missing data are found time series of this domain. It should be noted that the AOD average is calculated if three or four pixels of valid AOD values are available.
The coastal location of Alexandria results in roughly half of the pixels within each of the examined domain being located in the Mediterranean Sea. This should be taken into consideration when interpreting the temporal record. In general, Egypt is influenced by the regional-scale trade wind, which is particularly active during the summer, resulting in a dominant northerly or northwesterly wind [9,34]. The wind stimulates long-range transport of aerosols from southeastern Europe, crossing the Mediterranean and reaching the coastal areas in the north (including Alexandria). It also transports a significant amount of sea salt to the northern coast. There are greater peaks of AOD in Alexandria as compared to Cairo. Both are industrial cities but Alexandria has larger industrial site (see Section 2) and Cairo has more population and transportation activities. Note that in the Alexandria graph a few peaks exceed the upper limit of the AOD scale.
Figure 7 shows that some of SAPEs in the two cities occur concurrently (e.g., the first pairs A1/C1, … A6/C6, and A11/C10). These coincident events suggest that their source is the same, most likely being dust transported from the WD. It is apparent that the severe events over Alexandria are associated with a higher AOD than Cairo. Data from the 20 × 20 km2 domain are less in number because of the small domain. Time series of AOD from the five successive domains can be used to narrow down the location of the aerosol source. For example, the event A3 appears with higher AOD in the 50 × 50 km2 domain and the magnitude decreases within the successively larger domains, suggesting that the source is local. The same applies to event A6 and A10. On the other hand, events A2 and C4 show higher AOD in the larger domain around Alexandria with noticeably lower values closer to the core of the city, suggesting that the source is more likely external. A2/C2 is the event that occurred on 22–23 January 2004, shown in the AOD map (Figure 4). The external source of aerosols in the case of Alexandria can be sea salt, carried by the northerly wind, or dust originating from the WD region and carried out by a southwesterly wind in the winter (http://www.windfinder.com/windstatistics/alexandria). Some events such as A8 and to some extent C9 show high AOD values over all the domains, suggesting that this represents a spatially extensive aerosol episode.
Time series of AOD averaged over the 50 × 50 km2 domain centered at Asyut, Hurghada, and Aswan is presented in Figure 8. Unlike Cairo and Alexandria, these cities do not show much variation of AOD measured from the successively increased domain around the city’s core. Therefore, data from one domain only is shown. Qualitatively speaking, SAPEs from the three cities are not coincident (i.e., peaks appear on different days), except for the few events observed in the spring and summer of 2010 and 2013. The peak AOD during the SAPE in 2013 in Asyut is 3.8. The SAPE observed in Aswan in January 2004 originated from the dust storm shown in Figure 4 (visible in the map of 23 January 2004). Both Hurghada and Aswan feature relatively clean air.
4.2.2. Seasonal Average Maps
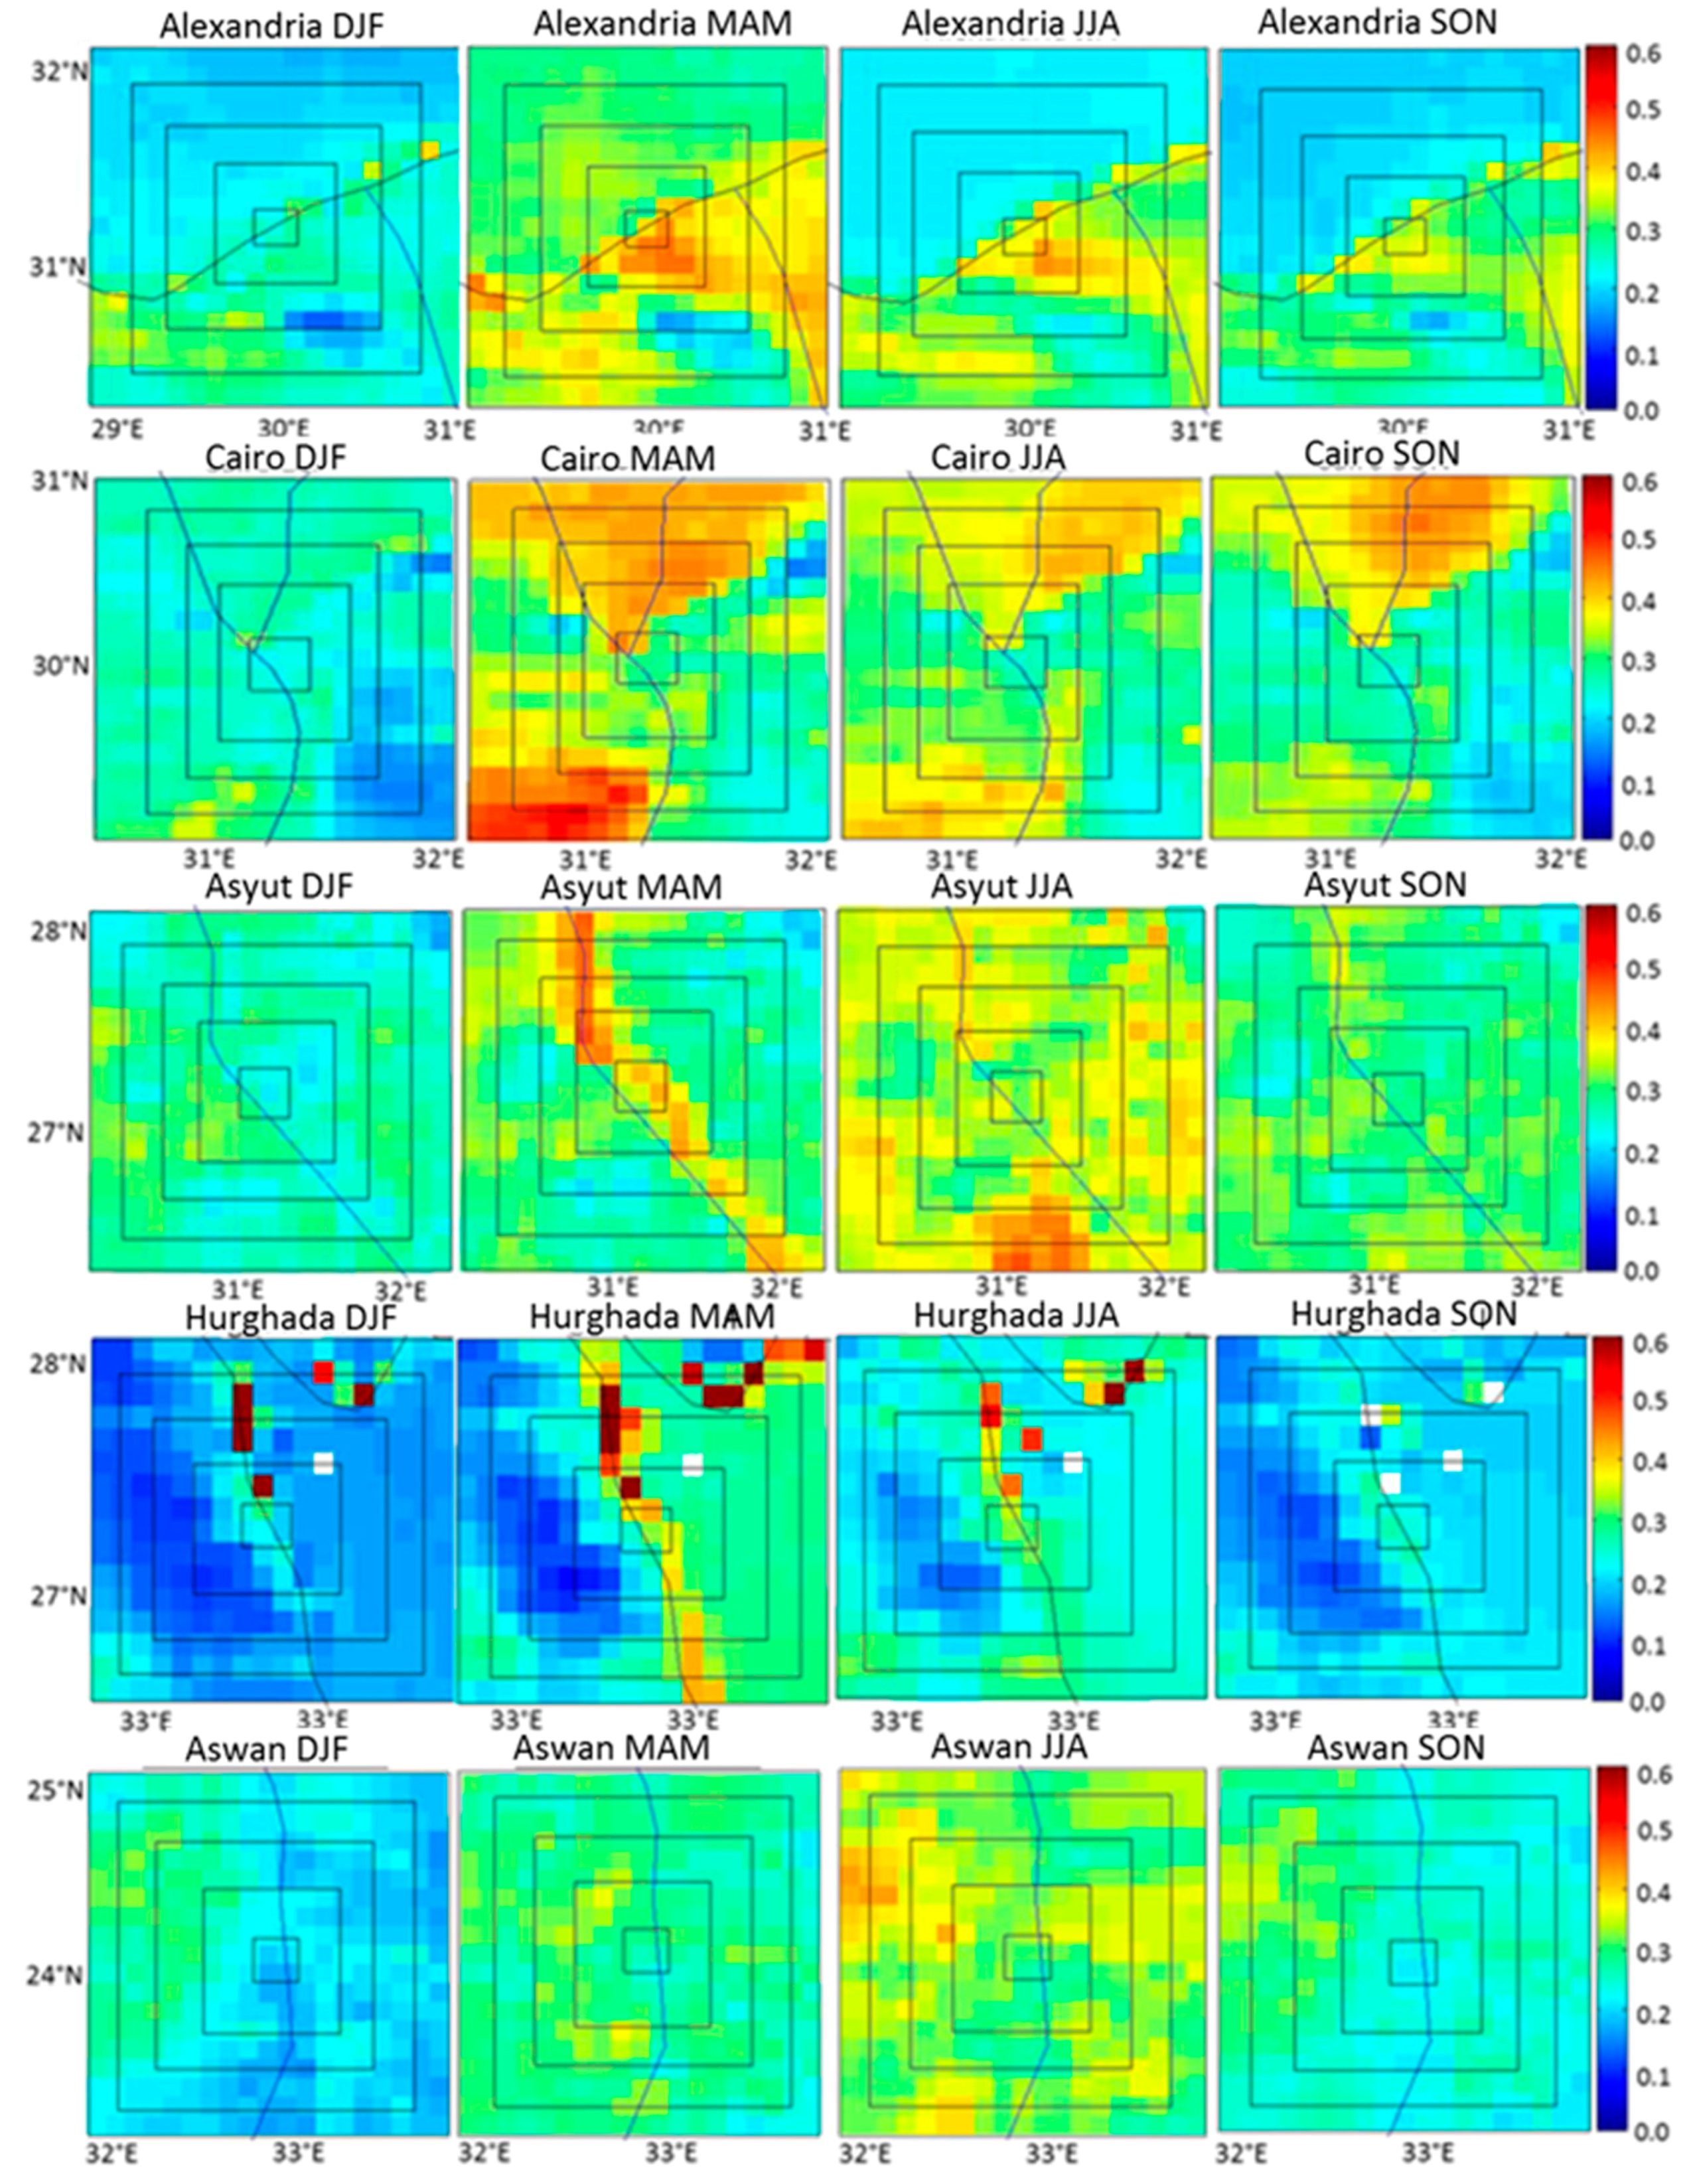
Seasonal maps of AOD, averaged over the 12-year period, are shown in Figure 9 for each city with the boundaries of the five domains in each map. Data reveal climatological features of AOD around each city. The map for Cairo covers a large part of the ND region. In general, highest AOD is found in spring and summer while the lowest exists in winter. This is consistent with the map of seasonal average AOD over the entire country (Figure 2).
The seasonal AOD maps over Alexandria exhibit relatively low values during fall and winter, which moderately exceed the values over the Mediterranean Sea. In contrast, spring and summer feature higher AOD with sharper contrast against the noticeably lower values over the sea. In the spring and summer significantly higher ground traffic is experienced, which potentially allows for the continuous formation of anthropogenically derived PM over the city. This, combined with higher atmospheric moisture, provides favorable conditions for aerosol growth [9]. Moreover, it is known that humidity ultimately leads to an increase in aerosol scattering and consequently a comparable increase in the AOD [35]. Alexandria is downwind from European pollution and Mediterranean natural aerosol sources (e.g., sea salt). Long-range transport of these aerosols is more likely during spring and summer due to enhanced northerly, regional-scale trade winds, photochemical activities, and the absence of precipitation. The time scale of the transport of air masses from east Europe to the north coast of Egypt is approximately 2–3 days [36]. It should also be noted that the northerly Etesians summer wind, which blows from the Aegean Sea and reaches the north coast of Egypt with variable frequency in periods of 3–5 days at constant and nominal speed around 30 km/h, causes more wave-breaking activity along the coastline, which supplies sea salt aerosols.
On the other hand, the rainy winter season over Alexandria, along with the noticeably less traffic volume contributes to the markedly lower AOD as shown in the map. The reasonable transition of AOD between land and sea in winter is a proof of the functionality of the combined DT and DB aerosol retrieval approach (see Section 3). Another worthy observation from the seasonal AOD maps for Alexandria is the seasonally persistent low-AOD area located to the southeast of the city (at approximately 30.2°E and 31.5°N). This area marks the location of Sadat City, an industrial and agriculture community established in 1976 west of the Nile Delta and surrounded by 30,000 acres of greenbelt. The World Health Organization has ranked it as one of the top 10 environmentally clean communities in the Middle East [37].
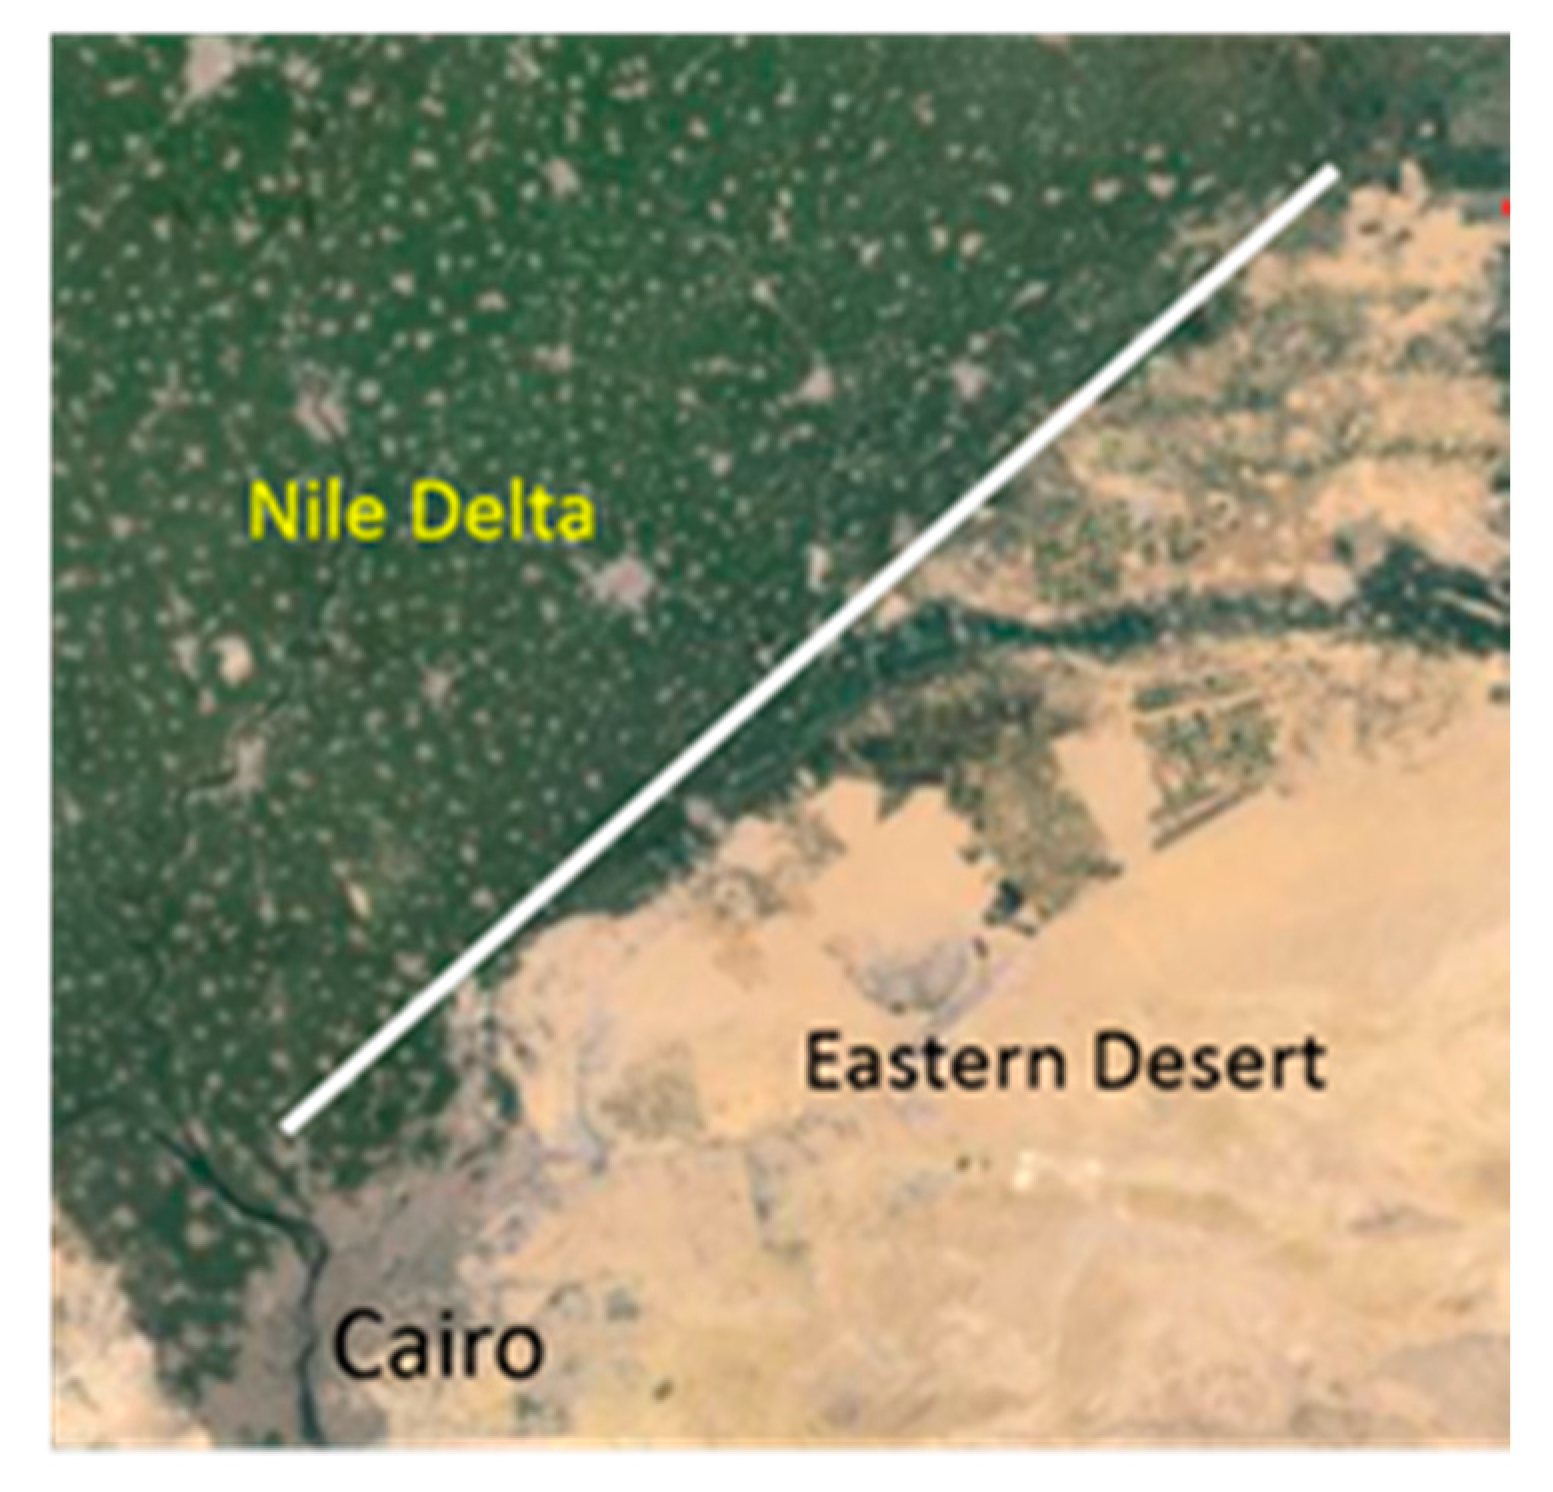
With the exception of winter, Cairo and the neighboring ND area show similar AOD magnitudes throughout the year (Figure 9). In all seasons except winter, there is a visible boundary running southwest to northeast, separating high and low AOD regimes between the extension of the Nile Delta and the Eastern desert. The stark contrast between these two land cover areas at the boundary are shown in Figure 10, representing the agriculture landscape of the ND to the north and the eastern desert to the south. Additionally, in the spring and summer, there is an increase in AOD in the southwest corner of the maps, reflecting impacts of human activities in the urban and agriculture area of the Fayum Oasis, with its population of nearly 350,000. Low AOD to the southeast of Cairo represents part of the Eastern Desert. We note that the averaged AOD within the core area of Cairo does not reveal the high AOD values in October as reported in previous studies and hypothesized to be triggered by the locally-known phenomenon of “black cloud” [9,10,25,38]. The black cloud consists of smoke and dark haze from burning rice straw at an estimated few hundred locations within the Nile Delta and transported southward by wind. It usually envelops Cairo and surrounding areas for an estimated number of hours between 20 and 150 during October and November (http://www.irinnews.org/Report.aspx?ReportId=80831). This phenomenon is not present in the seasonal average for Cairo (Figure 9), perhaps because it does not persist for long periods of time.
Asyut is the driest city in Egypt, with virtually no rain all year round. The dominant wind over the city is northwest, with magnitudes ranging between 7 and 16 km/h (Egyptian Meteorological Authority, personal communication). In the spring a dry, hot wind, known as Khamsin, brings dust from the WD. Prior studies have investigated the quantity, chemical properties and mineralogical composition of the deposited dust from this wind over Asyut [39]. However, the spring seasonal average AOD does not show a broader regional response to the dust-loaded wind (Figure 9). In summer, a broader regional source is evident. It is interesting to note the high AOD along the River Nile in the Asyut MAM tile, which spreads across 2–3 pixels to the side of the Nile line. This represents 20–30 km on the ground, which coincides with the width of the agriculture and population area along the Nile in this region. Therefore, the source of the high AOD is the local human activities, similar to the situation over the ND in the same spring season (see Cairo MAM).
Hurghada has the lowest AOD level among the five examined cities (typically below 0.3) with slightly higher values in the summer and fall seasons. Extremely high AOD pixels (>0.8) are visible along the coastline of the Red Sea in the winter and spring. These anomalies could be explained as unresolved output pixels from the combined Dark Target–Deep Blue algorithm. Similar to the observation of the high AOD over the Mediterranean Sea in the spring, AOD over the Red Sea (the right half of the Hurghada map in Figure 9) is also high in this season. Aswan is an arid, unpolluted city surrounded by deserts. AOD is at a maximum in the summer and comparable to values in the vicinity of Cairo and Asyut. This location shows the greatest seasonal change between winter and summer AOD, which can likely be attributed to dust storms blowing from the Nubian Desert and Northern Sudan in the summer [40].
4.2.3. Spatial Gradient of AOD in Vicinity of the Selected Cities
Similar to the approach pursued in [41], the spatial gradient of AOD was calculated along the east, west, north and south directions, starting from the center of each city (the 20 × 20 km2 domain shown in Figure 6). Results are shown in Figure 11. For each successive domain the average AOD was calculated after rejecting the points from the previous (inner) domain. In this manner, the successive measurements of seasonal average are taken only from pixels located between the boundaries of two successive domains (Figure 6) in each cardinal direction and measurements are located at distances 17.5, 37.5, 62.5, and 87.5 km from the core of the city, as shown in Figure 11. In general, AOD is expected to be higher at the core of the city if urban anthropogenic activities are the primary source. However, aerosols transported from outside the city could also affect the calculated gradient.
For Alexandria, AOD remains nearly constant across the 100 km in the four directions during winter season. In the other seasons, there is also no gradient along the south but there is a noticeable spatial increase within 20 km west of the city, followed by decrease observed at a relatively high rate (0.005 per kilometer in the spring) until stabilization after about 50 km. This increase may be a result of local industrial emissions, as most industrial activities (e.g., petrochemicals, cement, and rice and paper mills) are located in the western outskirts of the city. It is worth noting that the increase is associated with a decrease in the north and east directions, indicating the action of a dominant north easterly wind. This scenario supports the assumption that local anthropogenic aerosols, combined with wind, are the primary factors determining the spatial distribution of pollution over the city. Pollution in Alexandria and its surrounding is generated. It is the industrial pollution, not the large population, that contributes to the pollution there.
For Cairo, the spatial gradient of AOD is nearly zero in all directions in winter. In the other seasons, an appreciable positive gradient is noticed up to about 50 km eastward (0.002/km in the fall) before it stabilizes. Once again, most of the industrial parks in the vicinity of Cairo are located east of the city (e.g., Helwan, 10th of Ramadan, Shubra Al-Khima, etc.), while most of the agricultural areas are located to the west. The seasonally averaged AOD at the core of Cairo and Alexandria is nearly equal in all seasons (about 0.3). Although higher AOD values over Cairo have been reported in the fall and attributed to biomass burning in the ND region [38], this is not observable in these seasonal averages, perhaps due to the sporadic nature of the biomass burning events. Except for the increase in AOD to the east, the AOD gradient does not show a clear directional dependence around Cairo. We note that weak winds and frequent inversions over Cairo and its surroundings contribute to stable meteorological conditions [8], which would maintain similar aerosol concentrations over a large area.
The AOD gradient around the city of Asyut is independent of direction. A small size increase is noticed within 30 km away for the city’s core in the winter and an equal drop in the spring. The weak gradients are a result of low anthropogenic emissions and the lack of precipitation in the region as well as a lower elevation that contributes to a typical continental and stable climate. In the spring, the AOD peaks to 0.4 near the urban core (consistent with seasonal maps of AOD in Figure 9), which is relatively high compared to other seasons. Near Hurghada, the AOD gradient is virtually negligible in the west and south directions. It indicates a negative gradient to the north (towards the Red Sea), which is particularly noticeable in the spring. There are some positive gradients to the east (towards the Red Sea) in the winter and spring, which reflect the unexplained high AOD of pixels along the coastline, which may be related to retrieval errors, as mentioned before. The city of Aswan also exhibits very small spatial variability, with a slightly increasing AOD away from the city’s core in fall and winter seasons, especially along the north direction.
4.2.4. Cross Correlation Analysis
Cross correlation (CC) of total AOD (including background and SAPE) was calculated with 95% confidence level between the time series for pairs of selected areas. Since data are generated from the 10-km resolution MODIS product, the impact of aerosol loading from one region on another region can be inferred. Results are presented in Table 4. Focus is placed on the WD region, as this is a major source of severe aerosol episodes over much of Egypt. Results show moderate correlation (e.g., 0.43–0.52) between AOD from the WD and each of the examined regions when time lag is zero (same day), with slightly higher correlations between the WD and the ND and Alexandria. The correlation drops to less than 0.3 in all cases with a one- or two-day lead or lag time. It should be noted that the speed of a dust storm from the WD is typically between 40 and 50 km/h, resulting in dust from the WD reaching Alexandria, Cairo or Asyut (400–800 km away) on the same day.
The number of severe events does not warrant calculations of cross correlation of AOD between regions at a reasonable significance level. Therefore, to examine the correlation between the intensive AOD over WD and that over Alexandria, Cairo, Asyut, and the ND region, we focus on calculating the number of days with high AOD in the selected areas when the AOD in the WD is >0.4 (Table 5). For all days with WD AOD > 0.4, the number of days when the urban area AOD fell within five defined ranges (<0.4, >0.4, 0.4–0.6, 0.6–0.8 and >0.8) was counted, and the ratio of these events to the total number of available days from MODIS when AOD over the WD was >0.4 was calculated. For example, when AOD in the WD was >0.4, the number of available days that cover the ND region was 144, with 31 days with AOD < 0.4 and 113 days when AOD ≥ 0.4. Out of the latter range, there were 25, 47, and 41 days with AOD occupying the ranges of 0.4–0.6, 0.6–0.8, and >0.8, respectively. With this in mind, Table 5 reveals that when AOD over the WD was >0.4, a parallel high AOD > 0.4 was found over ND, Alexandria, Cairo and Asyut with frequency 0.78, 0.80, 0.72, and 0.64. This indicates the relatively high frequency of occurrence of high AOD events over each city that likely originated in the WD, and implies that these events are likely dust storms. Alexandria and the ND are the two regions most affected by the high AOD events in the WD. Surprisingly, Cairo is not affected as much, which implies that the pollutants as likely to be locally generated.
We note that the CC analysis approach was implemented in [42], also using AOD measurements from the MODIS level 2 product. The authors calculated CC of AOD for the period 2000 to 2009 from four cities within the ND region in addition to Cairo and Alexandria. They confirmed the heavy contribution of transported aerosols from the industrial city of El-Mahalla, located about 120 km north of Cairo within the ND region, to the permanent haze over Cairo. Results from this study show CC values between Alexandria and Cairo to be 0.465, 0.752, 0.719, and 0.493 for a time lag of −1, 0, 1, and 2 days, respectively. These are much higher than the values calculated here (Table 4; 0.082, 0.462, and 0.176 for same time lag of −1, 0, and 1 day, respectively). It should be noted that the monthly and seasonal averages of AOD from [42] are different from the values obtained in the present study (here, the different study period should also be taken into consideration). For example, the AOD during spring months (MAM) over Alexandria is 0.32 from the aforementioned study and 0.45 (within the 20 km domain) in the present study. The corresponding values over Cairo are 0.55 and 0.47. The reversed order of the difference between the two datasets for each city may explain the abovementioned difference in cross-correlation. It is also worth noting that the correlation between AOD over the two cities may be relatively strong when the aerosol source comprises a severe dust storm blowing from the WD, but not when it is local anthropogenic emissions. The number of days of the latter episode far exceeds the former. A strong correlation is expected only when the time lag is zero (i.e., the same day), an observation that supports the CC obtained in the present study.
4.2.5. Summary Statistics
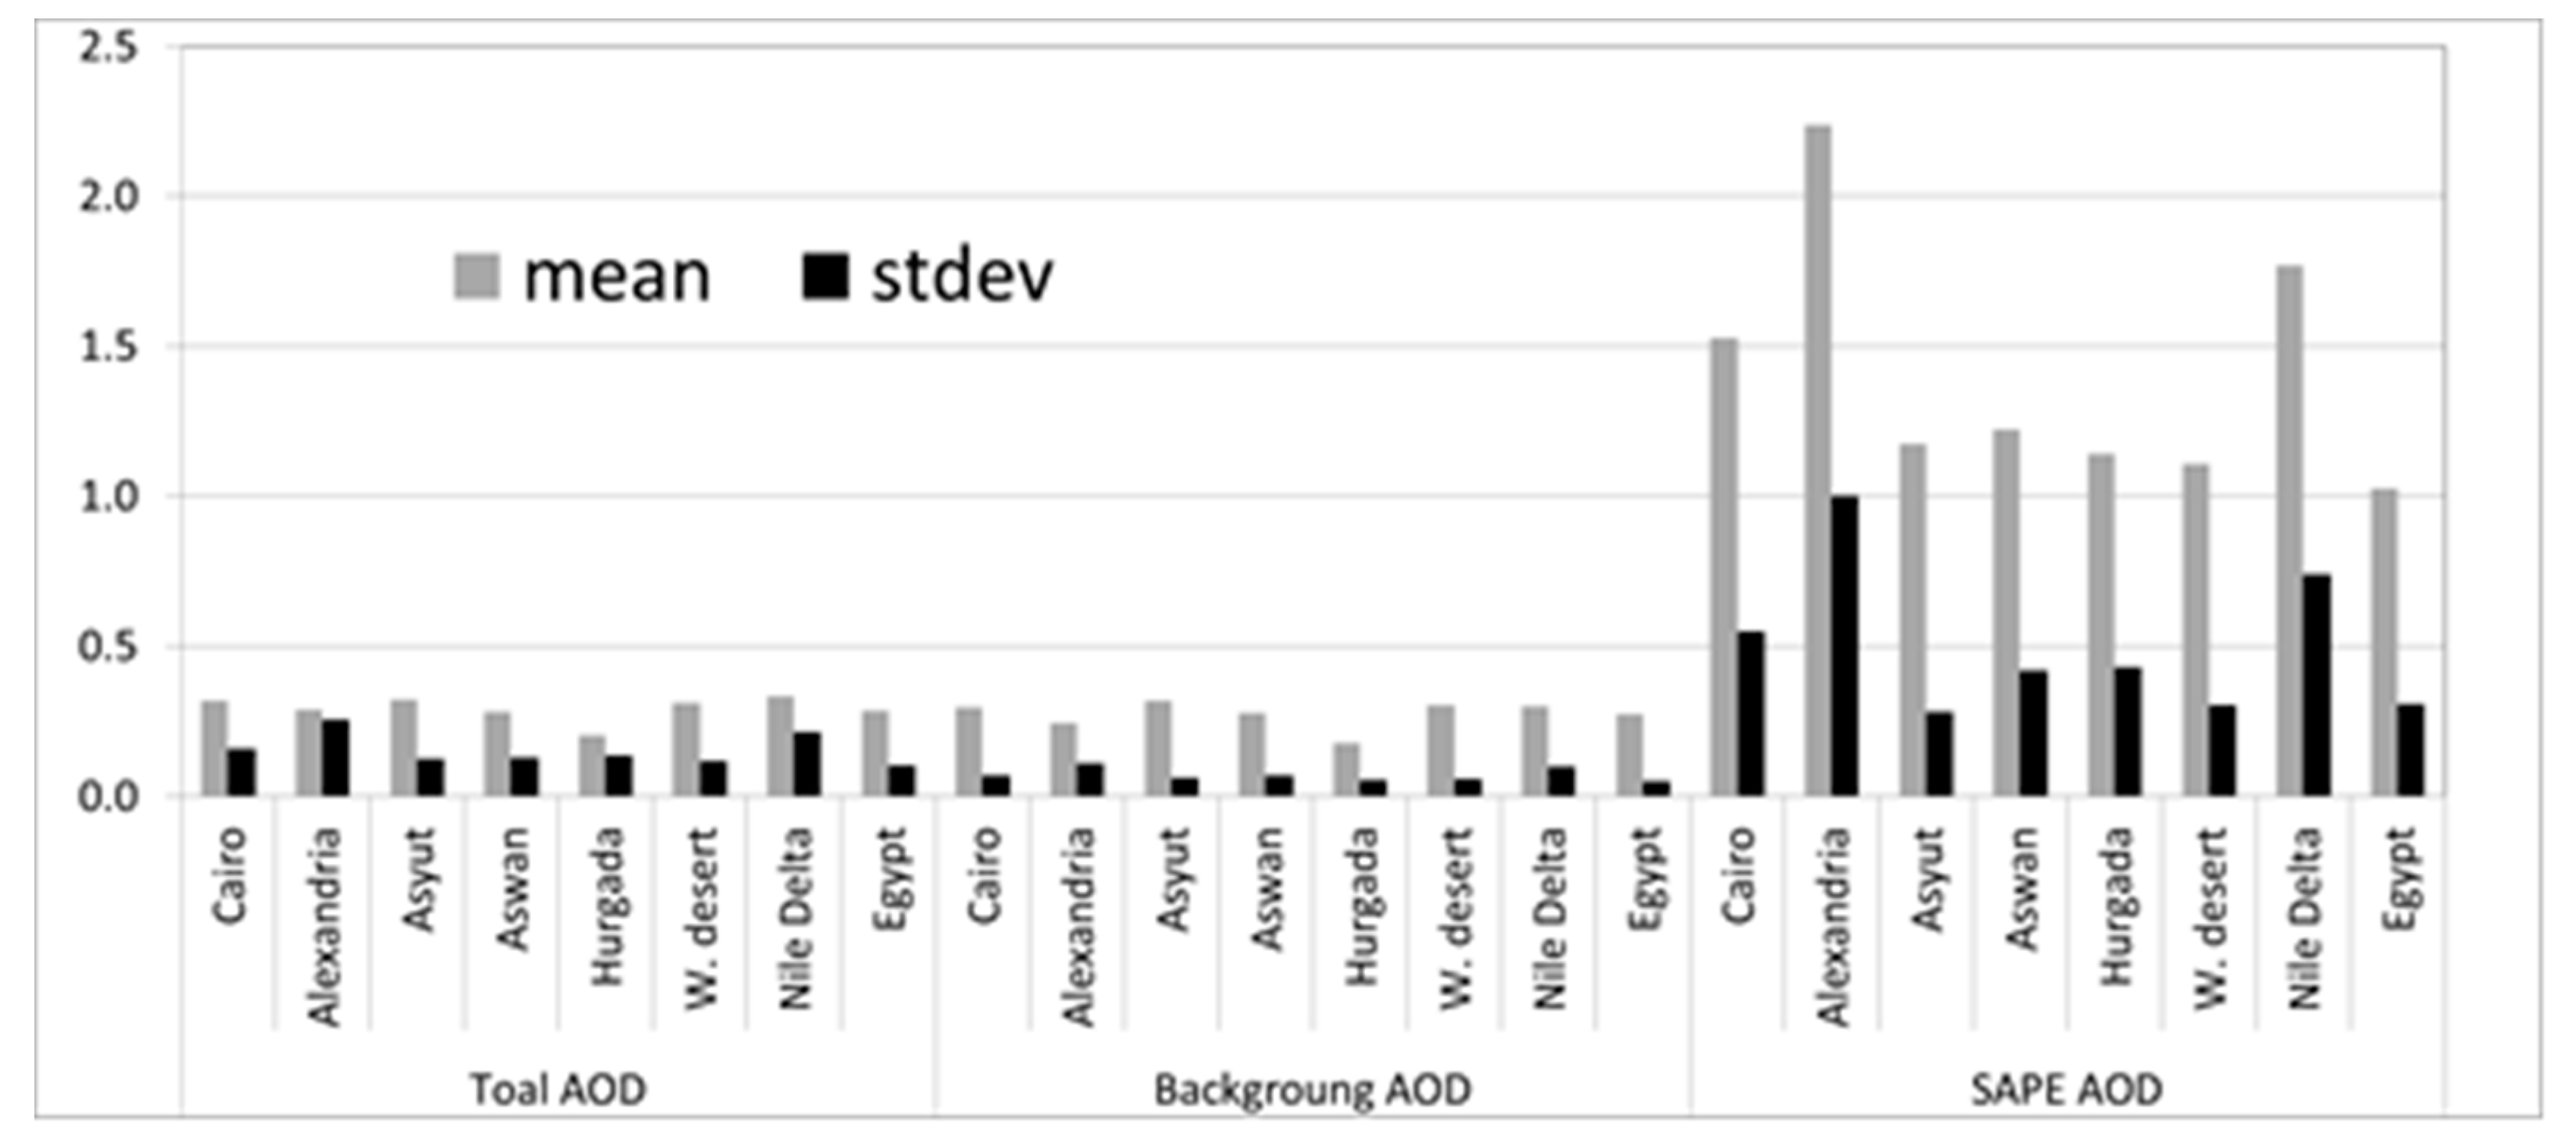
Mean and standard deviation of AOD over the selected cities and regions and Egypt during the 12-year study period are presented in Figure 12. They are calculated using the 50-km domain centered at each city or the entire domain of the WD, ND, and the whole country. Data are grouped to reflect the total, background, and SAPE values. As is to be expected, the difference of the aerosol loading between different cities and regions is more pronounced in the SAPE than in the background concentration. The 12-year average of total, background, and SAPE AOD over Egypt are 0.29, 0.28, and 1.88, respectively. The average of AOD from the WD (0.31) is not significantly different from that of the ND (0.33). This is not in full agreement with a finding in [10] from a comparison using AOD provided by MODIS level 3 data (1 degree gridded data) at 550 nm wavelength for the period 2000–2009. The authors showed that the annual mean of AOD varied between 0.20 and 0.28 over the WD and 0.33 and 0.39 over the ND.
For the SAPE statistics, the highest average of AOD is found in Alexandria, ND, and Cairo, with values of 2.24, 1.77, and 1.53, respectively. Hurghada and WD have notably lower values (1.14 and 1.11, respectively), but the lowest value is observed over the entire country (1.02) as approximately 94% of Egypt is desert (of which the WD covers 68%) and 95% of the population lives in the remaining area (mainly in the ND and along the Nile). Aerosol characteristics over the vast arid area outweigh those over the populated regions.
The number of days of SAPEs and the total number of SAPEs over each city, region, and Egypt as a whole are given in Table 6. If the number of days equals the number of SAPEs, this indicates that each event lasted for one day (e.g., Cairo, Asyut, Hurghada, and Aswan in winter). The ND region has the highest number of severe events. Cairo and Alexandria have 25 and 23 events throughout the year, respectively. Aswan has the lowest number (19), though not significantly different. Most of the severe events occur during the spring season.
Statistics of AOD at successive domains around each city (20, 50, 100, 150, and 200 km) are presented in Table 7. The data shows higher AOD over the core area of Alexandria with a noticeable decrease as the domain size increases (>50 km). Larger domains include a portion of the sea. In the case of Cairo, the decrease of AOD as the domain increases is barely noticeable. For the three other cities (smaller in size and population, with no major industrial parks) it is not noticeable.
In addition to the basic statistics of the mean and standard deviation, the frequency of occurrence for selected intervals of AOD is presented in Figure 13. With the exception of Hurghada, Asyut, and the WD region, the most frequent occurrence of AOD is not different from the typical background levels (0.2–0.3) of other highly populated regions in the world [43,44]. Hurghada has a better range (0.1–0.2) in contrast to the higher value from the WD and Asyut (0.3–0.4). AOD values above 1.0 at all sites are infrequent. As for the comparison between WD and ND regions, it should be noted that the AOD occupies a remarkably wider range in the ND (up to 4.9) compared to the WD (up to 1.8) (numbers may not be obvious in the figure).
The interannual variability of ADO over Egypt and the selected areas is presented in Figure 14. Except for Cairo and Asyut, no trend can be identified. Cairo and Asyut show a trend of increasing AOD at a rate of 0.0032 and 0.0035 per year (R2 of 0.743 and 0.688), respectively. The ND region has the highest AOD in all years, but that was matched by the AOD over Asyut after 2010. The AOD over Hurghada is remarkably small. The greatest interannual variability is noticed in the data of Alexandria, Aswan, and the ND region.
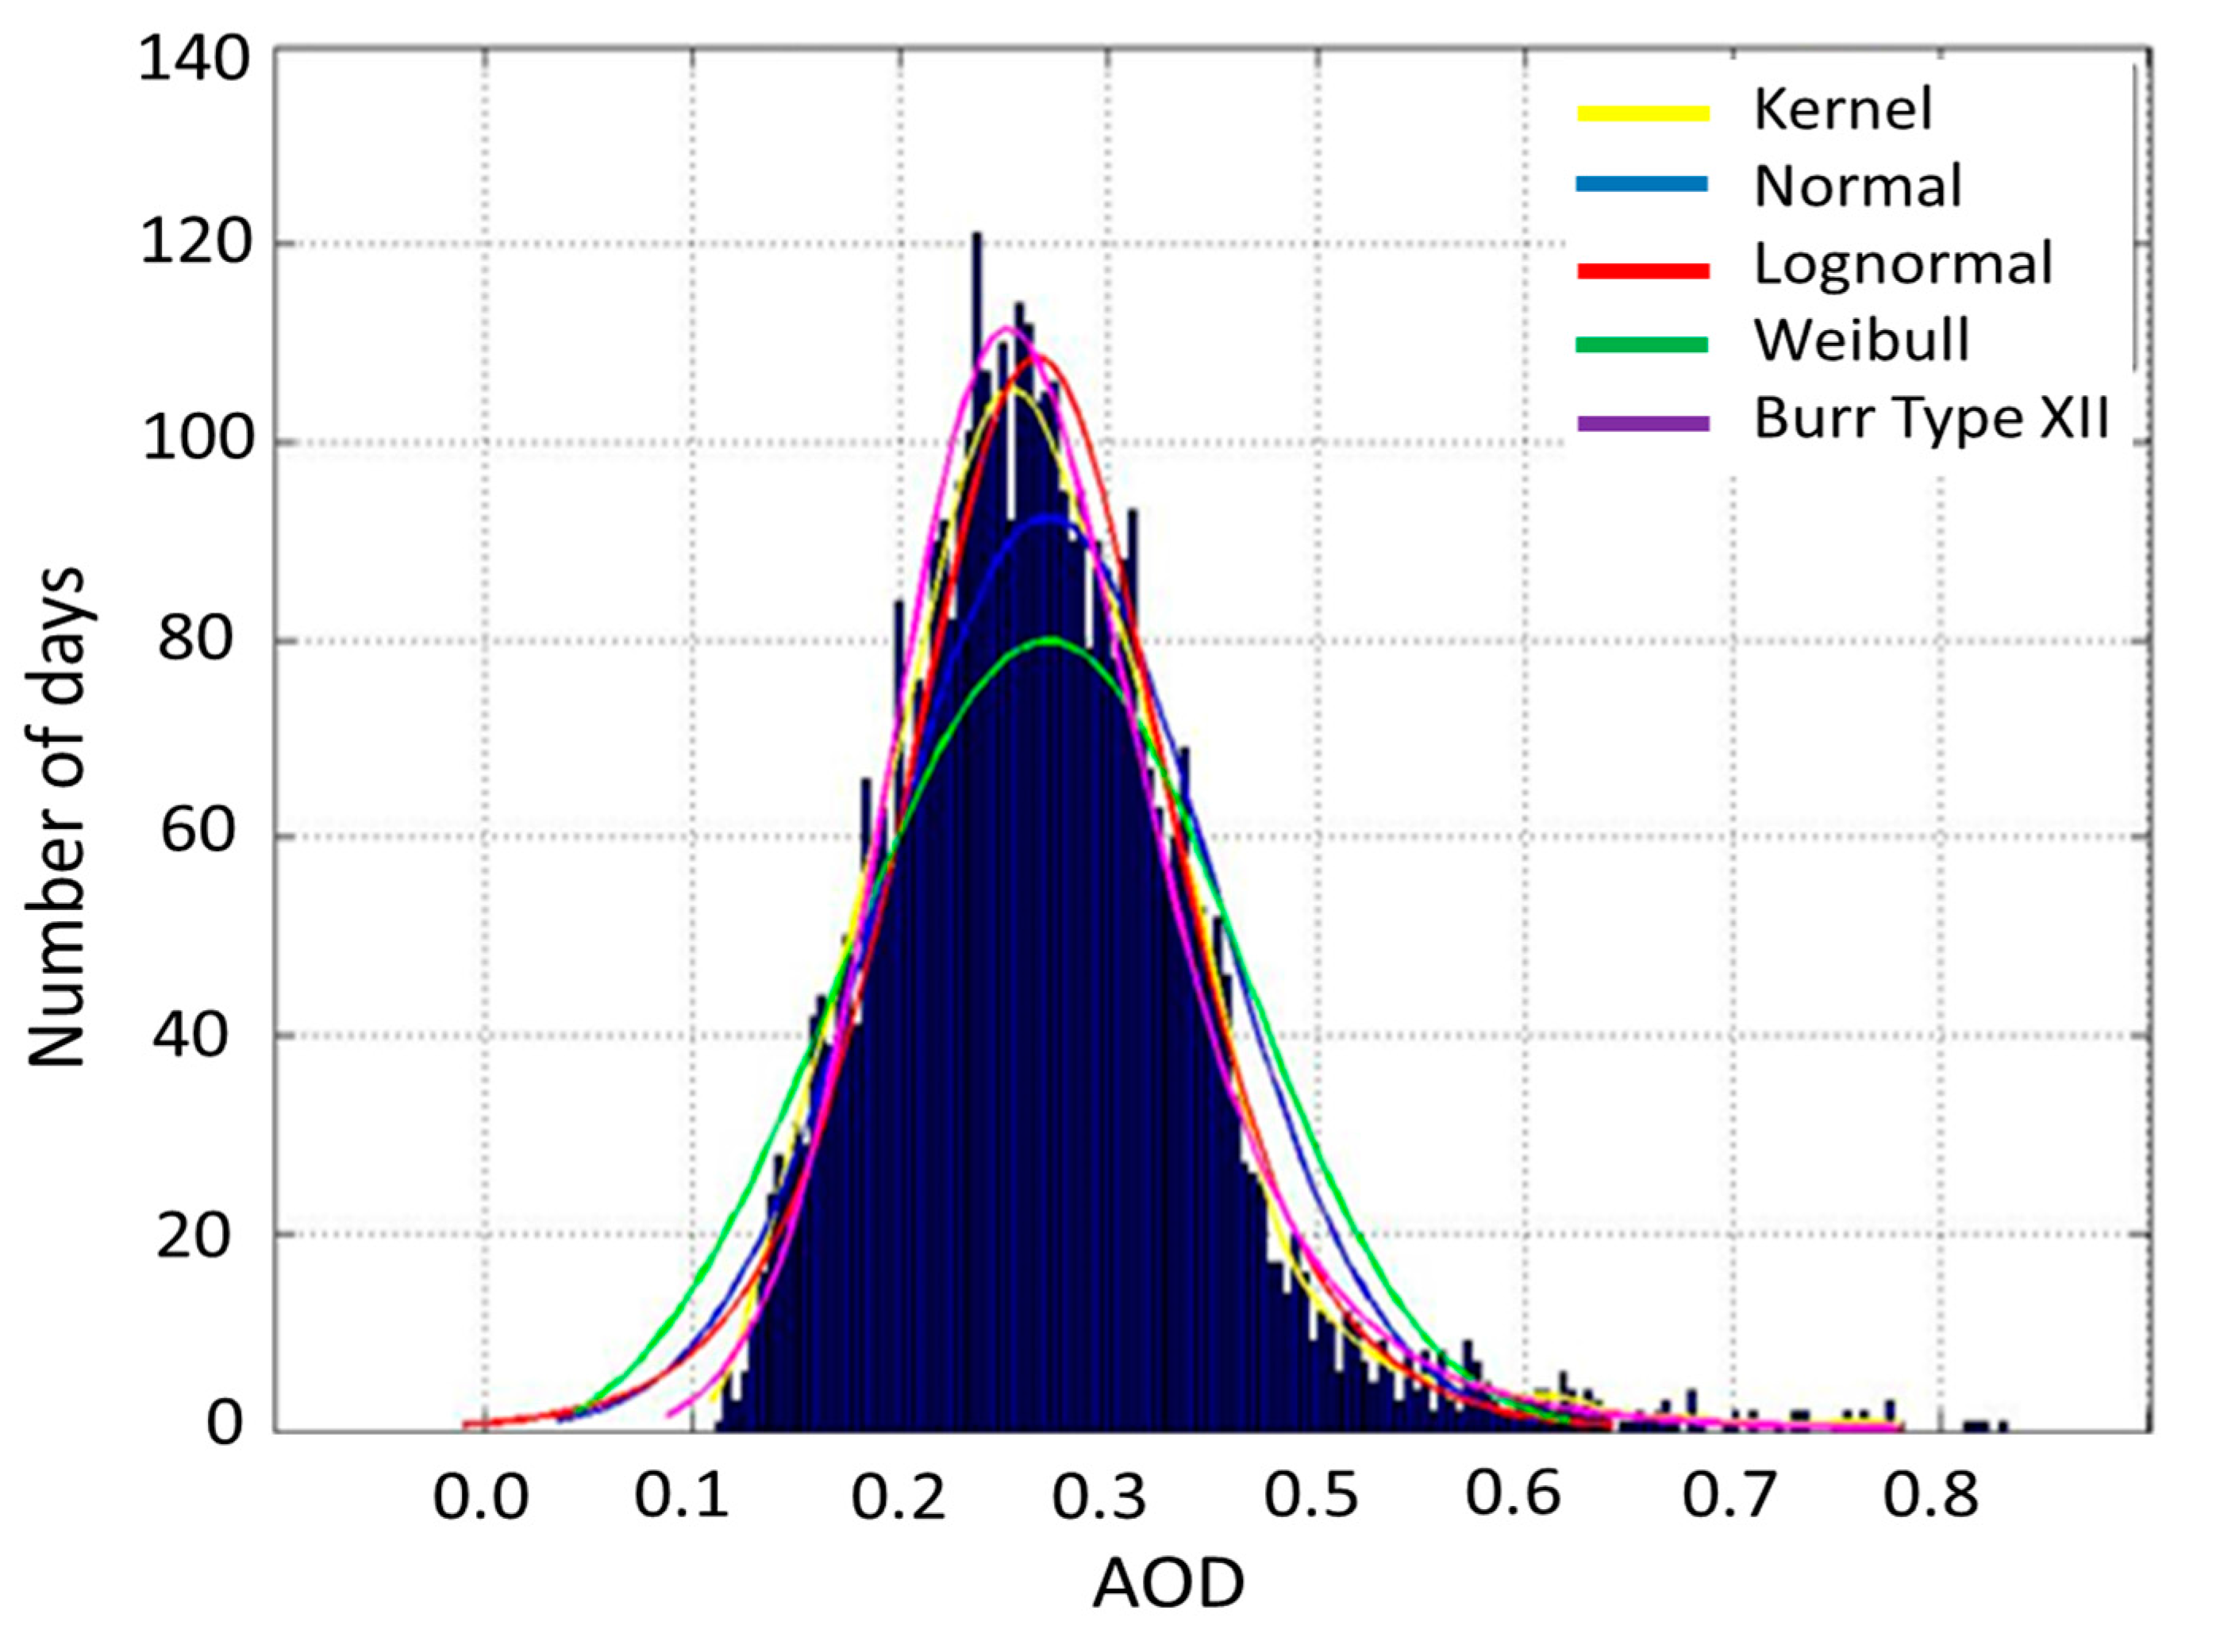
The probability distribution function (PDF) of AOD has been evaluated in prior studies to represent aerosol processes over various regions [45,46,47]. The applicability of the normal and lognormal distribution was evaluated in [45] and found that the lognormal is superior within the constraint of a unimodal probability distribution. The best fit PDF from multi-site data was estimated in [47] and found that the time scale of analysis was a factor in the distribution selection, with longer timescales represented well by lognormal distributions and shorter timescales better represented by the Weibull distribution. The AOD data in the present study are examined to estimate the PDF using five different distribution functions: kernel, normal, lognormal, Weibull, and Burr.
The kernel density estimation (a non-parametric method to estimate the probability density function of a set of random samples (, , ..., ) is given by
where is the kernel (the distribution is normalized such that the sum over n kernel values is equal to 1) and is the bandwidth (values included in Table 8 for the data from the five cities and the entire country). While a range of kernel functions are commonly used, the normal function was found to be best (once again, based on the error of fitting) for all sites presented in this study. The Burr distribution has probability density function defined by
The values of and are constants, which are given also in Table 7.
Figure 15 shows the PDF of AOD over Egypt from the 12-year dataset, along with the five tested distributions. The figure reflects the skewness of the data observed in Figure 14. Distributions of AOD from the five cities (Alexandria, Cairo, Asyut, Hurghada, and Aswan) were also generated (not shown in the figure). Errors of fitting the tested distributions using Kolmogorov–Smirnov goodness of fit are given in Table 9. The lower the value, the better the fit between the given distribution and the hypothesized continuous distributions. The goodness of fit for kernel distribution was not calculated since it is a non-parametric distribution. The AOD data over Egypt are best described using Burr, lognormal. According to Table 9, none of the distributions fit the data from any city as well as the fitting of the two aforementioned distributions to the data from Egypt. The order of the best fit is shown in brackets.
5. Conclusions
Daily aerosol optical depth (AOD) data from NASA’s Moderate Resolution Imaging Spectroradiometer (MODIS) have been used to explore spatiotemporal variations over Egypt in a 12-year period (2003 to 2014). The study uses the Level 2 product at 10 km resolution, allowing the extraction of more detailed information over five selected urban cities (Alexandria, Cairo, Asyut, Hurghada, and Aswan) and two geographical regions (Western Desert and Nile Delta). The cities are characterized by different human and industrial activities and the regions feature different landscape and meteorological attributes. The AOD data over each city are sampled using five square domains of dimensions (20, 50, 100, 150, and 200 km) centered at the city’s core. The spatial gradients in the vicinity of each city were used to explore the impact of local pollution sources versus large-scale regional events.
Spatial maps of AOD seasonal averages show that the highest values are found over the ND region (~0.35), with nearly matching values from the 50 × 50 km2 over Alexandria, Cairo, and Asyut. These values occur in spring and summer. Hurghada is the least polluted city with an average AOD around 0.21, with a slight increase in the summer. The most frequent AOD (from the 12-year study period) is found to be within the interval 0.2–0.3, though lower values (0.1–0.2) are observed over Hurghada and higher values (0.3–0.4) frequently occur over the ND and WD regions. Severe aerosol events, defined as days with , were identified for each city and region. The ND region has the highest number of such events (37), followed by Asyut (31), WD (30), Cairo (25), Alexandria (24), Hurghada (28), and Aswan (19). Nevertheless, the highest averages of the AOD during severe events are found in Alexandria, ND, and Cairo (2.24, 1.77, and 1.53, respectively). Hurghada and WD have notably lower values (1.14 and 1.11, respectively) but the lowest value is observed over the entire country (1.02). Most of the severe events occur during February–April, coincident with dust storm activity.
The spatial gradient of AOD (calculated along the four cardinal directions from the center of each city) does not show a clear directional dependence around Asyut or Aswan in any season due to its lower population and reduced industrial activity). An increase of AOD is observed within 50 km east of Cairo and 20 km west of Alexandria (the locations of major industrial parks). In Hurghada, the gradient is negligible in the west and south directions (across the land) but shows fluctuations in the east direction (i.e., across the sea) in winter and spring, which may be due to retrieval errors at the land–ocean interface.
Cross-correlation was calculated with 95% confidence level between the time series for pairs of selected areas. Results show a moderate correlation between AOD from the WD to either Alexandria, Cairo, or the ND when the time lag is zero (i.e., the same day). For all days with AOD > 0.4 in the WD region, the AOD over Alexandria, Cairo, Asyut, and ND were also found to be above this value 60–80% of the time, suggesting that many of the high AOD events are likely to originate in the WD. Interannual variability of AOD over Egypt and the selected areas is examined for the 12-year period. Except for Cairo and Asyut, no trend has been identified. Cairo and Asyut show a trend of increase in the AOD with a linear rate of 0.0032 and 0.0035 per year, respectively.
In general, the study highlights spatial and seasonal distributions of AOD at 550 mm over the selected areas and links them to geographic and climatic conditions. For example, the high AOD and most frequent severe events over Alexandria can be attributed to local industrial activities (55% of Egypt’s industry is located around Alexandria) as well as the aerosol loading carried by the dominant northerly wind across the Mediterranean. Cairo is commonly perceived as a city of poor air quality, caused partly by its low topography, which is bounded by eastern and western highlands. However, the results show that the annual average AOD is only second after the ND region and not far from the level found in Alexandria.
Asyut and Aswan are located in semi-arid regions, but relatively high AOD is observed in summer across a domain that extends 100 km from the core of each city. The AOD around the seaside coastal resort of Hurghada exhibits higher values at the sea side than at the land, with a greater difference during the summer. The high values are probably attributed to sea salt over water. Except for winter, the Nile Delta features high seasonal average AOD (>0.4). This is the main agriculture land of Egypt with dense population, numerous small factories, and heavy traffic using old vehicles with unregulated emissions. Finally, it should be noted that the overall AOD over Egypt is fairly low because 94% of the country’s area is arid with no significant pollution, except during major sand and dust storms that originate in or move through the WD.
Further analysis of other aerosol parameters from MODIS (e.g., single scattering albedo and Ångström Exponent) could support the interpretation of aerosol loading and events and assist in discriminating between anthropogenic and natural aerosols, identifying causes of the SAPE variability and frequency, and estimating the effects of aerosol on radiative forcing. Synergistic use of aerosol parameters from other NASA instruments is also needed, including the Cloud-Aerosol Lidar and Infrared Pathfinder Satellite Observations (CALIPSO) that provide information on the vertical profiles of aerosols. Finally, finer resolution MODIS products (3 km and the MAIAC1 km) could produce more accurate information about sources of anthropogenic aerosols and their influence on neighboring areas, given the wind data.
Acknowledgments
The study has been conducted under the PEER research project No. 2-239, titled “The Impact of Biogenic and Anthropogenic Atmospheric Aerosols to Climate in Egypt”. The international project is sponsored by the U.S. National Academy of Sciences. Aerosol optical depth data at 550 nm were obtained from Collection 006 MODIS-Aqua Landsweb data archive (http://ladsweb.nascom.nasa.gov/data/search.htm). Thanks are extended to the MODIS team for developing the useful aerosol parameter products and to the anonymous reviewers who provided suggestions to improve the manuscript.
Author Contributions
Mohammed Shokr and Alaa Ibrahim conceived and designed the research. Mohammed Shokr analyzed the data and wrote the manuscript. Allison Steiner revised the manuscript and adjusted the approach. Muhammed El-Tahan and Nashaat Gad downloaded and processed the data and participated in the analysis.
Conflicts of Interest
The authors declare no conflict of interest.
References
- Lenoble, J.; Remer, L.; Tanré, D. (Eds.) Aerosol Remote Sensing; Springer: Heidelberg, Germany; New York, NY, USA; London, UK, 2013; 328p. [Google Scholar]
- Ruzer, L.S.; Harley, N.H. Aerosols Handbook: Measurement, Dosimetry, and Health Effects, 2nd ed.; CRC Press: Boca Raton, FL, USA, 2012; 666p. [Google Scholar]
- Intergovernmental Panel on Climate Change (IPCC). Climate Change: Physical Science Basis; Cambridge University Press: New York, NY, USA, 2014; pp. 131–216. [Google Scholar]
- Pope, C.A., III. Epidemiology of fine particulate air pollution and human health: Biologic mechanisms and who’s at risk? Environ. Health Perspect. 2000, 108, 713–723. [Google Scholar] [CrossRef] [PubMed]
- World Health Organization (WHO). World Health Organization Air Quality Report. 2014. Available online: http://gamapserver.who.int/gho/interactive_charts/phe/oap_exposure/atlas.html (accessed on 1 January 2016).
- El-Metwally, M.; Alfaro, S.C.; Abdel Wahab, M.M.; Zakey, A.S.; Chatenet, B. Seasonal and inter-annual variability of the aerosol content in Cairo (Egypt) as deduced from the comparison of MODIS aerosol retrievals with direct AERONET measurements. Atmos. Res. 2010, 97, 14–25. [Google Scholar] [CrossRef]
- El-Metwally, M.; Alfaro, S.C.; Abdel Wahab, M.M.; Favez, O.; Mohamed, Z.; Chatenet, B. Aerosol properties and associated radiative effects over Cairo (Egypt). Atmos. Res. 2011, 99, 263–276. [Google Scholar] [CrossRef]
- El-Askary, H.; Kafatos, M. Dust Storm and Black Cloud Influence on Aerosol Optical Properties over Cairo and the Greater Delta Region, Egypt. Int. J. Remote Sens. 2008, 29, 7199–7211. [Google Scholar] [CrossRef]
- El-Askary, H.; Farouk, R.; Ichoku, C.; Kafatos, M. Transport of dust and anthropogenic aerosols across Alexandria, Egypt. Ann. Geophys. 2009, 27, 2869–2879. [Google Scholar] [CrossRef]
- Marey, H.S.; Gille, J.C.; El-Askary, H.M.; Shalaby, E.A.; El-Raey, M.E. Aerosol climatology over Nile Delta based on MODIS, MISR and OMI satellite data. Atmos. Chem. Phys. 2011, 11, 10637–10648. [Google Scholar] [CrossRef]
- Husar, R.B.; Prospero, J.M.; Stowe, L.L. Characterization of tropospheric aerosols over the oceans with the NOAA advanced very high resolution radiometer optical thickness operational product. J. Geophys. Res. 1997, 102, 16889–16909. [Google Scholar] [CrossRef]
- Remer, L.A.; Kaufman, Y.J.; Tanré, D.; Chu, D.A.; Martins, J.V.; Li, R.-R.; Ichoku, C.; Levy, R.C.; Kleidman, R.G.; Eck, T.F.; et al. The MODIS aerosol algorithm, products and validation. J. Atmos. Sci. 2005, 62, 947–973. [Google Scholar] [CrossRef]
- Martonchik, J.V.; Diner, D.J.; Kahn, R.A.; Ackerman, T.P.; Verstraete, M.E.; Pinty, B.; Gordon, H.R. Techniques for the retrieval of aerosol properties over land and ocean using multiangle imaging. IEEE Trans. Geosci. Remote Sens. 1998, 36, 1212–1227. [Google Scholar] [CrossRef]
- Von Hoyningen-Huene, W.; Freitag, M.; Burrows, J.B. Retrieval of aerosol optical thickness over land surfaces from top-of-atmosphere radiance. J. Geophys. Res.-Atmos. 2003, 108. [Google Scholar] [CrossRef]
- Deuzé, J.L.; Bréon, F.M.; Devaux, C.; Goloub, P.; Herman, M.; Lafrance, B.; Maignan, F.; Marchand, A.; Nadal, F.; Perry, G.; et al. Remote sensing of aerosols over land surfaces from POLDER-ADEOS-1 polarized measurements. J. Geophys. Res.-Atmos. 2001, 106, 4913–4926. [Google Scholar] [CrossRef]
- Kaufman, Y.J.; Tanré, D.; Gordon, H.R.; Nakajima, T.; Lenoble, J.; Frouin, R.; Grassl, H.; Herman, B.M.; King, M.D.; Teillet, P.M. Passive remote sensing of tropospheric aerosol and atmospheric correction for the aerosol effect. J. Geophys. Res. 1997, 102, 16815–16830. [Google Scholar] [CrossRef]
- Kaufman, Y.J.; Tanré, D.; Boucher, O. A satellite view of aerosols in the climate system. Nature 2002, 419, 215–223. [Google Scholar] [CrossRef] [PubMed]
- Lee, K.H.; Li, Z.; Kim, Y.J.; Kokhanovsky, A. Atmospheric Aerosol Monitoring from Satellite Observations: A History of Three Decades. In Atmospheric and Biological Environmental Monitoring; Kim, Y., Platt, U., Gu, M.B., Iwahashi, H., Eds.; Springer: Heidelberg, Germany; New York, NY, USA; London, UK, 2009; pp. 13–38. [Google Scholar]
- Hsu, N.C.; Tsay, S.C.; King, M.D.; Herman, J.R. Aerosol properties over bright-reflecting source regions. IEEE Trans. Geosci. Remote Sens. 2004, 42, 557–569. [Google Scholar] [CrossRef]
- Hsu, N.C.; Jeong, M.-J.; Bettenhausen, C.; Sayer, A.M.; Hansell, R.; Seftor, S.; Huang, J.; Tsay, S.-C. Enhanced Deep Blue aerosol retrieval algorithm: The second generation. J. Geophys. Res. Atmos. 2013, 118, 9296–9315. [Google Scholar] [CrossRef]
- AhramOnlone. 2012. Available online: http://english.ahram.org.eg/News/51634.aspx (accessed on 3 June 2012).
- Molina, M.J.; Molina, L.T. Megacities and atmospheric pollution. J. Air Waste Manag. Assoc. 2004, 54, 644–680. [Google Scholar] [CrossRef] [PubMed]
- World Bank. World Development Indicators, Report, Washington, D.C. 2007. Available online: http://siteresources.worldbank.org/DATASTATISTICS/Resources/table3_13.pdf (accessed on 1 April 2007).
- Abu-Allaban, M.; Lowenthal, D.H.; Gertler, A.W.; Labib, M. Sources of PM10 and PM2.5 in Cairo’s ambient air. Environ. Monit. Assess. 2007, 133, 417–425. [Google Scholar] [CrossRef] [PubMed]
- El-Metwally, M.; Alfaro, S.C.; Abdel Wahab, M.; Chatenet, B. Aerosol characteristics over urban Cairo: Seasonal variations as retrieved from Sun photometer measurements. J. Geophys. Res. 2008, 113, D14219. [Google Scholar] [CrossRef]
- Aboel Fotouh, Y.; El Askary, H.; El Raey, M.; Allali, M.; Sprigg, W.A.; Kafatos, M. Annual pattern of atmospheric pollutions and episodes over Cairo Egypt. Adv. Meteorol. 2013, 2013, 984853. [Google Scholar] [CrossRef]
- Tadros, M.T.Y.; El-Metwally, M.; Hamed, A.B. Determination of Ångström coefficients from spectral aerosol optical depth at two sites in Egypt. Renew. Energy 2002, 27, 621–645. [Google Scholar] [CrossRef]
- Remer, L.A.; Kleidman, R.G.; Levy, R.C.; Kaufman, Y.J.; Tanre, D.; Mattoo, S.; Martins, J.V.; Ichoku, C.; Koren, I.; Yu, H.B.; et al. Global aerosol climatology from the MODIS satellite sensors. J. Geophys. Res.-Atmos. 2008, 113, D14S07. [Google Scholar] [CrossRef]
- Levy, R.C.; Remer, L.A.; Kleidman, R.G.; Mattoo, S.; Ichoku, C.; Kahn, R.; Eck, T.F. Global evaluation of the collection 5 MODIS dark-target aerosol products over land. Atmos. Chem. Phys. 2010, 10, 10399–10420. [Google Scholar] [CrossRef] [Green Version]
- Kahn, R.A.; Garay, M.J.; Nelson, D.L.; Levy, R.C.; Bull, M.A.; Diner, D.J.; Martonchik, J.V.; Hansen, E.G.; Remer, L.A.; Tanre, D. Response to Toward unified satellite climatology of aerosol properties. 3. MODIS versus MISR versus AERONET. J. Quant. Spectrosc. Radiat. Transf. 2011, 112, 901–909. [Google Scholar] [CrossRef]
- Gkikas, A.; Hatzianastassiou, N.; Mihalopoulos, N. Aerosol events in the broader Mediterranean basin based on 7-year (2000–2007) MODIS C005 data. Ann. Geophys. 2009, 27, 3509–3522. [Google Scholar] [CrossRef]
- Prospero, J.M.; Ginoux, P.; Torres, O.; Nicholson, S.E.; Gill, T.E. Environmental characterization of global sources of atmospheric soil dust identified with the Nimbus 7 Total Ozone Mapping Spectrometer (TOMS) absorbing aerosol product. Rev. Geophys. 2002, 40. [Google Scholar] [CrossRef]
- Prasad, A.K.; El-Askary, H.; Kafatos, M. Implications of high altitude desert dust transport from Western Sahara to Nile Delta during biomass burning season. Environ. Pollut. 2010, 158, 3385–3391. [Google Scholar] [CrossRef] [PubMed]
- Kallos, G.; Kotroni, V.; Lagouvardos, K.; Papadopoulos, A. On the Long-Range Transport of Air Pollutants from Europe to Africa. Geophys. Res. Lett. 1998, 25, 619–622. [Google Scholar] [CrossRef]
- Twohy, C.H.; Coakley, J.A.; Tahnk, W.R. Effect of changes in relative humidity on aerosol scattering near clouds. J. Geophy. Res. 2009, 114, D05205. [Google Scholar] [CrossRef]
- Kallos, G.; Astitha, M.; Katsafados, P.; Spyrou, C. Long-range transport of anthropogenically and naturally produced particulate matter in the Mediterranean and North Atlantic: Current state of knowledge. J. Appl. Meteorol. Climatol. 2007, 46, 1230–1251. [Google Scholar] [CrossRef]
- Ezoo, A.A. Effect of Industrial Emissions on the Environment at Sadat City in Egypt. Master’s Thesis, Chemistry Department, Faculty of Science, Cairo University, Giza, Egypt, 2006. [Google Scholar]
- Marey, H.S.; Gille, J.C.; El-Askary, H.M.; Shalaby, E.A.; El-Raey, M.E. Study of the formation of the “black cloud” and its dynamics over Cairo, Egypt, using MODIS and MISR sensors. J. Geophys. Res. 2010, 115, D21206. [Google Scholar] [CrossRef]
- El-Ameen, M.; Farragallah, A.; Essa, M.A. Mineralogical composition of Khamsin wind dust at Assiut, Egypt. Assiut Univ. Bull. Environ. Res. 2011, 14, 95–107. [Google Scholar]
- Shao, Y. Physics and Modelling of Wind Erosion. In Atmospheric and Oceanographic Sciences Library; Springer: Heidelberg, Germany, 2008; Volume 37, ISBN 978-1-4020-8894-0. [Google Scholar]
- Gupta, P.; Khan, M.N.; de Silva, A.; Patadia, F. MODIS aerosol optical depth observations over urban areas in Pakistan: Quantity and quality of the data for air quality monitoring. Atmos. Pollut. Res. 2013, 4, 43–52. [Google Scholar] [CrossRef]
- El-Askary, H.M.; Prasad, A.K.; Kallos, G.; El-Raey, M.; Kafatos, M. Analyzing Black Cloud Dynamics over Cairo, Nile Delta Region and Alexandria using Aerosols and Water Vapor Data. In Air Quality-Models and Applications; Popovic, D., Ed.; InTech Publisher: Rijeka, Croatia, 2011; Chapter 12; pp. 211–232. ISBN 978-953-307-307-1. [Google Scholar]
- Toledano, C.; Cachorro, V.E.; Berjon, A.; de Frutos, A.M.; Sorribas, M.; de la Morena, B.A.; Goloub, P. Aerosol optical depth and Ångström exponent climatology at El Arenosillo AERONET site (Huelva, Spain). Q. J. R. Meteorol. Soc. 2007, 133, 795–807. [Google Scholar] [CrossRef]
- Gerasopoulos, E.; Amiridis, V.; Kazadzis, S.; Kokkalis, P.; Eleftheratos, K.; Andreae, M.O.; Andreae, T.W.; El-Askary, H.; Zerefos, C.S. Three-year ground based measurements of aerosol optical depth over the Eastern Mediterranean: The urban environment of Athens. Atmos. Chem. Phys. 2011, 11, 2145–2159. [Google Scholar] [CrossRef]
- O’Neill, N.T.; Ignatov, A.; Holben, B.N.; Eck, T.F. The lognormal distribution as a reference for reporting aerosol optical depth statistics: Empirical tests using multi-year, multi-site AERONET sun-photometer data. Geophys. Res. Lett. 2000, 27, 3333–3336. [Google Scholar]
- Chin, M.; Chu, A.; Levy, R.; remer, L.; Kaufman, Y.; Holben, B.; Eck, T.; Ginoux, P.; Gao, Q. Aerosol distribution in the Northern Hemisphere during ACE-Asia: Results from global model, satellite observations, and sun photometer measurements. J. Geophys. Res. (Atmos.) 2004, 109. [Google Scholar] [CrossRef]
- Lin, W.; Qing-Cin, Z. Study on probability distribution of multi-timescale aerosol optical depth using AERONET data. Atmos. Ocean. Sci. Lett. 2011, 4, 216–222. [Google Scholar] [CrossRef]
Figure 1.
Map of Egypt showing the sites included in the analysis. The Western Desert region is marked by the rectangle (base map from Google Earth).
Figure 1.
Map of Egypt showing the sites included in the analysis. The Western Desert region is marked by the rectangle (base map from Google Earth).

Figure 2.
Time series of daily aerosol optical depth (AOD) over Egypt from 1 January 2003 to 31 December 2014 with the threshold (thick dark line) that defines the threshold of AOD of SAPEs.
Figure 2.
Time series of daily aerosol optical depth (AOD) over Egypt from 1 January 2003 to 31 December 2014 with the threshold (thick dark line) that defines the threshold of AOD of SAPEs.

Figure 3.
Average (2003–2014) seasonal cycle of AOD over Egypt for winter (DJF), spring (MAM), summer (JJA), and fall (SON).
Figure 3.
Average (2003–2014) seasonal cycle of AOD over Egypt for winter (DJF), spring (MAM), summer (JJA), and fall (SON).

Figure 4.
Maps of AOD at 550 nm from MODIS over Egypt on 22–25 January 2004 corresponding to the highest observed SAPE event (Figure 2). High values of AOD in the western desert area are apparent on 22 and 23 January, suggesting emissions and transport of desert dust. White areas represent pixels with no data.

Figure 5.
Daily time series of AOD at 550 nm from year 2003 to 2014 over the Western Desert (WD) and Nile Delta (ND) regions. Corresponding severe events are marked with the shaded boxes. Note that not all the events in the ND region originate in the WD region.
Figure 5.
Daily time series of AOD at 550 nm from year 2003 to 2014 over the Western Desert (WD) and Nile Delta (ND) regions. Corresponding severe events are marked with the shaded boxes. Note that not all the events in the ND region originate in the WD region.

Figure 6.
Five square domains surrounding the selected city (the center is denoted by 0). Dimension of the inner domain is 20 × 20 km. This configuration is used to calculate the AOD at distances from the center, shown by the numbers in the upper half of the figure. The spatial gradient of AOD shown in Figure 11 obtained from measurements at these distances (averages of AOD from stripes between successive domains).
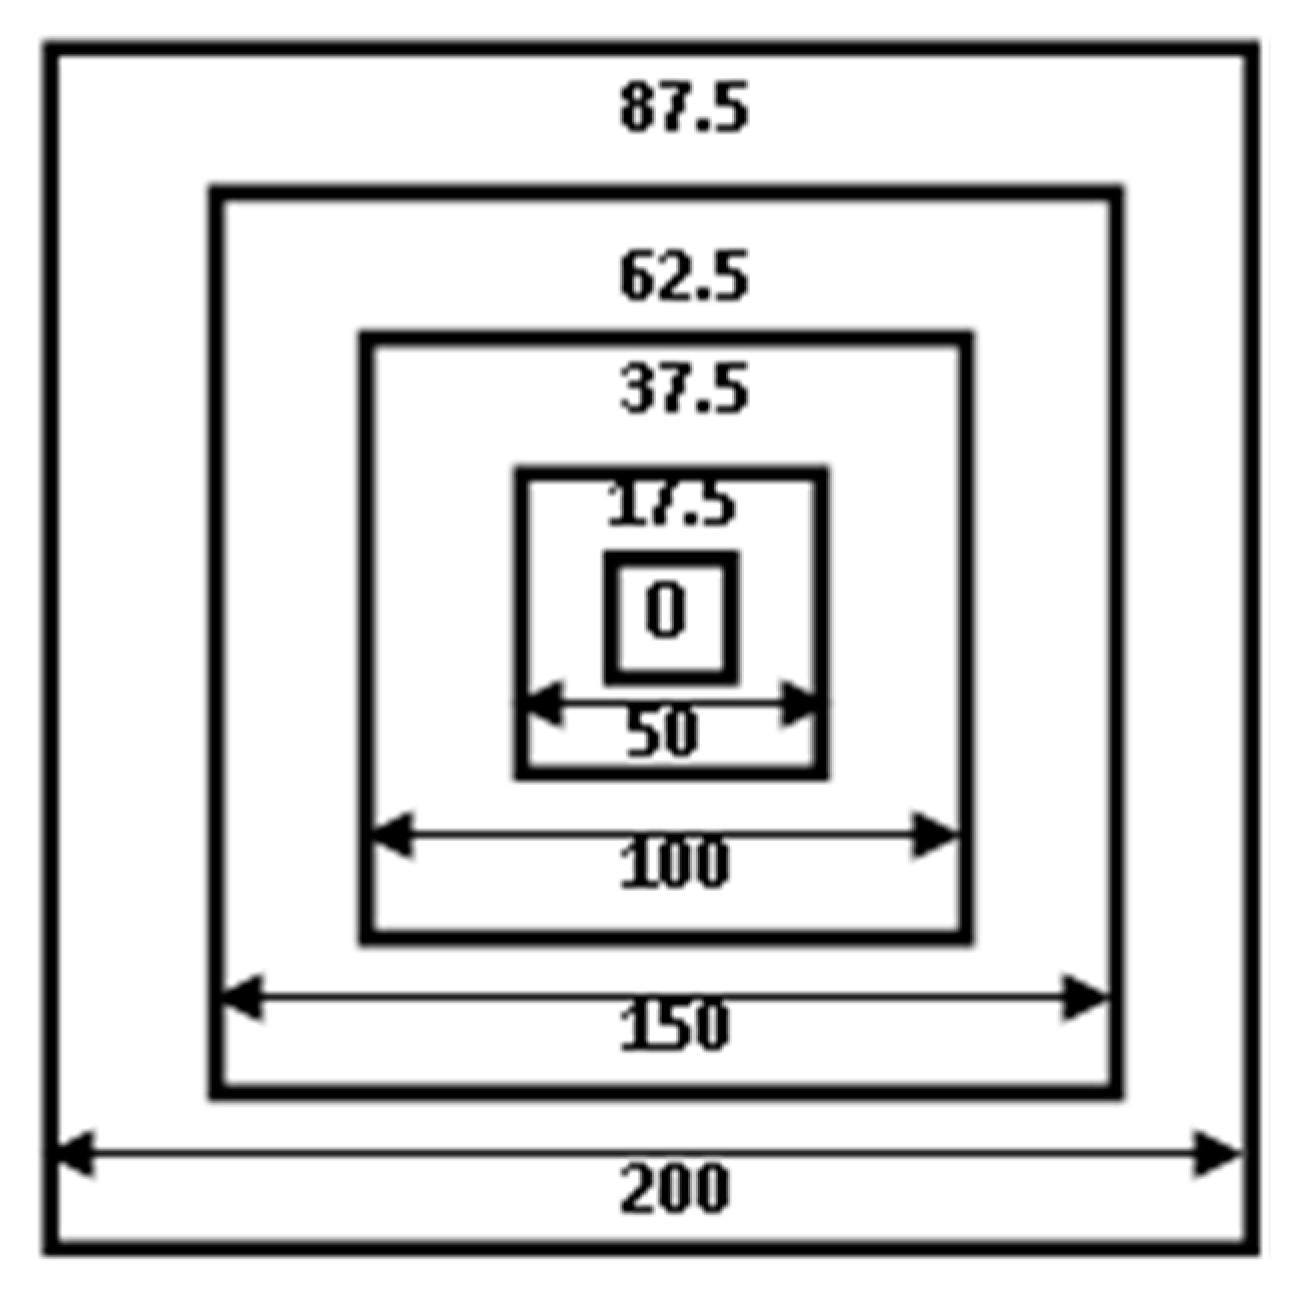
Figure 7.
Daily time series of AOD from year 2003 to 2014 for different square domains centered over Alexandria (top) and Cairo (bottom). The domain is identified by its dimensions (see Figure 6). Selected severe air pollution events are marked by vertical dashed lines and labeled for Alexandria (A) and Cairo (C).

Figure 8.
Daily time series of AOD from year 2003 to 2014, averaged over 50 × 50 km2 centered at the cities of Asyut, Hurghada, and Aswan.
Figure 8.
Daily time series of AOD from year 2003 to 2014, averaged over 50 × 50 km2 centered at the cities of Asyut, Hurghada, and Aswan.
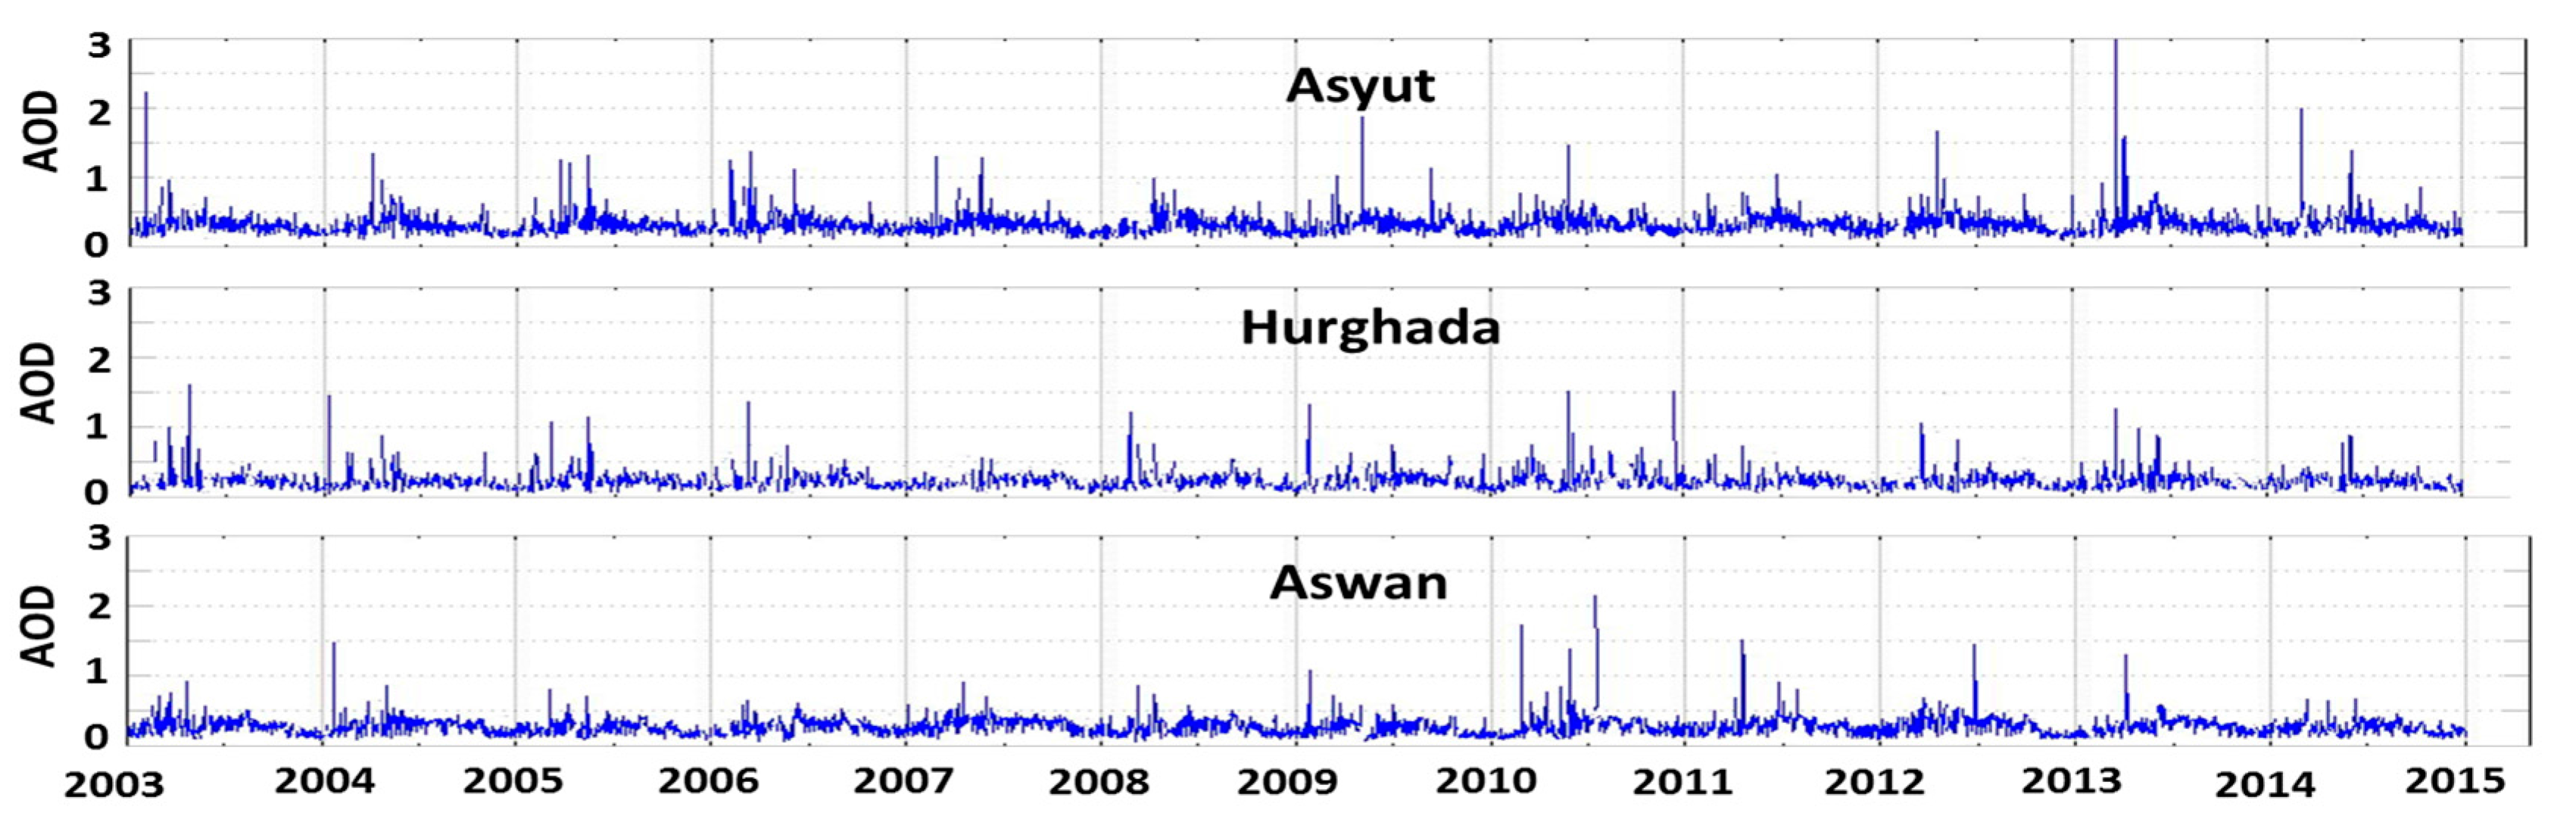
Figure 9.
Spatial maps of seasonal average of AOD over the five urban areas. The size of each tile is 200 × 200 km2 centered at the core of the city. Boxes inside each tile represent approximate boundaries of 20 (inner box), 50, 100, and 150 km. White pixels indicate insufficient data for averaging. Lines in blue are the path of the River Nile.

Figure 10.
Map showing the sharp boundary between the Nile Delta and Eastern Desert, which coincides with a visible boundary that separates high and low AOD in the spring, summer and fall seasons in the AOD maps over Cairo (Figure 9) (source: Google map).
Figure 10.
Map showing the sharp boundary between the Nile Delta and Eastern Desert, which coincides with a visible boundary that separates high and low AOD in the spring, summer and fall seasons in the AOD maps over Cairo (Figure 9) (source: Google map).

Figure 11.
Spatial gradient of AOD over the five selected cities. The gradient is measured along the four cardinal directions: east (red), west (blue), north (black), and south (magenta). For the location of the measurement points, refer to Figure 6.
Figure 11.
Spatial gradient of AOD over the five selected cities. The gradient is measured along the four cardinal directions: east (red), west (blue), north (black), and south (magenta). For the location of the measurement points, refer to Figure 6.
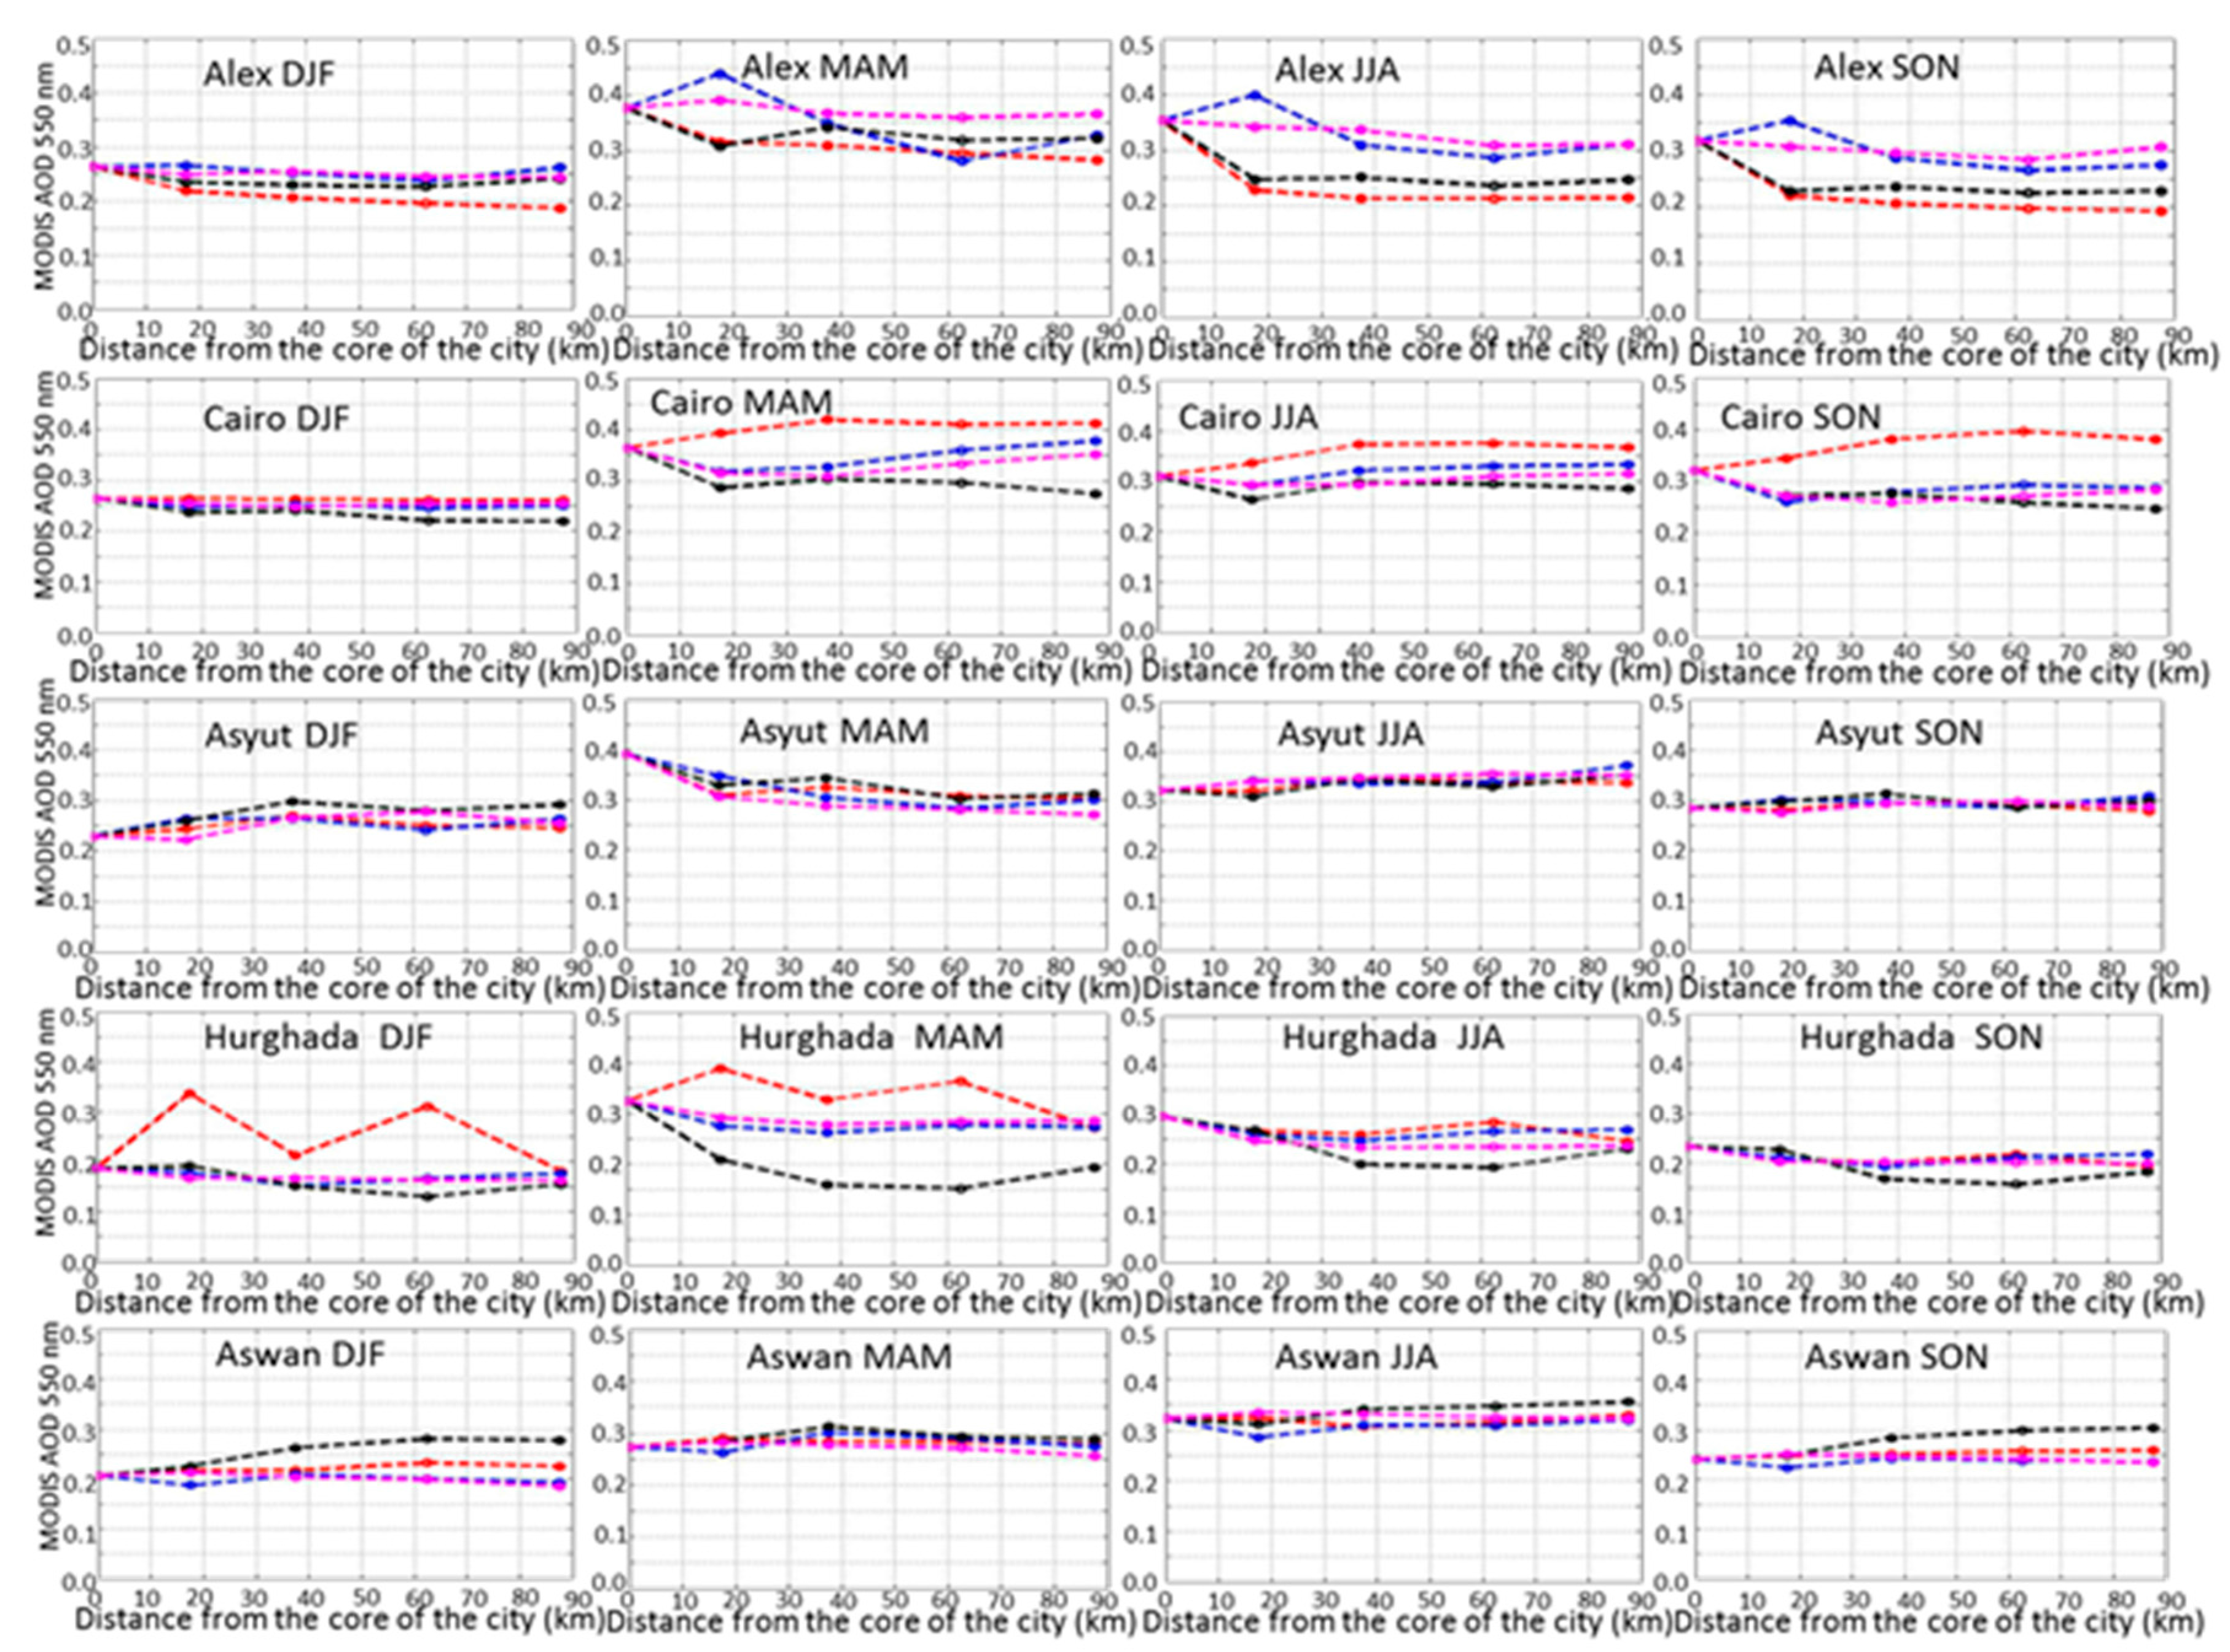
Figure 12.
Statistics of AOD from the total, background, and SAPE records over the 12-year period (2003–2014) from the defined regions and urban areas (50 × 50 km2 averaging region).
Figure 12.
Statistics of AOD from the total, background, and SAPE records over the 12-year period (2003–2014) from the defined regions and urban areas (50 × 50 km2 averaging region).

Figure 13.
Percentage of the number of days when the AOD falls within the shown intervals within the 12-year study period. Data are from the five selected cities, the two regions, and the entire country.
Figure 13.
Percentage of the number of days when the AOD falls within the shown intervals within the 12-year study period. Data are from the five selected cities, the two regions, and the entire country.
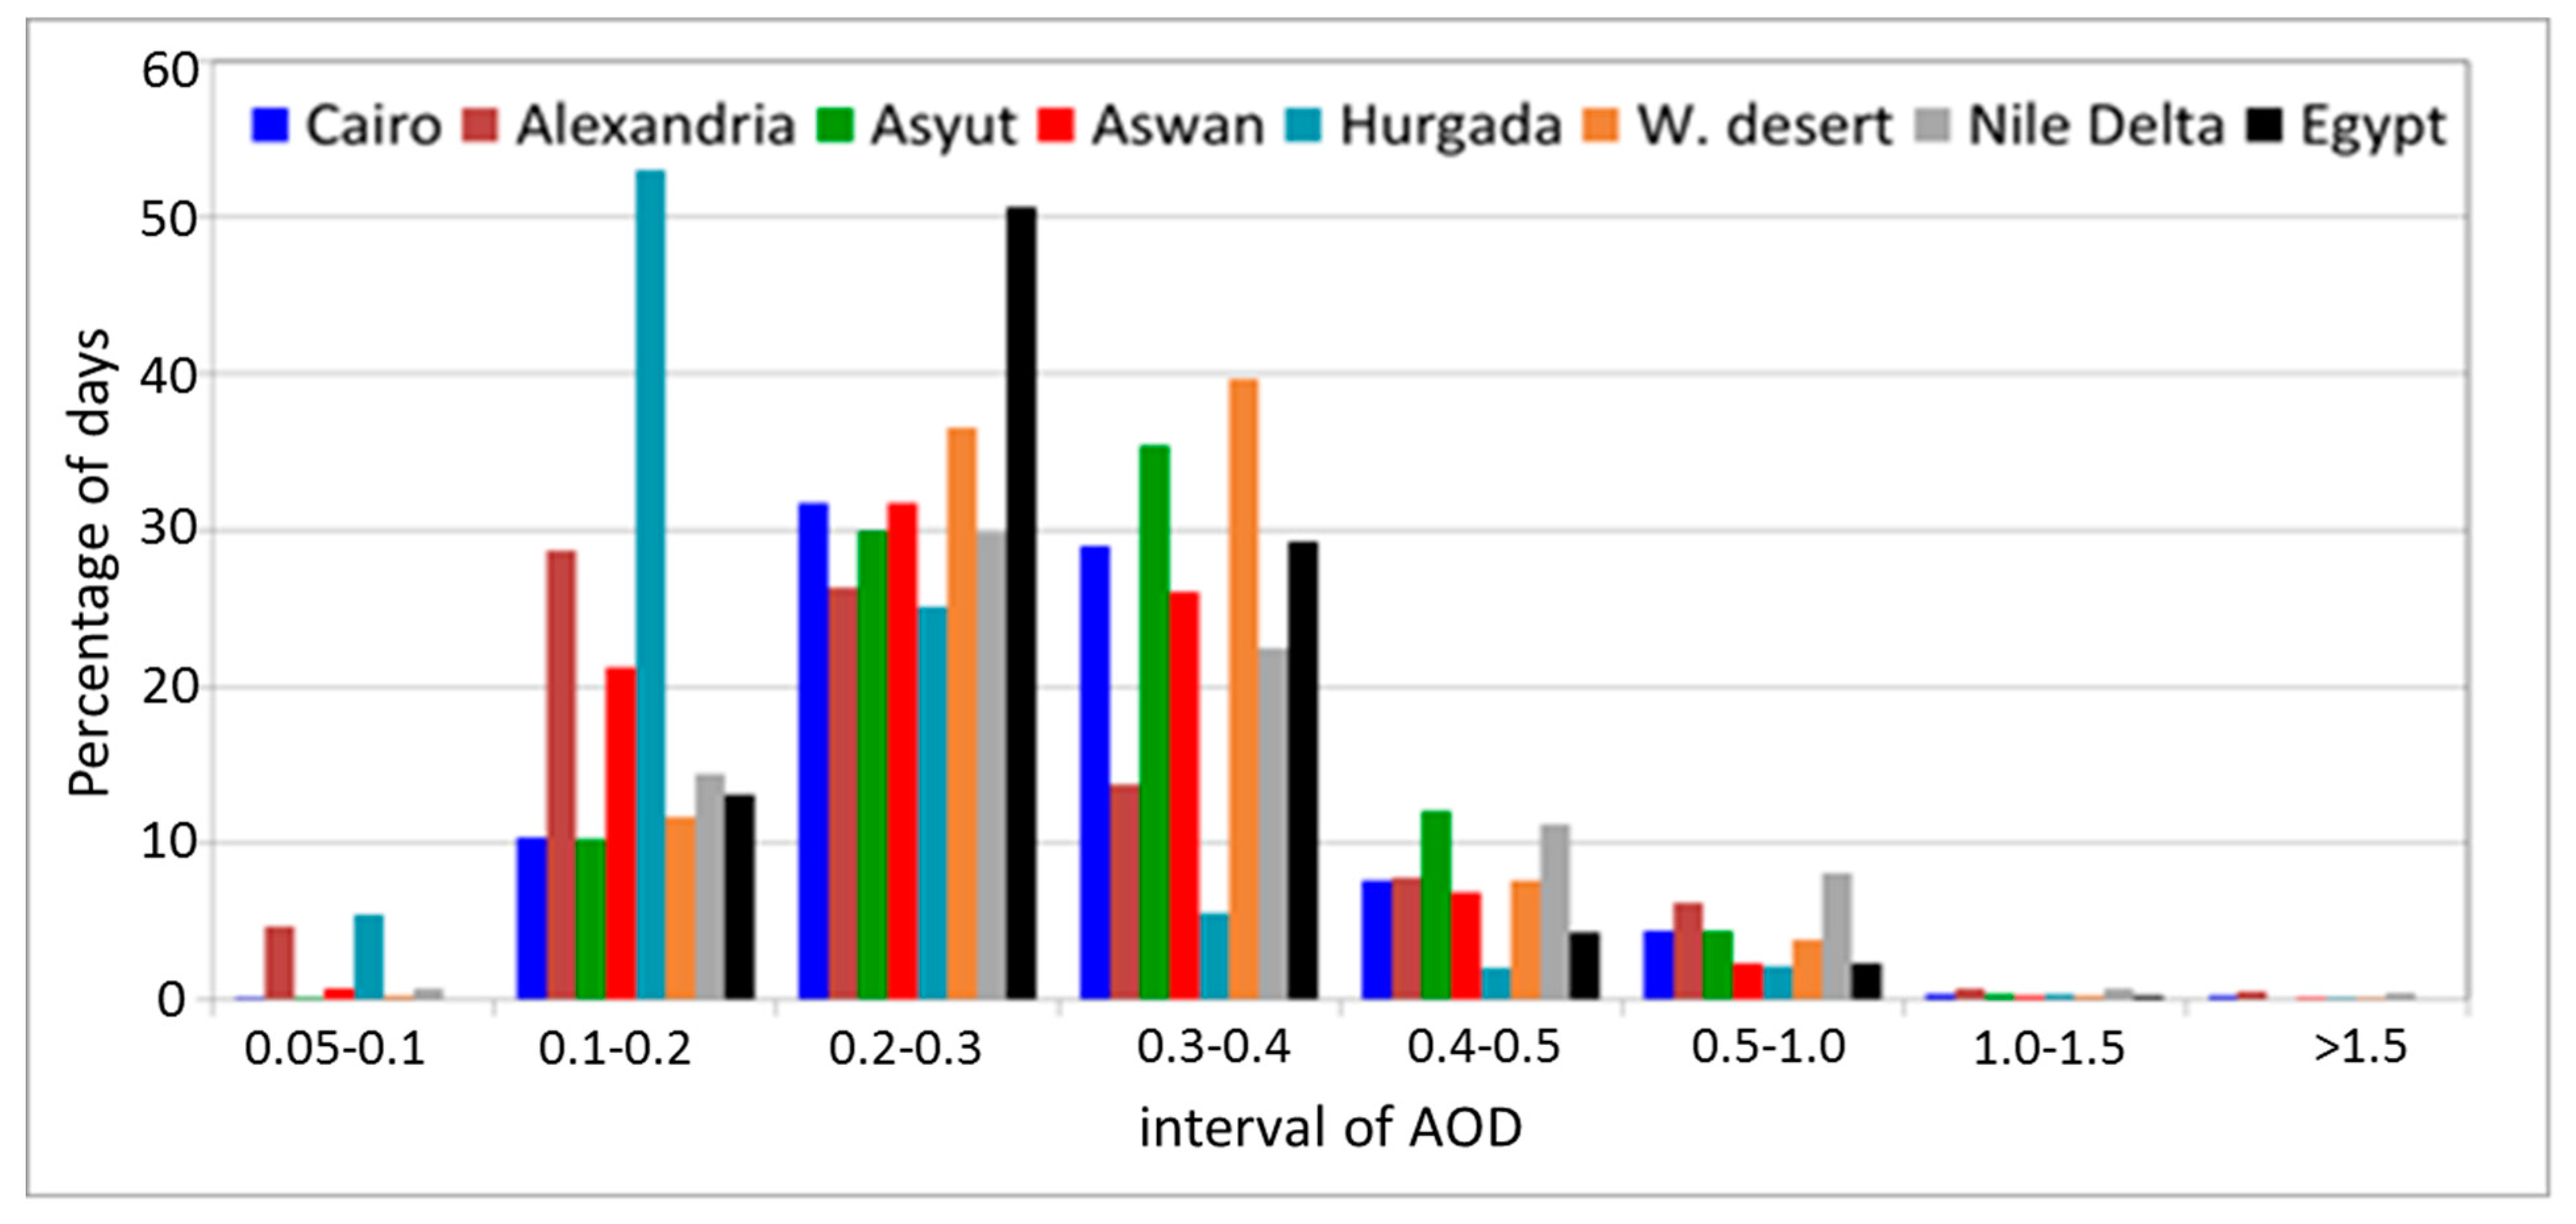
Figure 14.
Annual average AOD from 2003–2012) over the selected cities, regions, and Egypt. Data over the cities are obtained from 50 × 50 km2 around the center.
Figure 14.
Annual average AOD from 2003–2012) over the selected cities, regions, and Egypt. Data over the cities are obtained from 50 × 50 km2 around the center.
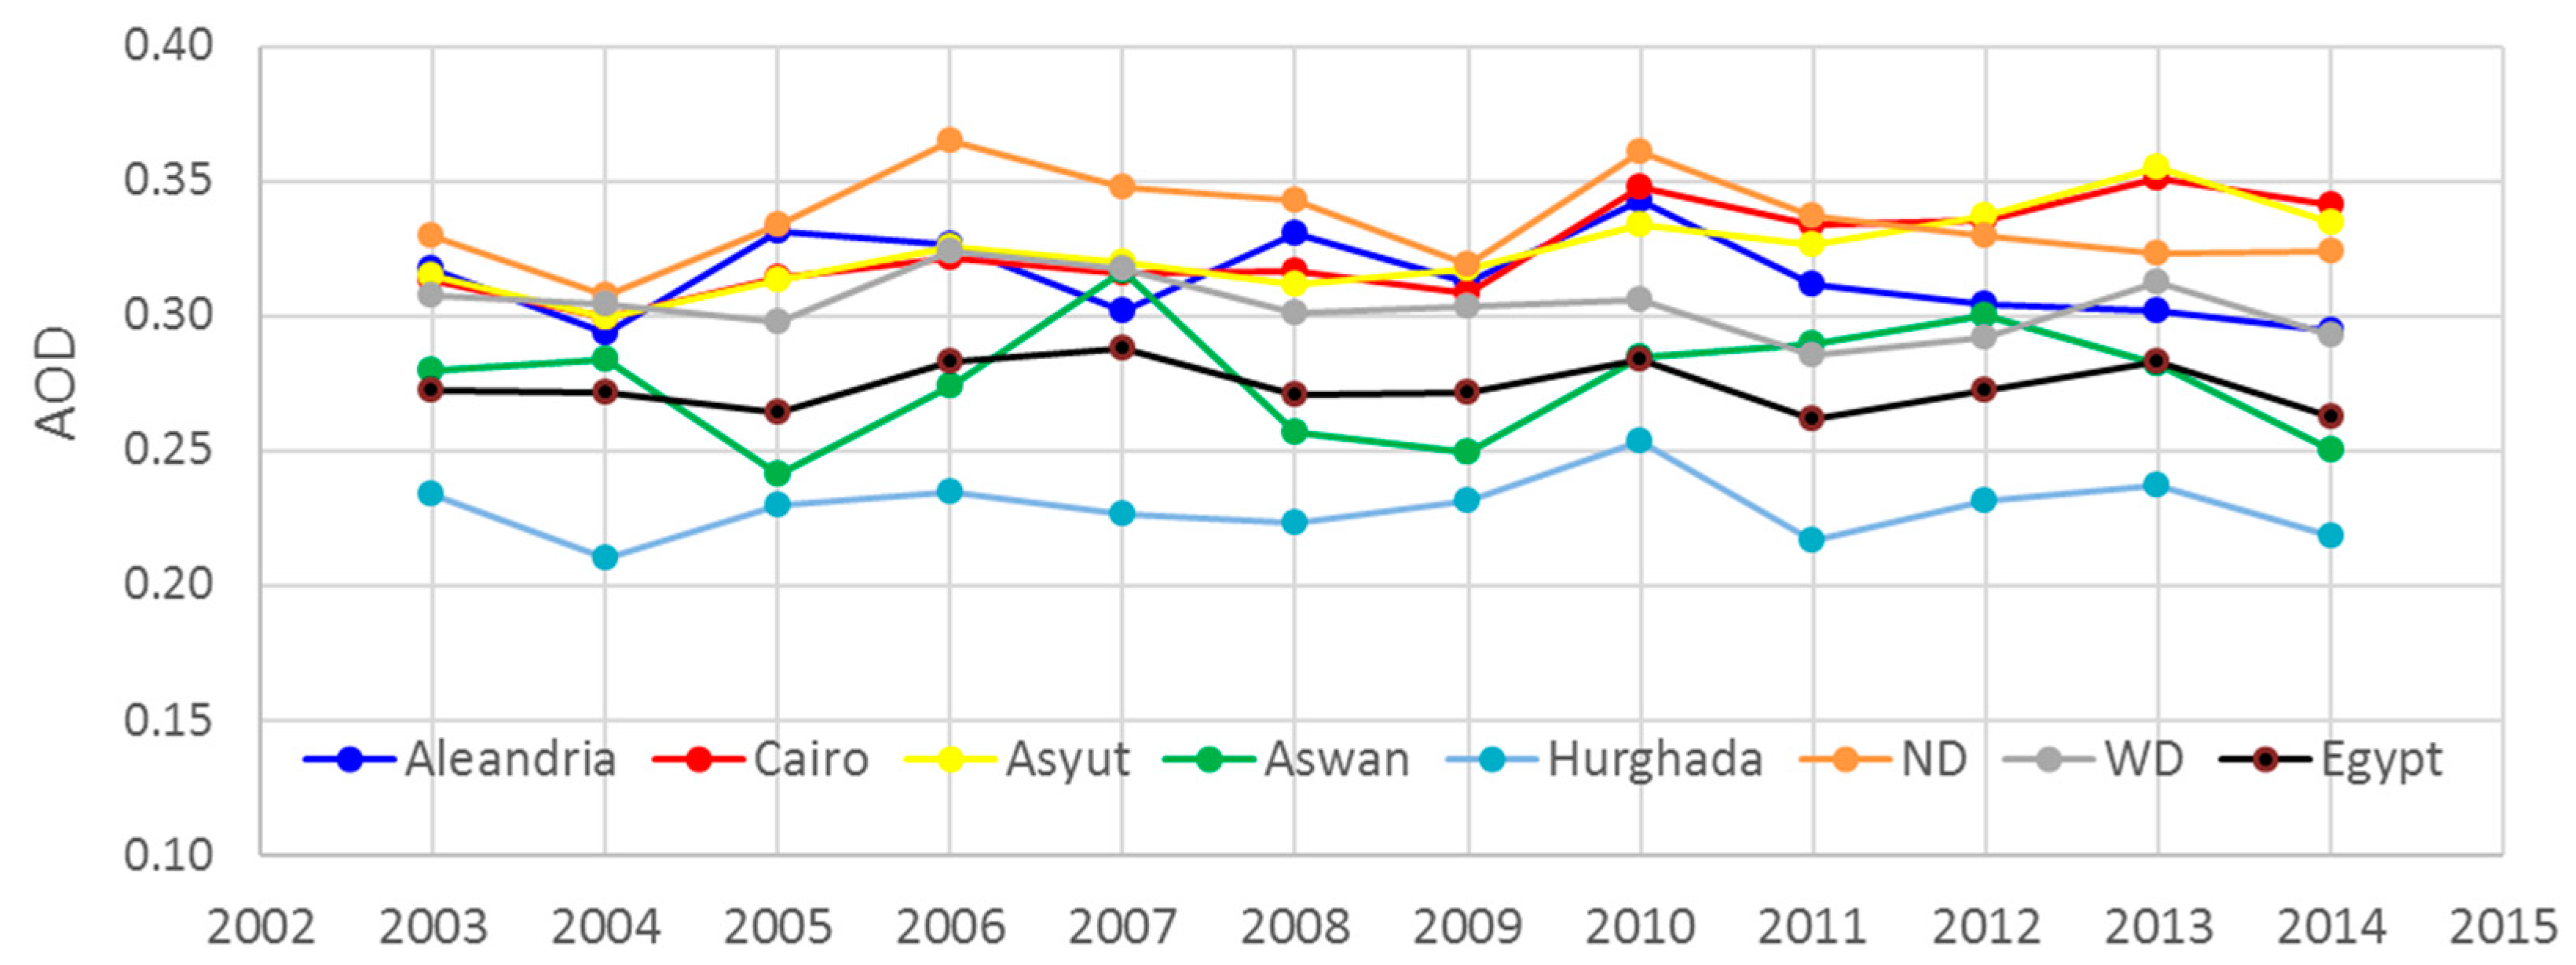
Figure 15.
Histogram of AOD over Egypt. Measurements are compiled from the 12-year study period.


Table 1.
Locations, estimated population, and area of selected cities. Figures of the populations are obtained from the website of the State Information Service (Egypt), http://www.sis.gov.eg/, with the population of Cairo including the entire metropolitan area.
Table 1.
Locations, estimated population, and area of selected cities. Figures of the populations are obtained from the website of the State Information Service (Egypt), http://www.sis.gov.eg/, with the population of Cairo including the entire metropolitan area.
| City | Latitude | Longitude | Population | Approx. Area |
|---|---|---|---|---|
| Alexandria | 31.213 N | 29.944 E | 4,716,000 | 450 km2 |
| Cairo | 30.065 N | 31.379 E | 20,000,000 | 150 km2 |
| Asyut | 27.183 N | 31.167 E | 420,000 | 100 km2 |
| Hurghada | 27.258 N | 33.812 E | 261,000 | 40 km2 |
| Aswan | 24.089 N | 32.900 E | 300,000 | 50 km2 |
Table 2.
Thresholds of AOD used to define the Severe Air Pollution Episode (SAPE) from 50 × 50 km2 centered at each city. Data are based on averages from the entire study period.
Table 2.
Thresholds of AOD used to define the Severe Air Pollution Episode (SAPE) from 50 × 50 km2 centered at each city. Data are based on averages from the entire study period.
| City | AOD |
|---|---|
| Alexandria | 1.31 |
| Cairo | 0.96 |
| Asyut | 0.86 |
| Hurghada | 0.75 |
| Aswan | 0.80 |
| WD | 0.77 |
| ND | 1.19 |
| Egypt | 0.64 |
Table 3.
Chronology of 33 SAPEs occurred over the geographic domain of Egypt during the study period, obtained from the time series of daily record of AOD at 550 nm.
Table 3.
Chronology of 33 SAPEs occurred over the geographic domain of Egypt during the study period, obtained from the time series of daily record of AOD at 550 nm.
| DD-MM-YYYY | AOD | DD-MM-YYYY | AOD |
|---|---|---|---|
| 02-02-2003 | 0.72 | 04-05-2009 | 0.81 |
| 02-03-2003 | 0.71 | 26-02-2010 | 0.66 |
| 25-04-2003 | 0.67 | 23-05-2010 | 0.66 |
| 22-01-2004 | 1.59 | 26-05-2010 | 1.02 |
| 23-01-2004 | 0.73 | 27-05-2010 | 1.07 |
| 05-03-2004 | 0.66 | 07-02-2012 | 0.72 |
| 03-03-2005 | 0.81 | 14-08-2012 | 1.18 |
| 22-03-2005 | 0.66 | 19-04-2012 | 0.65 |
| 24-02-2006 | 1.00 | 22-02-2013 | 0.80 |
| 25-02-2006 | 0.98 | 22-03-2013 | 1.02 |
| 26-02-2006 | 0.83 | 31-03-2013 | 1.14 |
| 08-03-2006 | 0.97 | 01-04-2013 | 0.68 |
| 23-02-2007 | 0.68 | 03-06-2013 | 0.68 |
| 24-02-2007 | 0.81 | 03-03-2014 | 0.84 |
| 10-05-2007 | 0.91 | 04-06-2014 | 0.86 |
| 06-04-2008 | 0.82 |
Table 4.
Cross-correlation between AOD from different areas with time lag varies between −2 and +2 days. N/A indicates an insufficient number of points for analysis.
Table 4.
Cross-correlation between AOD from different areas with time lag varies between −2 and +2 days. N/A indicates an insufficient number of points for analysis.
| Lag (Days) | −2 | −1 | 0 | 1 | 2 |
|---|---|---|---|---|---|
| W. Desert/Nile Delta | 0.131 | 0.297 | 0.520 | 0.258 | 0.108 |
| W. Desert/Cairo | 0.157 | 0.203 | 0.463 | 0.141 | 0.108 |
| W. Desert/Alexandria | 0.091 | 0.212 | 0.528 | 0.282 | 0.105 |
| W. Desert/Asyut | 0.060 | 0.137 | 0.430 | 0.322 | 0.223 |
| Alexandria/Cairo | 0.067 | 0.082 | 0.462 | 0.176 | 0.067 |
Table 5.
Number of days in the 12-year record within the given AOD intervals over ND region and the three shown cities when the AOD over the WD falls in the same range. The ratio of this number to the total number of days when AOD data are available is shown between brackets. The 50 km domain around the city’s center is used.
| AOD | ND | Alex. | Cairo | Asyut |
|---|---|---|---|---|
| <0.4 | 31 (0.21) | 23 (0.20) | 31 (0.28) | 46 (0.36) |
| ≥0.4 | 113 (0.78) | 93 (0.80) | 79 (0.72) | 82 (0.64) |
| 0.4–0.6 | 25 (0.17) | 18 (0.16) | 16 (0.15) | 23 (0.18) |
| 0.6–0.8 | 47 (0.33) | 37 (0.32) | 23 (0.21) | 22 (0.17) |
| >0.8 | 41 (0.28) | 38 (0.33) | 40 (0.36) | 37 (0..29) |
Table 6.
Number of days of SAPEs within each city, the two regions, and the entire country. The number of events is shown between brackets. Data are averaged over the 50-km domain and accumulated over the 12-year study period.
Table 6.
Number of days of SAPEs within each city, the two regions, and the entire country. The number of events is shown between brackets. Data are averaged over the 50-km domain and accumulated over the 12-year study period.
| Winter | Spring | Summer | Fall | |
|---|---|---|---|---|
| Alexandria | 9 (8) | 12 (12) | 2 (2) | 1 (1) |
| Cairo | 6 (6) | 18 (16) | 1 (1) | - |
| Asyut | 6 (6) | 20 (19) | 3 (3) | 2 (1) |
| Hurghada | 5 (5) | 18 (17) | 5 (4) | - |
| Aswan | 3 (3) | 10 (9) | 6 (4) | - |
| WD | 10 (8) | 19 (17) | 1 (1) | - |
| ND | 10 (9) | 25 (22) | 2 (2) | - |
| Egypt | 11 (8) | 20 (12) | 2 (1)- | - |
Table 7.
Mean and standard deviation of AOD (average over the 12-year period) from the successive spatial domains over the five cities.
Table 7.
Mean and standard deviation of AOD (average over the 12-year period) from the successive spatial domains over the five cities.
| City | Domain (Km2) | Mean | STDEV |
|---|---|---|---|
| Alexandria | 20 × 20 | 0.36 | 0.26 |
| 50 × 50 | 0.31 | 0.27 | |
| 100 × 100 | 0.29 | 0.26 | |
| 150 × 150 | 0.28 | 0.24 | |
| 200 × 200 | 0.28 | 0.23 | |
| Cairo | 20 × 20 | 0.34 | 0.21 |
| 50 × 50 | 0.32 | 0.17 | |
| 100 × 100 | 0.32 | 0.16 | |
| 150 × 150 | 0.31 | 0.17 | |
| 200 × 200 | 0.30 | 0.16 | |
| Asyut | 20 × 20 | 0.32 | 0.17 |
| 50 × 50 | 0.32 | 0.16 | |
| 100 × 100 | 0.33 | 0.13 | |
| 150 × 150 | 0.32 | 0.13 | |
| 200 × 200 | 0.32 | 0.13 | |
| Hurghada | 20 × 20 | 0.26 | 0.20 |
| 50 × 50 | 0.23 | 0.13 | |
| 100 × 100 | 0.21 | 0.14 | |
| 150 × 150 | 0.21 | 0.14 | |
| 200 × 200 | 0.21 | 0.12 | |
| Aswan | 20 × 20 | 0.29 | 0.13 |
| 50 × 50 | 0.28 | 0.13 | |
| 100 × 100 | 0.28 | 0.13 | |
| 150 × 150 | 0.28 | 0.13 | |
| 200 × 200 | 0.28 | 0.12 |
Table 8.
Constants of the two distributions that characterize the AOD over the different cities (see the text for explanation of the symbols).
Table 8.
Constants of the two distributions that characterize the AOD over the different cities (see the text for explanation of the symbols).
| Alexandria | 0.0261 | 3.5169 | 0.7771 |
| Cairo | 0.0225 | 5.2377 | 0.8829 |
| Asyut | 0.0201 | 4.8616 | 1.3141 |
| Hurghada | 0.0134 | 5.5066 | 0.5591 |
| Aswan | 0.0245 | 3.8303 | 1.6522 |
| Egypt | 0.0137 | 6.0115 | 1.2053 |
Table 9.
Goodness of fit measurement for data from Egypt and the five cities. The numbers in parentheses are ranks.
Table 9.
Goodness of fit measurement for data from Egypt and the five cities. The numbers in parentheses are ranks.
| Domain/Dist. | Burr | Lognormal | Normal | Weibull |
|---|---|---|---|---|
| Egypt | 0.0229 (1) | 0.0229 (2) | 0.0861 (3) | 0.1099 (4) |
| Alexandria | 0.1109 (1) | 0.1404 (3) | 0.1589 (4) | 0.1161 (2) |
| Cairo | 0.1623 (3) | 0.0947 (1) | 0.1174 (2) | 0.1631 (4) |
| Asyut | 0.0859 (2) | 0.0733 (1) | 0.0954 (3) | 0.1193 (4) |
| Hurghada | 0.0646 (1) | 0.1625 (3) | 0.1777 (4) | 0.1543 (2) |
| Aswan | 0.1196 (4) | 0.0618 (1) | 0.0685 (2) | 0.1076 (3) |
© 2017 by the authors. Licensee MDPI, Basel, Switzerland. This article is an open access article distributed under the terms and conditions of the Creative Commons Attribution (CC BY) license (http://creativecommons.org/licenses/by/4.0/).
Share and Cite
MDPI and ACS Style
Shokr, M.; El-Tahan, M.; Ibrahim, A.; Steiner, A.; Gad, N. Long-Term, High-Resolution Survey of Atmospheric Aerosols over Egypt with NASA’s MODIS Data. Remote Sens. 2017, 9, 1027. https://doi.org/10.3390/rs9101027
AMA Style
Shokr M, El-Tahan M, Ibrahim A, Steiner A, Gad N. Long-Term, High-Resolution Survey of Atmospheric Aerosols over Egypt with NASA’s MODIS Data. Remote Sensing. 2017; 9(10):1027. https://doi.org/10.3390/rs9101027
Chicago/Turabian StyleShokr, Mohammed, Muhammed El-Tahan, Alaa Ibrahim, Allison Steiner, and Nashaat Gad. 2017. "Long-Term, High-Resolution Survey of Atmospheric Aerosols over Egypt with NASA’s MODIS Data" Remote Sensing 9, no. 10: 1027. https://doi.org/10.3390/rs9101027
Note that from the first issue of 2016, this journal uses article numbers instead of page numbers. See further details here.