1. Introduction
Soil organic carbon (SOC) is a major determinant of soil function, soil fertility, and sustainability of agricultural systems [
1]. SOC dynamics strongly interact with the atmospheric CO
2 dynamics system [
2], which further affects climate change. Hence, investigating SOC content and its spatial variability for environmental monitoring and precision agriculture is a strong requirement. Traditional methods for chemical analysis of SOC are relatively complex, time consuming, and expensive. The implementation of soil surveys requires the analysis of numerous soil samples to characterize SOC spatial variability in the field [
3]. Therefore, the development of fast, inexpensive, and environmentally friendly methods to assess SOC spatial variability is indispensable.
Visible and near-infrared (VIS-NIR) reflectance spectroscopy is a fast, cost-effective, non-destructive, and relatively accurate technique and has been proven to be an effective alternative for SOC content estimation and soil mapping [
4,
5]. Under the influence of external environmental conditions such as temperature, moisture content (MC), and soil texture, soil spectral reflectance possesses different characteristics. In traditional practice, sample preparation (e.g., laboratory analysis including air-drying, grinding, and sieving) is necessary to obtain a relatively credible prediction results. However, calibration models developed from processed samples cannot be utilized for field soil samples with VIS-NIR spectroscopy due to the variability of external environmental factors. MC is considered as one of the most critical factors that degrades the prediction accuracy of SOC content [
6]. The influence of MC on spectra has been reported by many scholars [
7,
8]. As MC increases, the reflectance generally decreases nonlinearly and independent of soil type [
9,
10]. Therefore, most studies have demonstrated that dried soil samples are preferable for modeling of soil properties [
11,
12]. Unfortunately, soils may significantly vary in moisture in field conditions.
Although some studies have successfully used field spectra calibrated with measured SOC, the variation of MC can remarkably affect SOC prediction. Currently, approaches for removing the influence of MC on VIS-NIR spectral estimation of SOC have been considered in most studies. For example, Mouazen et al. [
7] removed the influence of MC on the accuracy of spectroscopy measurement of soil properties by classifying samples into different MC groups. Wu et al. [
13] noticed that the first derivative of specific bands, which is moisture-independent, could be used to estimate SOC content under field conditions. Marco et al. [
14] claimed that people could build up a series of models to predict SOC content by classifying the samples into different moisture levels. Minasny et al. [
15] used an external parameter orthogonalization algorithm to remove the effects of MC from spectra when predicting SOC content. These strategies can be characterized into: (i) improving the leverage of multivariate calibrations by “spiking”; (ii) improving the similarity among spectra using spectroscopic preprocessing and/or transfer algorithms; and (iii) removing the effects of “unwanted” spectral parameters from the calibrations [
16]. The above-mentioned studies were based on the principle of weakening the influence of water and significantly improving the accuracy of SOC measurement.
It is worth noting that, in most cases, the field-recorded spectra usually contain the information of a certain amount of water rather than air-dried soils. In addition, for a fixed site, the MC shows high temporal variation through evaporation, while SOC remains the same in the short-term. Thus, the effect of MCs on the accuracy of SOC prediction is relative. To date, limited studies have been focused on removing the interference of absolute MC in spectroscopic modeling. However, there has been no study focusing on the relative MCs that affect the accuracy of SOC estimation with VIS-NIR spectroscopy and successful calibration transfer among different MC conditions. In practice, as the most useful data source, the periodic hyperspectral remote sensing images are widely used to monitor physical and chemical characteristics of soils. To understand and quantify the effect of relative MC on the accuracy of SOC prediction using hyperspectral data, we used the laboratory proximal sensing technique as the foundation for the applications of in situ or hyperspectral remote sensing images. Firstly, the accuracy of partial least squares regression (PLSR) models in spectroscopy measurement of SOC content was investigated by classifying samples into different MC levels through evaporation process. Then, orthogonal signal correction (OSC) and generalized least squares weighting (GLSW) filter algorithms were used to correct the relative MC effects on laboratory spectroscopic measurements. Using OSC and GLSW algorithms, the filter matrices were developed to project spectra to a subspace that is insensitive to MC. Subsequently, the projected spectra are statistically analyzed to develop the PLSR model.
The objective of this study is to build a “moisture-free” or “other-external-factors-free” model for VIS-NIR spectroscopy estimation of SOC for laboratory-scanned rewetted soil samples. Specifically, the performance of OSC and GLSW filter methods in removing MC effects from spectral calibration was investigated in comparison with Savitzky-Golay (SG) smoothing pre-processing techniques. To achieve the above-mentioned objectives, the research procedures were threefold, as follows: (1) to estimate the ability of SOC prediction using spectra for soil samples of different moisture levels; (2) to apply OSC and GLSW algorithms to remove relative MC effects in building a “moisture-free” model and assess transferability among different MCs; and (3) to find the proper spectral pre-processing technique that can be used for VIS-NIR spectroscopy estimation of SOC content under various MC conditions.
2. Materials and Methods
2.1. Study Area and Soil Sampling
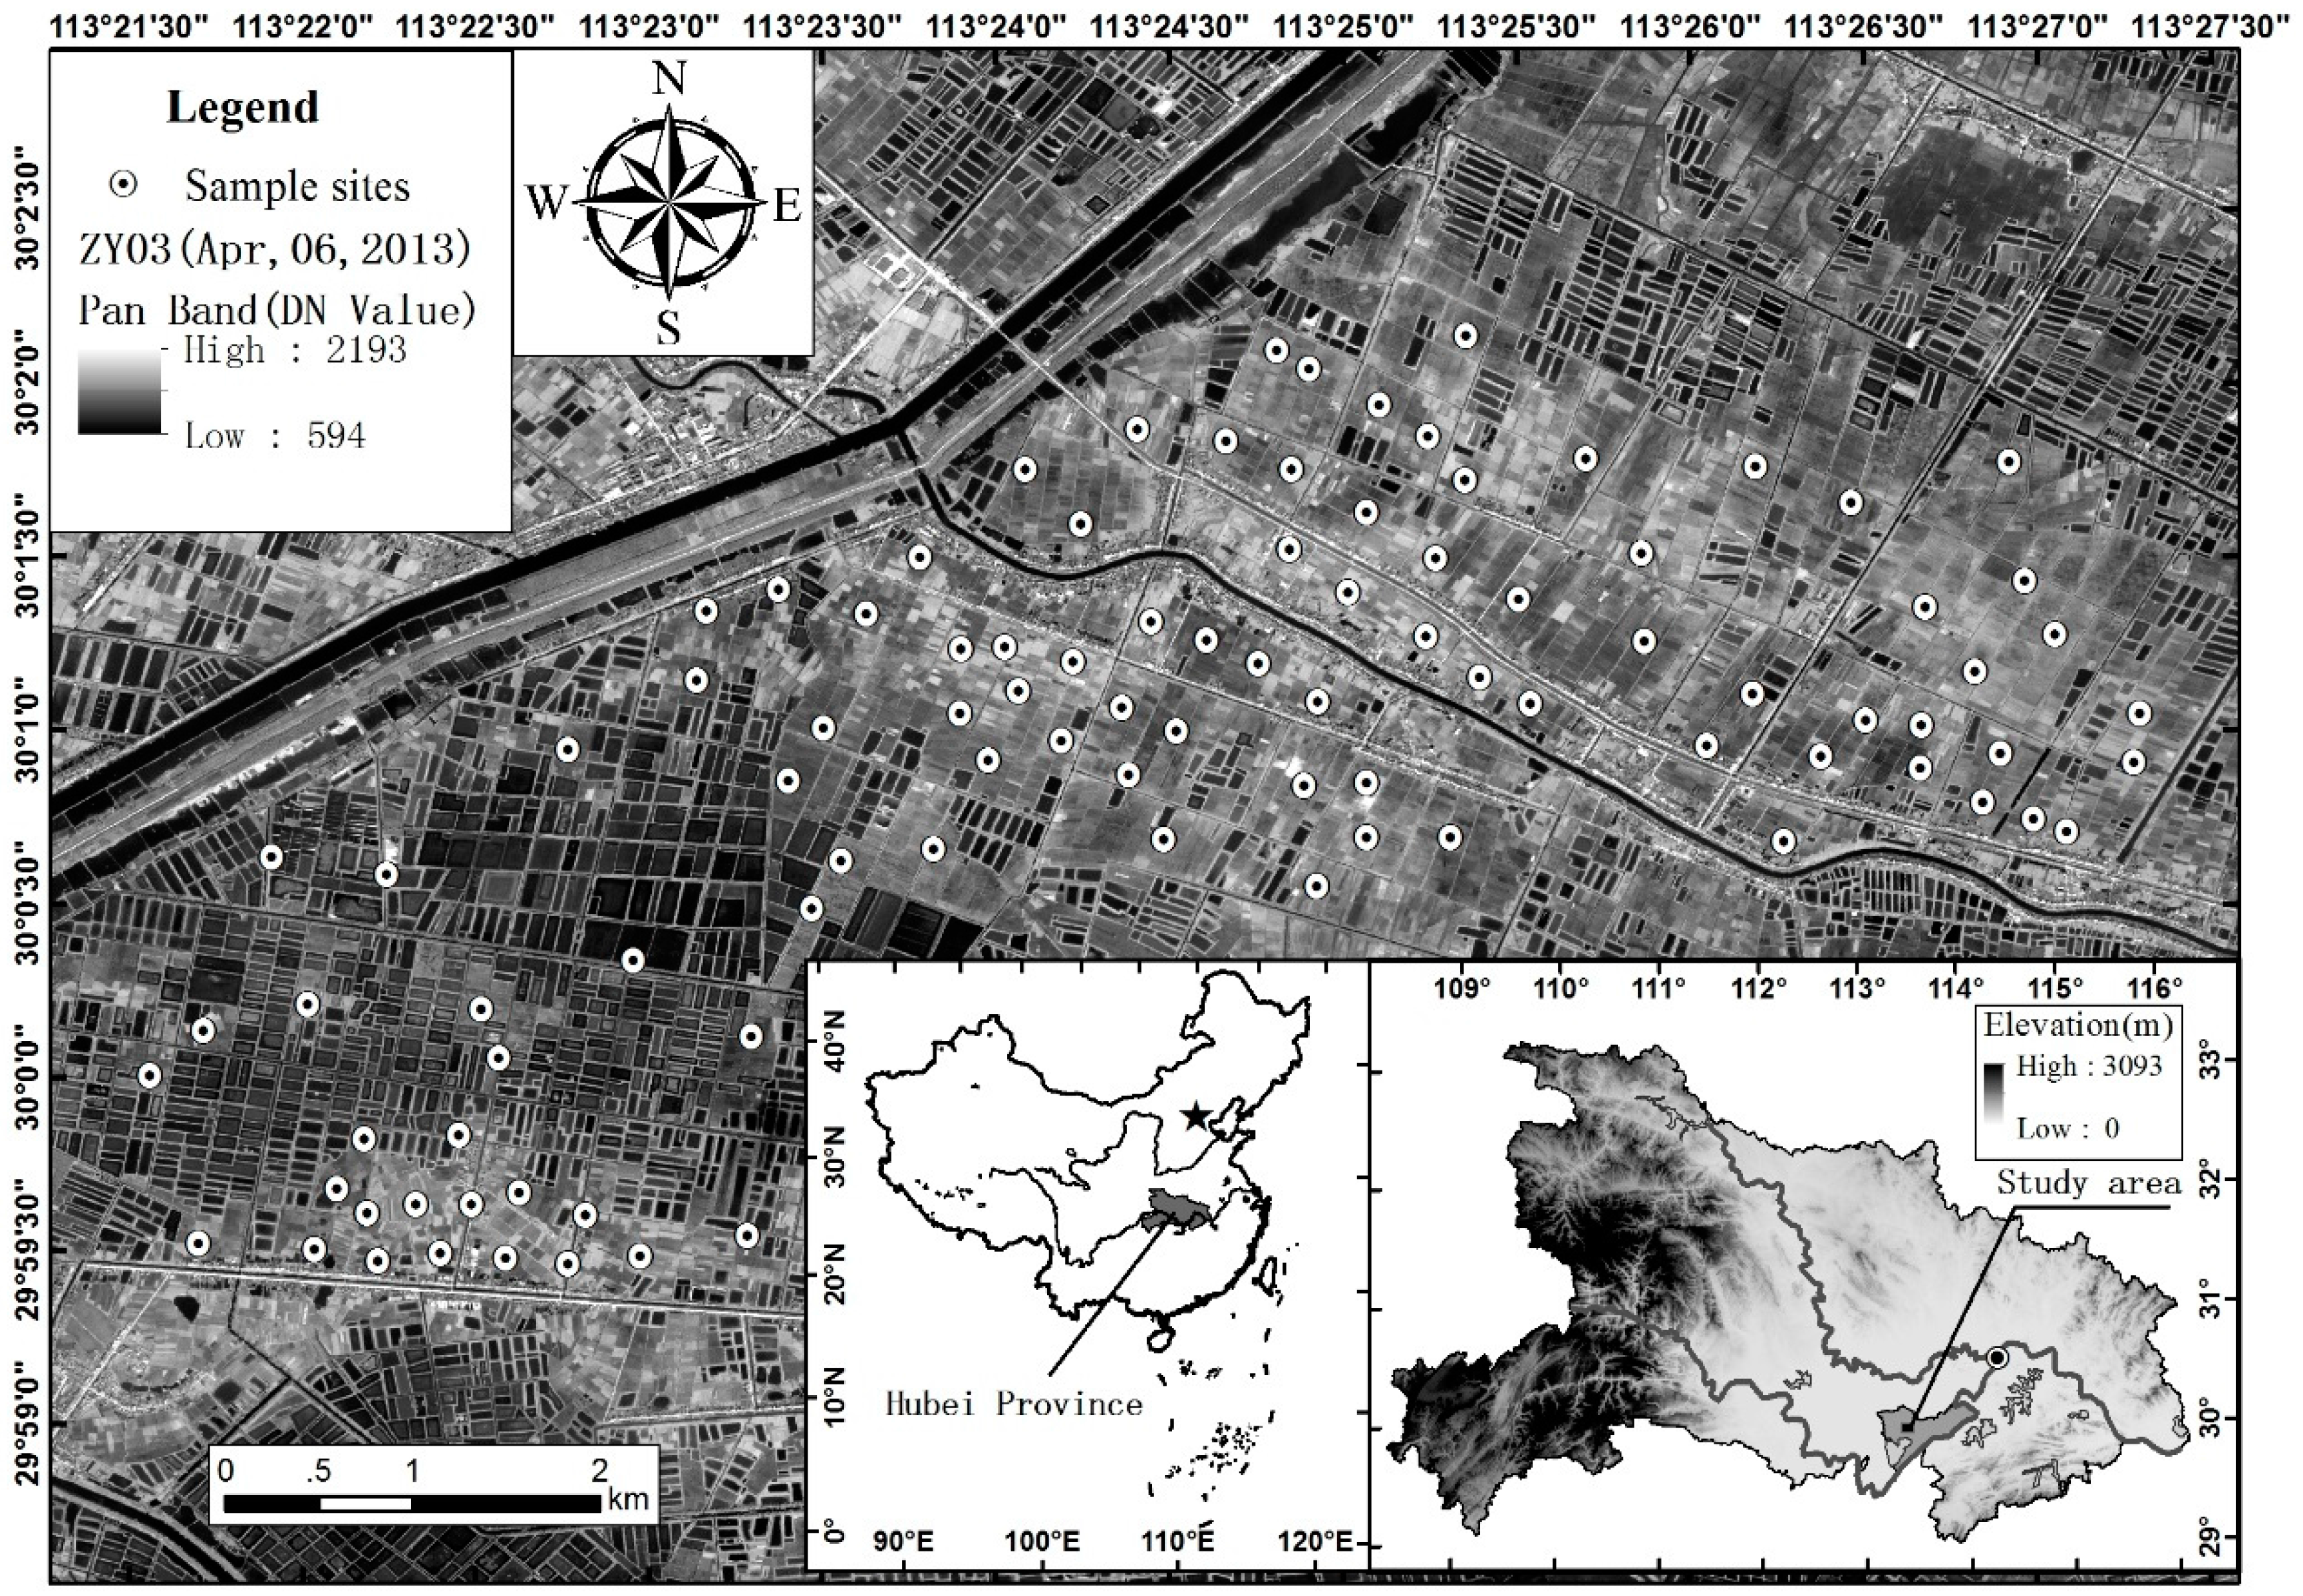
The study area was located in the Jianghan plain in Honghu City (Hubei Province, China) (
Figure 1), which has been known for its riparian landscape and dramatic changes in terms of land use and land cover since the 1950s [
17]. This area has a subtropical humid monsoon climate with an average annual rainfall of 1195.8 mm. The major land cover types are water bodies, lacustrine vegetation, floodplains, cropland, and open land [
18]. The topography is characterized by alluvial plains, and elevation ranges from 20 m to 50 m above sea level. With quaternary alluvial and lacustrine deposits, paddy and fluvo-aquic soils are considered the dominant soil types. The major cropland types are paddy field and irrigated cropland.
A total of 98 sampling sites were set in the winter of 2011 and spring of 2013, which represent most of the land-use and soil types of the study area. At each site, the surface soil samples (0–10 cm) were collected by mixing five sub-sampling points within a 5-m radius, and the central location was acquired using a hand-held Global Positioning System (GPS) with a positional error of <5 m. The shortest distance between each pair of sample sites was not less than 200 m. All the soil samples were placed into a tightly sealed plastic bag and taken to the laboratory for chemical analyses and spectral measurement.
2.2. Sample Rewetting and Laboratory Analyses
All samples were taken to the laboratory; air-dried, ground, passed through a 2 mm sieve, and placed in Petri dishes with a diameter of 12 cm and a depth of 1 cm. Soil samples were dried at 105 °C for 24 h, and then each sample was weighed using an analytical scale (accuracy of 0.01 g) to determine the oven-dried weight. The SOC content was determined using an elemental analyzer (Thermo Flash 2000, Waltham, MA, USA). The oven-dried soil samples were then rewetted to oversaturation (350 g to 400 g·water·kg
−1·soil). The samples were air-dried for 7 days at room temperature ranging between 18 °C and 22 °C [
19]. We finally obtained eight MCs for each sample.
2.3. Spectra Measurements and Pre-Processing
Spectral measurements were performed daily using an ASD FieldSpec 3 portable spectroradiometer (Analytical Spectral Devices, Boulder, CO, USA) with a range of 350–2500 nm. A standardized white Spectralon
® disc (Analytical Spectral Devices, Boulder, CO, USA) was used as the white reference. Samples were illuminated using a 50 W halogen lamp with a 45° incident angle. The spectra of soil samples were collected through the fiber probe at a distance of 15 cm from the sample surface and a viewing angle of 90° off nadir. To minimize the influence of external light, the spectral measurement was carried out in a dark room at night [
20]. Each sample was scanned 10 times, and the soil spectrum was obtained as the mean of 10 scans. Before developing SOC prediction models, a series of spectroscopic pre-processing algorithms (e.g., SG smoothing [
21], standard normal transformation [
22], multiplicative scatter correction [
23], and first derivative [
24]) with various parameters and their combination were tested to enhance the signal-to-noise ratio (SNR). Finally, as the optimal pre-processing transformation, the SG smoothing method with a window size of 15 and polynomial order of 2 was used to remove the noise in the MATLAB version 2013a (The MathWorks Inc., Natick, MA, USA). Spectral data with high SNR (in the region of 400–2350 nm) were used for model calibration.
2.4. Spectral Filter Algorithms
To remove MC effects, two filter techniques (OSC and y-gradient GLSW) were implemented and compared for their performance in SOC predictions. MATLAB version 2013a with PLS-Toolbox 7.9 (Eigenvector Research Inc., Wenatchee, WA, USA) was used to implement the OSC and GLSW algorithms. These techniques were applied to improve signal-to-noise ratio and remove interferences of irrelevant variables as follows:
- (1)
The OSC algorithm, which was first proposed by Wold [
25], was operated by identifying the directions that accounted for a large proportion of the variance of independent variables (
X-block) while being orthogonal to dependent variables (
Y-block). Details of this filter algorithm can be found at Liu et al. [
26].
- (2)
GLSW technique was used to weigh down signals, which have been identified as interferences or differences among samples and should be the same [
27]. In the present study, GLSW was applied to arrange the MC correction. GLSW helped weigh down the differences and improve the similarity of the spectra of the same sample at different MCs.
X-block variance was identified for down-weighting by using a sorted list of reference values. Samples with similar values were expected to have similar responses (
X-block rows). The difference among proximate samples was determined by calculating the derivative and yielded a matrix that was used to calculate the covariance matrix for down-weighting. Then, the singular-value decomposition of the matrix produced the diagonal matrix of singular values. Next, a weighted and ridged version of the singular values was calculated. Finally, the inverses of these weighted eigenvalues were used to calculate the filtering matrix. The filtering matrix was used on the original training data prior to model calculation and any future data prior to application of the regression model. In all of the cases, the default algorithm for GLSW has a single adjustable parameter, α, which defines how strongly the GLSW weighs down interferences [
28]. Adjusting α towards larger values (typically above 0.001) decreases the effect of the filter. Smaller α values (typically 0.001 and below) apply more filtering.
2.5. Model Calibration and Validation
PLSR has been used for model calibration in this study. PLSR was developed by Wold et al. [
29] and has become a routine modeling technique for quantitative analysis of VIS-NIR spectra [
30]. PLSR, OSC-PLSR, and GLSW-PLSR models were calibrated according to the three spectral transformation strategies, namely, SG smoothing, SG smoothing followed by OSC, and GLSW, respectively. Leave-one-out cross-validation was used to determine the optimal number of latent factors in PLSR. PLS toolbox version 7.3.1 (Eigenvector Research, Manson, WA, USA) was utilized for model calibration and validation.
A robust principal component analysis (PCA) method was applied to eliminate the spectral outliers [
31]. Retained samples were used for the subsequent analysis. The complete soil samples were divided into two datasets, namely, A and B, on the basis of the sorted SOC content. We sorted the samples in an ascending order. Starting from the second sample, we selected 32 samples at an interval of two samples and placed them in dataset B. We then included the remaining samples in dataset A (63 samples). Finally, we used dataset A to calibrate the models and dataset B to validate the calibrated models. Eight moisture levels were present in each dataset. To investigate the influence of MC on VIS-NIR reflectance spectra and prediction of SOC content, three model validation strategies (S1, S2, and S3) were adopted:
S1 was the moisture levels’ validation. In process of air-drying, the evaporation capacity of every day was similar. Thus, as samples were air dried for 7 days, a total of eight levels of MCs were collected for all samples. S1 was used to study PLSR performance in evaluating SOC content with the same moisture level, which is calibration using dataset A with eight levels of MCs and validation using dataset B with the same moisture levels (i.e., with the same day of air-drying). PLSR models in 8 × 1 groups were calibrated using SG smoothed soil spectra.
S2 was the transferability validation, which was used to verify the transferability of PLSR model among different moisture levels. In S2, each of the eight moisture levels in dataset A was used for calibration. The remaining levels in dataset B were used for validation. In addition, three processing methods were presented for each dataset: SG smoothing, OSC, and GLSW. Thus, 8 × 7 × 3 groups of PLSR models were developed and used to investigate the transferability of PLSR models defined on one level of MC to the other levels for SOC prediction.
S3 was the mixed-moisture validation. Notably, the evaporation capacity of soil moisture varied and became complex for different soil types. In view of the influence of soil types, the mixed-moisture validation was used to test the “moisture-free” models, in which datasets A and B were randomly chosen from eight moisture levels. In this section, a total of 100 dataset groups were randomly selected to prove the rationale for the model. Thus, three pre-processing methods were implemented for each dataset, as follows: SG smoothing, OSC, and GLSW. From the three spectral pre-processing methods, a total of 100 × 3 groups of models (PLSR, OSC-PLSR, and GLSW-PLSR models) were developed, which were used to assess model performance while eliminating the influence of MC on spectral calibration models.
2.6. Model Performance Evaluation
Predictive performance for SOC was assessed by the coefficient of determination (
r2), root mean square error (
RMSE), and residual prediction deviation (
RPD) [
5].
RMSE was evaluated by Equation (1) while
RPD was deduced with Equation (2):
where
and
are the measured and predicted values of sample
i, respectively, and
n is the number of samples:
where
SD is the standard deviation of measured values.
The model with the highest
r2 and the lowest
RMSE is considered as the best model.
RPD is commonly used to investigate the prediction error with variation in the data, and a handful of attempts have been made to come up with good predictions of SOC [
32]. We adopted the five-level interpretations of
RPD provided by Viscarra Rossel et al. [
33]: excellent predictions (
RPD > 2.5); good (
RPD of 2.0 to 2.5); approximate quantitative predictions (
RPD of 1.8 to 2.0); possibility to distinguish high and low values (
RPD of 1.4 to 1.8); and unsuccessful (
RPD < 1.40).
2.7. Predictive Mechanism Exploration
To explore the predictive mechanism for the interference of SM, the correlations between the spectrally-active MC and SOC content were investigated. Furthermore, the important wavelengths for estimating SOC concentration in the local models were identified. On one hand, Pearson correlation coefficients and
p-values were calculated to characterize the relationships among SOC, MC concentrations, and the differently transformed spectra. On the other hand, the variable importance in the projection (VIP) was used to identify the important wavelengths used in the PLSR calibrations [
34]. If the VIP value for a specific wavelength was larger than 1, the spectral wavelength was then considered to be important as recommended in the literature [
35].
The Pearson’s r was calculated in MATLAB Version 2013a (The MathWorks Inc., Natick, MA, USA), while VIP values were calculated in the PLS toolbox version 7.3.1 software (Eigenvector Research, Manson, WA, USA).
3. Results
3.1. Soil and Spectral Properties
Using the robust PCA method, we identified three samples as outliers.
Table 1 shows the descriptive statistics of the SOC contents of the 95 soil samples. The SOC content for the whole dataset varies from 2.36 to 26.23 g·kg
−1 with an average value of 15.76 g·kg
−1 and a median value of 16.58 g·kg
−1. On the basis of the classification of the datasets, we obtained a relatively equal distribution for the three dataset groups with a similar SOC range, which elicit a negatively skewed distribution. The skewness of each dataset was −0.20. The characteristic statistics of the calibration and validation datasets were similar to that of the whole dataset, which means that the calibration and validation datasets effectively represent the whole dataset.
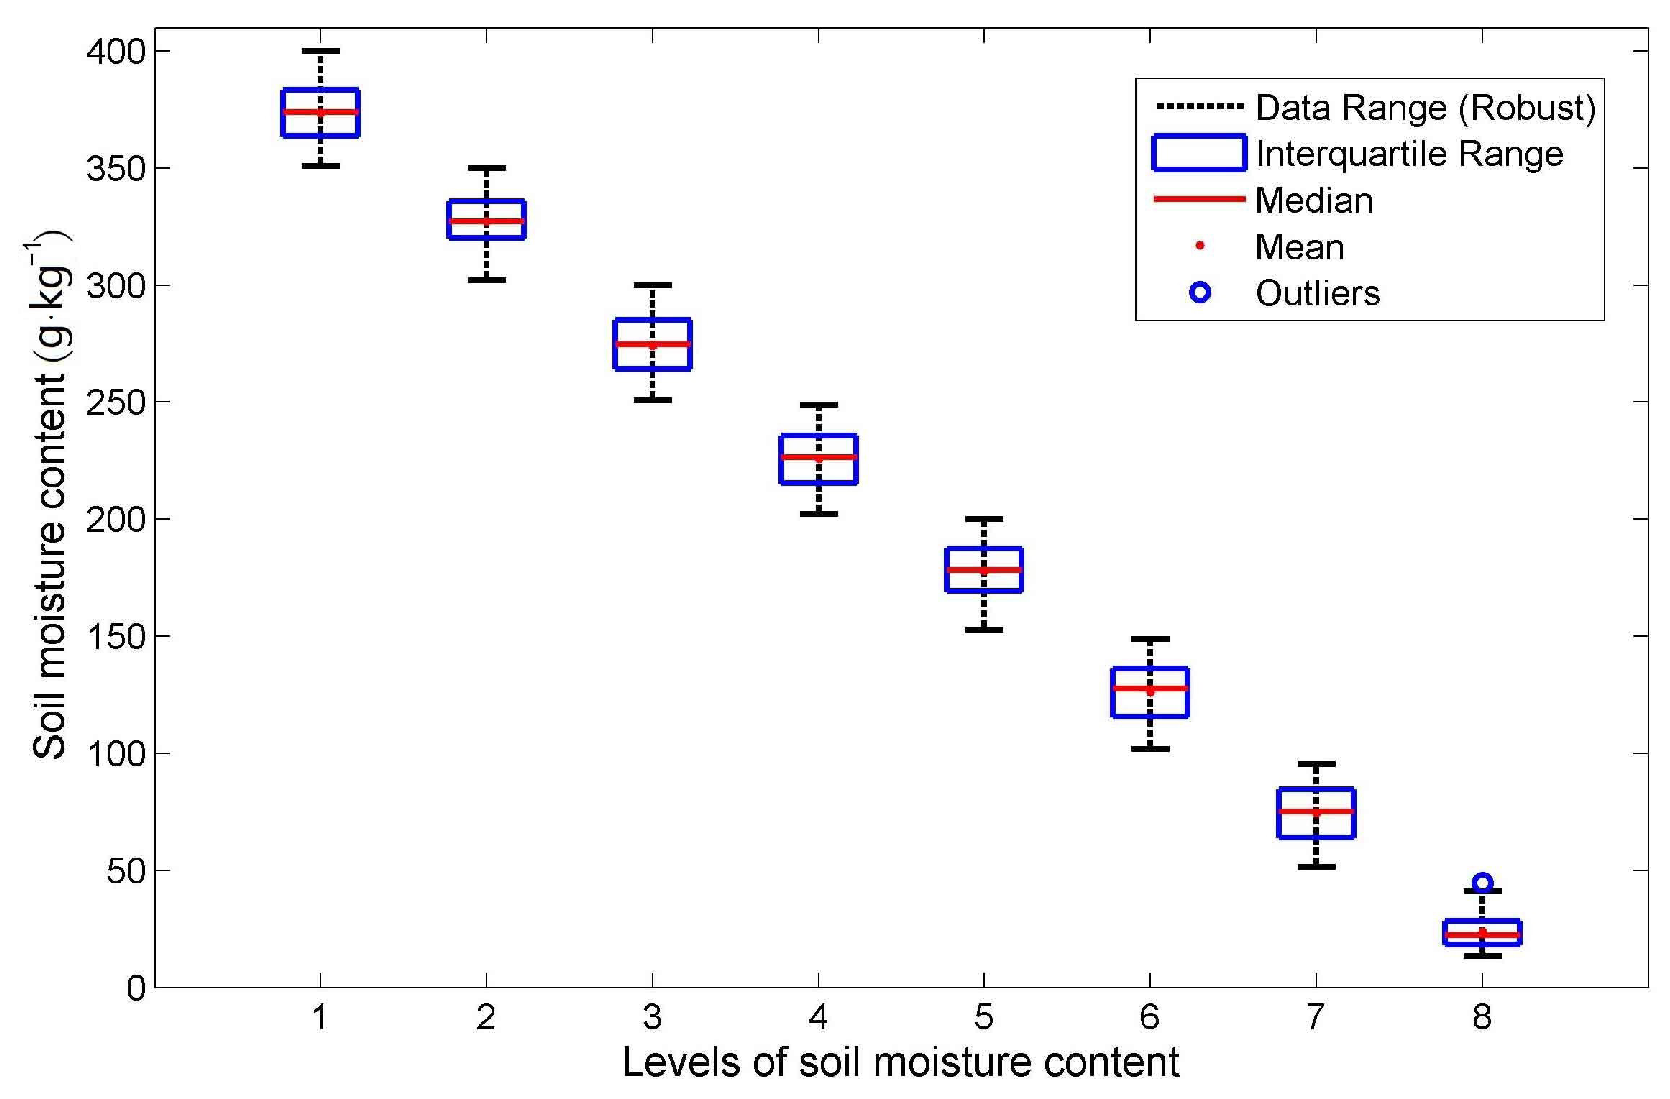
A box plot was utilized to show the distribution range of the MC for the rewetted samples (
Figure 2). During pre-processing, all of the samples were subjected to the same processes: oven-drying, weighing, rewetting, and air-drying. Notably, the daily evaporation rate for each sample was similar. We finally obtained eight levels of MCs for all samples: 350–400, 300–350, 250–300, 200–250, 150–200, 100–150, 50–100, and 0–50 g·kg
−1. Similar data distribution characteristics were found among different MC levels with the mean value of MC keeping pace with the median value. The results of mathematical statistics are a good representation of the operational situation [
26].
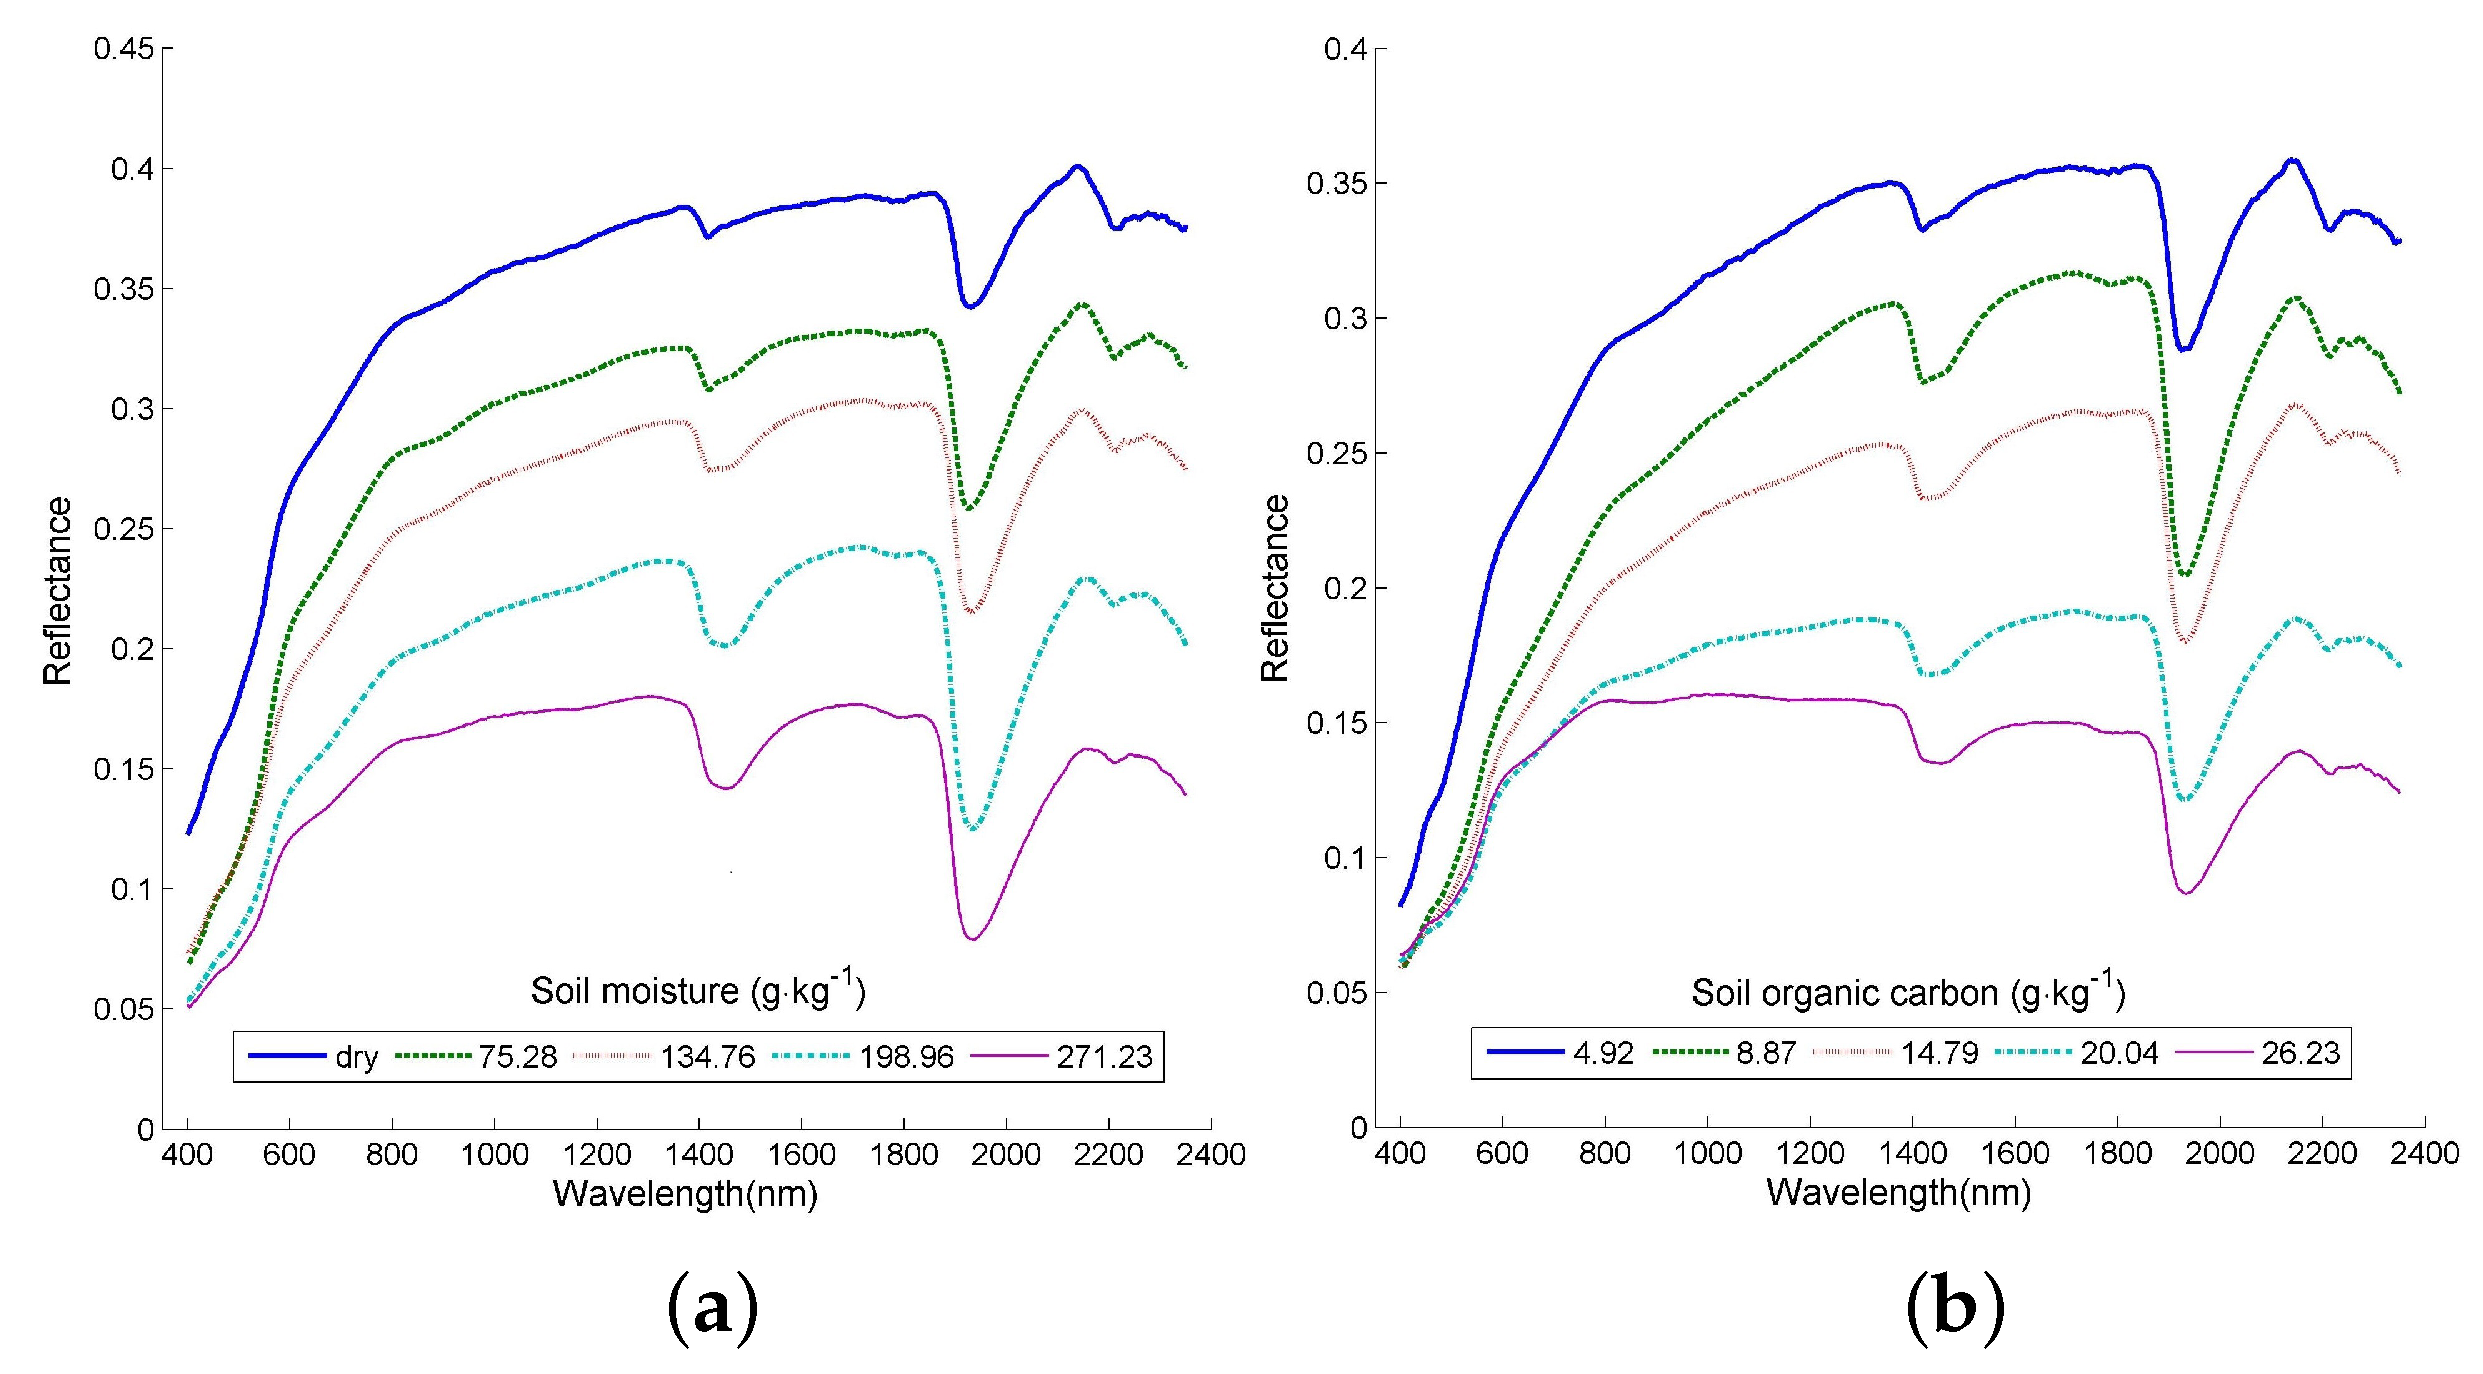
To analyze the influences of MC and SOC content on the soil spectra, the spectral reflectance of soil samples with two single variable conditions (take MC of 150 g·kg
−1 and SOC content of 16.86 g·kg
−1, for example) are shown in
Figure 3. The higher reflectance is associated with lower SOC content almost for the entire spectral ranges (400–2350 nm) under the same MC of 150 g·kg
−1. Three prominent absorption peaks around 1420, 1950, and 2200 nm are present (
Figure 3b). Likewise, the reflectance decreases with increasing MC with the same SOC content of 16.86 g·kg
−1 (
Figure 3a). Obviously, MC and SOC have similar effects on soil spectral reflectance, and moisture can mask the above changes of spectra caused by SOC content. Thus, owing to the interaction effects of MC and SOC on soil spectra, the difference in the MC may disturb SOC prediction, as proven in a similar study [
14].
3.2. Prediction of Soil Organic Carbon Content at Eight Moisture Levels
Table 2 shows the calibration, cross-validation, and validation results of the PLSR models defined on soil samples with eight levels of MC. The PLSR models for SOC generated
r2cal values of 0.82–0.96 with
RMSEC ranging from 1.26–2.62 g·kg
−1 and
r2cv values of 0.67–0.83 with
RMSECV ranging from 2.55–3.59 g·kg
−1. When the PLSR models were used for predicting SOC content with dataset B (corresponding validation strategy of S1), similar results were obtained for most moisture levels (
r2pre = 0.725–0.853,
RMSEP = 2.49–3.36 g·kg
−1), except for the MC of 50–100 g·kg
−1 (
r2pre = 0.632,
RMSEP = 3.96 g·kg
−1) and 150–200 g·kg
−1 (
r2pre = 0.58,
RMSEP = 4.11 g·kg
−1). In terms of
RPD, excellent predictions were obtained with the MC of 300–350 and 350–400 g·kg
−1 (
RPD = 2.55, respectively). Good performances were obtained with the MC of 100–150 and 250–300 g·kg
−1 (
RPD = 2.14 and 2.21, respectively). Approximate quantitative predictions were obtained with the MC of 0–50 and200–250 g·kg
−1 (
RPD = 1.89 and 1.95, respectively) and possibility to distinguish high and low SOC contents with the MC of 50–100 and 150–200 g·kg
−1 (
RPD = 1.55 and 1.61, respectively). Overall, these results emphasized that separate models generated from samples with different MCs have substantial ability to predict SOC content.
3.3. Transferability Verification of Soil Organic Carbon Models
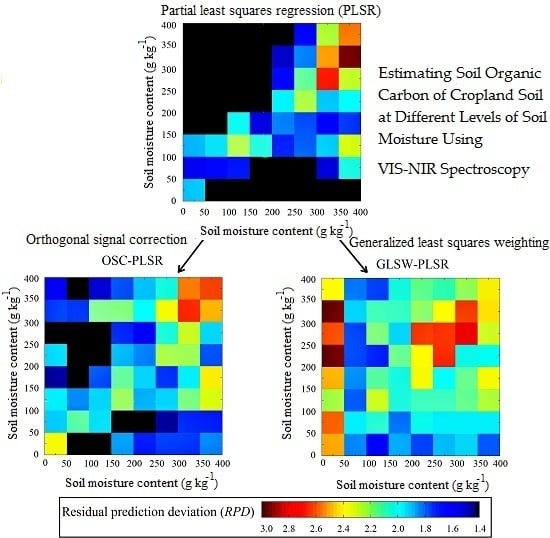
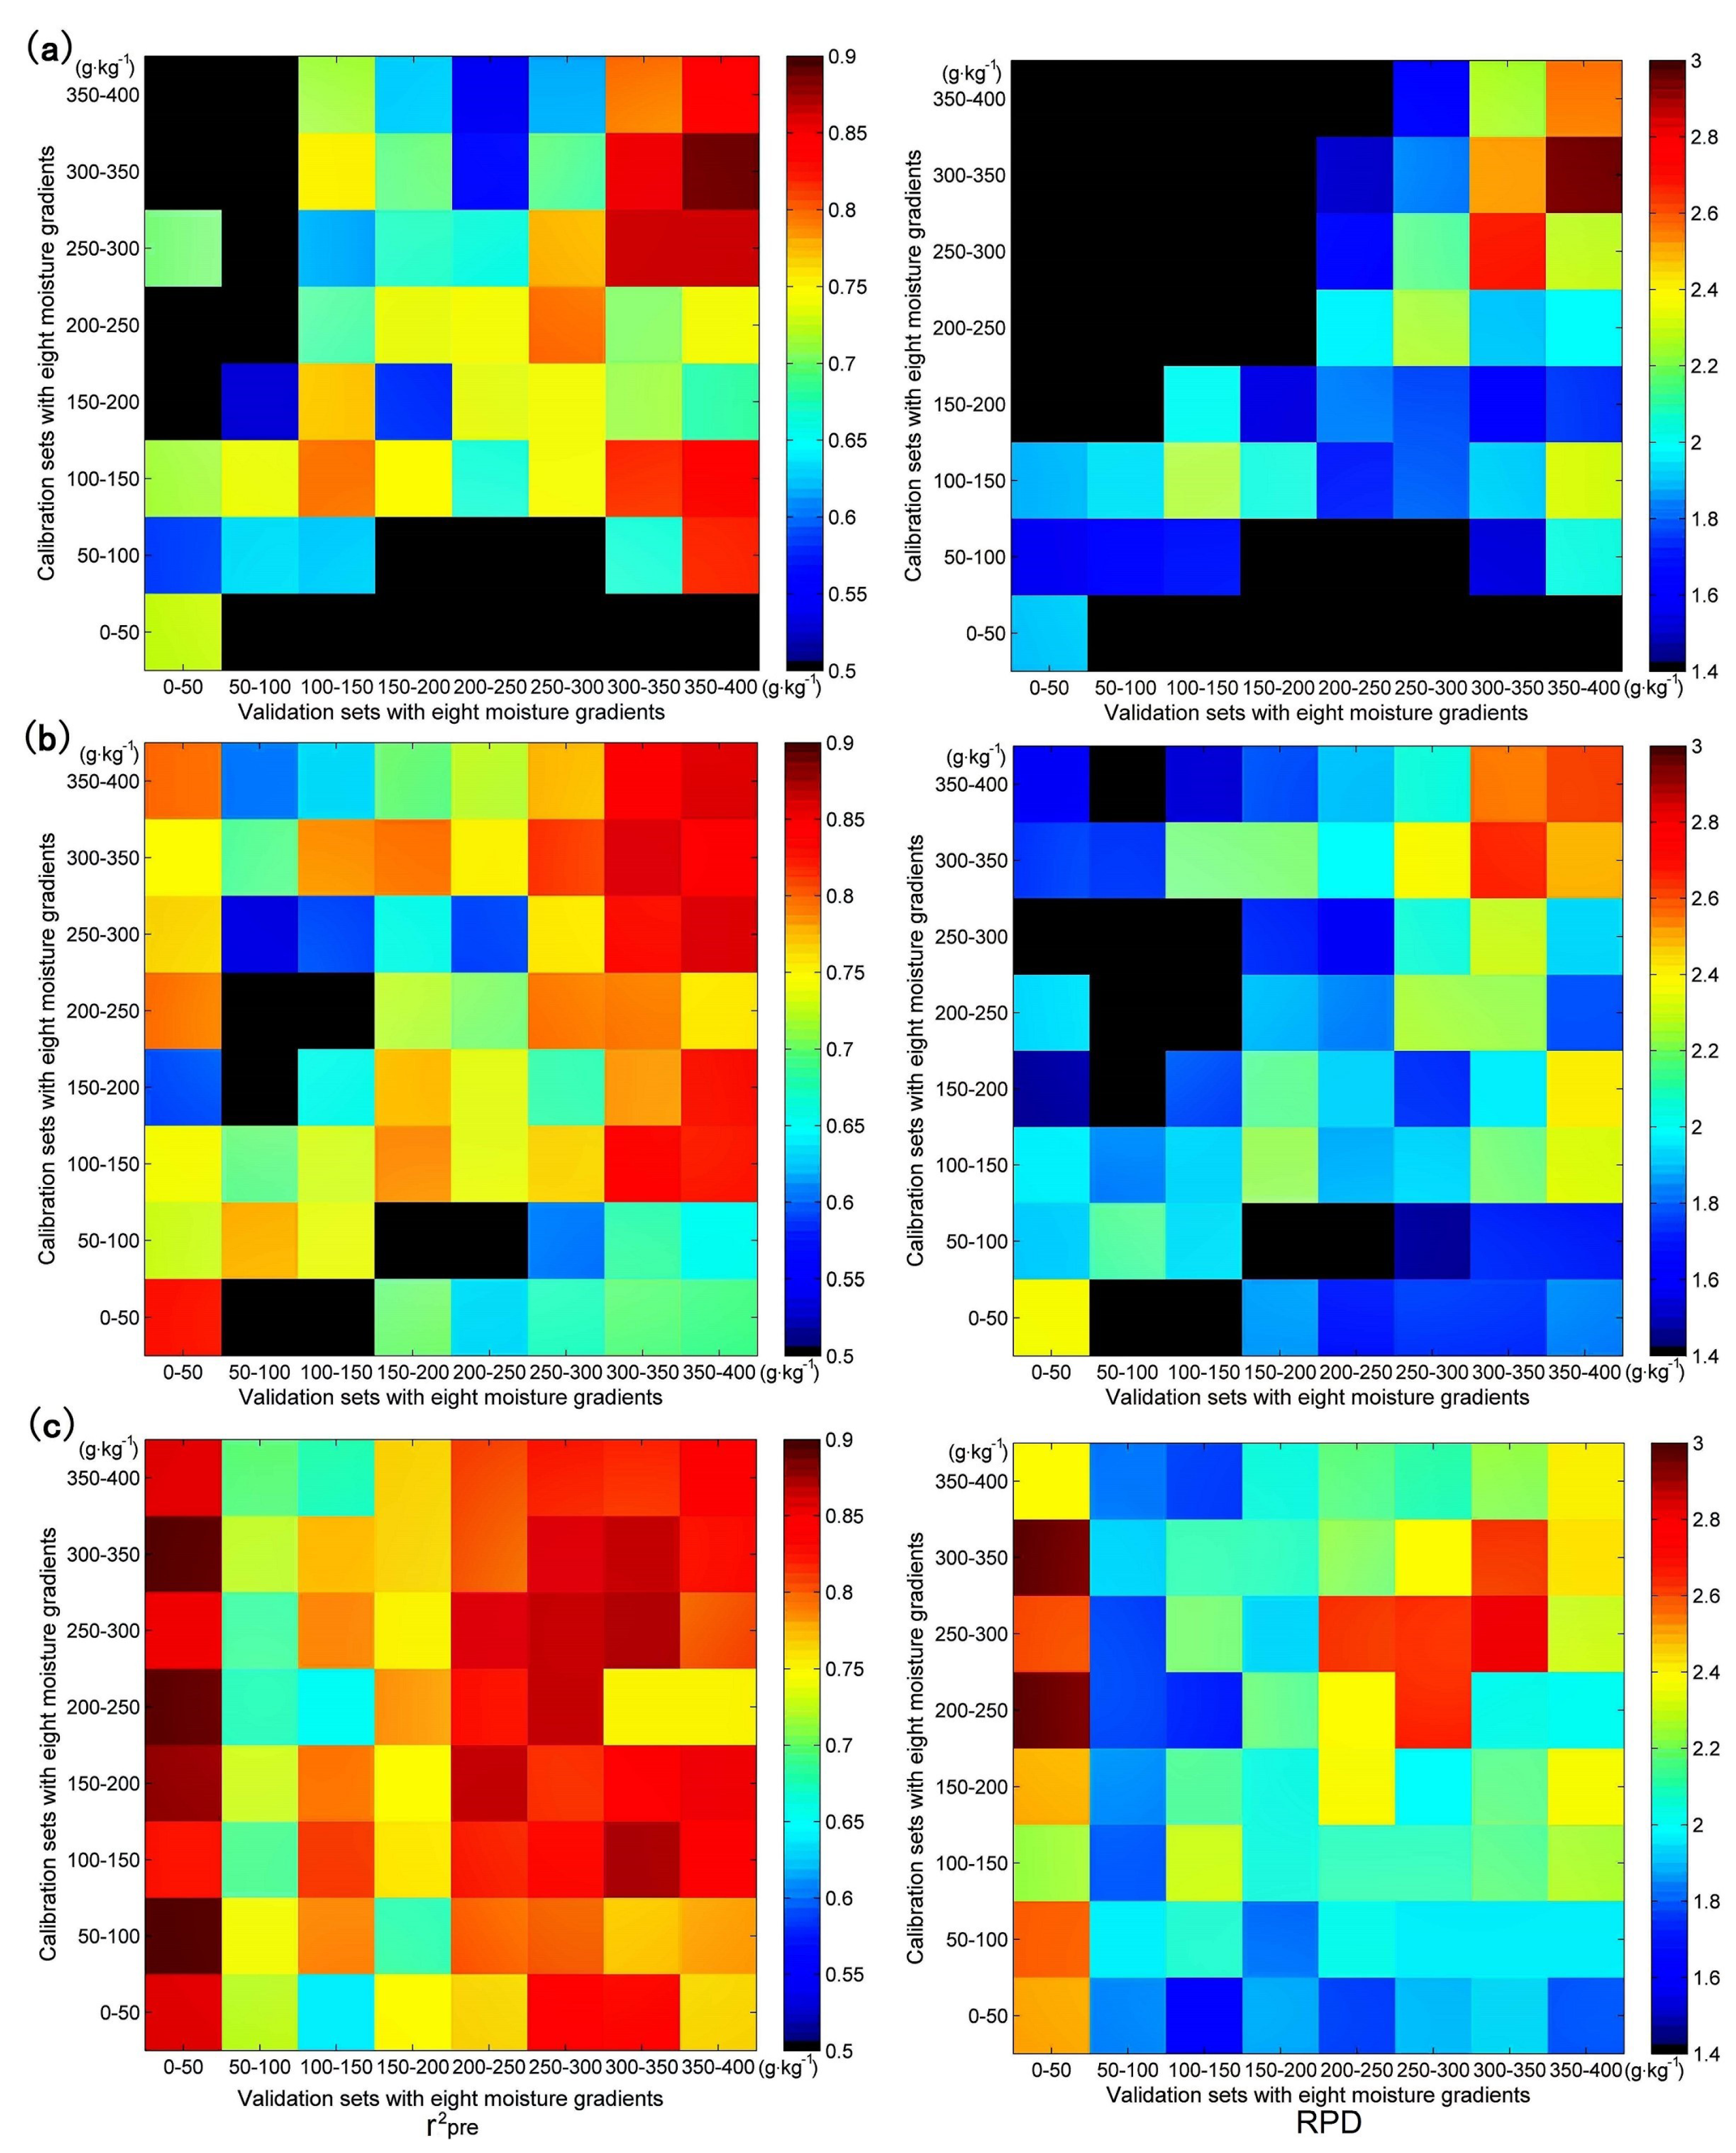
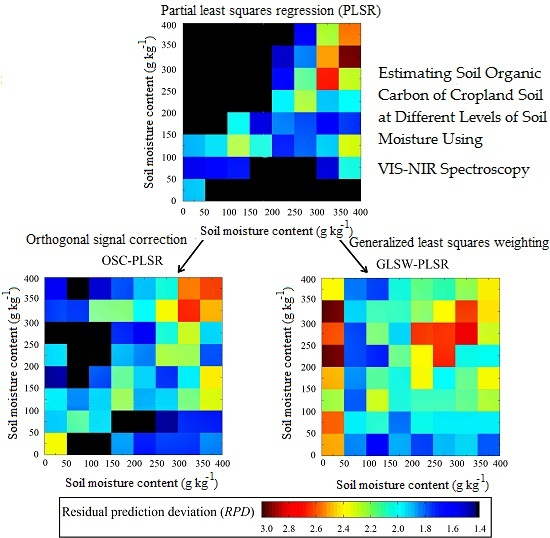
For validation strategy S2,
r2pre and
RPD matrices were calculated to verify the transferability of PLSR, OSC-PLSR, and GLSW-PLSR models in estimating SOC and are mapped in
Figure 4. The colors scaled from dark blue for low values to dark red for high values, and the higher values identified more efficient transferability. Moreover, the black ramps indicated an unsuccessful transferability (
r2pre < 0.5,
RPD < 1.4).
Figure 4a illustrates the transferability of PLSR models. The validation results of PLSR models showed low quality predictions when calibrations were applied to predict other different moist samples. More than half of the models could not be transferred (
RPD < 1.4,
r2pre < 0.5). This information indicates the effects of MC on the transitivity of model in the prediction of SOC. In terms of
r2pre, for the samples with MC of 100–150 g·kg
−1, reasonable estimates (
r2pre = 0.67–0.84,
RPD = 1.65–2.29) were obtained across the full range (0–400 g·kg
−1) of soil moisture tensions. However, this phenomenon could not be replicated in the other levels of MC. In particular, the VIS-NIR spectra calibrated using air-dried samples cannot be used for the humid soil prediction of SOC at
r2pre < 0.5 and
RPD < 1.4. This finding is indicated as black ramps in
Figure 4a. These results suggested that including a wide range of water contents in the calibration set could address the moisture variation issue [
15].
Figure 4b illustrates the transferability of OSC-PLSR models. According to the validation results, the transferability of the OSC-PLSR model for SOC defined in soil with different MCs was improved within limits. About one-fifth of OSC-PLSR models could not be transferred (
RPD < 1.4,
r2pre < 0.5). The transferability of GLSW-PLSR models is illustrated in
Figure 4c. All models generated from the samples with different MCs demonstrated successful transferability (
RPD ≥ 1.4,
r2pre ≥ 0.5) without the black ramp in
Figure 4c, which means that the GLSW filter algorithm could significantly remove the effect of MC from VIS-NIR spectra for the calibration of SOC content.
3.4. Performance of the Mixed-Moisture Models
The developed mixed-moisture models were verified on the basis of the validation strategy, S3, in which calibration and validation samples were randomly chosen from eight moisture levels. To facilitate comparison and analysis among PLSR, OSC-PLSR, and GLSW-PLSR models, the mean and standard deviation of the results were calculated and summarized, as shown in
Figure 5 and
Figure 6.
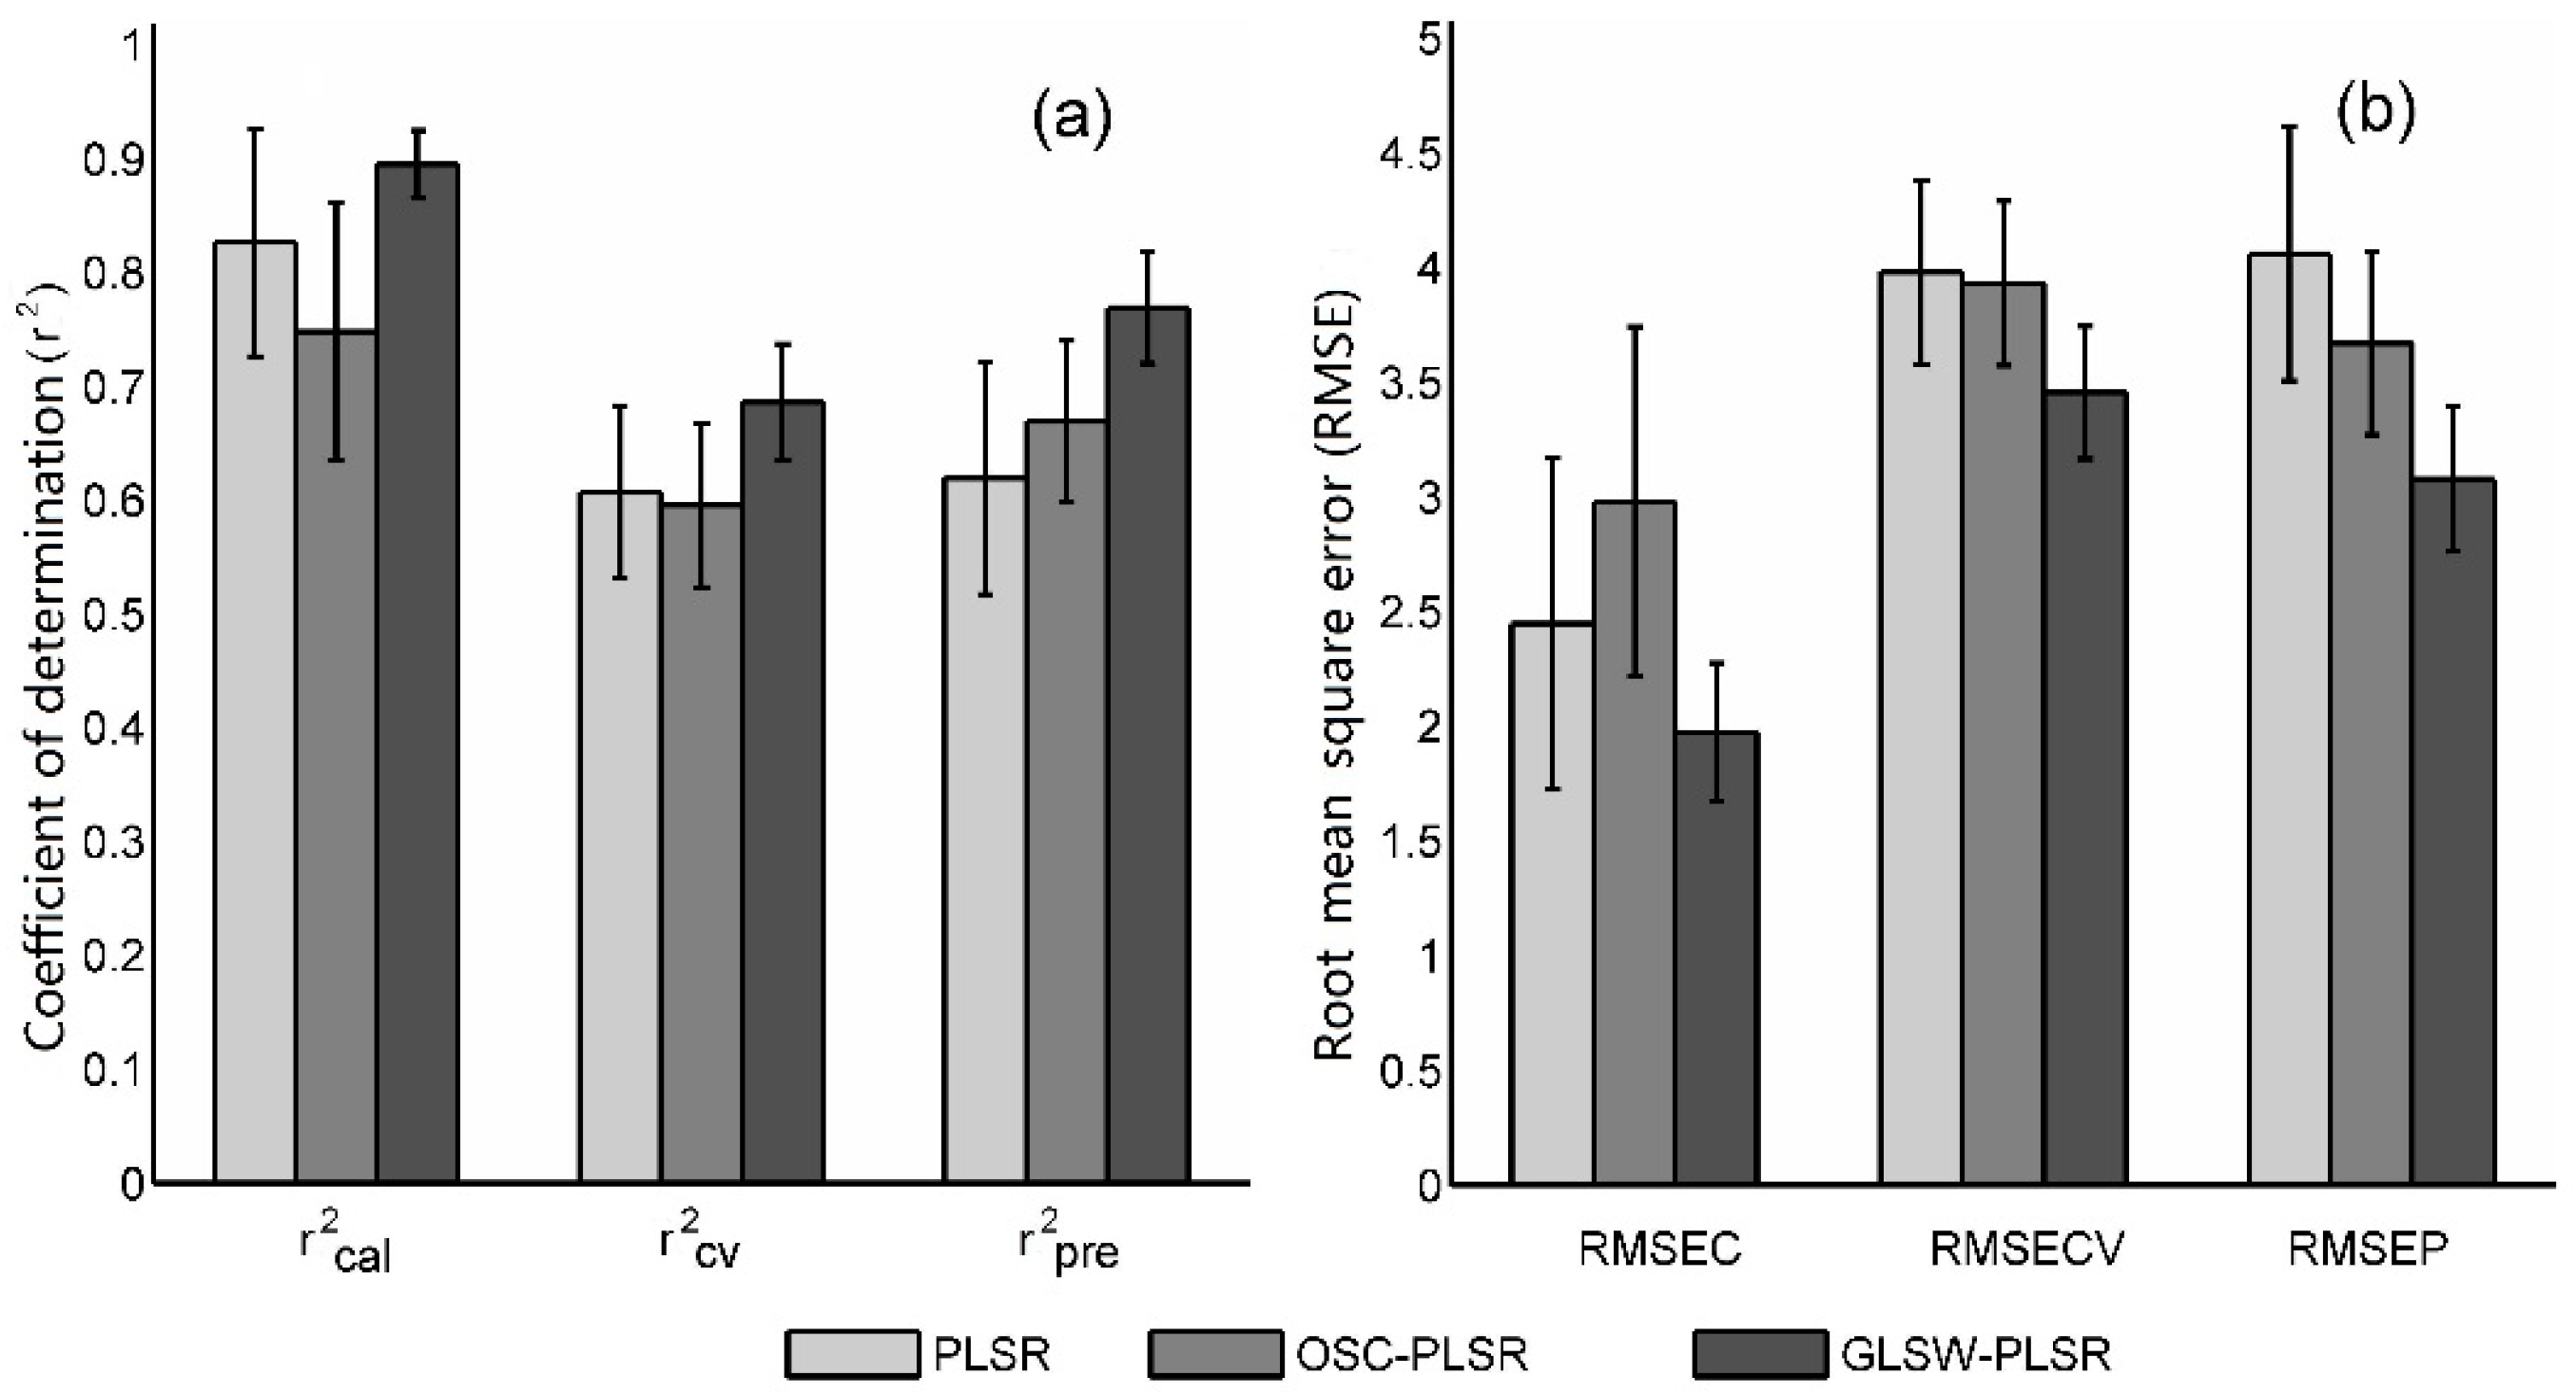
After calculation, the performance of the three mixed-moisture model groups (PLSR, OSC-PLSR, and GLSW-PLSR) produced obvious differences (
Figure 5). In terms of calibration and cross validation performance, the PLSR method showed moderate results (mean of
r2cal = 0.83, mean of
RMSEC = 2.45 g·kg
−1, mean of
r2cv = 0.61, and mean of
RMSECV = 3.98 g·kg
−1). Oddly, the result of the OSC-PLSR method was not efficient (mean of
r2cal = 0.75, mean of
RMSEC = 2.98 g·kg
−1, mean of
r2cv = 0.60, and mean of
RMSEC = 3.93 g·kg
−1). However, the GLSW-PLSR method showed a satisfactory result as expected (mean of
r2cal = 0.90, mean of
RMSEC = 1.97 g·kg
−1, mean of
r2cv = 0.69, and mean of
RMSECV = 3.45 g·kg
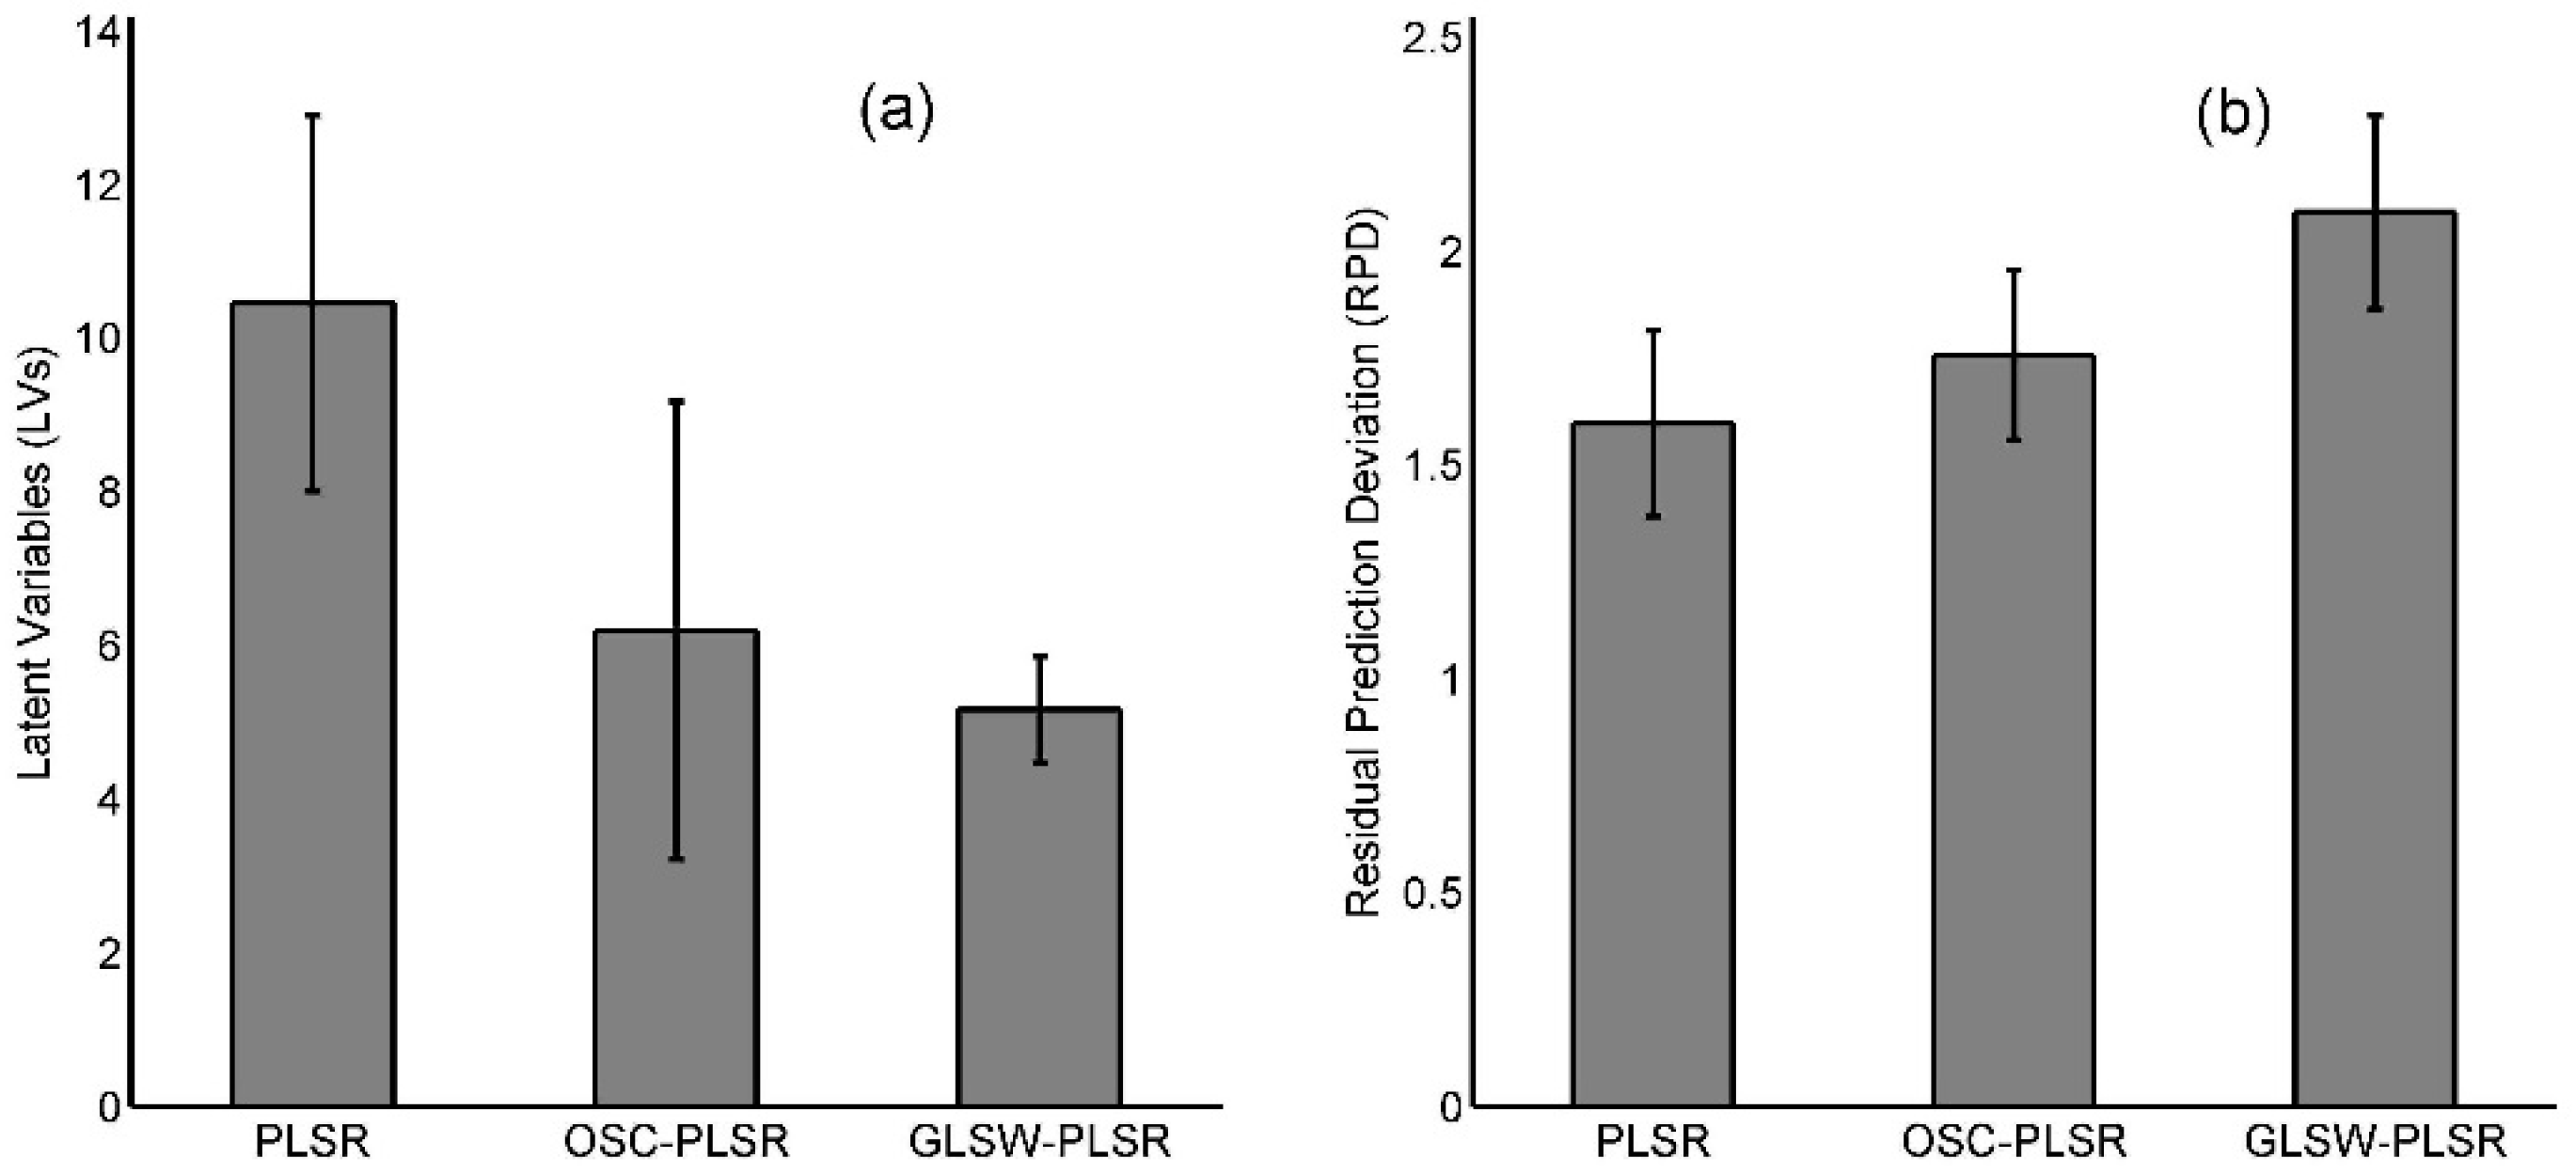
−1). The means of the optimal number of
LVs, as determined by leave-one-out cross validation for three models, were 10, six, and five (
Figure 6a), thereby indicating that moisture correction methods improved the compactness of the models.
According to the validation results, the three validation strategies showed a progressive increase of r2pre and RPD values and a decrease of RMSEP values. Specifically for the PLSR models, the mean of the r2pre, RMSEP, and RPD values were 0.62, 4.06, and 1.60, respectively, indicating generally fair predictions. However, the minimum r2pre and RPD values were 0.31 and 1.08, and the maximum RMSEP value was 5.90 g·kg−1. This finding denotes the limitations of PLSR model in predicting samples with varying MCs. Furthermore, the r2pre (0.31 to 0.83), RMSEP values (2.77 to 5.90 g·kg−1), and RPD (1.08 to 2.30) for the PLSR models dramatically varied, indicating unstable prediction ability. Therefore, OSC-PLSR and GLSW-PLSR models were used to remove MC effects in SOC predictions. The results obtained with OSC-PLSR method indicated its limited efficiency (mean of r2pre = 0.67, mean of RMSEP = 3.67 g·kg−1, and mean of RPD = 1.76) in removing MC interference. Thankfully, the minimum values of r2pre and RPD were fairly increased (r2pre = 0.51 and RPD = 1.42), showing potential to distinguish high and low SOC contents. OSC-LSR predictions were better compared with the predictions of the PLSR model. Furthermore, the predictions of GLSW-PLSR models were significantly increased. The mean values of r2pre increased to 0.77, and RPD increased to 2.09, whereas the mean value of RMSEP was reduced to 3.08 g·kg−1, thereby demonstrating good removal of MC interference. Moreover, the standard deviations of r2 and RMSE values performed from GLSW-PLSR models were lower than that of PLSR and OSC-PLSR models, which further proved the effectiveness of the GLSW-PLSR models. Overall, the results proved the efficiency of OSC-PLSR and GLSW-PLSR in removing MC effects on VIS-NIR spectroscopy estimation of SOC. GLSW-PLSR model performed better than OSC-PLSR model, which confirms that the quantitative prediction of SOC from soil samples with various MCs is possible.
3.5. Predictive Mechanism Analysis
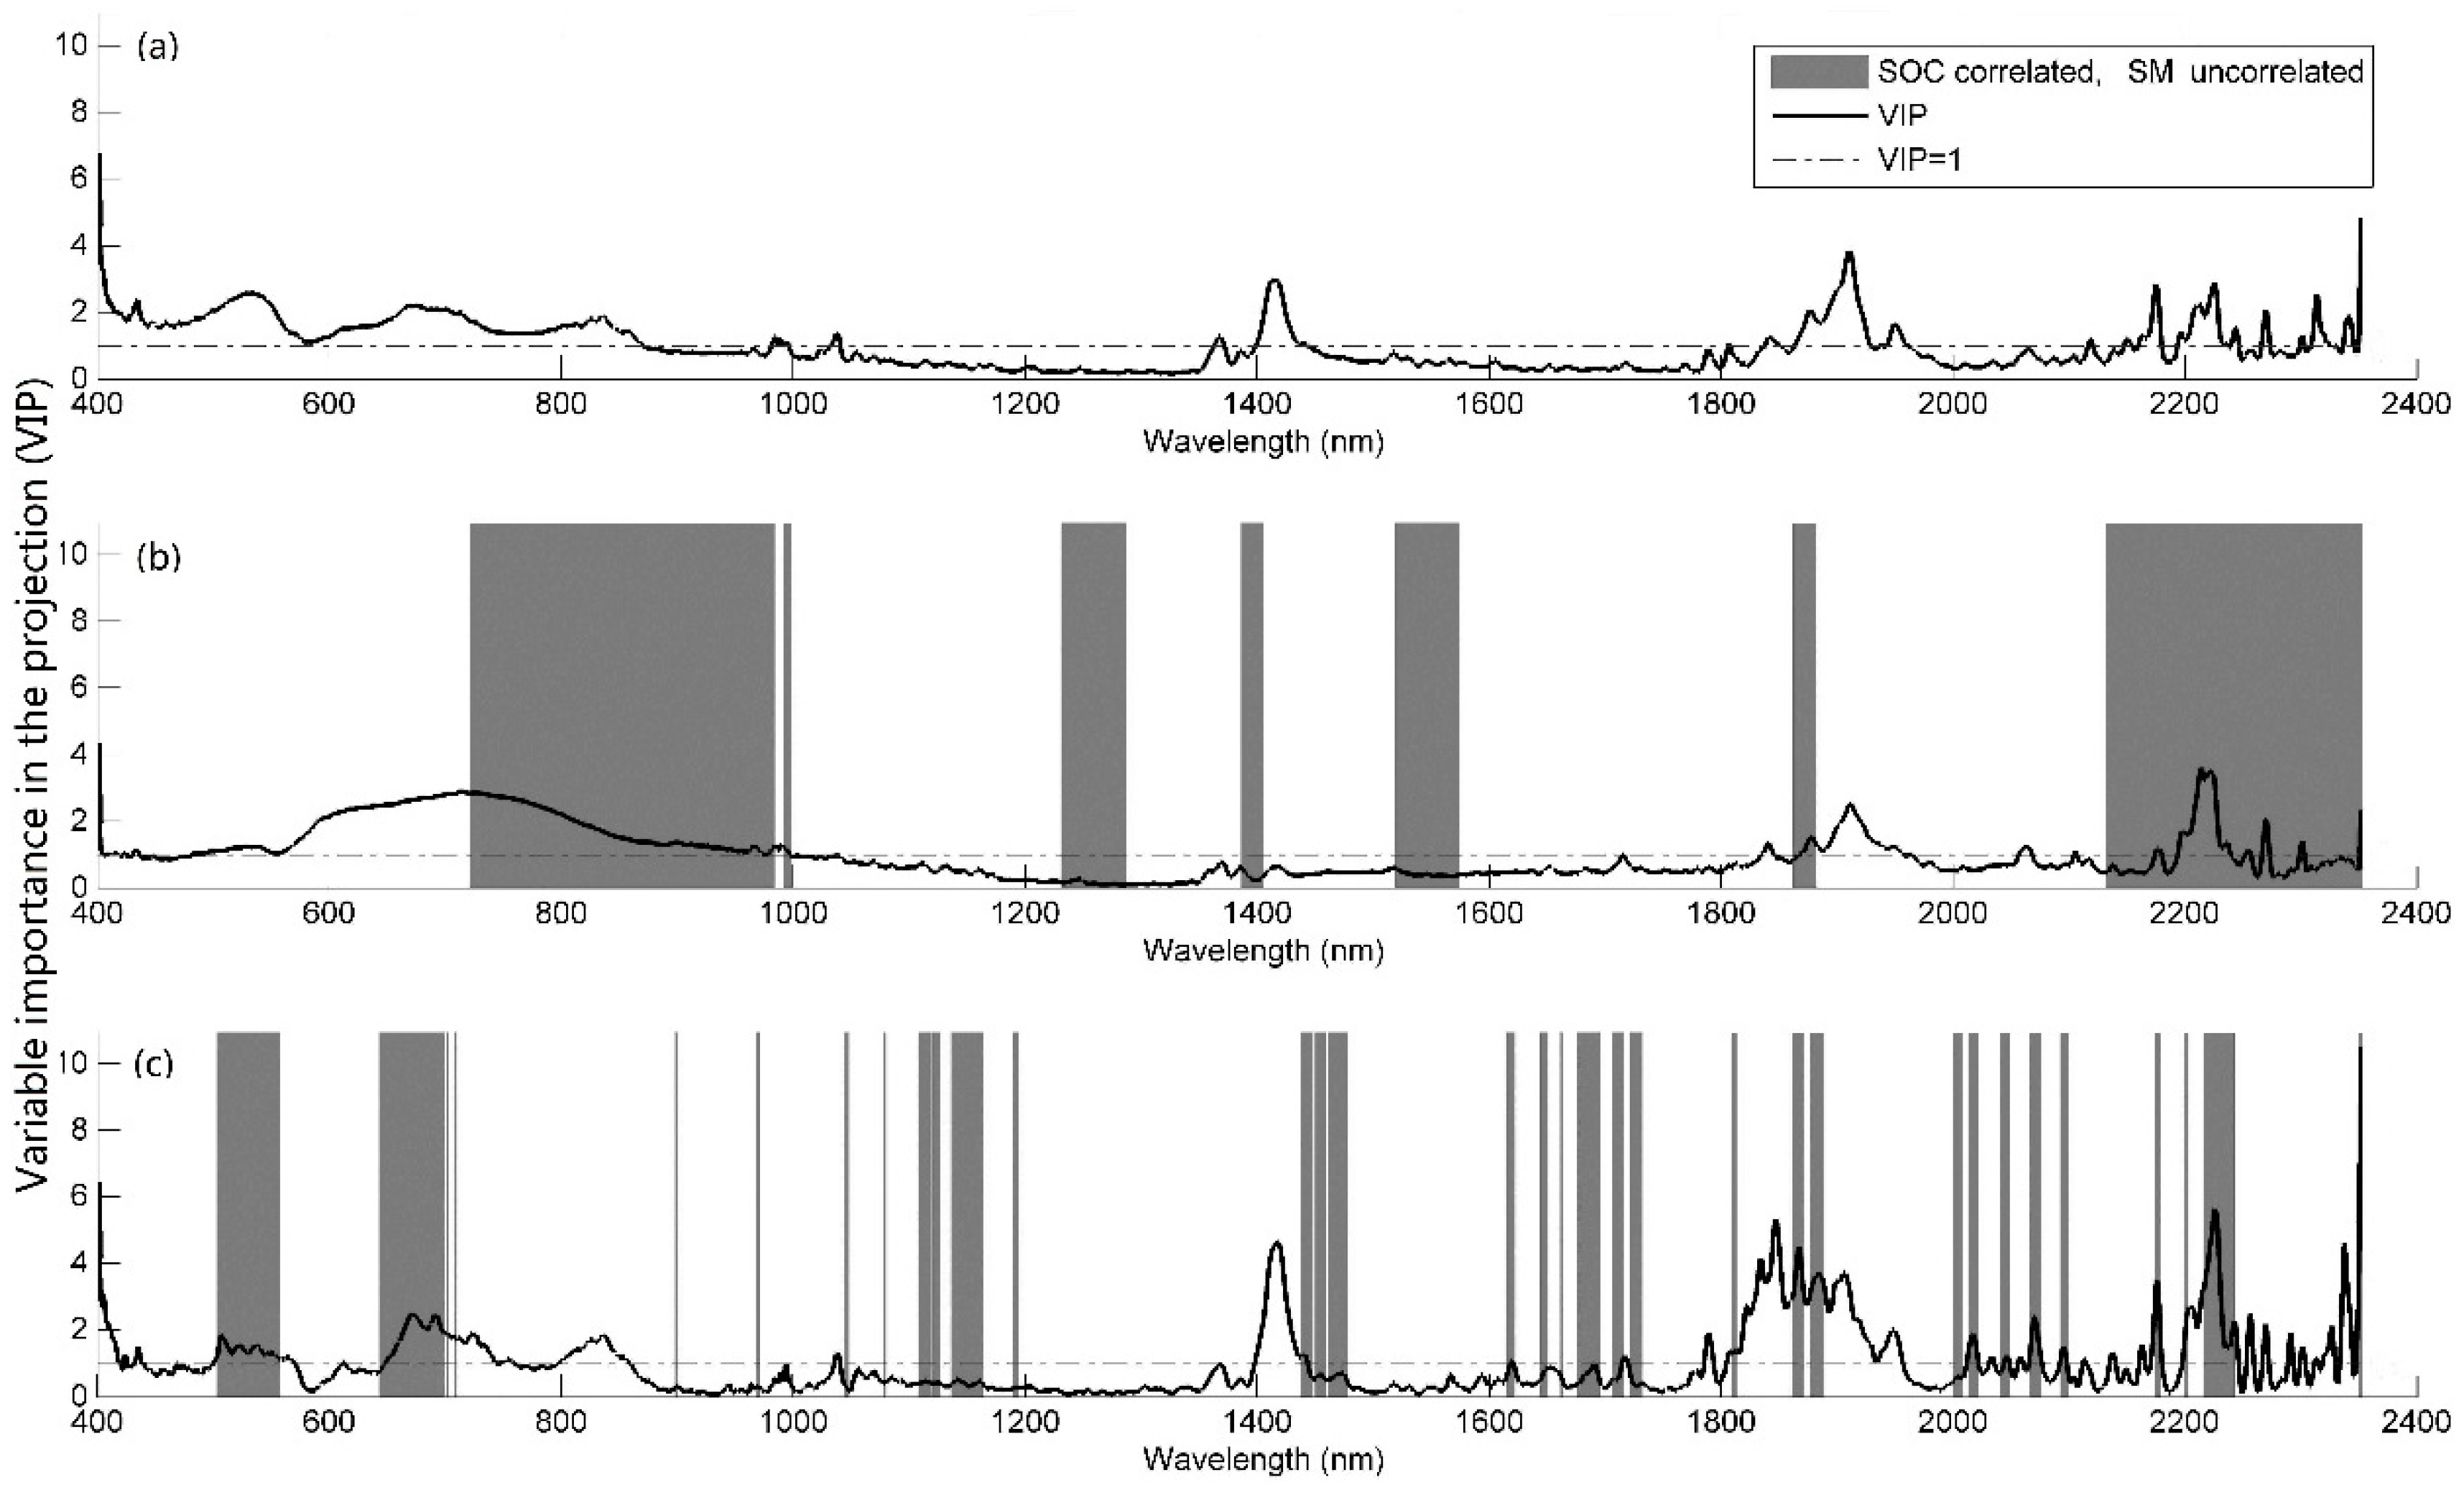
Figure 7 shows the analysis results of the predictive mechanism for the interference of MC. Those bands that were significantly correlated with SOC content and uncorrelated with MC were marked in gray (
p < 0.01). If the bands were located within the gray area, these bands were significantly correlated with the SOC but were not correlated with the MC at 99% confidence intervals. Otherwise, these bands would be seriously interfered by the MC in the SOC estimation.
From the perspective of Pearson correlations, all bands did not fall within the gray area after SG smoothing (
Figure 7a), which means that MC has serious interference in SOC estimation. However, when corrected by OSC (
Figure 7b) or GLSW (
Figure 7c) filter techniques, a series of special bands (e.g., near 520, 660, 820 and 2200 nm) that were significantly correlated with SOC and uncorrelated with MC were observed, which proved the superior potentials of the two correction methods in removing the influence of MC in SOC prediction. From the perspective of important wavelengths, some similar VIP curves were found on the three PLSR models. According to the VIP scores, longer wavelengths at 1420, 1900, 2220, and 2350 nm in the NIR region were identified as important wavelengths for SOC estimation. Approximate wavelength regions (around 1446, 1826, 2176, and 2366 nm) were also identified by Morra et al. [
36]. As for the visible region, a series of important wavelengths were also found at 520, 680 and 720 nm, which were similar to the findings of Krishnan et al. [
37], who indicated that wavelength regions near 564.4, 623.6, as well as 600–700 nm were important for organic matter prediction.
When jointed, the Pearson’s r with VIP values, a series of important wavelengths (VIP > 1) to estimate the SOC concentration were marked in gray, which indicated the high efficiency of pretreatment in removing the MC effect on the SOC estimation. From the analysis results in
Figure 7, OSC and GLSW-based models showed promising results because of the jointly important wavelengths, which were significantly correlated with SOC content and uncorrelated with MC. These jointly important bands would be considered promising results. Such joint wavelengths were considered as special meaningful bands that can be used to simplify SOC prediction models, whereas the general PLSR method employed the entire wavelengths containing a great deal of redundant information [
38]. Moreover, considering the distribution of joint wavelengths, GLSW-based models showed more accurate distribution of results than OSC-based models, which further proved the performance of the three models ranked as GLSW-PLSR > OSC-PLSR > PLSR.
4. Discussion
It is well-known that the SOC contents could be predicted using VIS-NIR spectra, because of the direct spectral response of the overtones and combinations of C-H, C=O, or O-H. When predicting the SOC contents of field soils, the accuracy of developed models would be inevitably affected by non-uniformed environment factors (e.g., MC, particle size, or surface roughness). As the main interference factor, soil MC was influenced by precipitation and evaporation, and thus showed a relatively dynamic characteristic. To reveal the influence of relative MCs on VIS-NIR reflectance spectra and prediction of SOC content, in this study, two moisture correction methods (i.e., OSC and GLSW filter methods) and three independent validation strategies were applied to quantify the effect of MC on the accuracy of SOC predictions. The ultimate objective was to develop a “moisture-free” model for VIS-NIR spectroscopy estimation of SOC.
In the current work, the models established on the basis of the samples with a similar MC level (e.g., 0–50 g·kg
−1, 50–100 g·kg
−1) can efficiently estimate SOC content. Mouazen et al. [
39] reported a similar result after grouping samples based on their reflectance at different MC classes. PLSR specifically showed a higher predictive ability of SOC at higher MCs, confirming the positive effect of rewetting on spectra for inferring SOC content [
40]. However, as described in
Section 3.3, PLSR models showed bad transferability in the prediction of SOC because of strong interferences of MC variations. Similar results were also found in the mixed-moisture models without any moisture correction. Such results may be explained by the fact that the PLSR model was a linear regression model used to quantify the relationship between spectral information and SOC content. The interference of the soil MC could not be eliminated in modeling. SG smoothing may not eliminate MC effect in essence, which further masks SOC information to a great extent. The fact that all the unstable factors in the field are difficult to control may influence MC and further degrade the ability of VIS-NIR spectroscopy for SOC estimation.
In terms of transferability of correction models, OSC-PLSR and GLSW-PLSR models had better transferability than PLSR models. In particular, the GLSW-PLSR correction method showed good transferability under all MCs. In addition, the performance of the mixed-moisture models can be ranked as follows: GLSW-PLSR > OSC-PLSR > PLSR. This ranking indicated that OSC- and GLSW- based models showed promising results and could effectively eliminate the effects of MC in estimating SOC. However, because of limited OSC components, the OSC algorithm can only remove parts of the signals that are unrelated (orthogonal) to
Y. In contrast, removing too many OSC components may result in erosion of the useful signal [
41]. Thus, the OSC algorithm does not significantly facilitate the prediction model. By contrast, GLSW uses the eigenvectors and eigenvalues of a covariance matrix to weigh down signal identified as interferences or differences among samples, which should otherwise be the same [
27]. GLSW-PLSR was proven to be a feasible and effective method to predict SOC independent of MC.
MC is a main limiting factor in using VIS-NIR spectroscopy for SOC inference. Some studies have been explored to remove the effect of MC on SOC estimation by VIS-NIR spectroscopy. It has been reported that spectral derivative transformation might not effectively remove the interference of MC because the decrease in reflectance with increasing MC is non-linear [
22]. Moreover, separate models generated from grouping samples by their MC could obviate the variations of moisture, for which the calibration set might not be large enough to be representative [
42]. Ji et al. [
43] demonstrated that the direct standardization (DS) algorithm could remove the effect of MC from field spectra, and DS-transferred spectra was nearly identical with the corresponding laboratory spectra. However, the preparation procedures (i.e., air-drying, grinding) of laboratory spectra were tedious and unachievable for in situ proximal sensing, especially for airborne/satellite imaging spectroscopy. Moreover, it was worth noting that not all dry samples might yield better prediction results according to this study. Thus, it was necessary for removing the interference of relative MCs. Furthermore, several studies have shown that outdoor and airborne/satellite imaging spectroscopy can potentially estimate soil properties [
30,
44]. The normalized soil moisture index (NMSI) was developed by Haubrock et al. [
45] as a proxy of soil MC. In future studies, based on NSMI, the potentials of OSC and GLSW algorithms in the removal of moisture interference may be validated for outdoor and airborne/satellite imaging measurement.
This study demonstrated the potentials of two moisture correction methods (i.e., OSC and GLSW filter methods) in removing the influence of relative MCs on VIS-NIR spectroscopy in SOC determination in the laboratory. This is an important finding for proximal soil sensing application in soil properties measurement.
5. Conclusions
In the current work, three independent validation strategies, namely moisture levels validation, transferability validation, and mixed-moisture validation, were tested to examine the performances of filter methods. The principal results obtained can be summarized as follows: (1) the PLSR models for SOC estimation on the basis of the VIS–NIR spectra with SG smoothing generally failed to be transferable among the soil samples with different MCs (mean of r2pre = 0.55 and mean of RPD = 1.38). However, the transferability of the PLSR models with the OSC and GLSW transformations for the SOC defined in terms of soil with variable MCs was greatly improved (OSC-PLSR: mean of r2pre = 0.69 and mean of RPD = 1.78; and GLSW-PLSR: mean of r2pre = 0.79 and mean of RPD = 2.13); (2) the performance of the mixed-moisture model can be ranked as GLSW-PLSR > OSC-PLSR > PLSR, regardless of the variation in MCs; and (3) GLSW-PLSR is recommended for VIS-NIR spectroscopy estimation of SOC content under different moisture levels and mixed-moisture conditions.
Despite the successful practices reported in this study, a greater potential of the GLSW filter method should be encouraged in removing the interferences of other environmental factors for soil analysis. In addition, more advanced technologies, such as artificial intelligence or support vector machines, should be attempted for modeling in future research. Based on the successful results, future work should also be focused on the use of GLSW filter algorithms on field or satellite hyperspectral data for soil property prediction to provide accurate information for precision agriculture over a large area.


