1. Introduction
Synthetic aperture radar (SAR) achieves two-dimensional high-resolution image of ground targets by synthetically expanding the physically limited size of antenna in azimuth direction by utilizing the motion of a vehicle such as satellite, airplane and ground-based rail system. SAR has become an important imaging tool due to its all-weather and day-and-night imaging capabilities. In addition to the amplitude image that measures radar backscattering of targets, phase gives interferometric information on terrain height and surface motion induced by earthquake, volcano, groundwater, glaciers, etc., with unprecedented accuracy and consistency [
1,
2].
Conventional SAR operates by transmitting the coded pulses to the ground targets and receiving the returned signal via antenna. Matched filtering of the returned signal with the known code will resolve the one-dimensional targets in range direction. SAR enhances azimuth resolution by synthesizing radar returns from a target to the antenna at varying positions along the vehicle trajectory. SAR image projects the three-dimensional distributed targets onto a two-dimensional plane in range-azimuth directions. As there is no resolving power in vertical direction, defined as the direction orthogonal to range and azimuth, the layover phenomenon occurs when two objects at the same range and azimuth will be overlain as one point in SAR image [
3,
4].
SAR tomography achieves vertical resolution by adding synthetic antenna array in vertical direction to the conventional SAR concept [
5,
6,
7,
8]. Three-dimensional imaging is useful to identify the objects under volumetric scattering such as forest, snow, glacier, and camouflaged objects, and surface scattering targets with layover ambiguity such as buildings and steep slopes [
9,
10,
11,
12].
Imaging principle of tomographic SAR (TomoSAR) is basically identical for airborne, satellite and ground systems in terms of the requirement of additional scanning in vertical direction. However, actual implementation of TomoSAR systems for those vehicles is quite different due to the image acquisition duration and thus temporal coherence of targets. Since 2000 [
1], a few airborne and satellite applications of TomoSAR has been applied [
13].
Satellite system dedicated to TomoSAR is not yet developed and only the test images have been obtained from the existing satellites. For current satellite systems, it would take several months to years to obtain a dataset necessary for TomoSAR. In this case, only the targets stable enough for years, such as buildings, bedrock with no vegetation cover, and internal structure of ice sheet in arid arctic environment, can be imaged by TomoSAR. Major challenges of the repeat-pass satellite and airborne data have been the uneven spacing of vertical baselines and the vertical ambiguity caused by limited number of coherent satellite tracks. More robust data processing algorithms are being developed to mitigate such problems [
14,
15,
16,
17,
18].
Recently, a few ground-based tomographic SAR (GB-TomoSAR) systems have been used to obtain test dataset for the algorithm development and the concept design. Xing et al. [
19] developed a ground-based X-band TomoSAR system and measured some man-made objects, such as corner reflectors and a truck, artificially set for the experiment. Based on a GB-SAR system developed by Lee et al. [
20], Ji et al. [
21] have reported the construction of a GB-TomoSAR system operated in C-band that have imaged distributed targets such as buildings, road, stairs, and trees. More recently, ground-based tomographic SAR systems have been widely applied to forest, vegetation, snowpack and sea ice [
22,
23,
24,
25,
26,
27].
In this paper, we report the construction of a new GB-TomoSAR system and the development of an efficient three-dimensional focusing algorithm by utilizing Deramp-FFT (Fast Fourier Transform) algorithm [
20] including further data processing such as noise reduction schemes and geometric and radiometric correction.
Section 2 describes the GB-TomoSAR system followed by focusing algorithm and a simulation result in
Section 3.
Section 4 presents the results of an outdoor experiment over natural and man-made targets such as buildings, road, and trees.
Section 5 mentions a critical discussion and
Section 6 concludes the paper.
2. GB-TomoSAR System
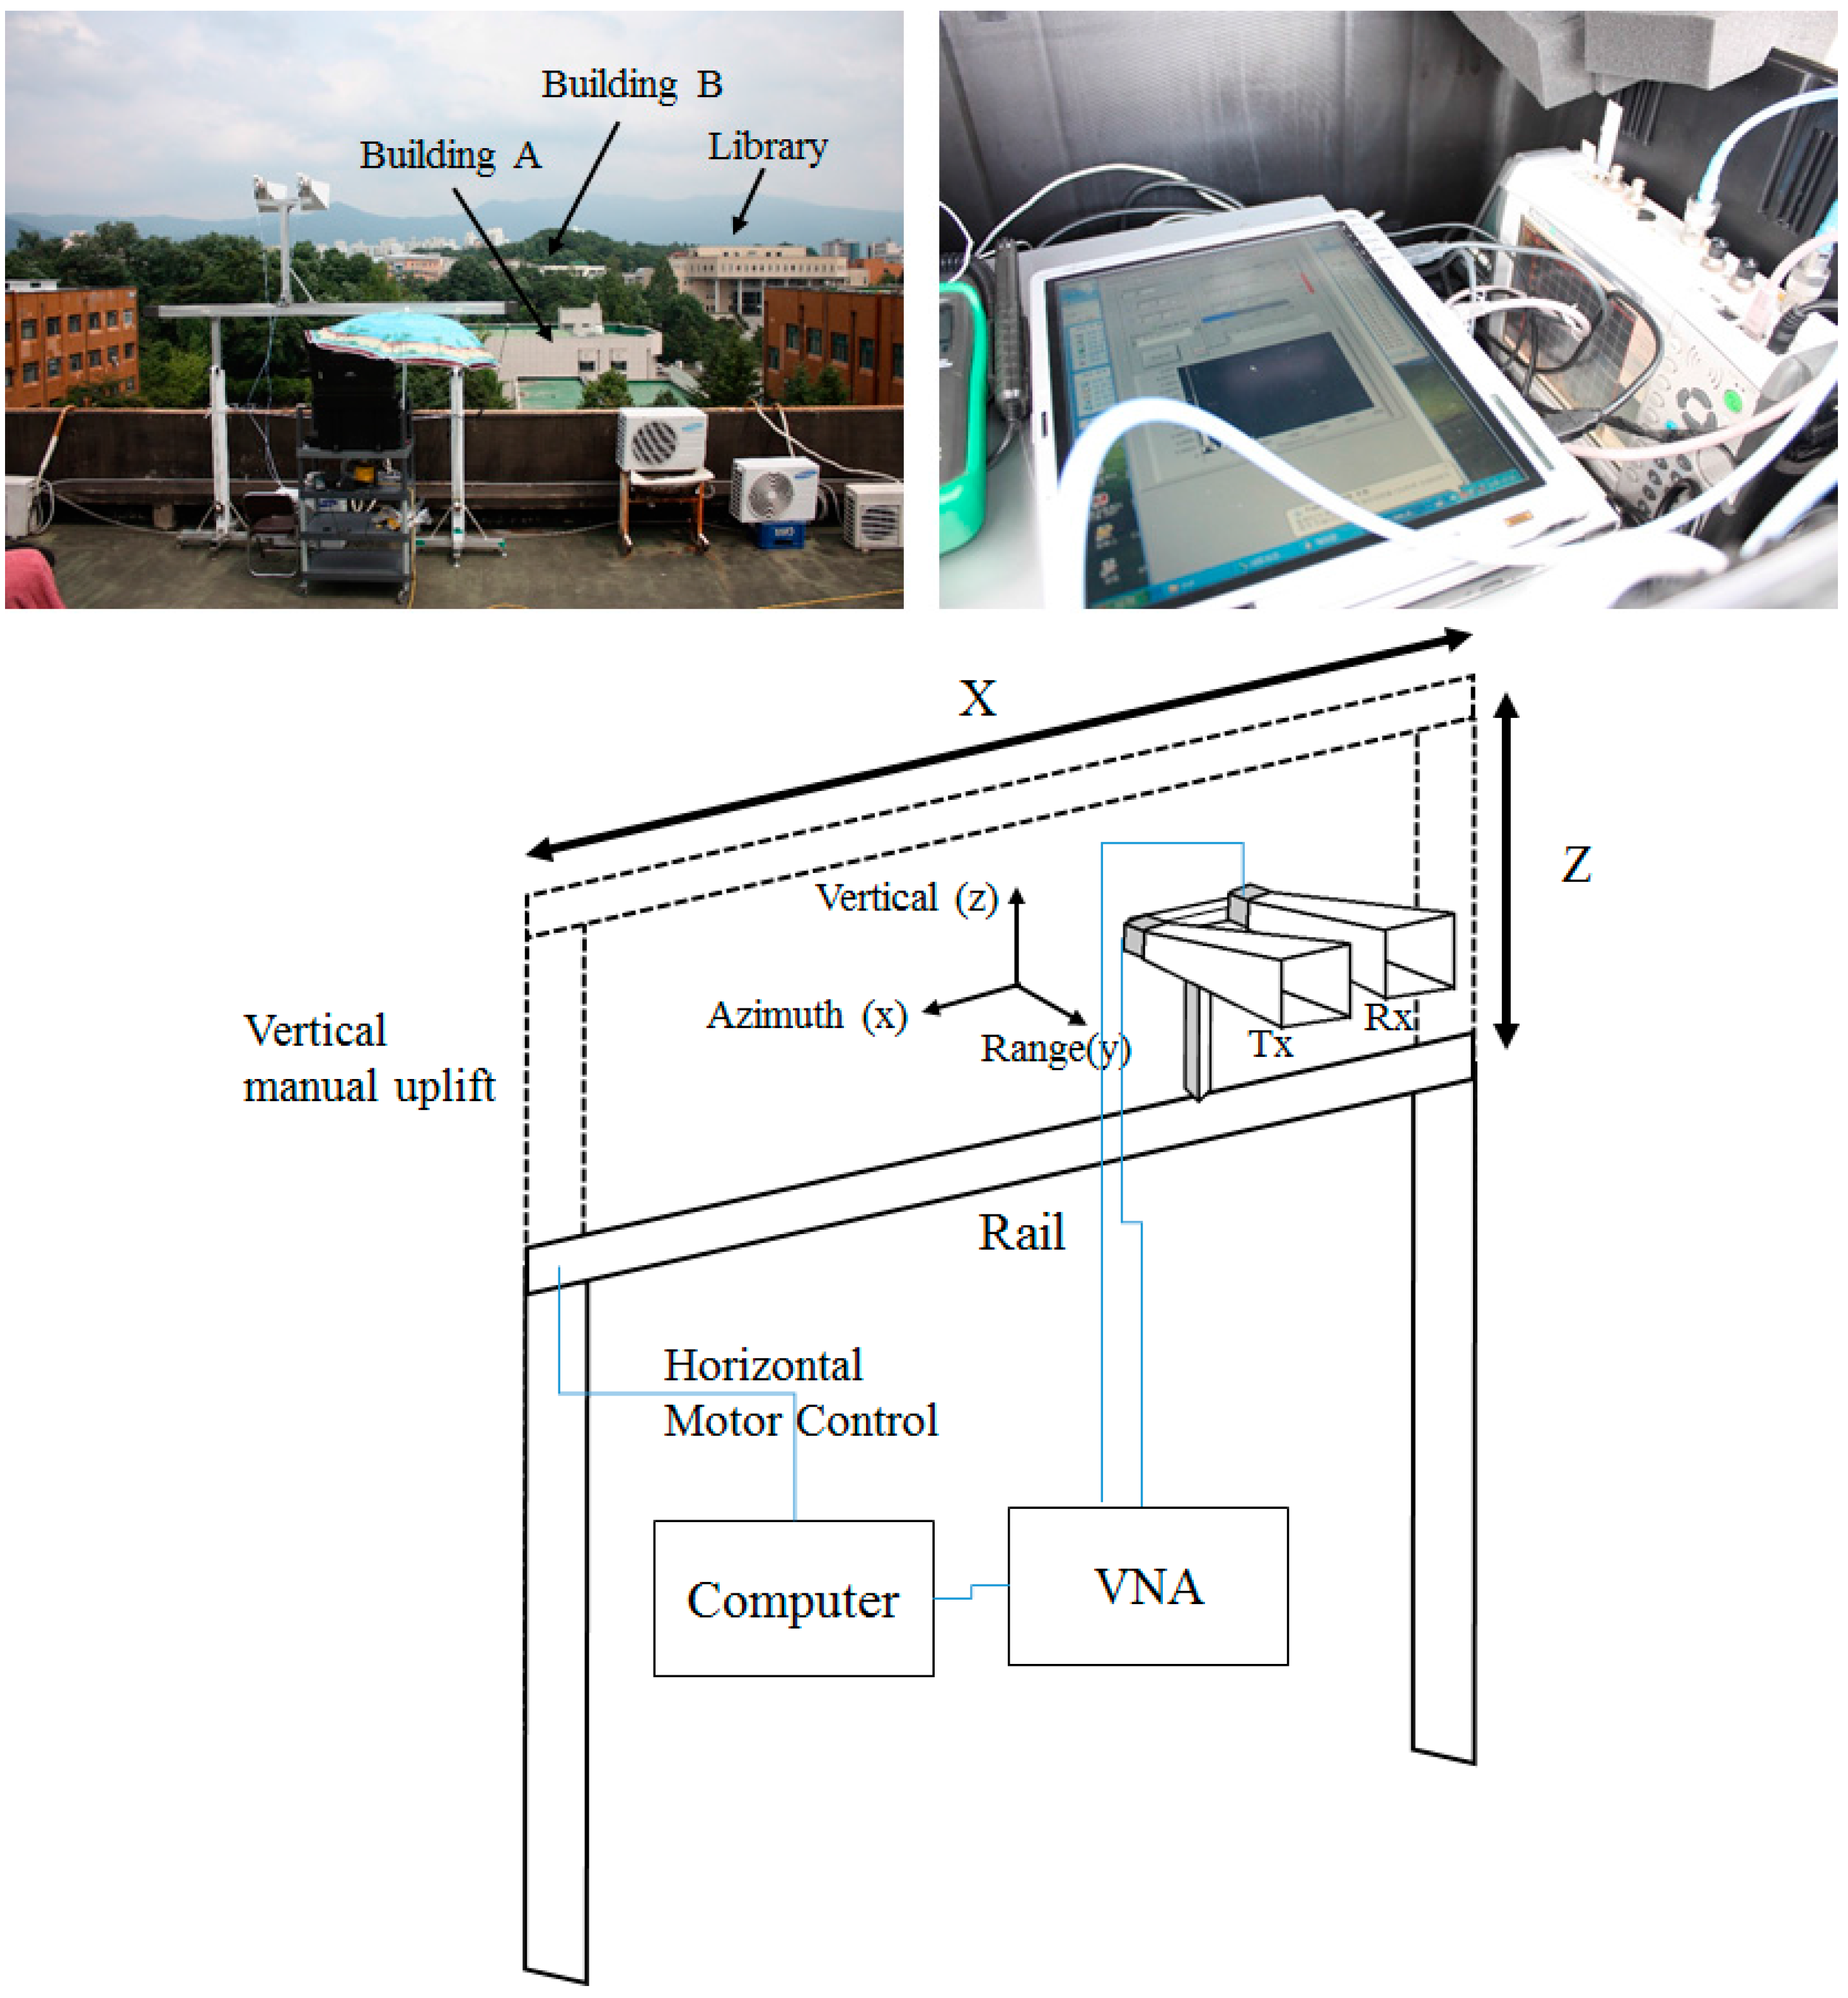
GB-TomoSAR system is mainly composed of a linear rail and RF components (
Figure 1). Two identical square horn antennas, each for Tx and Rx in C-band separately, are positioned on top of a mount on a 2.3 m-long linear rail system. The position of the mount is accurately controlled horizontally by a stepping motor and a belt. The linear rail can be manually lifted by using screws on both side of the rail and supporting poles, allowing two-dimensional scanning.
A vector network analyzer (VNA, Anritsu Master MS2028B) generates microwave signal in a stepped-frequency mode and measures the returned scattering from targets. A 20 W power amplifier (Aethercomm SSPA 5.0-6.2-20, Carlsbad, CA, USA) is attached between the VNA and the transmission antenna. A notebook computer controls the whole process including antenna motion, amplifier switching, VNA, and data acquisition.
3. GB-TomoSAR Focusing
Principle of the GB-TomoSAR focusing is analogous to the GB-SAR focusing except that the processing involves both in range-azimuth domain and range-vertical domain.
Figure 2 shows the block diagram of the GB-TomoSAR focusing algorithm. Range compression is performed by simply applying inverse Fourier transformation in range direction, while azimuth and vertical compressions are done by applying a newly developed two-dimensional deramp-FFT algorithm. Firstly, we focus images in range-azimuth image plane by using deramp-FFT algorithm optimized to GB-SAR [
20]. The data are then rearranged into range-vertical planes, after which we apply deramp-FFT algorithm in range-vertical domain to get three-dimensional tomographic SAR image.
It is worth noting that amplitude-averaging filter in range-vertical direction was applied before deramping procedure to reduce the severe temporal decorrelation of trees as observed in Reference [
20]. This is based on the assumption that stable targets will generate similar amplitude for each range-azimuth images even though phase will change significantly between adjacent scans while unstable targets tends to generate random data both in amplitude and phase. Therefore, only amplitude values are averaged in vertical direction while phase remains intact, which resulted in meaningful reduction of noise from severe temporal decorrelation. The appropriate size of averaging window in vertical direction varies case-by-case, but 3~7 pixels are adequate choice from our experience.
After focusing, the image cube is then geometrically corrected into an image cone and radiometrically calibrated using the sensor-target geometry. Finally, a three-dimensional averaging filter with a cubic widow of 3 × 3 × 3 pixels, for example, was applied to reduce the overall noise level. For image displaying, the three-dimensional image cone can be sliced into various two-dimensional planes such range-azimuth, range-vertical, horizontal, and vertical planes. Mathematical derivation of GB-TomoSAR focusing algorithm is described in the following two sub-sections.
3.1. Range Compression
The received signal of GB-TomoSAR is obtained in the stepped-frequency format in frequency domain by a vector network analyzer [
20]:
where
H(
f) is the box function with a center at
fc and a bandwidth of
BR. It shows the frequency field of the transmitted and received microwave.
G(
f) is the reflection coefficient of the target as a function of frequency. Equation (1) can be changed to the time domain by using inverse Fourier transform, which can be expressed by using convolution as:
If the target is placed at a two-way travel time of
t0 = 2
R/c, and the reflection coefficient of the target is
g(
t) = δ(
t −
t0), then Equation (2) can be expressed as follows:
Maximum of
s(
t) has at
t = 2
R/c, and the phase term is the distance of target from the sensor. Time resolution is given as δ
t = 1/
BR, and range resolution is calculated by δ
R =
cδ
t/2 =
c/2
BR [
20].
3.2. Two-Dimensional Deramp-FFT Algorithm
Deramp-FFT algorithm is performed by multiplying the deramp function to the range compressed signal and then applying the inverse Fourier transform. This algorithm regards that the obtained signal is in frequency domain due to the time-frequency locking phenomenon of a SAR system. It uses lower memory and less processing time than other focusing algorithms, such as the range-Doppler algorithm. Therefore, it can be useful for near-real time SAR focusing [
20].
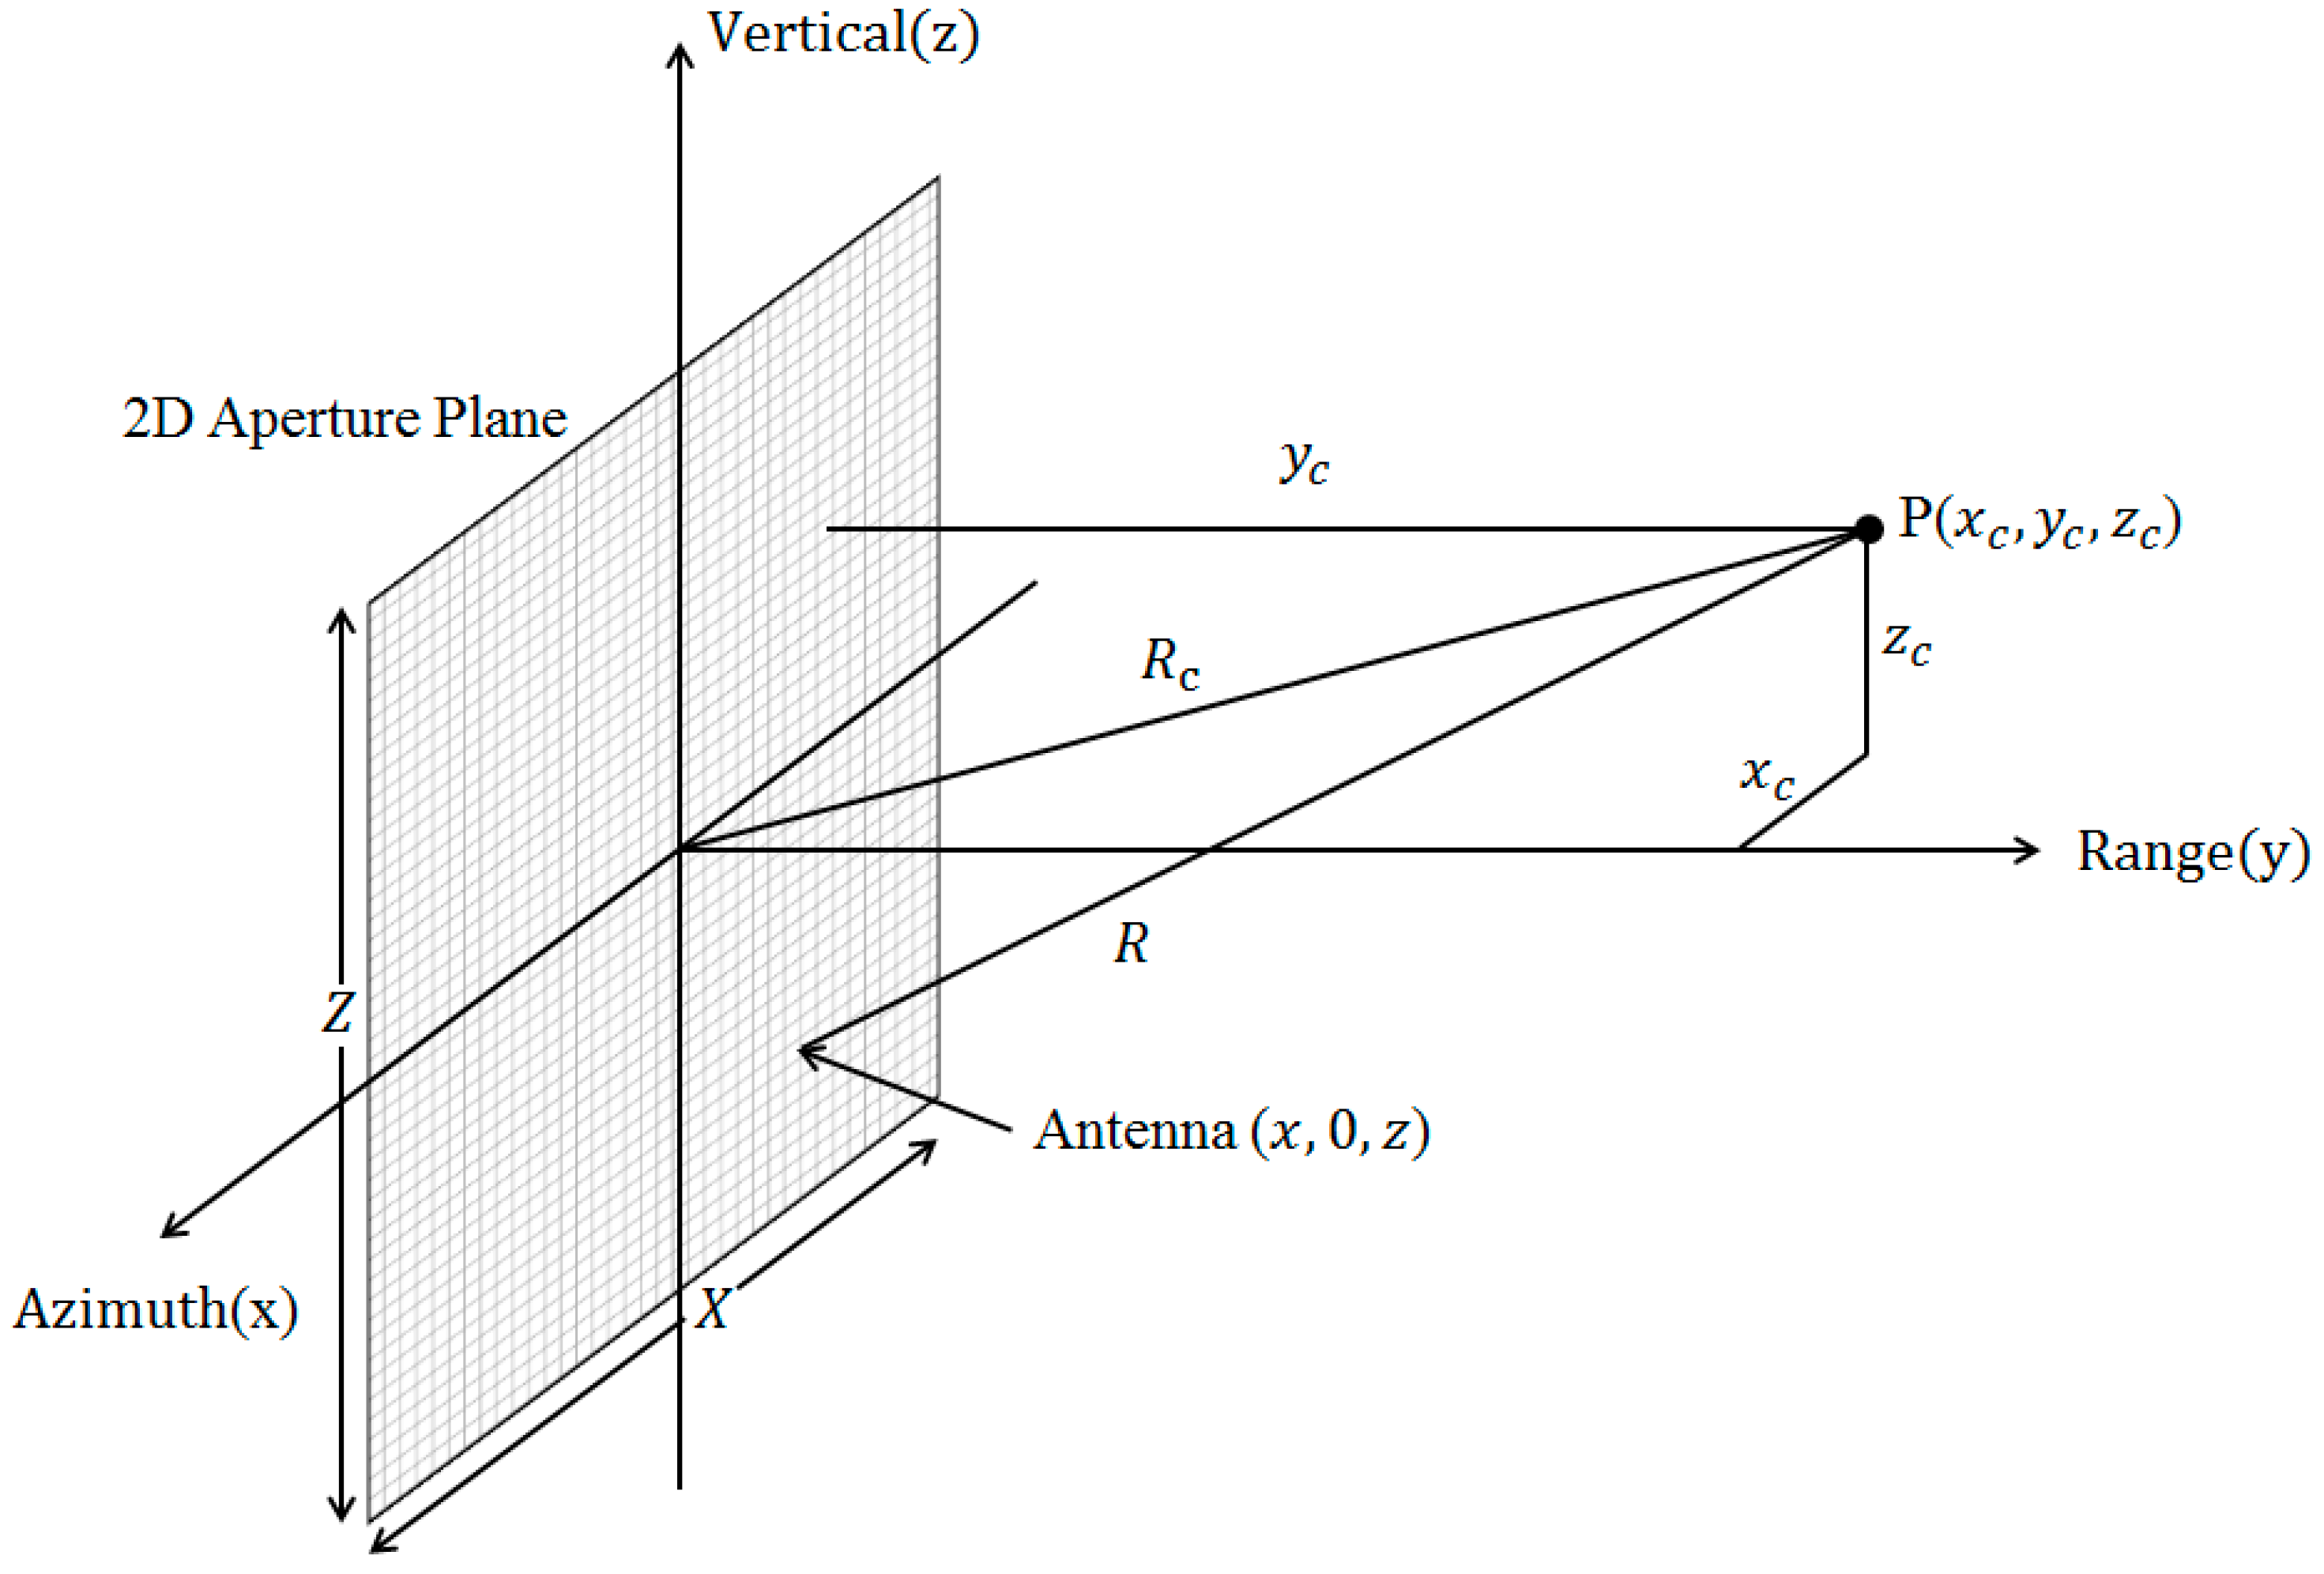
Theoretical formulation of the deramp-FFT algorithm is as follows. If a target is located at
P(
xc,
yc,
zc), as shown in
Figure 3, the range-compressed signal received a various antenna location at (
x, 0,
z) is expressed as follows:
where λ is the wavelength. (
x,
z) is the position of the antenna,
X and
Z are the synthetic aperture length and
Lx and
Lz are the antenna aperture size, all in azimuth and vertical direction, respectively.
R is the range from the antenna to the target, i.e.,
We apply the two-dimensional Taylor series to Equation (5) at the center of antenna scan field at (
x,
z) = (0, 0) so that Equation (4) becomes:
A SAR image is formed by applying inverse Fourier transformation to the received signal in azimuth and vertical directions after multiplying the following two-dimensional deramp function
h−1(
x,
z).
Analytical solution of Equation (8) results in:
Maximum of
g(
u,
v) occurs at
u = 2
xc/λ
Rc,
v = 2
zc/λ
Rc. Geocoding should be followed according to those equations. Resolutions are given as δ
u = 1/X, δ
v = 1/Z, which can be expressed as the azimuth and vertical resolution (δ
xc, δ
zc) as follows.
During the data processing, we arrange the received signal by using the range migration, multiply the two-dimensional deramp function
h−1(
x,
z), apply the Hanning filter, and then use the iFFT both in azimuth and vertical directions (
Figure 2).
An important approximation is introduced during the deramp-FFT algorithm. We assume
xc =
zc = 0 in Equation (5) for range migration and Equation (7) for deramping, so that they are independent of azimuth and vertical target locations. Equations (5) and (7) are only a function of range only to reduce the computing time dramatically. Minimum range criterion exists to avoid defocusing from such approximation. Such criterion in azimuth focusing, for example, can be calculated by using the first quadratic term of Equation (7) at a maximum antenna deviation in azimuth from the scan center (
x =
X/2,
z = 0) and at an image point located at the maximum beam width in azimuth direction (
xc = λ
yc/2
Lx,
zc = 0) [
20]:
where δφ is the maximum phase error tolerable to defocusing. This equation tells us that deramp-FFT is valid only for the far range over the critical range
ycrit while other algorithms, such as the range-Doppler or time-domain algorithm, are recommended for the near range.
4. Results
4.1. Simulation of GB-TomoSAR
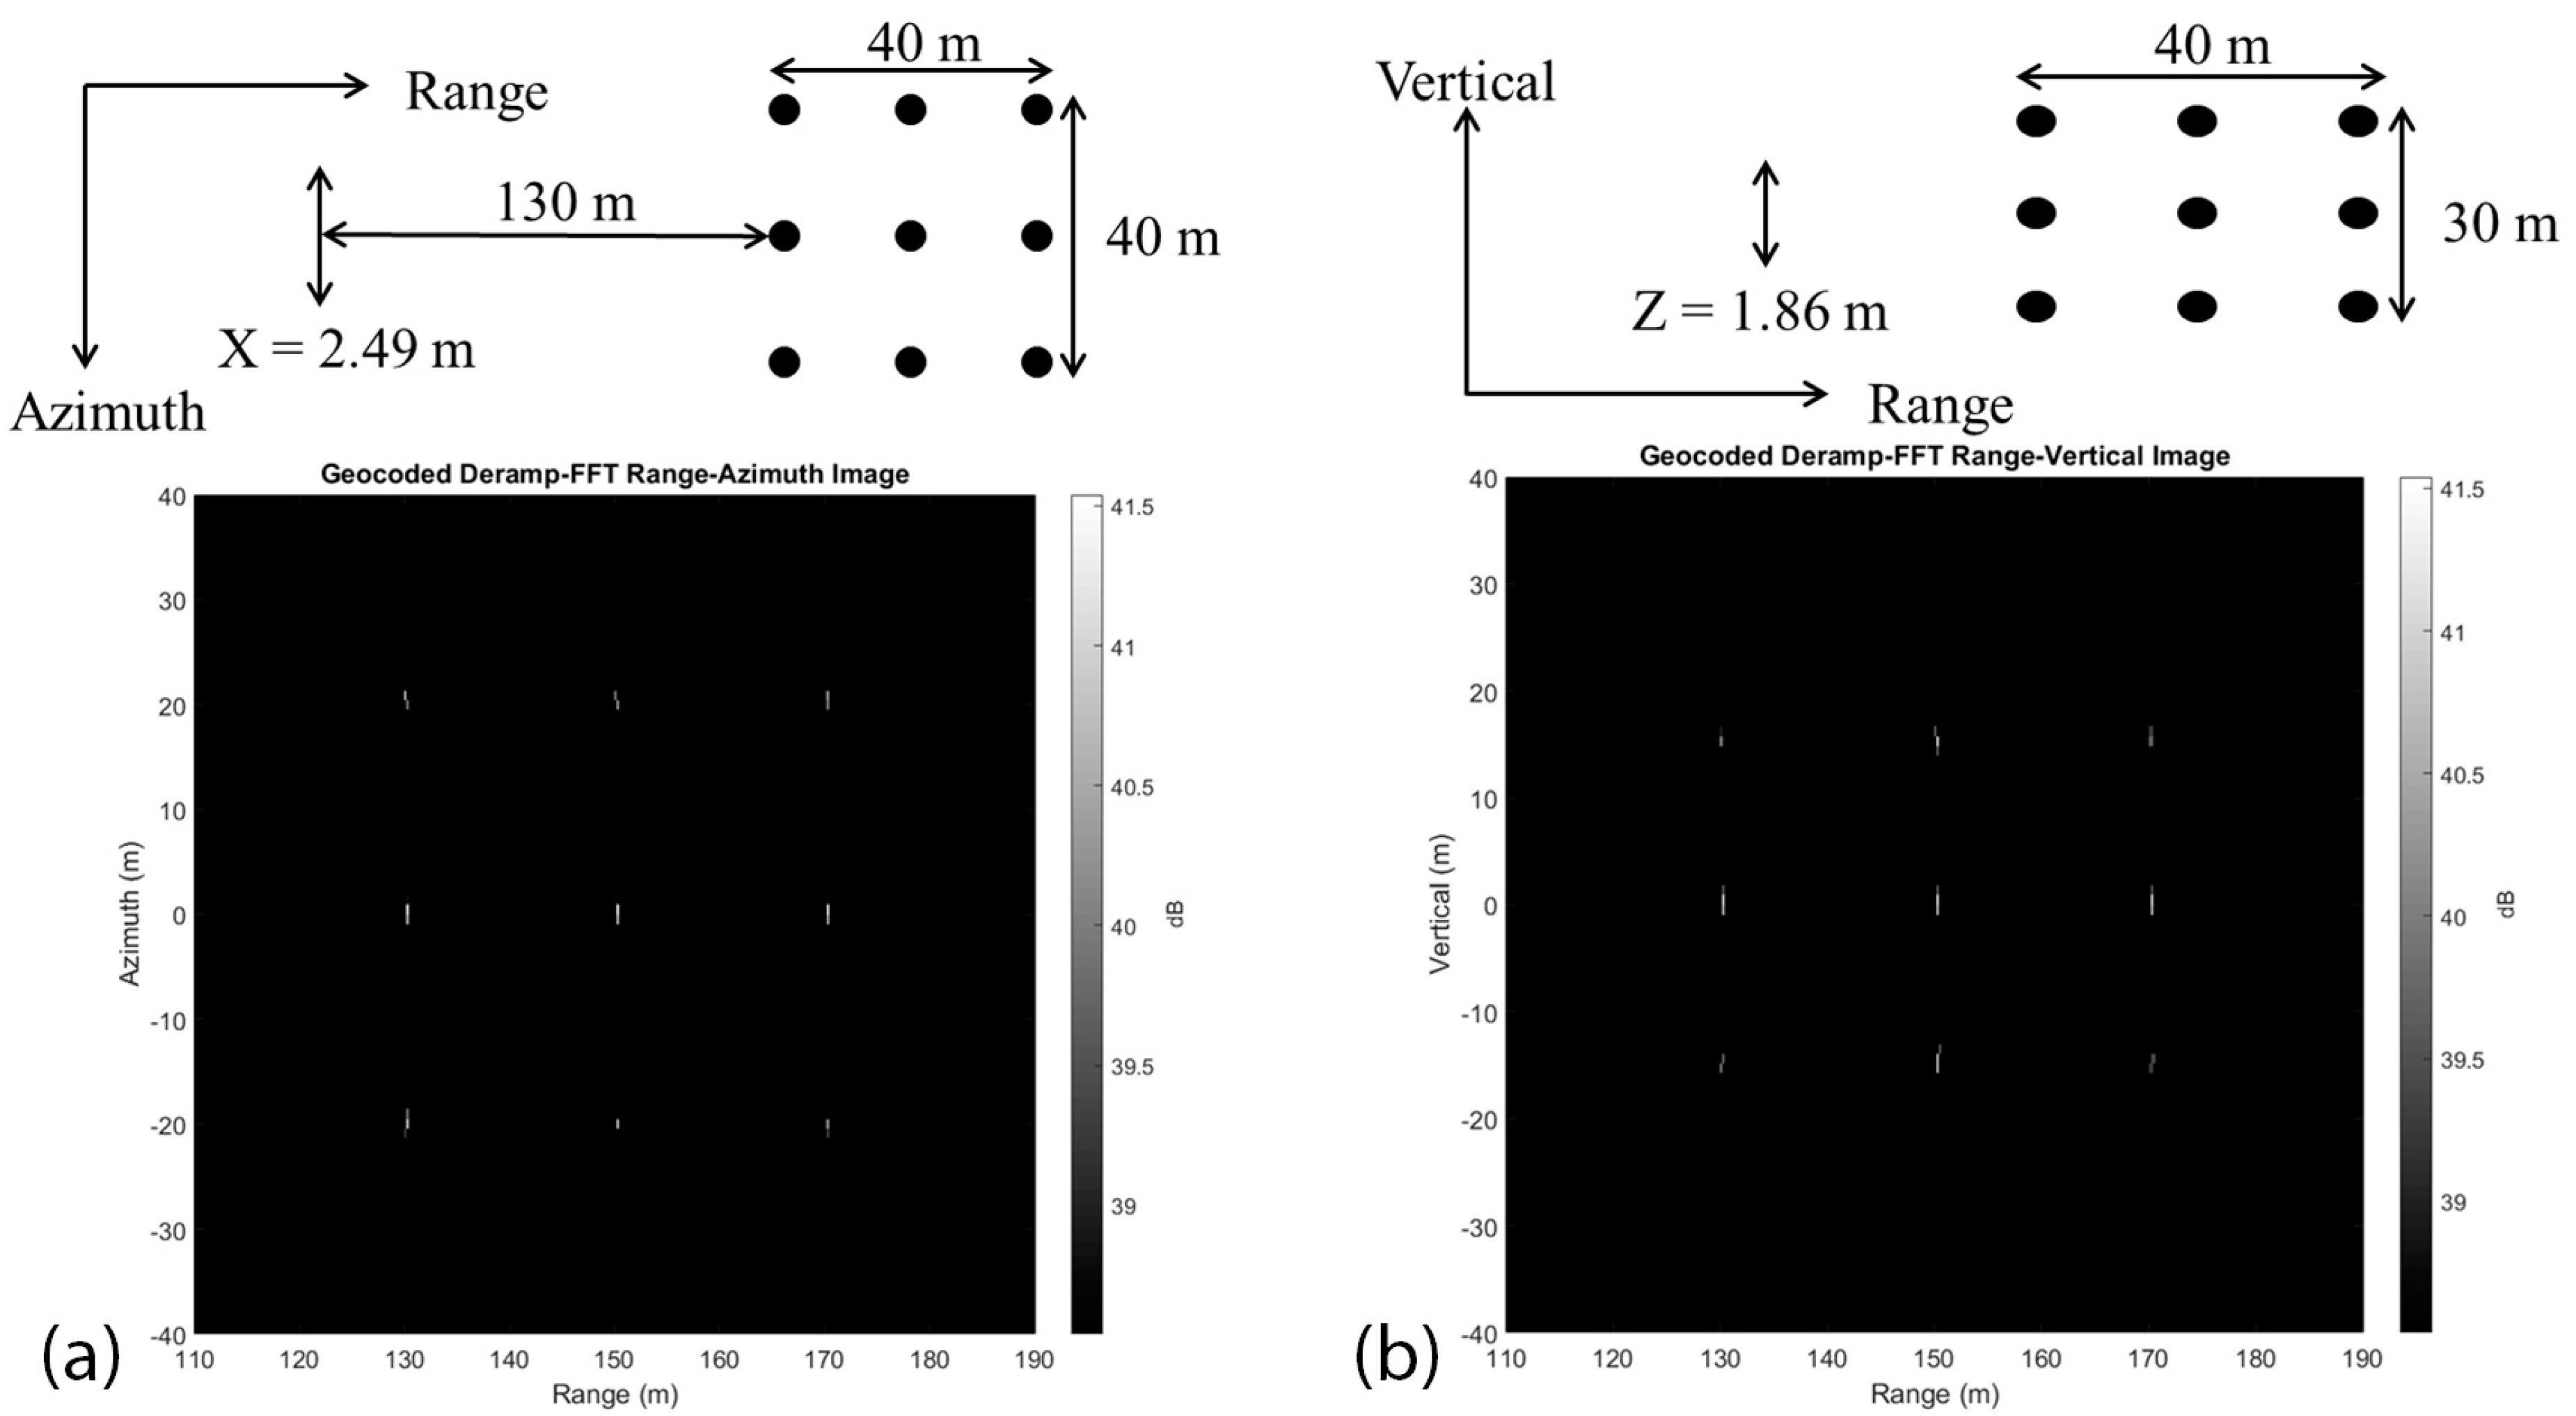
We simulate the GB-TomoSAR system to verify the developed focusing algorithm and to design field experiments. The artificial targets consist of a three-dimensional array of 3 × 3 × 3 point scatters as shown in
Figure 4. The system specification of the simulation is shown in
Table 1, which is identical to those of the field experiment in the next section.
Figure 4 shows the simulation result showing range-azimuth and range-vertical slice images in the image center line. The random noise of 1 mm RMS error was implemented to access the tolerance of the system from positioning error. The images clearly show the focused point targets at the original location with the resolutions close to the theoretical values of 1.5 and 2.0 m at 130 m range in azimuth and vertical direction, respectively. The ISLR (Integrated Side Lobe Ratio) was measured to be −11.22 dB and −11.38 dB in azimuth and vertical direction, respectively. The amplitude of the peak was measured to be 0 dB while the phase coincides almost exactly with the modulus of 2π of range. The critical range
ycrit is calculated to be 10.3 m when the critical phase error is set to be δφ = π/10. Therefore, we confirmed that the two-dimensional deramp-FFT algorithm is acceptable in the range over 10.3 m, and is useful for the three-dimensional GB-TomoSAR imaging.
4.2. Outdoor Experiment
A GB-TomoSAR experiment was performed on the rooftop of a building at Kangwon National University. The picture of the experiment and the diagram of the GB-TomoSAR system are shown in
Figure 1. Main targets are university buildings, roads and trees.
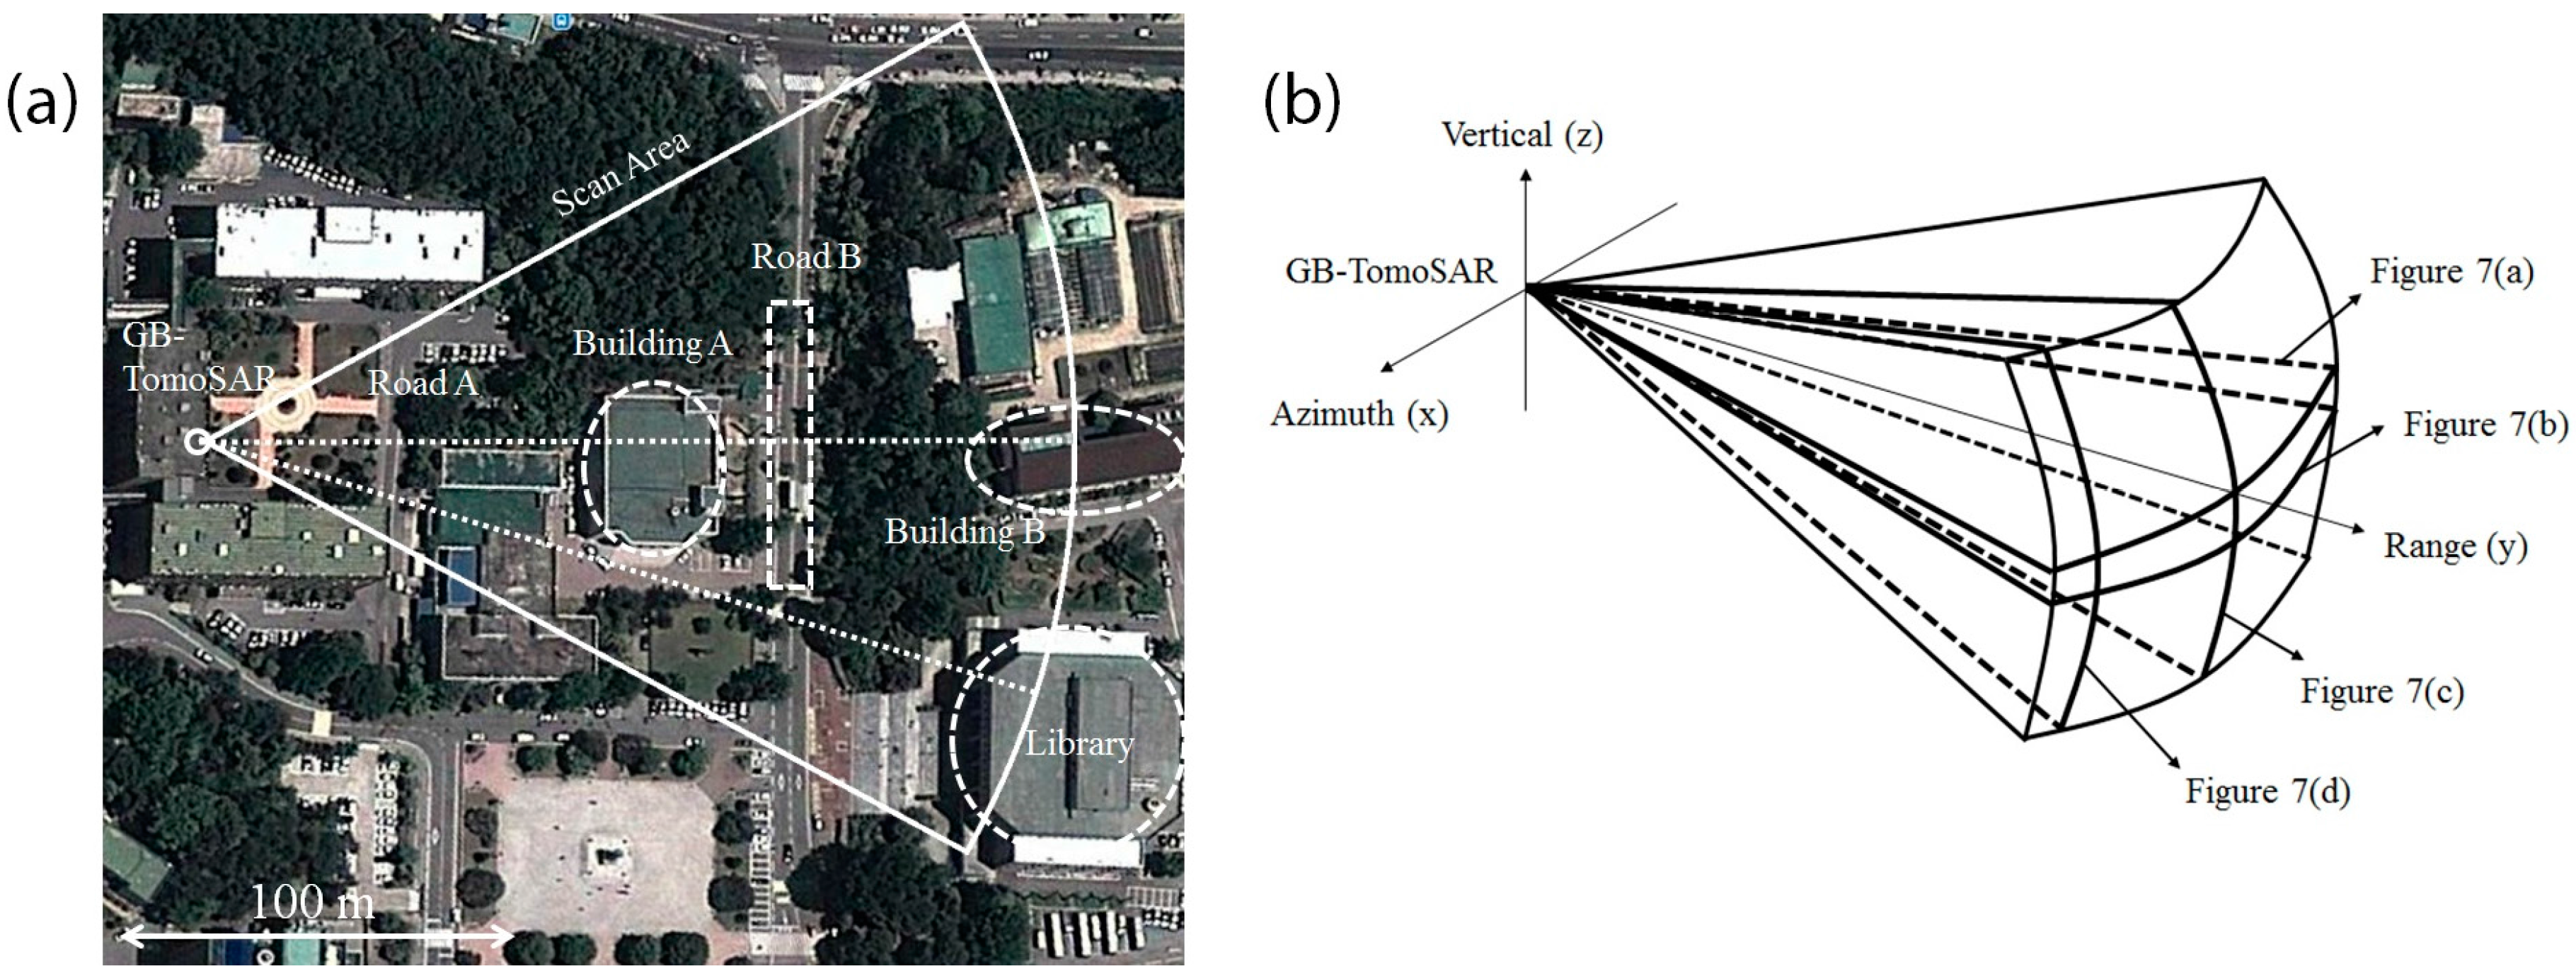
Figure 5a shows the scan area of the TomoSAR experiment and
Figure 5b illustrates three-dimensional conceptual diagram of TomoSAR dataset. The whole image scanning took about 8 h. According to the specification of GB-TomoSAR system given in
Table 1, the range resolution (δ
R) is calculated to be 0.25 m, the azimuth angular resolution (δθ) is 0.65° and the vertical angular resolution (δϕ) is 0.87°.
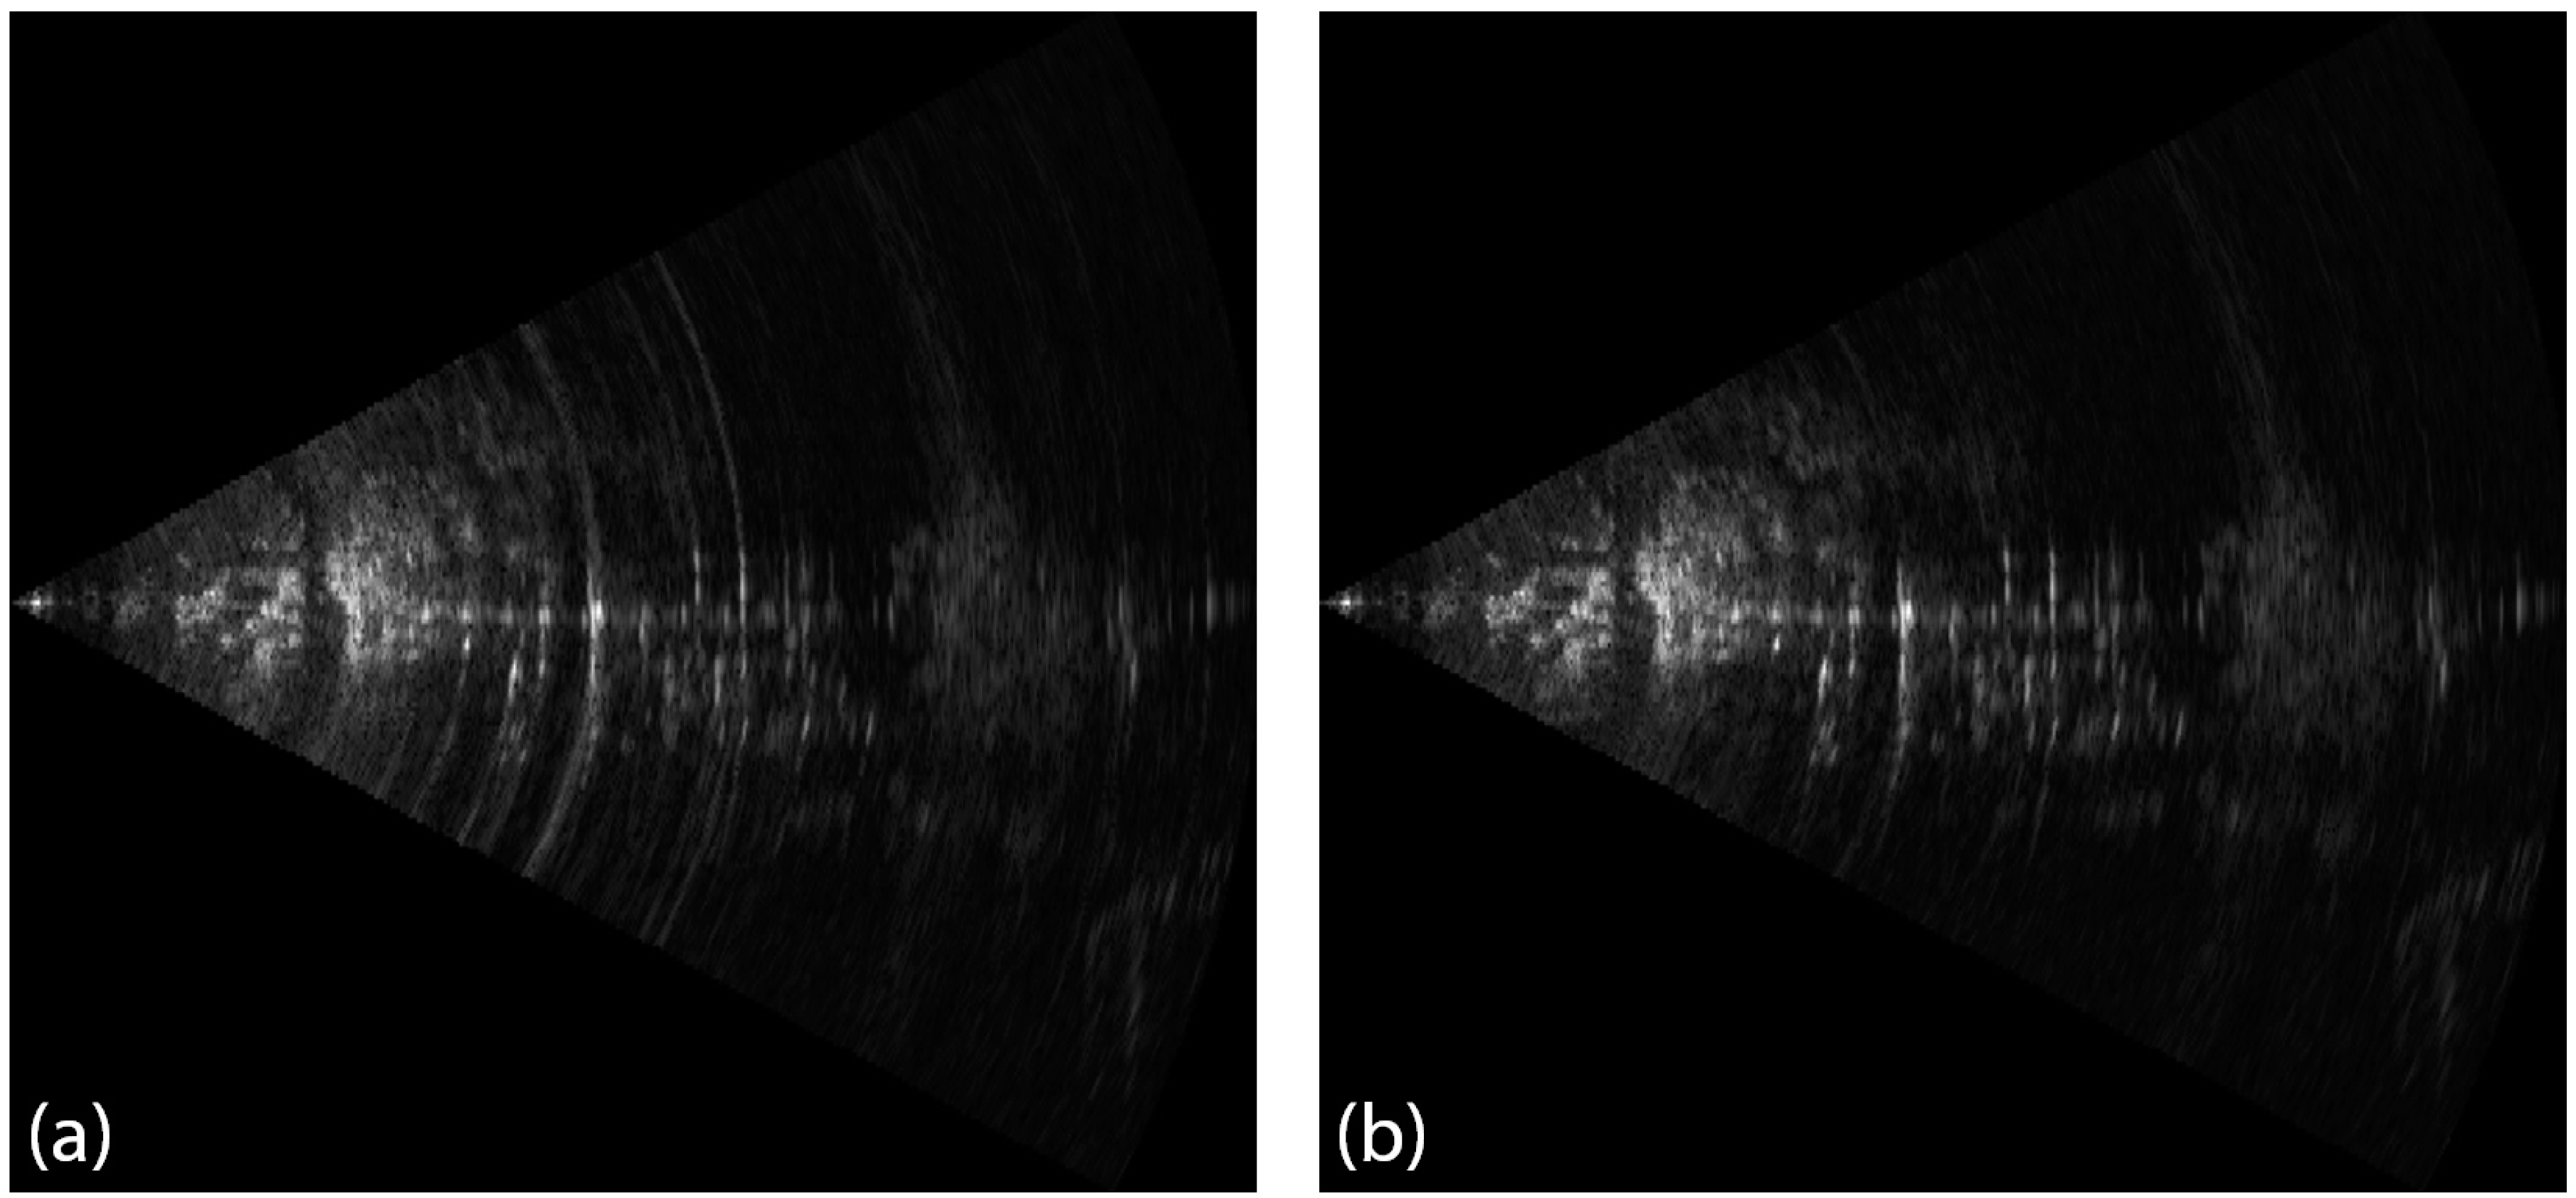
Range-azimuth images before vertical compression using time-domain and deramp-FFT algorithm, as shown in
Figure 6a,b, respectively, have much high SNR and focused well as they are obtained during the 10-min scan time. We believe the vertical compression works fine because the vertical compression algorithm is symmetric to the azimuth compression algorithm and the accuracy of the focusing algorithm is proven by the simulation.
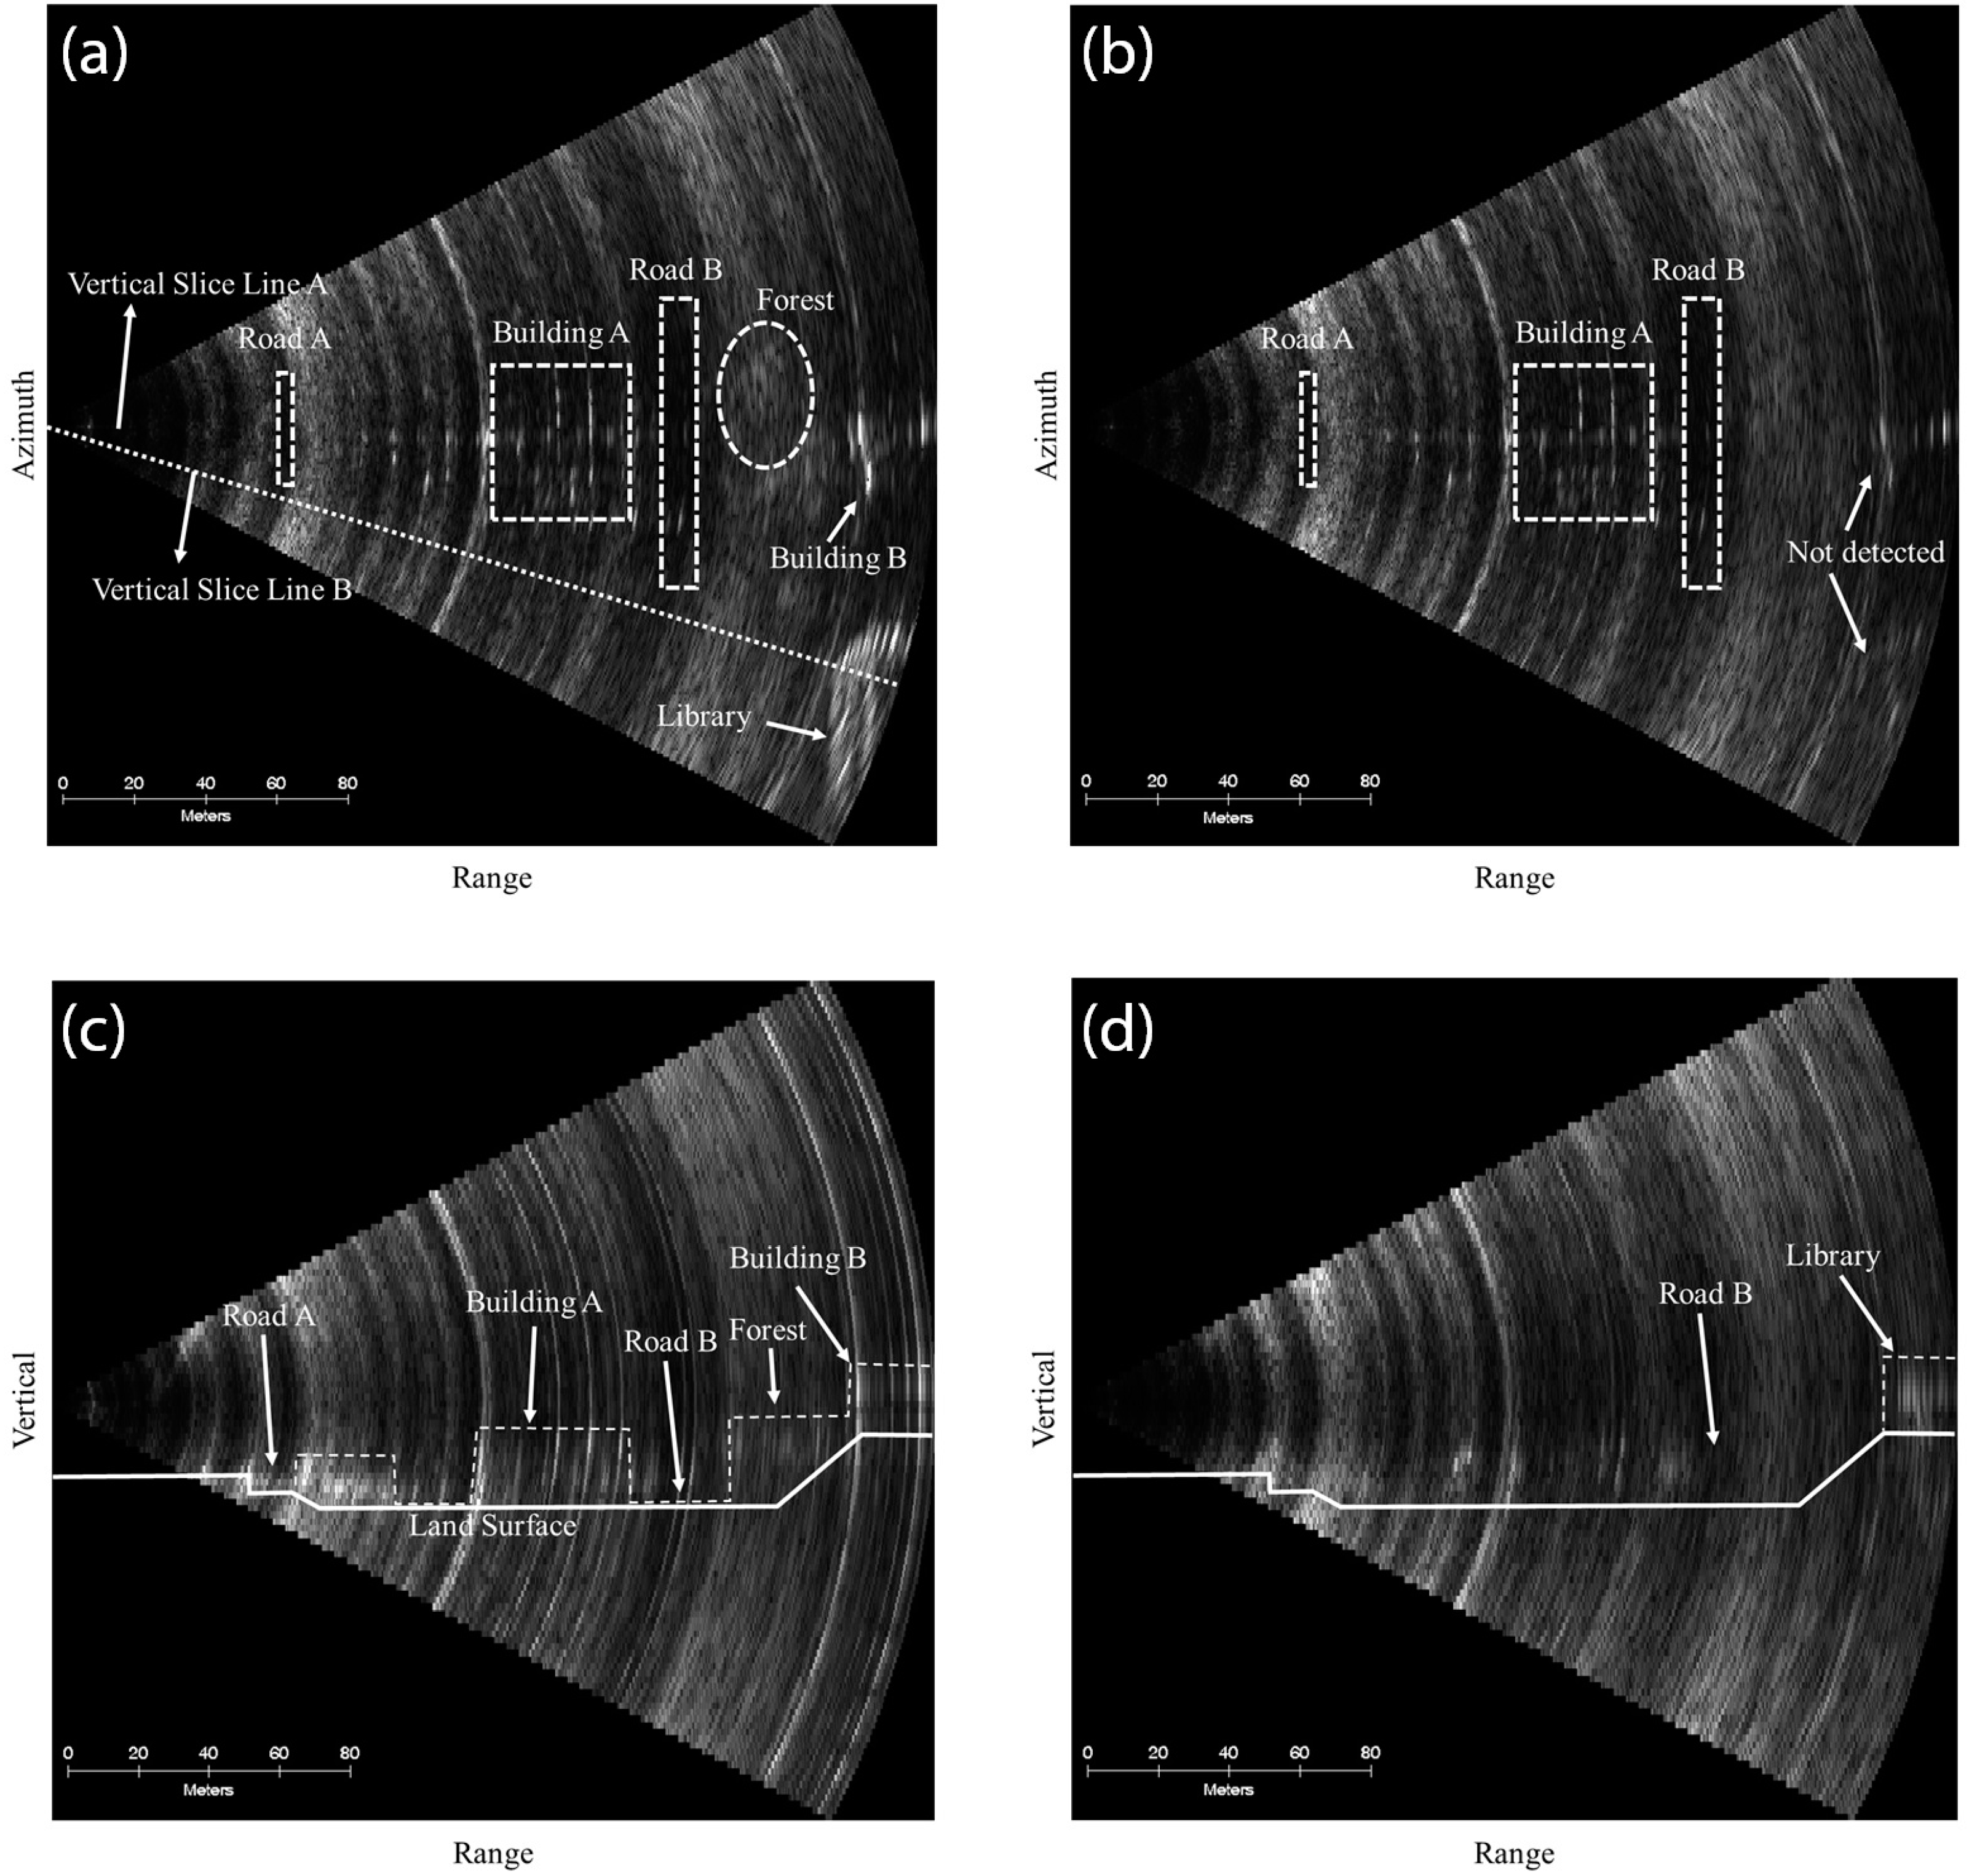
Figure 7a,b shows the range-azimuth slice image that includes the image center line and that on the plane slanted by 7.84° downwards from the image center line, respectively. All images were shown after the geometric and radiometric corrections. The library building and building B are clearly shown in
Figure 7a but not detected in
Figure 7b, which imaged below horizon in this range. From the distinctive features between
Figure 7a,b, we could verify that the GB-TomoSAR was focused correctly. The two dotted lines in
Figure 7a represent the vertical slice lines to obtain the range-vertical slice images shown in
Figure 7c,d separated by an angle of 24.2°.
The dotted lines in
Figure 7c represent the border of buildings and roads in the vertical direction. We could distinguish the various structures located along the two vertical slice lines. The heights of the library and building B were measured to be 30 ± 3 m from
Figure 7c,d, which were well matched to the in situ heights of the library (30 m) and building B (23 m). However, the tomographic image has a limitation of the detection of trees due to their severe temporal decorrelation during the 8 h of GB-TomoSAR data acquisition.
5. Discussion
The results from the simulation and the outdoor experiment show the 3-D imaging capability of the GB-TomoSAR system and the focusing algorithm. The use of VNA operating in stepped-frequency mode limits the pulse repetition rate no larger than one or two, but allows accurate and high-gain reception with a relatively small power amplifier. The rail-based positioning system with a stepping motor provides very accurate and stable acquisition of data repetitively. The tolerance of positioning error should be less than one tenth of the wavelength while the positioning error of this system is less than 1 mm [
28]. The two-dimensional deramp-FFT algorithm is a memory efficient and fast processing scheme especially for this system with a small bandwidth-time product [
29]. This is mainly because it uses the time-consuming FFT just once while other algorithms, such as range-Doppler or
algorithms uses twice (forward and inverse FFT) for each dimension. Memory usage is also reduced remarkably due to this simplified processing in the deramp-FFT algorithm.
Temporal decorrelation is inevitable for this slow-scanning system that degrades the SNR significantly for unstable targets. Several filters were implemented during the processing to improve the SNR, such as the amplitude-averaging filter in the range-vertical compression and the cubic averaging filter in the post-processing step. Even though those filters help to improve the SNR at the expense of resolution, temporal decorrelation can be overcome effectively by implementing fast-scanning schemes such as the automation of vertical scanning, optimizing the scanning steps, using higher frequency and larger gain antenna, switching to a faster VNA, and the continuous scanning instead of stepping scan. Upgrading of the system with faster scanning and more accurate positioning both in azimuth and vertical directions is underway. Atmospheric phase delay also contributes to random noise if not properly handled. Temperature, humidity and air pressure should be monitored to mitigate atmospheric phase delay of up to a few centimeters [
30]. An automatic weather system will be integrated to the system for the experiments in the future.
6. Conclusions
We developed a GB-TomoSAR system based on GB-SAR to generate the three-dimensional tomographic image of targets. A three-dimensional SAR focusing algorithm was successfully developed by extending a one-dimensional deramp-FFT algorithm used for GB-SAR focusing to two-dimensional azimuth-vertical field. Simulation and field experiment of the GB-TomoSAR verified algorithm, focusing software, and geometric and radiometric calibrations. GB-TomoSAR system provided reasonable heights of stable buildings and roads. However, trees were poorly detected and produced severe errors due to temporal decorrelation. It is recommended to increase the scanning speed of the GB-TomoSAR system to reduce the temporal effects of unstable targets.
Acknowledgments
This research was supported by the National Research Foundation of Korea under Grant NRF-2013M1A3A3A02041853 and NRF-2013R1A1A2008062, by a research grant of Kangwon National University in 2014, and also by the Korea Polar Research Institute (KOPRI) under the project titled ‘SaTellite remote sensing on west Antarctic ocean Research (STAR) (PE16040)’.
Author Contributions
Hoonyol Lee led manuscript writing and contributed to the research design and data analysis. Younghun Ji contributed to the data analysis and discussion of the results. Hyangsun Han contributed to the research design and manuscript writing and served as the corresponding author.
Conflicts of Interest
The authors declare no conflict of interest.
References
- Reigber, A.; Moreira, A. First demonstration of airborne SAR tomography using multibaseline L-band data. IEEE Trans. Geosci. Remote Sens. 2000, 38, 2142–2152. [Google Scholar] [CrossRef]
- Gini, F.; Lombardini, F.; Montanari, M. Layover solution in multibaseline SAR interferometry. IEEE Trans. Aerosp. Electron. Syst. 2002, 38, 1344–1356. [Google Scholar]
- Fornaro, G.; Serafino, F.; Soldovieri, F. Three-dimensional focusing with multipass SAR data. IEEE Trans. Geosci. Remote Sens. 2003, 41, 507–517. [Google Scholar] [CrossRef]
- Lombardini, F. Differential tomography: A new framework for SAR interferometry. IEEE Trans. Geosci. Remote Sens. 2005, 43, 37–44. [Google Scholar] [CrossRef]
- Fornaro, G.; Pauciullo, A. LMMSE 3-D SAR focusing. IEEE Trans. Geosci. Remote Sens. 2009, 47, 214–223. [Google Scholar] [CrossRef]
- Nannini, M.; Scheiber, R.; Moreira, A. Estimation of the minimum number of tracks for SAR tomography. IEEE Trans. Geosci. Remote Sens. 2009, 47, 531–543. [Google Scholar] [CrossRef]
- Lombardini, F.; Pardini, M.; Fornaro, G.; Serafino, F.; Verrazzani, L.; Costantini, M. Linear and adaptive spaceborne three dimensional SAR tomography: A comparison on real data. IET Radar Sonar Navig. 2009, 3, 424–436. [Google Scholar] [CrossRef]
- Liu, D.; Shao, Y.; Liu, Z.; Riedel, B.; Sowter, A.; Niemeier, W.; Bian, Z. Evaluation of InSAR and TomoSAR for monitoring deformations caused by mining in a mountainous area with high resolution satellite-based SAR. Remote Sens. 2014, 6, 1476–1495. [Google Scholar] [CrossRef]
- Tebaldini, S. Single and multipolarimetric SAR tomography of forested areas: A parametric approach. IEEE Trans. Geosci. Remote Sens. 2010, 48, 2375–2387. [Google Scholar] [CrossRef]
- Aguilera, E.; Nannini, M.; Reigber, A. A data-adaptive compressed sensing approach to polarimetric SAR tomography of forested areas. IEEE Geosci. Remote Sens. Lett. 2013, 10, 543–547. [Google Scholar] [CrossRef]
- Zhu, X.X.; Bamler, R. Very high resolution spaceborne SAR tomography in urban environment. IEEE Trans. Geosci. Remote Sens. 2010, 48, 4296–4308. [Google Scholar] [CrossRef]
- Zhu, X.X.; Bamler, R. Demonstration of super-resolution for tomographic SAR imaging in urban environment. IEEE Trans. Geosci. Remote Sens. 2012, 50, 3150–3157. [Google Scholar] [CrossRef]
- Fornaro, G.; Lombardini, F.; Pauciullo, A.; Reale, D.; Viviani, F. Tomographic processing of interferometric SAR data: Developments, applications, and future research perspectives. IEEE Signal Process. Mag. 2014, 31, 41–50. [Google Scholar] [CrossRef]
- Zhu, X.X.; Bamler, R. Tomographic SAR Inversion by L1-norm regularization—The compressive sensing approach. IEEE Trans. Geosci. Remote Sens. 2010, 48, 3839–3846. [Google Scholar] [CrossRef]
- Budillon, A.; Evangelista, A.; Schirinzi, G. Three-dimensional SAR focusing from multipass signals using compressive sampling. IEEE Trans. Geosci. Remote Sens. 2011, 49, 488–499. [Google Scholar] [CrossRef]
- Zhu, X.X.; Bamler, R. Super-resolution power and robustness of compressive sensing for spectral estimation with application to spaceborne tomographic SAR. IEEE Trans. Geosci. Remote Sens. 2012, 50, 247–258. [Google Scholar] [CrossRef]
- Huang, Y.; Ferro-Famil, L.; Reigber, A. Under-foliage object imaging using SAR tomography and polarimetric spectral estimators. IEEE Trans. Geosci. Remote Sens. 2012, 50, 2213–2225. [Google Scholar] [CrossRef]
- Lombardini, F.; Pasculli, D.; Viviani, F.; Cai, F. Tomo and diff-tomo superresolution degarbling improvements and first results with COSMO-SkyMed urban data. In Proceedings of the European Conference on Synthetic Aperture Radar (EUSAR), Nuremberg, Germany, 23–26 April 2012.
- Xing, S.; Li, Y.; Dai, D.; Wang, X. Three-dimensional reconstruction of man-made objects using polarimetric tomographic SAR. IEEE Trans. Geosci. Remote Sens. 2013, 51, 3694–3705. [Google Scholar] [CrossRef]
- Lee, H.; Cho, S.J.; Sung, N.H.; Kim, J.H. Development of a GB-SAR (II): Focusing algorithms. Korean J. Remote Sens. 2007, 23, 247–256. [Google Scholar]
- Ji, Y.; Han, H.; Lee, H. Construction and application of tomographic SAR system based on GB-SAR system. In Proceedings of the IEEE International Geoscience and Remote Sensing Symposium, Quebec, QC, Canada, 13–18 July 2014.
- Lahlou, N.; Ferro-Famil, L.; Allain-Bailhache, S. Study of soil response under a vegetation layer using TomSAR data and ground-based TomSAR data. In Proceedings of the IEEE International Geoscience and Remote Sensing Symposium, Milan, Italy, 26–31 July 2015.
- Ferro-Famil, L.; Tebaldini, S.; Davy, M.; Boute, F. 3D SAR imaging of the snowpack at X- and Ku-Band: results from the AlpSAR campaign. In Proceedings of the European Conference on Synthetic Aperture Radar (EUSAR), Berlin, Germany, 3–5 June 2014.
- Yitayew, T.G.; Ferro-Famil, L.; Eltoft, T. High resolution three-dimensional imaging of sea ice using ground-based tomographic SAR data. In Proceedings of the European Conference on Synthetic Aperture Radar (EUSAR), Berlin, Germany, 3–5 June 2014.
- Frey, O.; Werner, C.L.; Wiesmann, A. Tomographic profiling of the structure of a snow pack at X-/Ku-Band using SnowScat in SAR mode. In Proceedings of the European Radar Conference (EuRAD), Paris, France, 9–11 Septermber 2015.
- Ho Tong Minh, D.; Tebaldini, S.; Rocca, F.; Le Toan, T.; Borderies, P.; Koleck, T.; Albinet, C.; Hamadi, A.; Villard, L. Vertical structure of P-Band temporal decorrelation at the Paracou forest: Results from TropiScat. IEEE Geosci. Remote Sens. Lett. 2014, 11, 1438–1442. [Google Scholar] [CrossRef]
- Albinet, C.; Borderies, P.; Koleck, T.; Rocca, F.; Tebaldini, S.; Villard, L.; Le Toan, T.; Hamadi, A.; Ho Tong Minh, D. TropiSCAT: A ground based polarimetric scatterometer experiment in tropical forests. IEEE J. Sel. Topics Appl. Earth Obs. Remote Sens. 2012, 3, 1060–1066. [Google Scholar] [CrossRef]
- Ji, Y.; Lee, H. Construction and experiment of an educational radar system. Korean J. Remote Sens. 2014, 30, 293–302. [Google Scholar] [CrossRef]
- Curlander, J.C.; McDonough, R.N. Synthetic Aperture Radar Systems and Signal Processing; John Wiley & Sons: Hoboken, NJ, USA, 1991. [Google Scholar]
- Iannini, L.; Monti Guarnieri, A. Atmospheric phase screen in ground-based radar: Statistics and compensation. IEEE Geosci. Remote Sens. Lett. 2011, 8, 537–541. [Google Scholar] [CrossRef]
© 2016 by the authors; licensee MDPI, Basel, Switzerland. This article is an open access article distributed under the terms and conditions of the Creative Commons Attribution (CC-BY) license (http://creativecommons.org/licenses/by/4.0/).
