Article

Satellite-Based Run-Off Model for Monitoring Drought in Peninsular Malaysia

1
Geoscience and Digital Earth Centre (INSTeG), Research Institute for Sustainable Environment, University Teknologi Malaysia, Johor Bahru 81310, Malaysia
2
Faculty of Geoinformation and Real Estate, University Teknologi Malaysia, Johor Bahru 81310, Malaysia
3
Water Resource and Wastewater Management Centre, Research Institute for Sustainable Environment, University Teknologi Malaysia, Johor Bahru 81310, Malaysia
4
Faculty of Civil Engineering and Earth Resources, University Malaysia Pahang, Lebuhraya Tun Razak, Gambang, Kuantan, Pahang 26300, Malaysia
*
Author to whom correspondence should be addressed.
Remote Sens. 2016, 8(8), 633; https://doi.org/10.3390/rs8080633
Submission received: 29 April 2016 / Revised: 22 July 2016 / Accepted: 26 July 2016 / Published: 1 August 2016

Abstract

:
Traditional in situ observation interpolation techniques that provide rainfall data from rain gauges have limitations because they are discrete point-based data records, which may not be sufficient to assess droughts from a spatiotemporal perspective. Considering this limitation, this study has developed a run-off model—a fully satellite-based method for monitoring drought in Peninsular Malaysia. The formulation of the run-off deficit uses a water balance equation based on satellite-based rainfall and evapotranspiration data extracted respectively from calibrated TRMM multi-satellites precipitation analysis data (TMPA) and moderate resolution imaging spectroradiometer data (MODIS). The run-off deficit was calculated based on per pixel spatial scale and allowed to produce the continuous and regular run-off maps. The run-off model was tested and evaluated in a one drought year (2005) within a span of three years (2003–2005) over the Kelantan (3448 km2) and Hulu Perak (3672 km2) catchments of Peninsular Malaysia. The validation results show that (1) monthly TMPA rainfall and MODIS evapotranspiration data significantly improved after calibration; (2) satellite-based run-off data is not only strongly correlated with actual steam flow, but also with spatiotemporal variation of run-off in drought-affected forest catchments. The most severely drought-affected forest catchments that experienced the run-off deficits were Hulu Perak, Ulu Gading, Gunung Stong and Relai over Kelantan. The real time run-off change analysis shows that drought started in January and reached its peak in July of 2005. It was therefore demonstrated that this fully satellite-based run-off deficit model is as good as a conventional drought-monitoring indicator, and can provide not only drought distribution information, but it also can reflect the drought-induced impacts on stream flow, forest catchment and land-use.

Graphical Abstract

1. Introduction

Drought is a natural disaster. There are four types of droughts: (1) meteorological (deficit in rainfall from normal); (2) agricultural (crop-response to deficit in soil moisture); (3) hydrological (deficit in runoff, or shortage of streamflow in catchments; and (4) socioeconomic (social response to the above mentioned three types) drought. Droughts have always an impact on economies, societies and the environment [1,2]. Changes in the severity, intensity, frequency, and geographic extent of droughts will have enormous impacts on the hydrological cycle, water management and crop production [3,4,5]. Therefore, it is essential to develop a quantitative measurement technique that can reliably be used for monitoring and predicting drought events [6,7]. Precise and accurate spatial information of drought extent and temporal patterns is critically needed for assessing drought impacts, developing drought mitigation strategies, and minimizing drought-risks [8,9].
Hydrological drought starts with a sustained rainfall deficit, and then it leads to soil moisture content deficit, river streamflow deficit, groundwater shortage, and consequently, influences vegetation health, growth, and land cover [5,9,10,11,12]. Traditional ground-based (in situ) drought observations and monitoring approaches include rain gauge measurements, river streamflow and dam level monitoring. These commonly provide only discrete point-based data records, which may not be sufficient to assess droughts from a spatiotemporal perspective. Although spatial interpolation techniques applied to discrete point measurements can provide the spatial pattern of drought [13], it often provides inaccurate information because of several limitations [14,15]. These limitations can be broadly categorized as: (i) sparse point measurements (inadequate in-situ observations for analyzing regional drought); (ii) limitations of interpolation and extrapolation methods to measure droughts in the areas lacking data; and (iii) the tendency to average out the heterogeneity pattern of drought events. Compared to in situ observations, drought data derived from satellite-based remote sensing data are continuous and regular datasets, which are more suitable for spatiotemporal drought monitoring [16,17].
Techniques for assessing the impact of drought at the regional to global level from satellite data are indirect. They depend on image-based parameters to represent drought conditions and require supporting data from ground measurements in developing models [18,19,20]. Furthermore, a number of remote sensing-based drought indices have been developed that employ either a single hydrological variable [21,22] or multiple hydrological variables [23,24,25]. Near-real-time drought assessment methods have also been proposed [16,26,27], however, they do not provide real-time observations at sufficient spatial and temporal resolution necessary for operational drought monitoring systems [28,29]. In addition, a number of previous studies have suggested hybrid-based models [3,5,25] which are still highly dependent on in situ measurements.
Recently, rainfall-based drought indices derived from the Tropical Rainfall Measuring Mission (TRMM) and Moderate Resolution Imaging Spectroradiometer (MODIS) are used as an alternative to meteorological data for monitoring drought [2,25,30,31,32]. The TRMM is a joint mission between the National Aeronautics and Space Administration (NASA) of the United States and the Japan National Space Development Agency (NASDA) of Japan to study rainfall for climate research. The MODIS is a payload scientific instrument, launched by NASA on board the Terra and the Aqua satellites to study global dynamics and processes occurring on the land, in the oceans, and in the lower atmosphere. These data sets have been compared and validated against in situ observations [33]. However, hydrologic models that use in situ observations of drought-related variables (e.g., soil moisture, and evapotranspiration) as input or for data assimilation are limited or unevenly distributed across spatiotemporal scales. Readers can consult the review of AghaKouchak and others [16] for further details.
There is a high variability of rainfall in the Southeast Asian region where maritime effects are strong [34,35]. Understanding input data variability (e.g., spatiotemporal variability of rainfall) is fundamental to gaining knowledge about hydro dynamics over various scales and to monitoring drought events [36]. Run-off models that are independent of ground measurements with a good ability to characterize the most influential hydrological variables, such as rainfall and evapotranspiration, are rare [16]. There is therefore a need for integrating satellite-derived rainfall, evapotranspiration and soil moisture into operational drought applications to improve the usability of satellite-based drought information.
Peninsular Malaysia has limited (5–6) meteorological stations that record both rainfall and evapotranspiration rates and, therefore, relies on interpolation techniques for rainfall estimates. The lack of detailed studies on drought and its impact on vegetation growth in this region is, therefore, partly because of the problem of missing data [37]. Therefore, the objectives of the study are (1) to calibrate and compare the spatiotemporal characteristics of both daily TRMM rainfall and MODIS evapotranspiration products with that of rain gauge data in the Kelantan and Hulu Perak catchments of Peninsular Malaysia (run-off deficit data as a component of water balance equation is used to calibrate TRMM rainfall and MODIS evapotranspiration and different statistical measures are calculated to validate drought indicators); and (2) to compare the performance of the satellite-predicted run-off and actual streamflow data for a severely affected catchment. An additional analysis on land-use and run-off deficit during a drought season is conducted to examine the utility of the run-off model for the drought impact assessment. This study contributes to the enhancement of our knowledge regarding the usefulness of TRMM rainfall and MODIS evapotranspiration in run-off deficit modeling studies at varying spatial (catchment) and temporal scales.

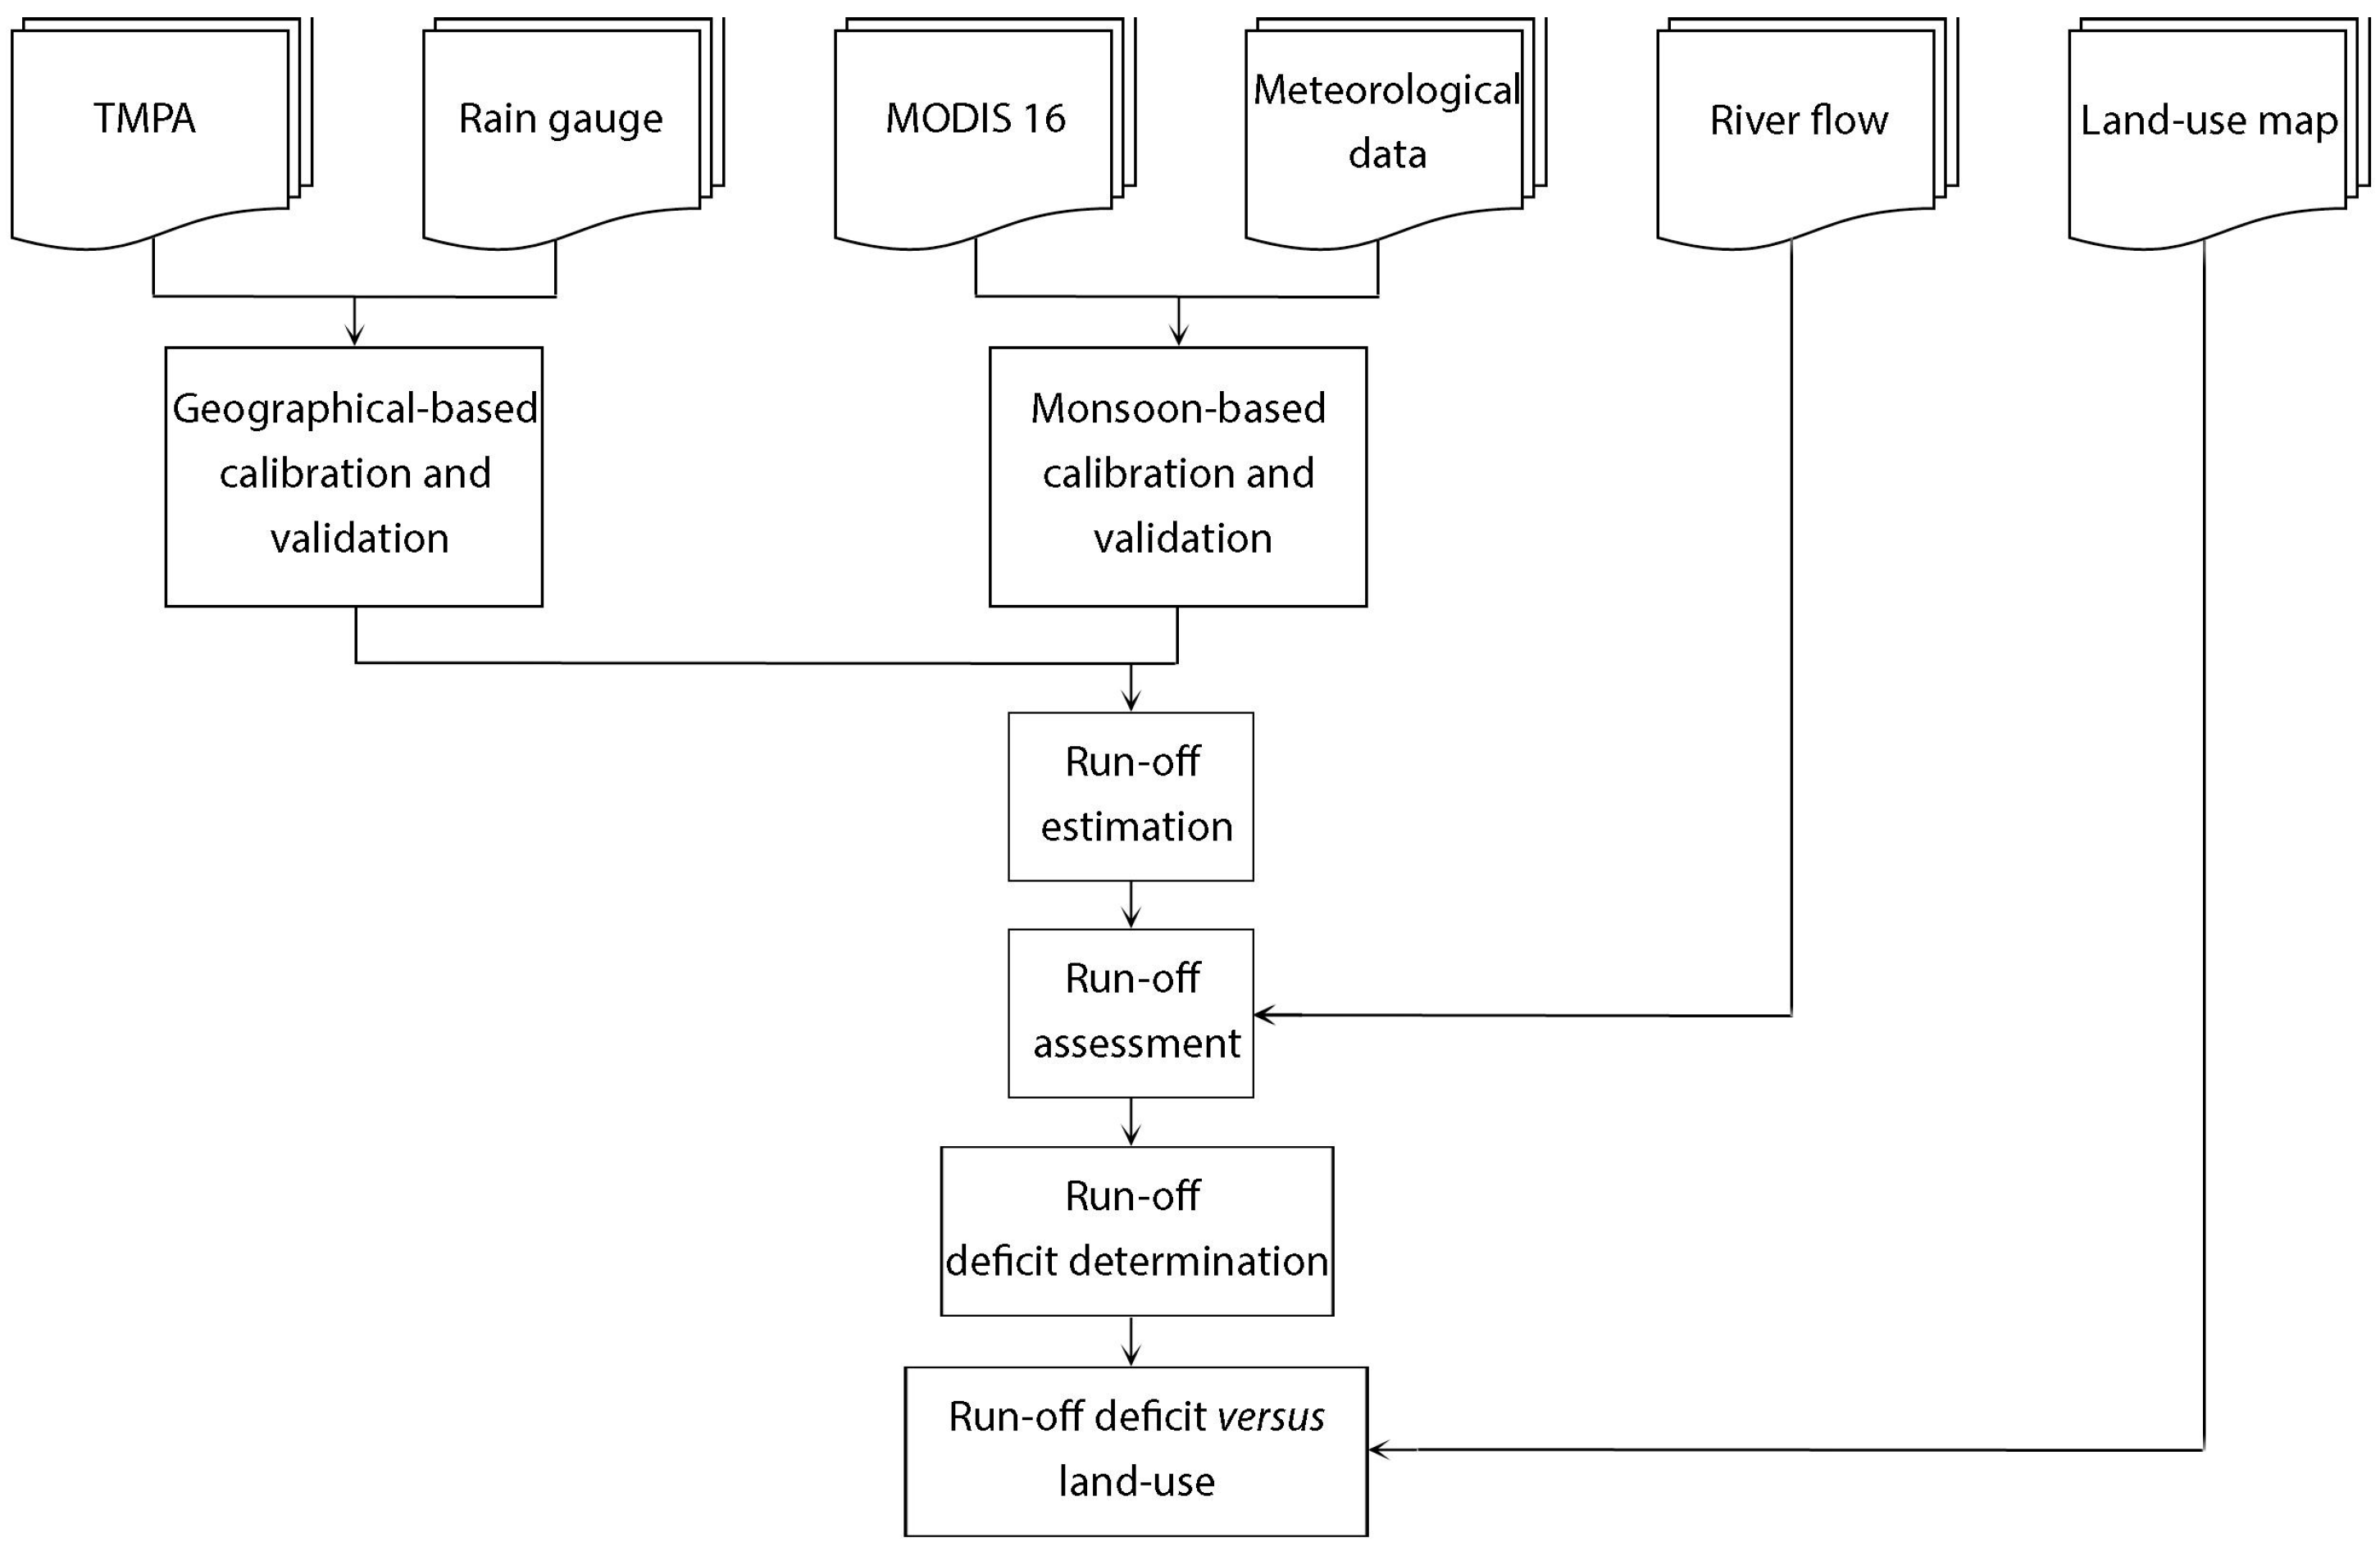
2. Materials and Methods
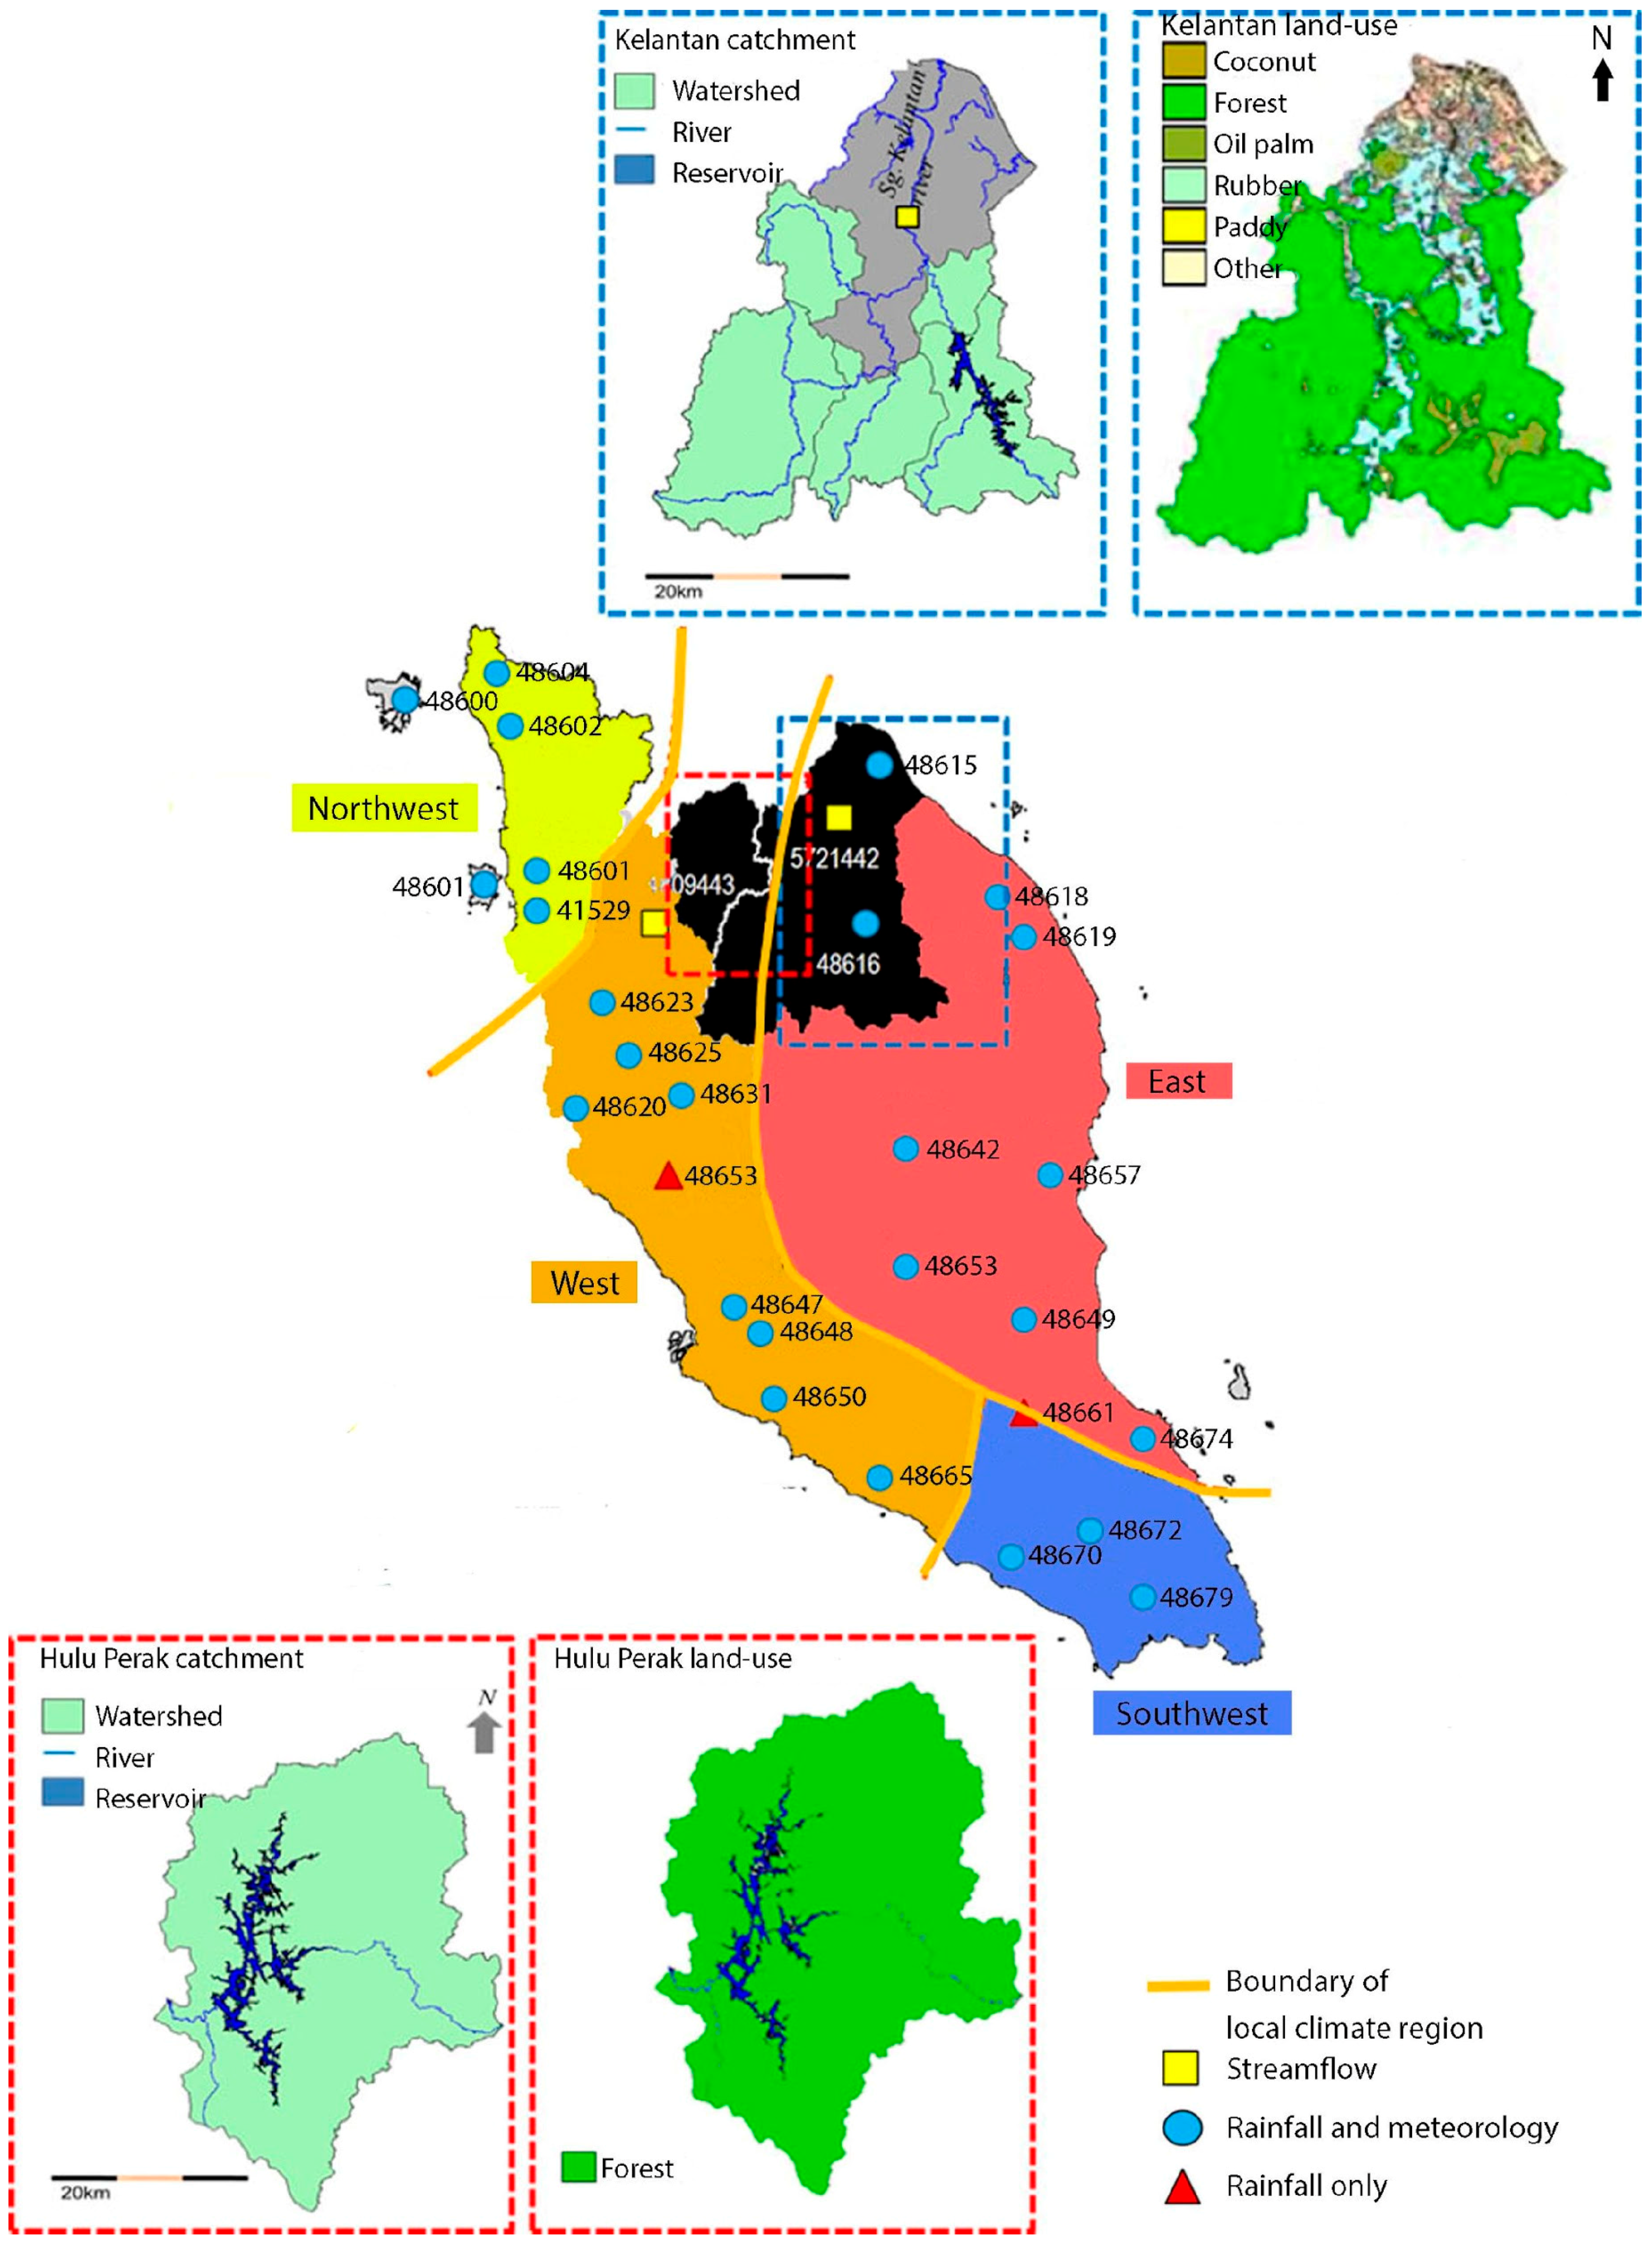
2.1. Study Site

The study was carried out in the state of Kelantan and Perak, where a notably severe drought occurred in 2005 (Figure 1). Kelantan state, located in the northeast Peninsular Malaysia, experiences the highest record of mean monthly rainfall (2709 mm/year; computed from 1973 to 2011 rainfall data) while Hulu Perak, located in the northwest, receives the third highest rainfall (2453 mm/year; computed from 1973 to 2011 rainfall data). Both states experience humid tropical climate with a distinct wet season (NEM; northeast monsoon) from November to March, a dry season from May to September (SWM; southwest monsoon) and inter-monsoon seasons (hereafter IM) in April and October (Figure 2). The main river Kelantan has a length of 248 km and Hulu Perak has a length of 85 km, with catchment areas of about 3448 km2 and 3672 km2, respectively. The Kelantan flows northward while the Hulu Perak flows westward, and both discharge into the South China Sea.
Of the total 15,026 km2 land area of Kelantan state, 64% is covered with forests and the rest with rubber (14%), paddy, oil palm and other land-uses. Presently, the Hulu Perak catchment is covered by extensive forests (94%) with some (5%) water bodies.
Due to the El Niño, there were drought effects in the form of rainfall deficit in the years 2005 and 2009 in this region (Table 1). According to the Malaysian meteorological report, the increasing global sea-surface temperature, especially at the equatorial belt, is believed to be the major cause of El Niño events [38]. The decreasing trend of rainfall leads to a decrease in river flow and reduction of dam storage. The river flow readings were recorded as only 128 m3/s at Kelantan and 183 m3/s at Hulu Perak River, which were significantly lower than the average (261 m3/s and 196 m3/s in normal condition at Kelantan and Hulu Perak River, respectively).

2.2. Datasets and Methods

The concept of drought assessment is to extract run-off information from multi-temporal satellite images, acquired during normal and drought conditions. The spatial-based drought assessment was carried out using the following analyses: (1) measurement of run-off deficit (Equation (1)); (2) analysis of run-off deficit versus land-use; and (3) comparison of satellite-based run-off values during the drought and the actual stream flow in a severely affected forest catchment for validation. The overall study methodology is illustrated in Figure 3. In addition, a qualitative assessment was performed using the visual analysis of multi-temporal run-off maps. This study considered that run-off variability of drought and non-drought years could potentially be used as an indicator of drought and hence as a proxy for hydrological drought characterization and assessment.
The run-off deficit (RD in %) was defined by the following formula:
R D = ( N r ) ( D r ) ( N r ) ×   100 %
where Nr is the normal run-off value based on the monthly run-off without severe drought and Dr is the run-off during a drought season.
The conventional water balance equation was used in developing the satellite-based run-off models described in Thornthwaite and Mather [40]. Procedures introduced by Mahmud et al. [41] were adapted. This equation is expressed below:
R o = P E ± S m
where RO is run-off, P and E are satellite rainfall and evapotranspiration, respectively, and Sm is soil moisture. The available water capacity was fixed at 250 mm based on two main assumptions: (i) the average rooting depth of the vegetation is about 1.5 m [42]; and (ii) the soils in Peninsular Malaysia are predominantly silt loams (58%), clay loams (30%) and clays (12%) [43]. The soil moisture retention information was taken from Thornthwaite and Mather [41]. The soil moisture (Sm) and the accumulated potential water loss (APWL) have the following exponential expression:
S m = a .   e b . A PWL
where both a and b are constants. Given a fixed water holding capacity of 250 mm, the values for a and b are 249.5 and −0.0040, respectively.

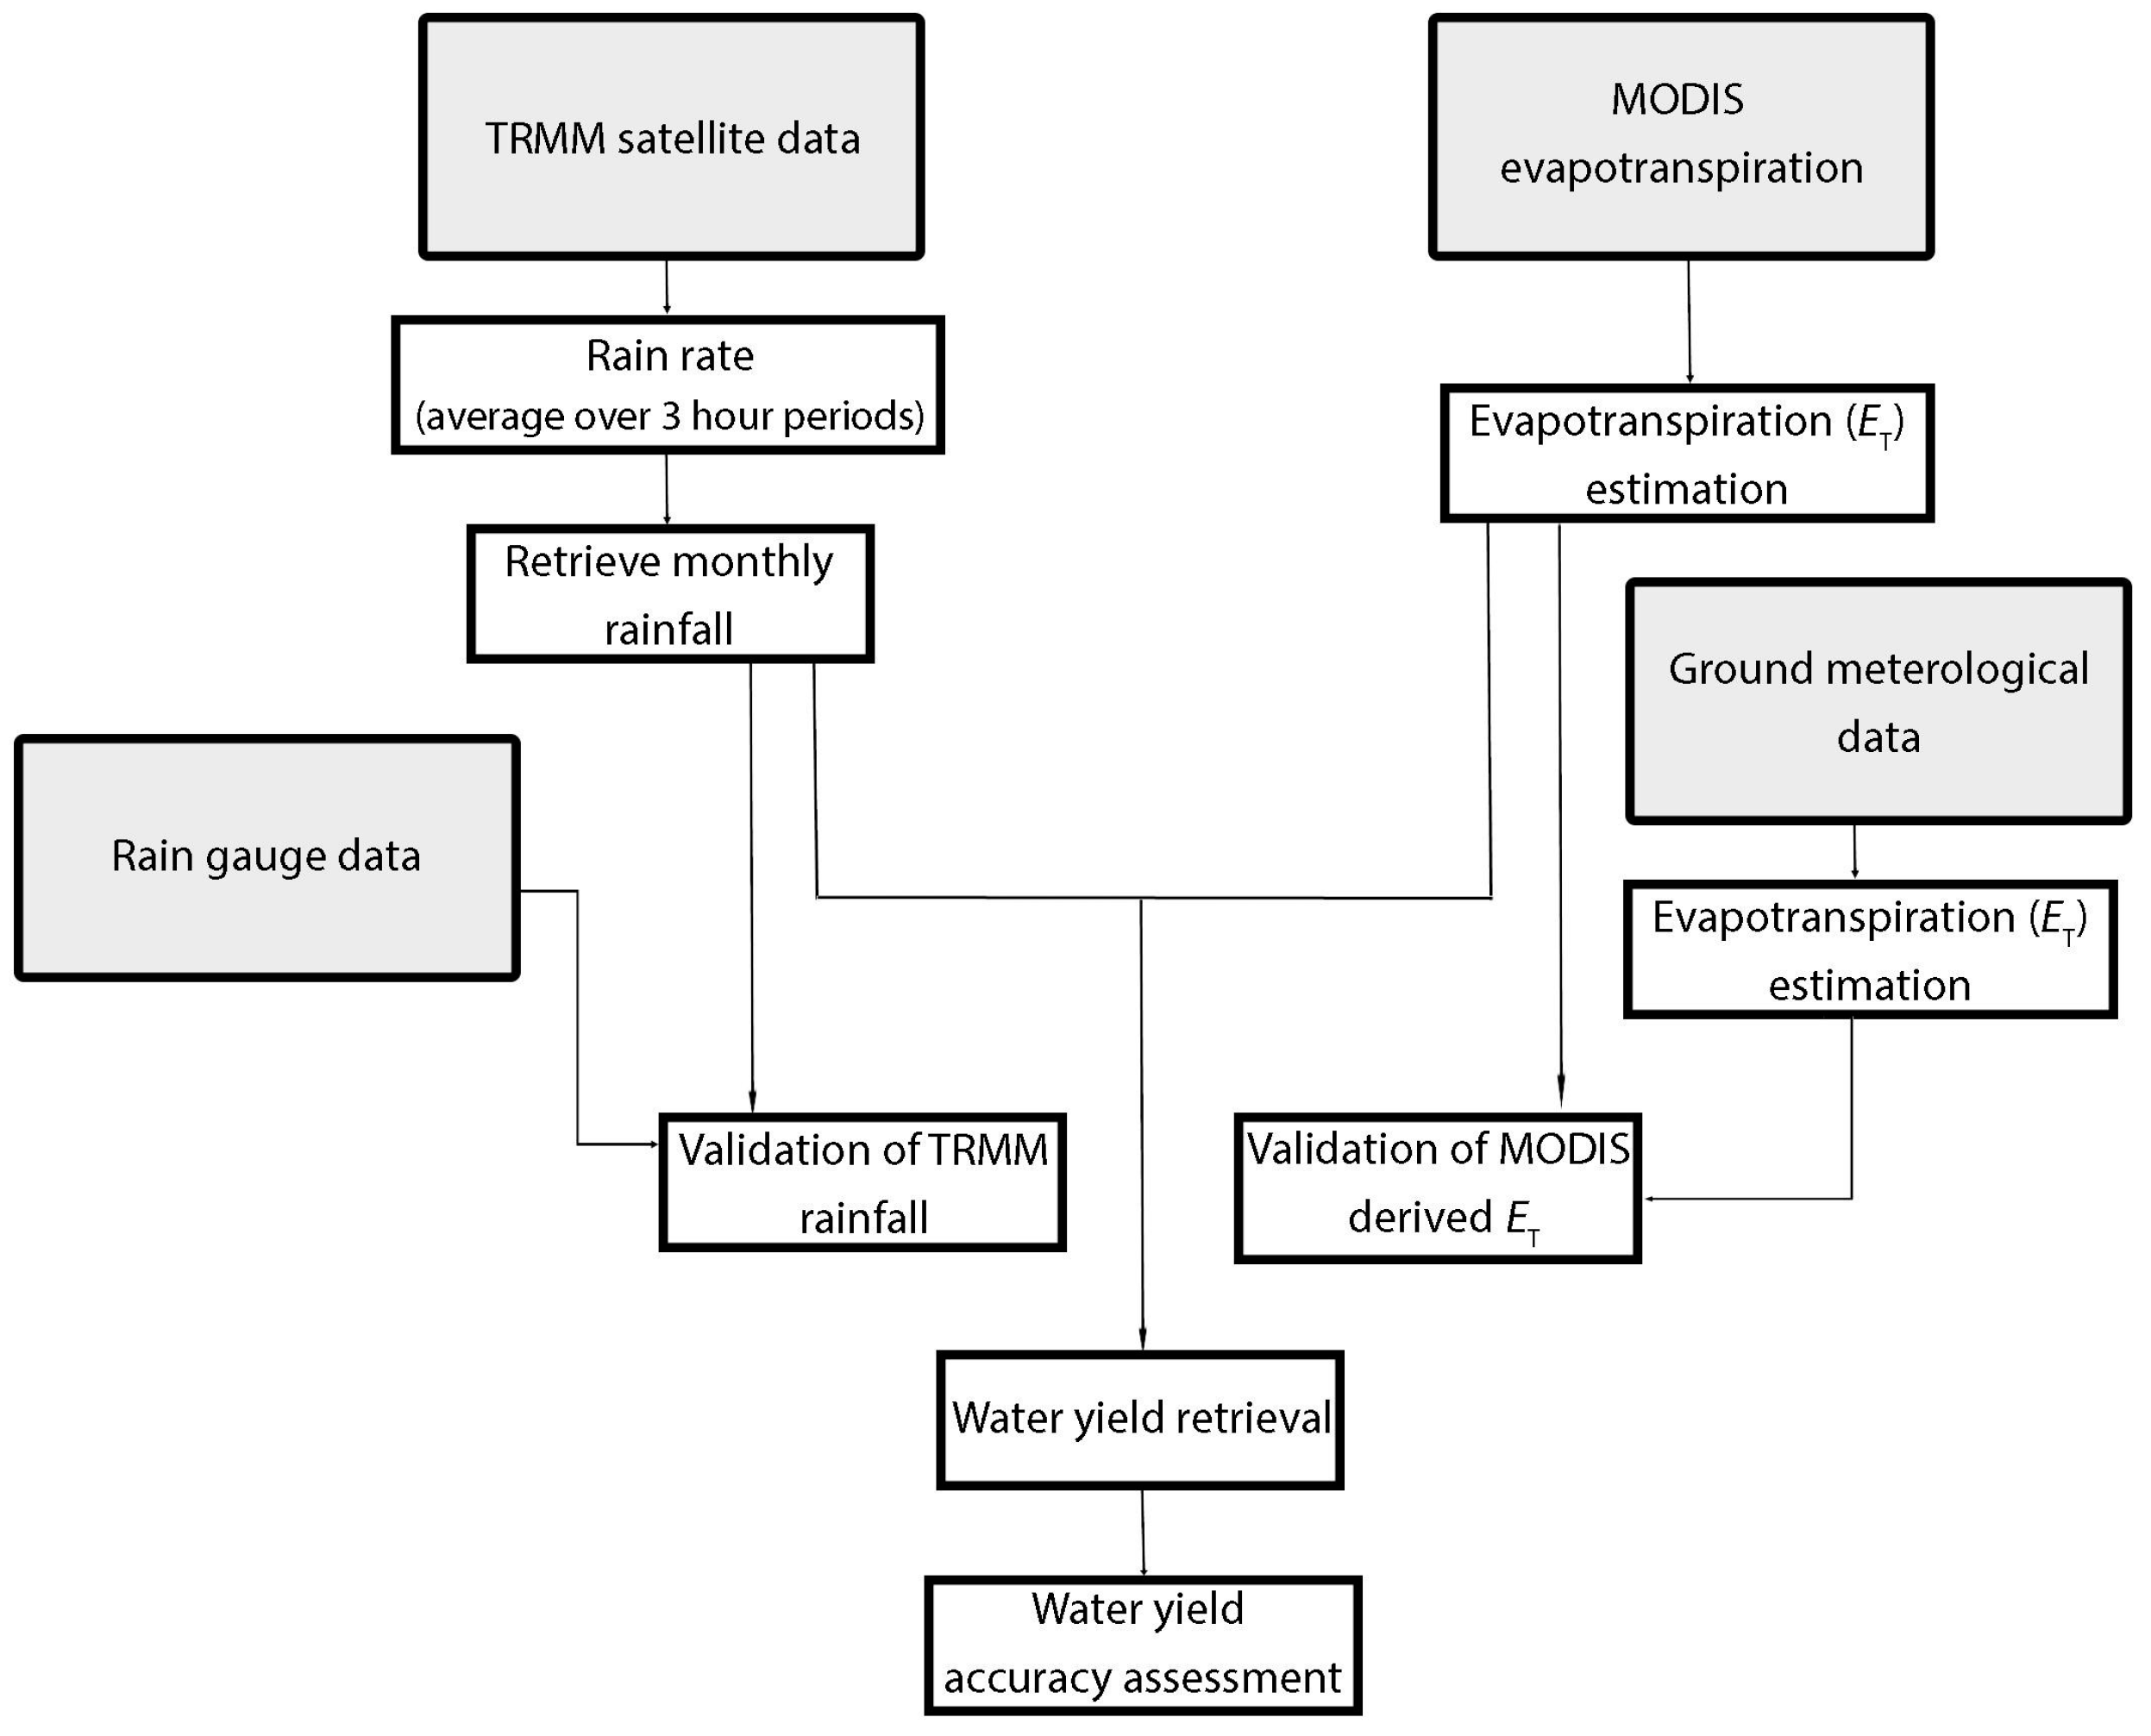
2.2.1. Rainfall Retrieval from TRMM Multi Satellites Precipitation Analysis Data (TMPA)

Rainfall is one of the primary variables of the satellite-based run-off model. The TRMM Multi-satellite Precipitation Analysis (TMPA) version 7 data, released by the NASA Goddard Earth Sciences Data and Information Services Center (GES DISC) consists of rainfall observations at three temporal resolutions: 3-hourly (3B42), daily (3B42 derived), and monthly (3B43). The TMPA 3B42 version 7 data product provides a standard 3 hourly rain rate at global scale with 0.25 degrees resolution covering 50 degrees latitude in the northern and southern hemisphere. The data can be directly downloaded from the Internet link: [44]. The daily rainfall amount is obtained by multiplying the provided three-hour average rain rate of eight datasets per day by three. The daily rainfall amount is then accumulated to estimate monthly rainfall. The equations used for the calculation of daily (Dr) and monthly (Mr) rainfall are as follows:
D r = i = 1 8 ( R r i ) × 3
M r = D r ( mm ) × N d
where Rr is the three hour rain rate, Mr is the monthly rainfall, and Nd is the number of days per month. To maximize the ability of 0.25 degrees (27 km) TMPA rainfall data to depict local rainfall patterns, a spatial downscaling reduced the grid to 1 km. The study area, categorized as small-size region, experienced large measurement errors. These errors could possibly be caused by the conflict between the insensitive coarse grid data and dynamic local hydrometeorology properties [45]. The spatial downscaled algorithm suggested by Mahmud et al. [41] was employed for determination of the monthly site specific co-efficients. The co-efficients were obtained from historical bias records based on specific monsoon seasons. Thus, the site specific mean of each pixel was calculated. The equations used for the downscaling process are as follows:
HRC ( i , j ) = 1 n   R s a t ( i , j ) R g ( i , j )
D S a t ( i , j ) = R s a t ( i , j ) HRC ( i , j )
where HRC is the high resolution co-efficient, R s a t is the satellite-based rainfall data that was re-gridded at 1 km resolution, R g is the interpolated ground rainfall at 1 km resolution, n is total number of pixels, and D S a t is the downscaled satellite rainfall (at 1 km). A comparison of ground-based measurements with the satellite-based TMPA data is given in Table 2.
The evapotranspiration (ET) values were obtained by calibrating the MODIS 16 data product. MODIS provides the evapotranspiration estimates at varied spatial (from 500 m to 5 km) and temporal resolutions (from daily to monthly scales). It uses vegetation cover reflectance and temperature information coupled with ancillary atmospheric parameters in an energy balance model to estimate the potential evapotranspiration [45].
A run-off map was produced based on estimated values derived from spatial inputs in the water balance equation. Applying the same procedure to multitemporal run-off images enabled us to visualize the effect and impacts of differences between pre- and post-drought conditions. Satellite-based rainfall data used in this study are TRMPA and MODIS daily data from January 2000 to December 2010 (Figure 2). Because the variability of seasons affects the amount of rainfall in the Peninsular Malaysia, the calibration of multitemporal TRMPA and MODIS data sets at micro-climatic scale is required. For the calibration of TMPA rainfall, gain and offset errors were computed by correlating the TMPA rainfall with rain gauge data at a monthly time scale. Regression analysis between MODIS data and in situ observations collected from meteorological stations in the Peninsular Malaysia was used for the calibration of the MODIS evapotranspiration data sets (MODIS 16A). Ground data pertaining to this study was supplied by the Malaysia Meteorological Department (MMD), collected from 26 stations (Table A1).
In this study, the monthly run-off maps were produced based on datasets of three consecutive years: 2003, 2004 and 2005. Based on the monthly average run-off years, two consecutive years, 2003 and 2004, represent here normal run-off conditions, while the year 2005 represents a drought period. Observations on the run-off pattern for continuous months enabled us to study the spatiotemporal aspects of the drought. The run-off deficit was calculated based on per pixel spatial scale and enabled us to produce the continuous and regular run-off maps. The standard procedures for estimating the run-off deficit from the satellite-based data is shown in Figure 4.
The rainfall data was calibrated based on the Geographical Difference Analysis approach, introduced by Bastiaanssen et al. [46] which was tested for the Indus Catchment. Because of the differences between the satellite- and ground-based rainfall data, calibration is essential to minimize existing errors over the study area [47]. Details of the calibration scheme were provided in Nadzri and Hashim [48] and therefore only a brief description is given here.
The geographical based calibration requires location-specific corrections. The equations used for the calibration are as follows:
Δ R d i f ( i , j ) = R s a t ( i , j ) R g ( i , j )
Δ R i p ( i , j ) = i = 1 n Δ R d i f ( i , j ) *   1 d r i = 1 n 1 d r
R c s a t ( i , i ) = D s a t   ( i , j ) Δ R i p ( i , j )
where R s a t ( i , j ) is the satellite-based rainfall and R g ( i , j ) is the rain gauge data at a location (latitude (i), longitude (j)), D s a t   ( i , j ) is the downscaled satellite-based rainfall, Δ R i p ( i , j ) is the correction values, d is the distance between the centroid and neighbouring points, r is the order of the interpolation, and R c s a t ( i , i ) is the calibrated rainfall, and R r a w ( i , j ) is the uncorrected satellite-based rainfall.

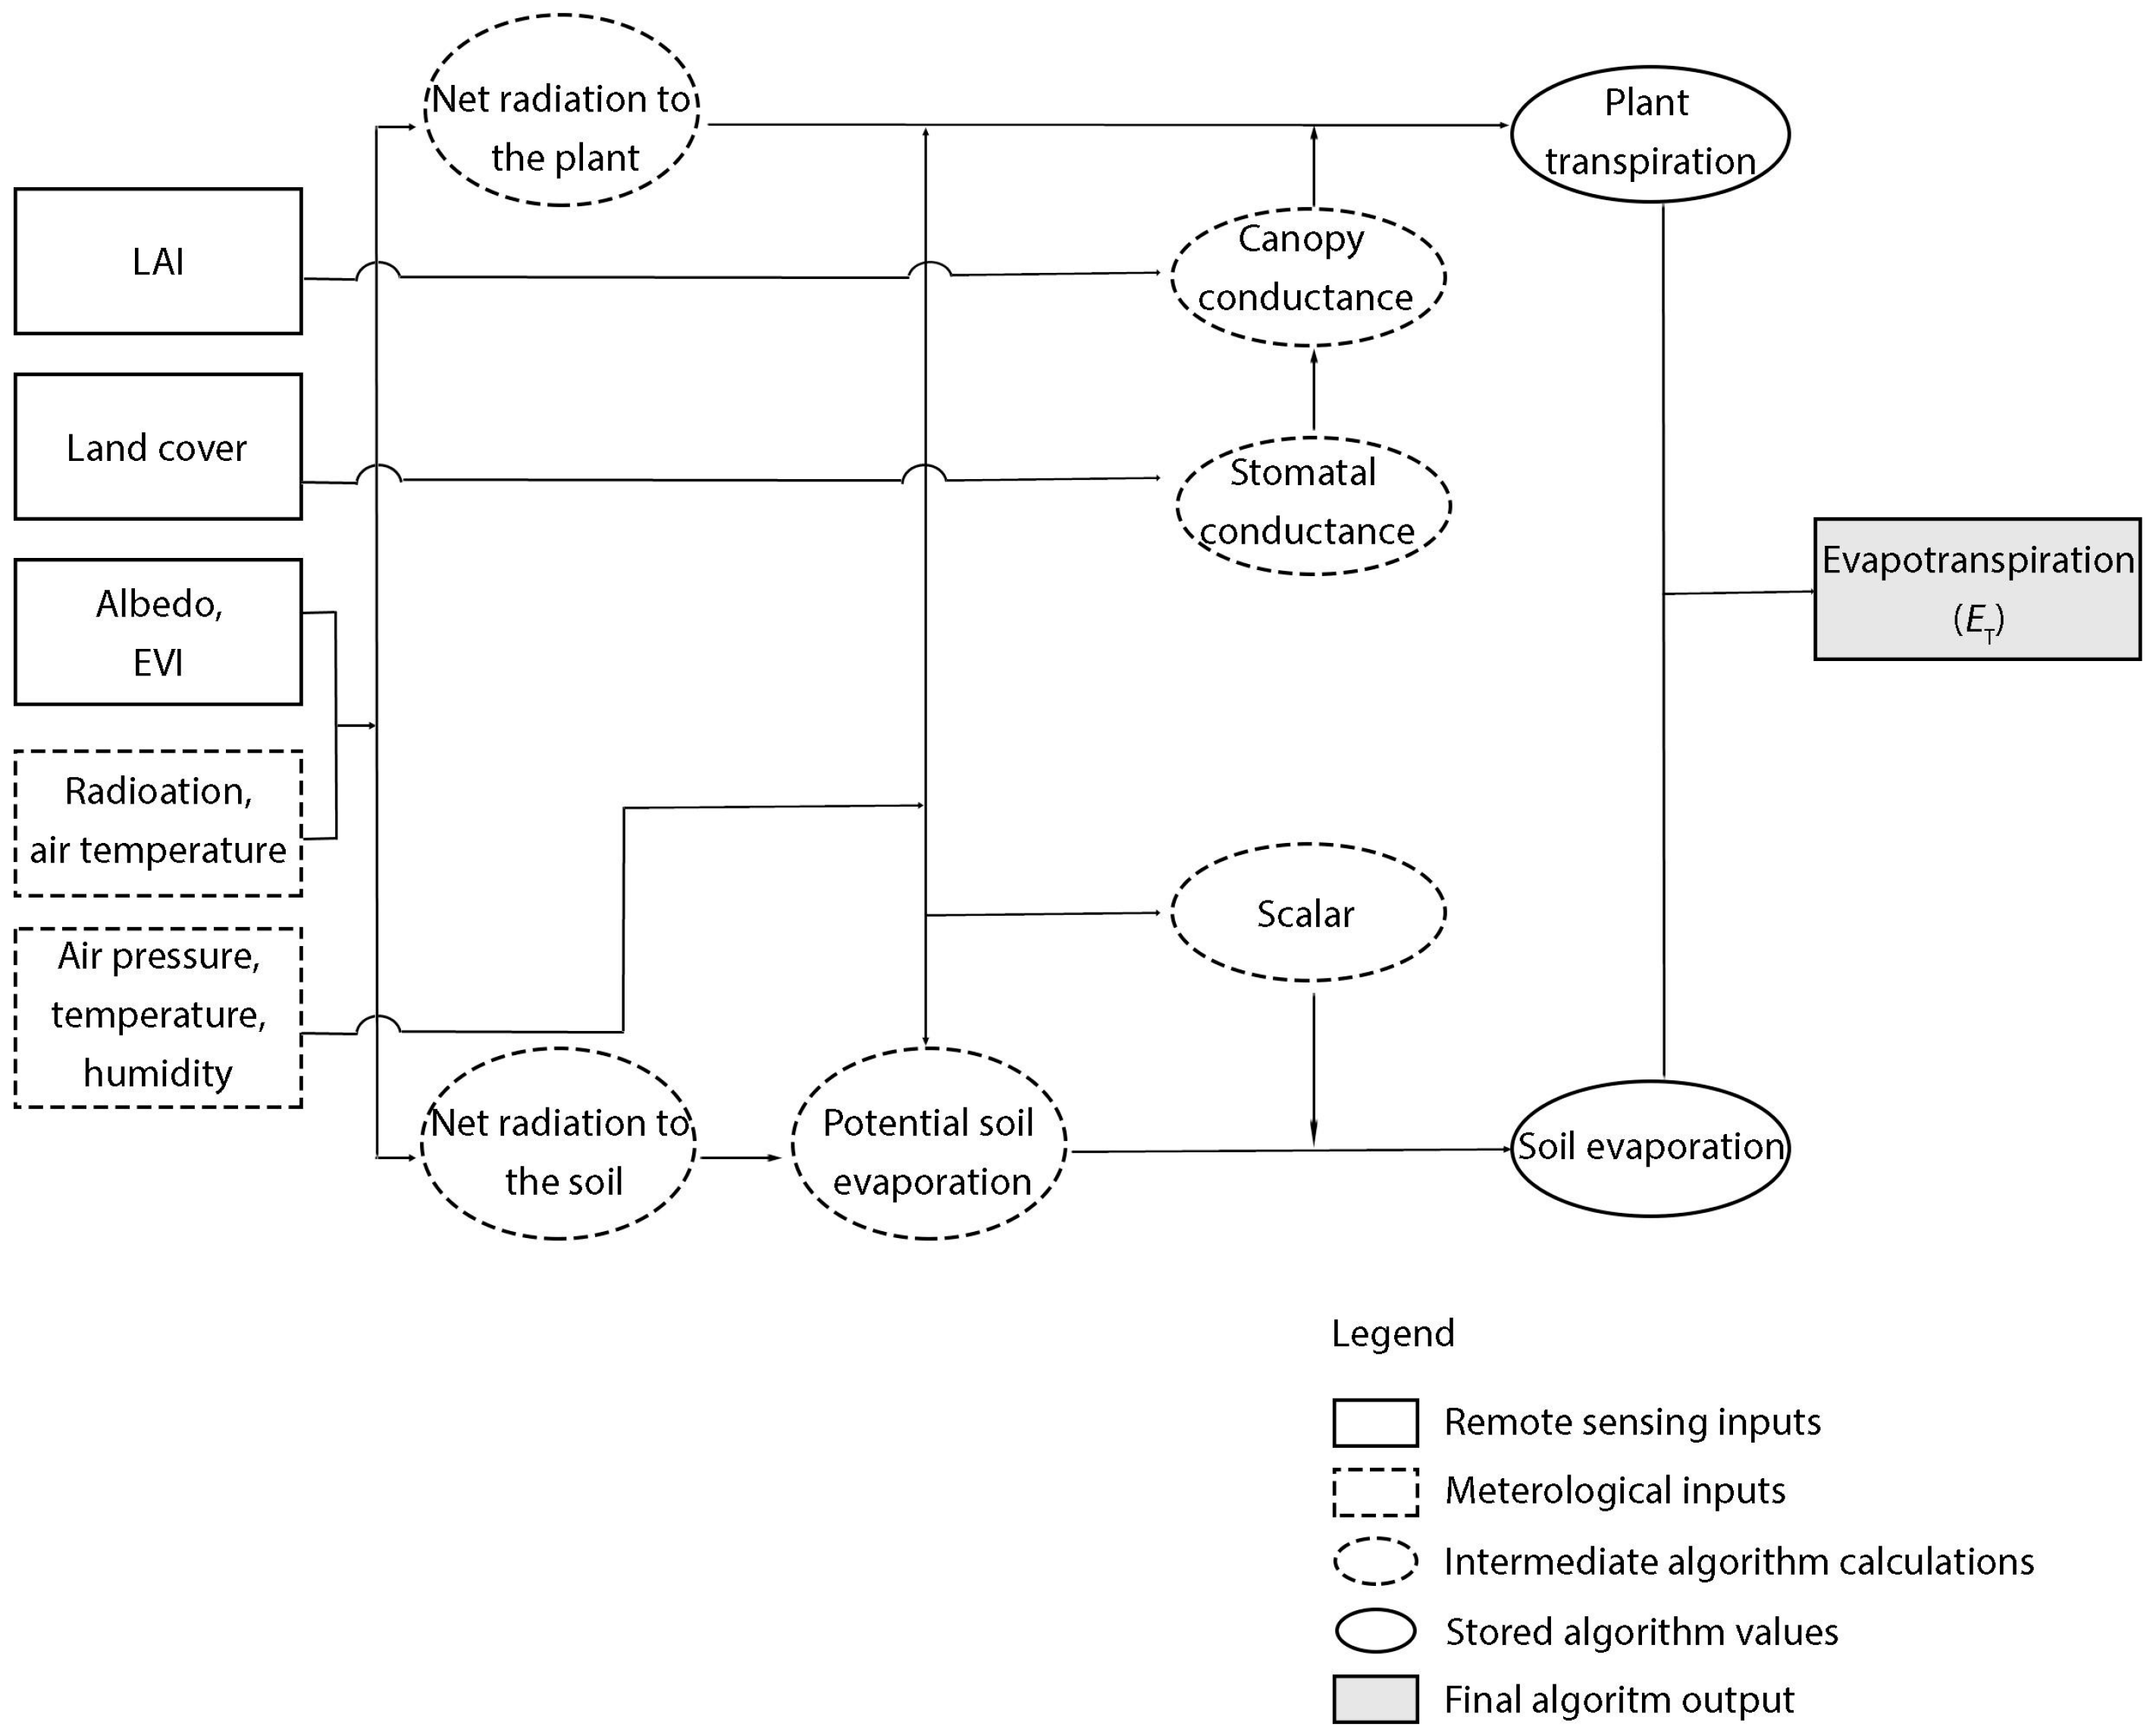
2.2.2. Calibration for Evapotranspiration (ET) retrieval from MODIS16A Data Set

Evapotranspiration (ET) is the second parameter used in developing the satellite-based run-off model. The algorithm used to estimate the ET from the satellite data was developed by Mu et al. [45]. However, in this research, the ET was retrieved from the digital number (DN) of MODIS 16A data product. The ET values were multiplied by a constant to convert DN into millimeter per month (Equation (11)).
E T = M O D I S 16 A H D F × a
M O D I S 16 A H D F = S × A × C ρ ( e s a t e ) / r a s + y   ( l + r s / r a )
where E T is the total evapotranspiration estimates at monthly intervals (mm/month), M O D I S 16 A H D F is unitless E T in HDF format, a is a constant which is set to 0.1, s = d ( e s a t ) / d t s = denotes slope of the curve relating saturated water vapor pressure ( e s a t ) to temperature, A is available energy partitioned between sensible heat, latent heat and soil flux on land surface, ρ is air density, C ρ is the specific heat capacity of air, r a is the aerodynamic resistance and r s is the surface resistance. Surface resistance was parameterized using satellite leaf area index and vegetation fraction cover. γ is the psychrometric constant.
The detailed procedure for estimating MODIS ET is presented in Figure 5.
The satellite-based ET provides data at global scales. Although several validations of those datasets have been done for other climates, such as America and Asia [49], specific validation, particularly for tropical regions was conducted by Nadzri and Hashim [48]. Those studies suggested that it is necessary to calibrate data to obtain better results. Moreover, those studies have shown that errors are associated with seasonal variations that need to be calibrated by using linear regression based on monsoon characteristics following the expression given below:
E T c a l i = a × E T M O D I S + c
where E T c a l i is the calibrated satellite evapotranspiration, and a and c are the coefficients of calibration. Table 3 shows the variations between satellite- and ground-based E T s values.

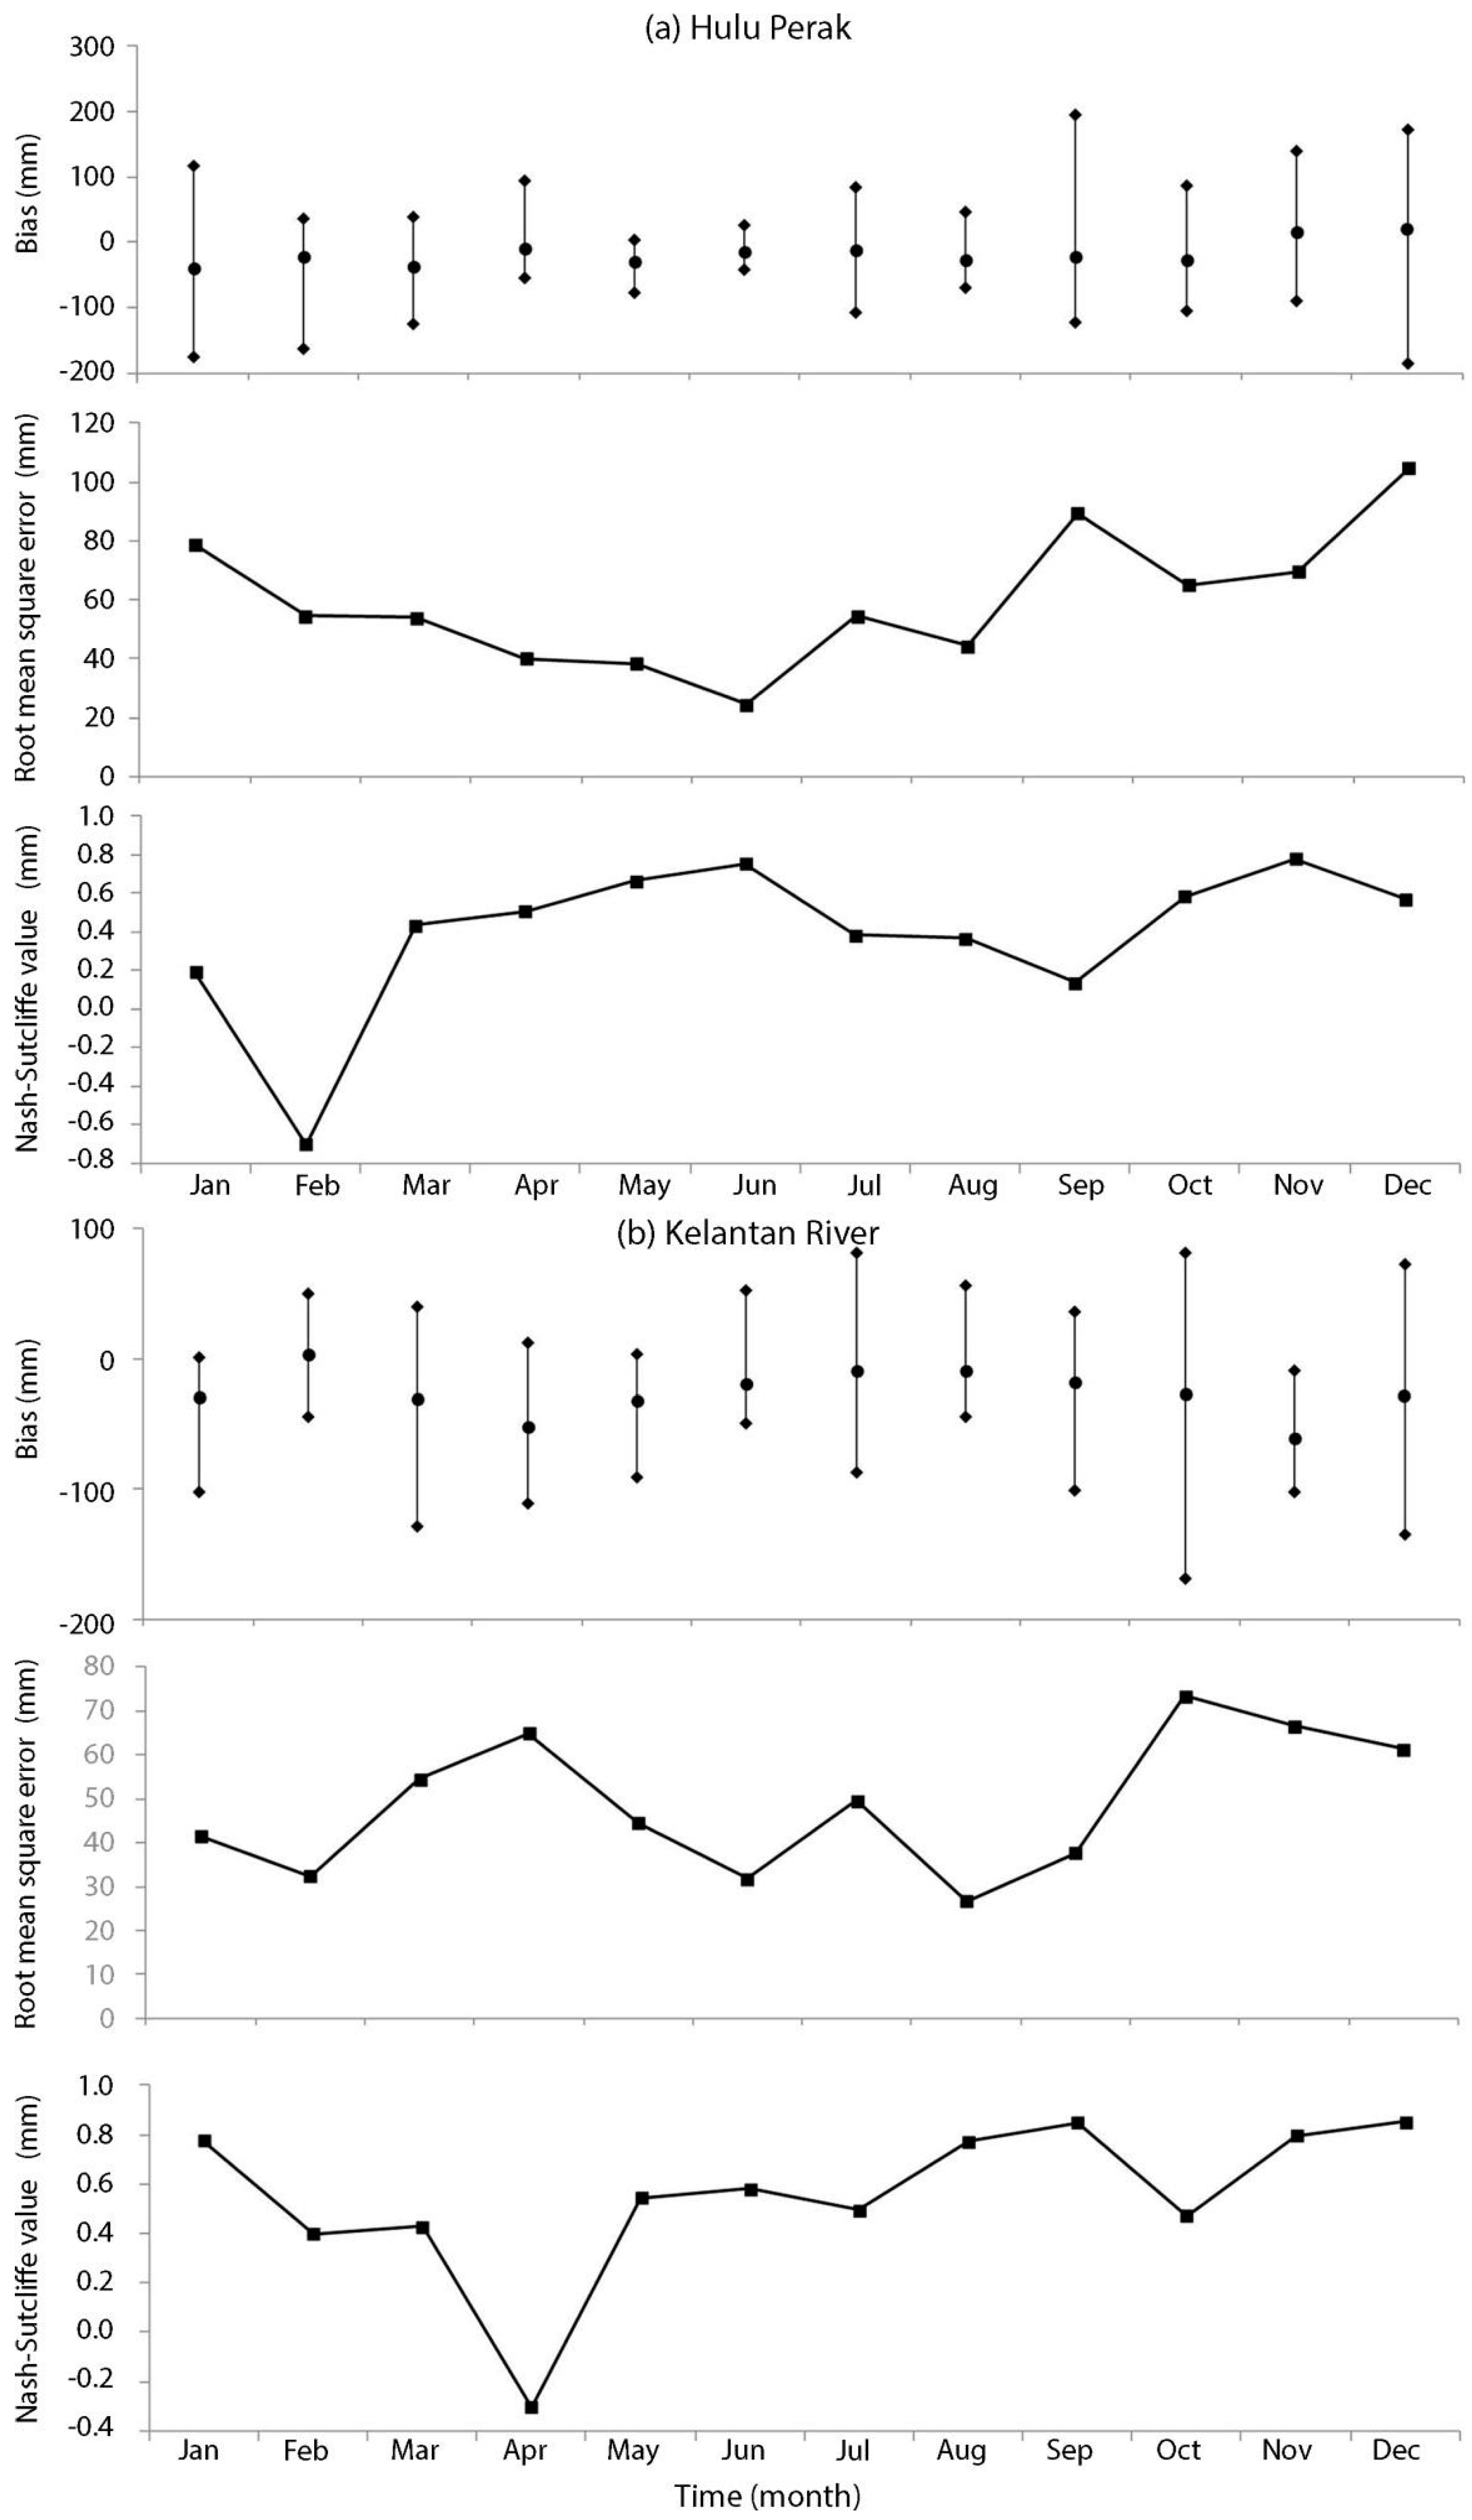
2.2.3. Accuracy Assessment

To assess the accuracy of the calibrated TMPA and MODIS 16, validation tests were conducted. Eighty percent of the rain gauge data randomly selected from 18 stations was used for the TMPA calibration and the remaining 20% were used for validation. The MODIS data was calibrated using rain gauge data collected in the periods between 2000 and 2005 and validated using data collected in the period between 2006 and 2010. To statistically evaluate the performance of the calibrated TMPA and MODIS 16, we used five statistical indices: (1) bias (b); (2) mean absolute error ( M A E ); (3) root mean square error (ERMS); (4) Nash-Sutcliffe value (Nr); and (5) Pearson correlation coefficient (r). The error matrices can be computed as follows:
b = i = 1 n ( R s a t R g ) n
M AE = i = 1 n R s a t R g n
E RMS = [ 1 n i = 1 n ( R s a t R g ) 2 ]
N r = 1 i = 1 n ( R s a t R g ) 2 i = 1 n ( R g R g ¯ ) 2
r = 1 n × i = 1 n ( R g R g ¯ ) × ( R s a t R g ¯ ) ( n × i = 1 n R g 2 ( i = 1 n R g ) 2 n × ( n 1 ) ) × ( n × i = 1 n R s a t 2 ( R s a t ) 2 n × ( n 1 ) )
where R g is the observed ground rainfall, R s a t is the satellite-based rainfall, and n is the number of pixel.

3. Results

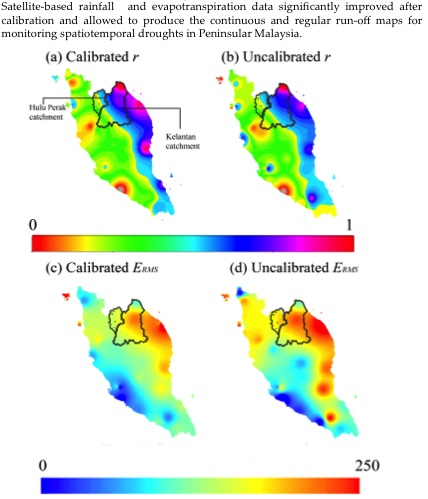
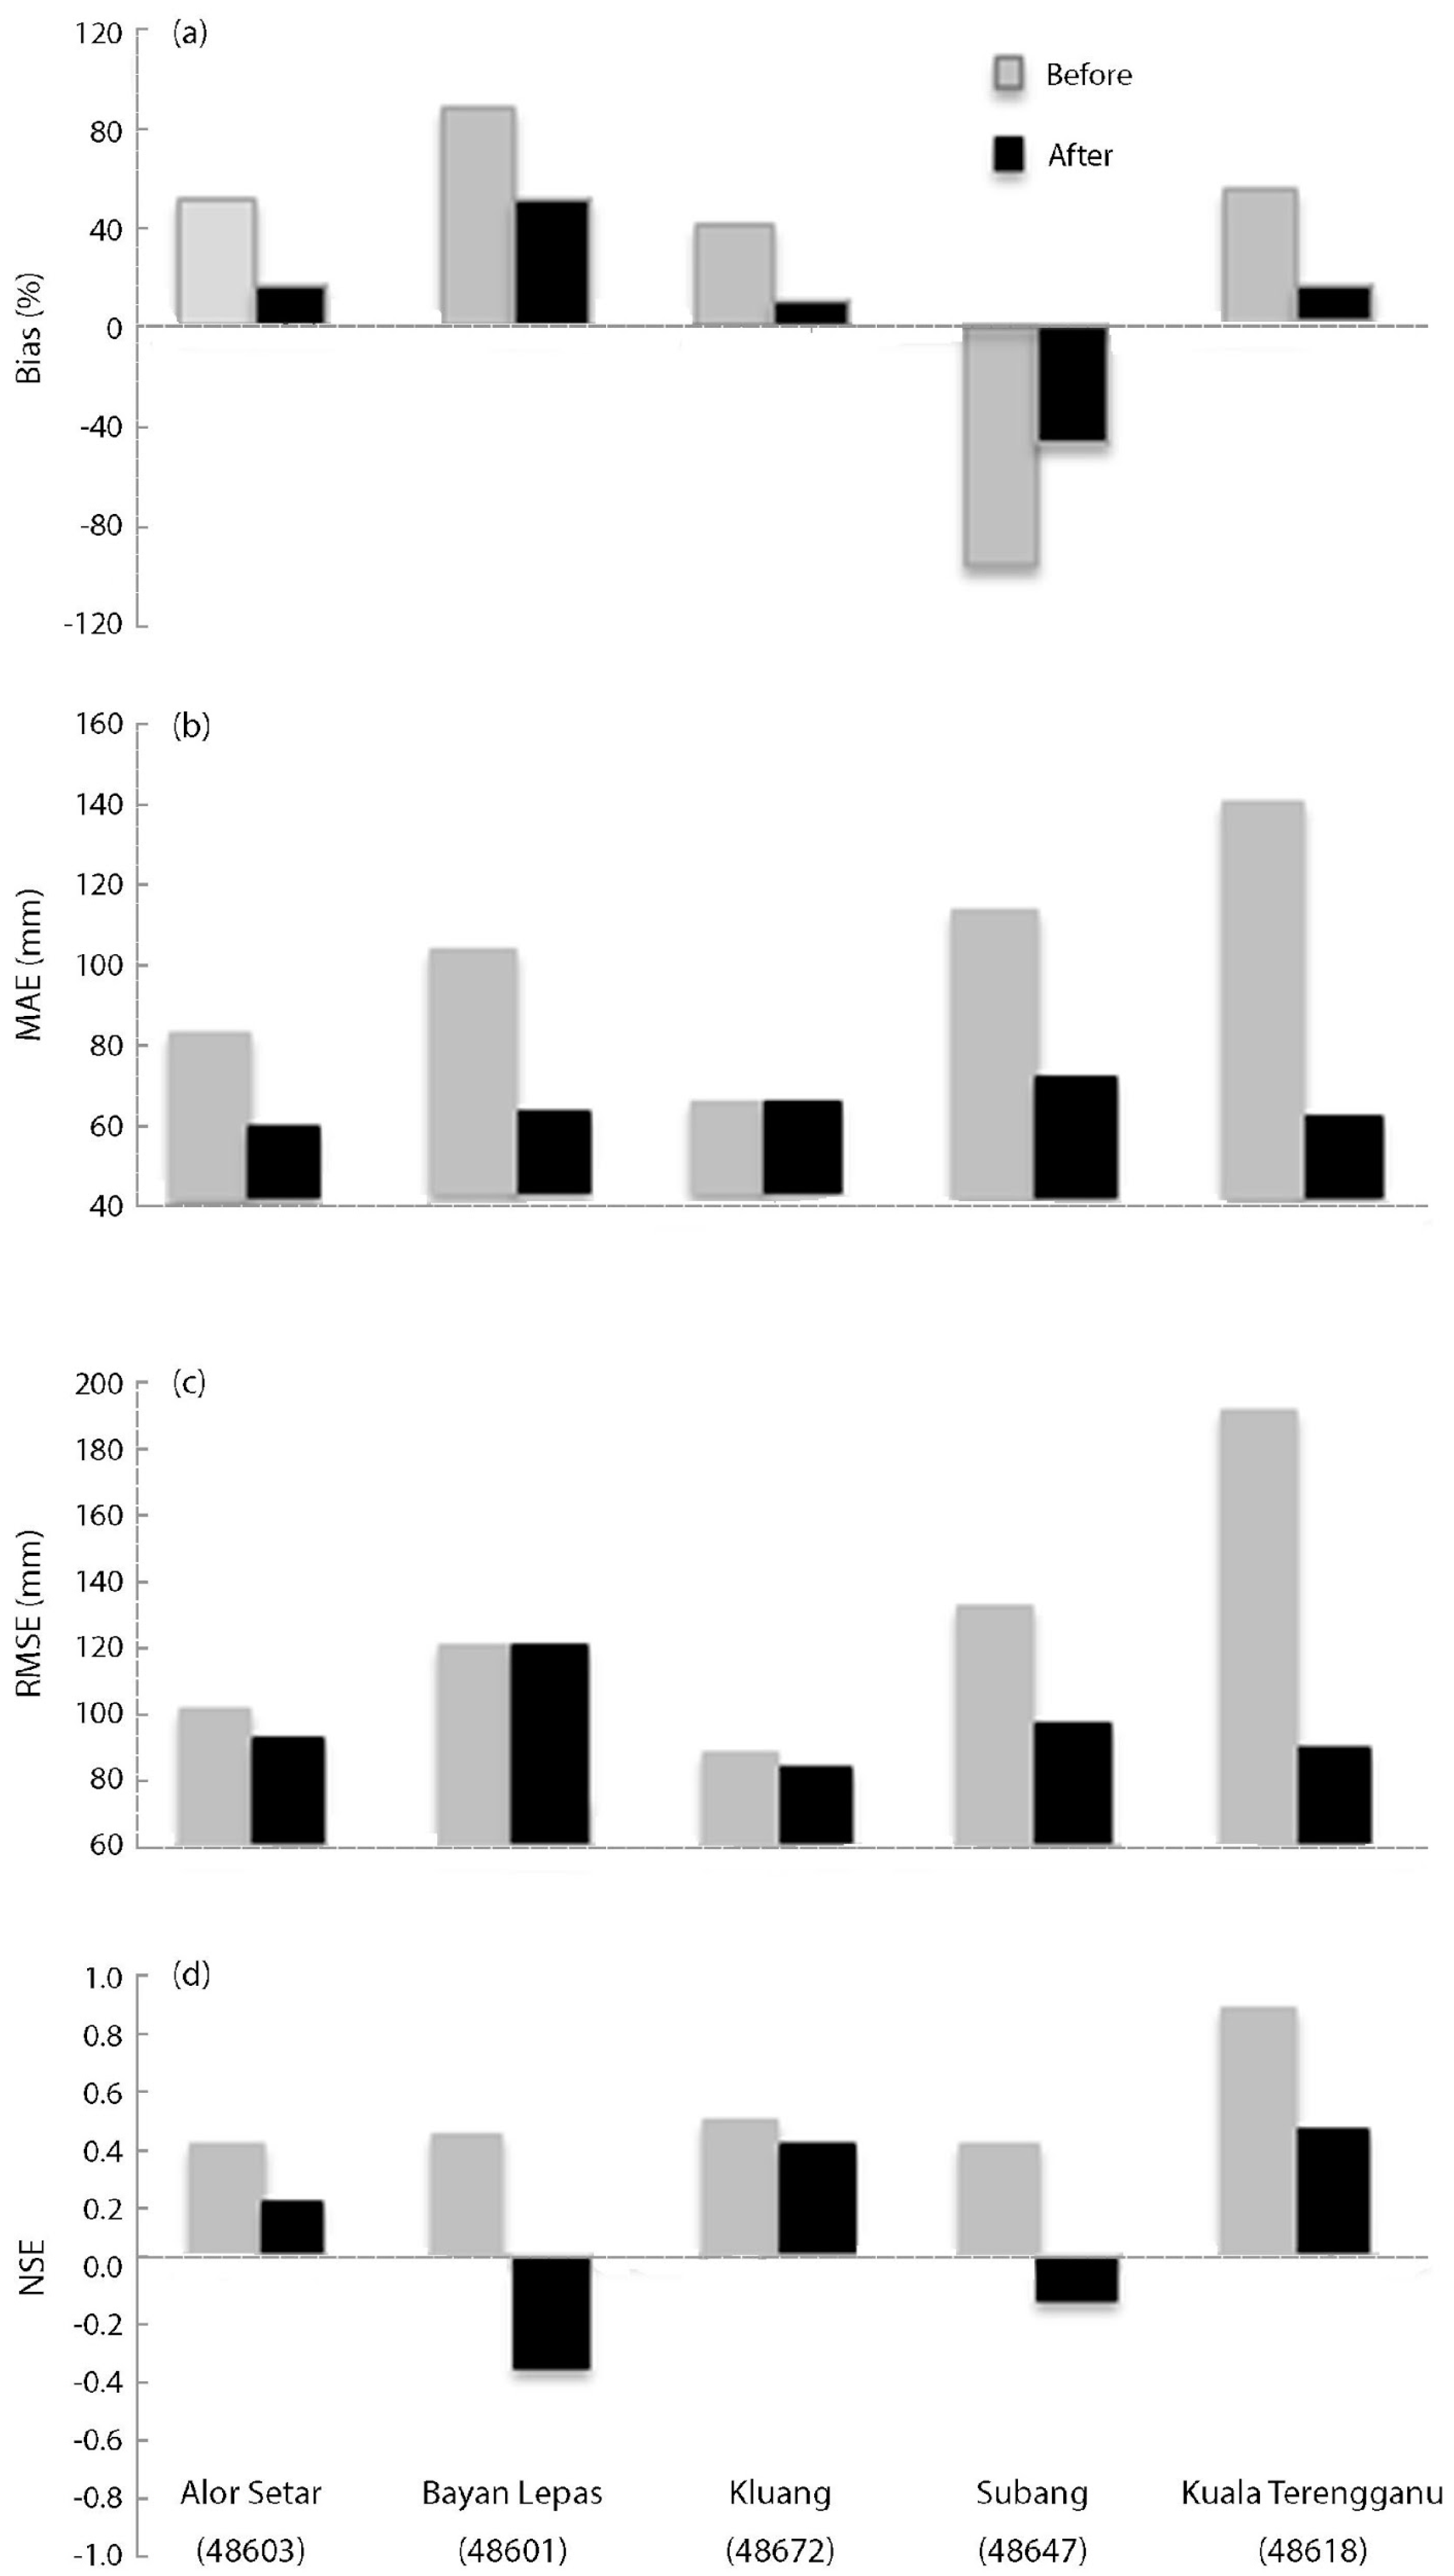
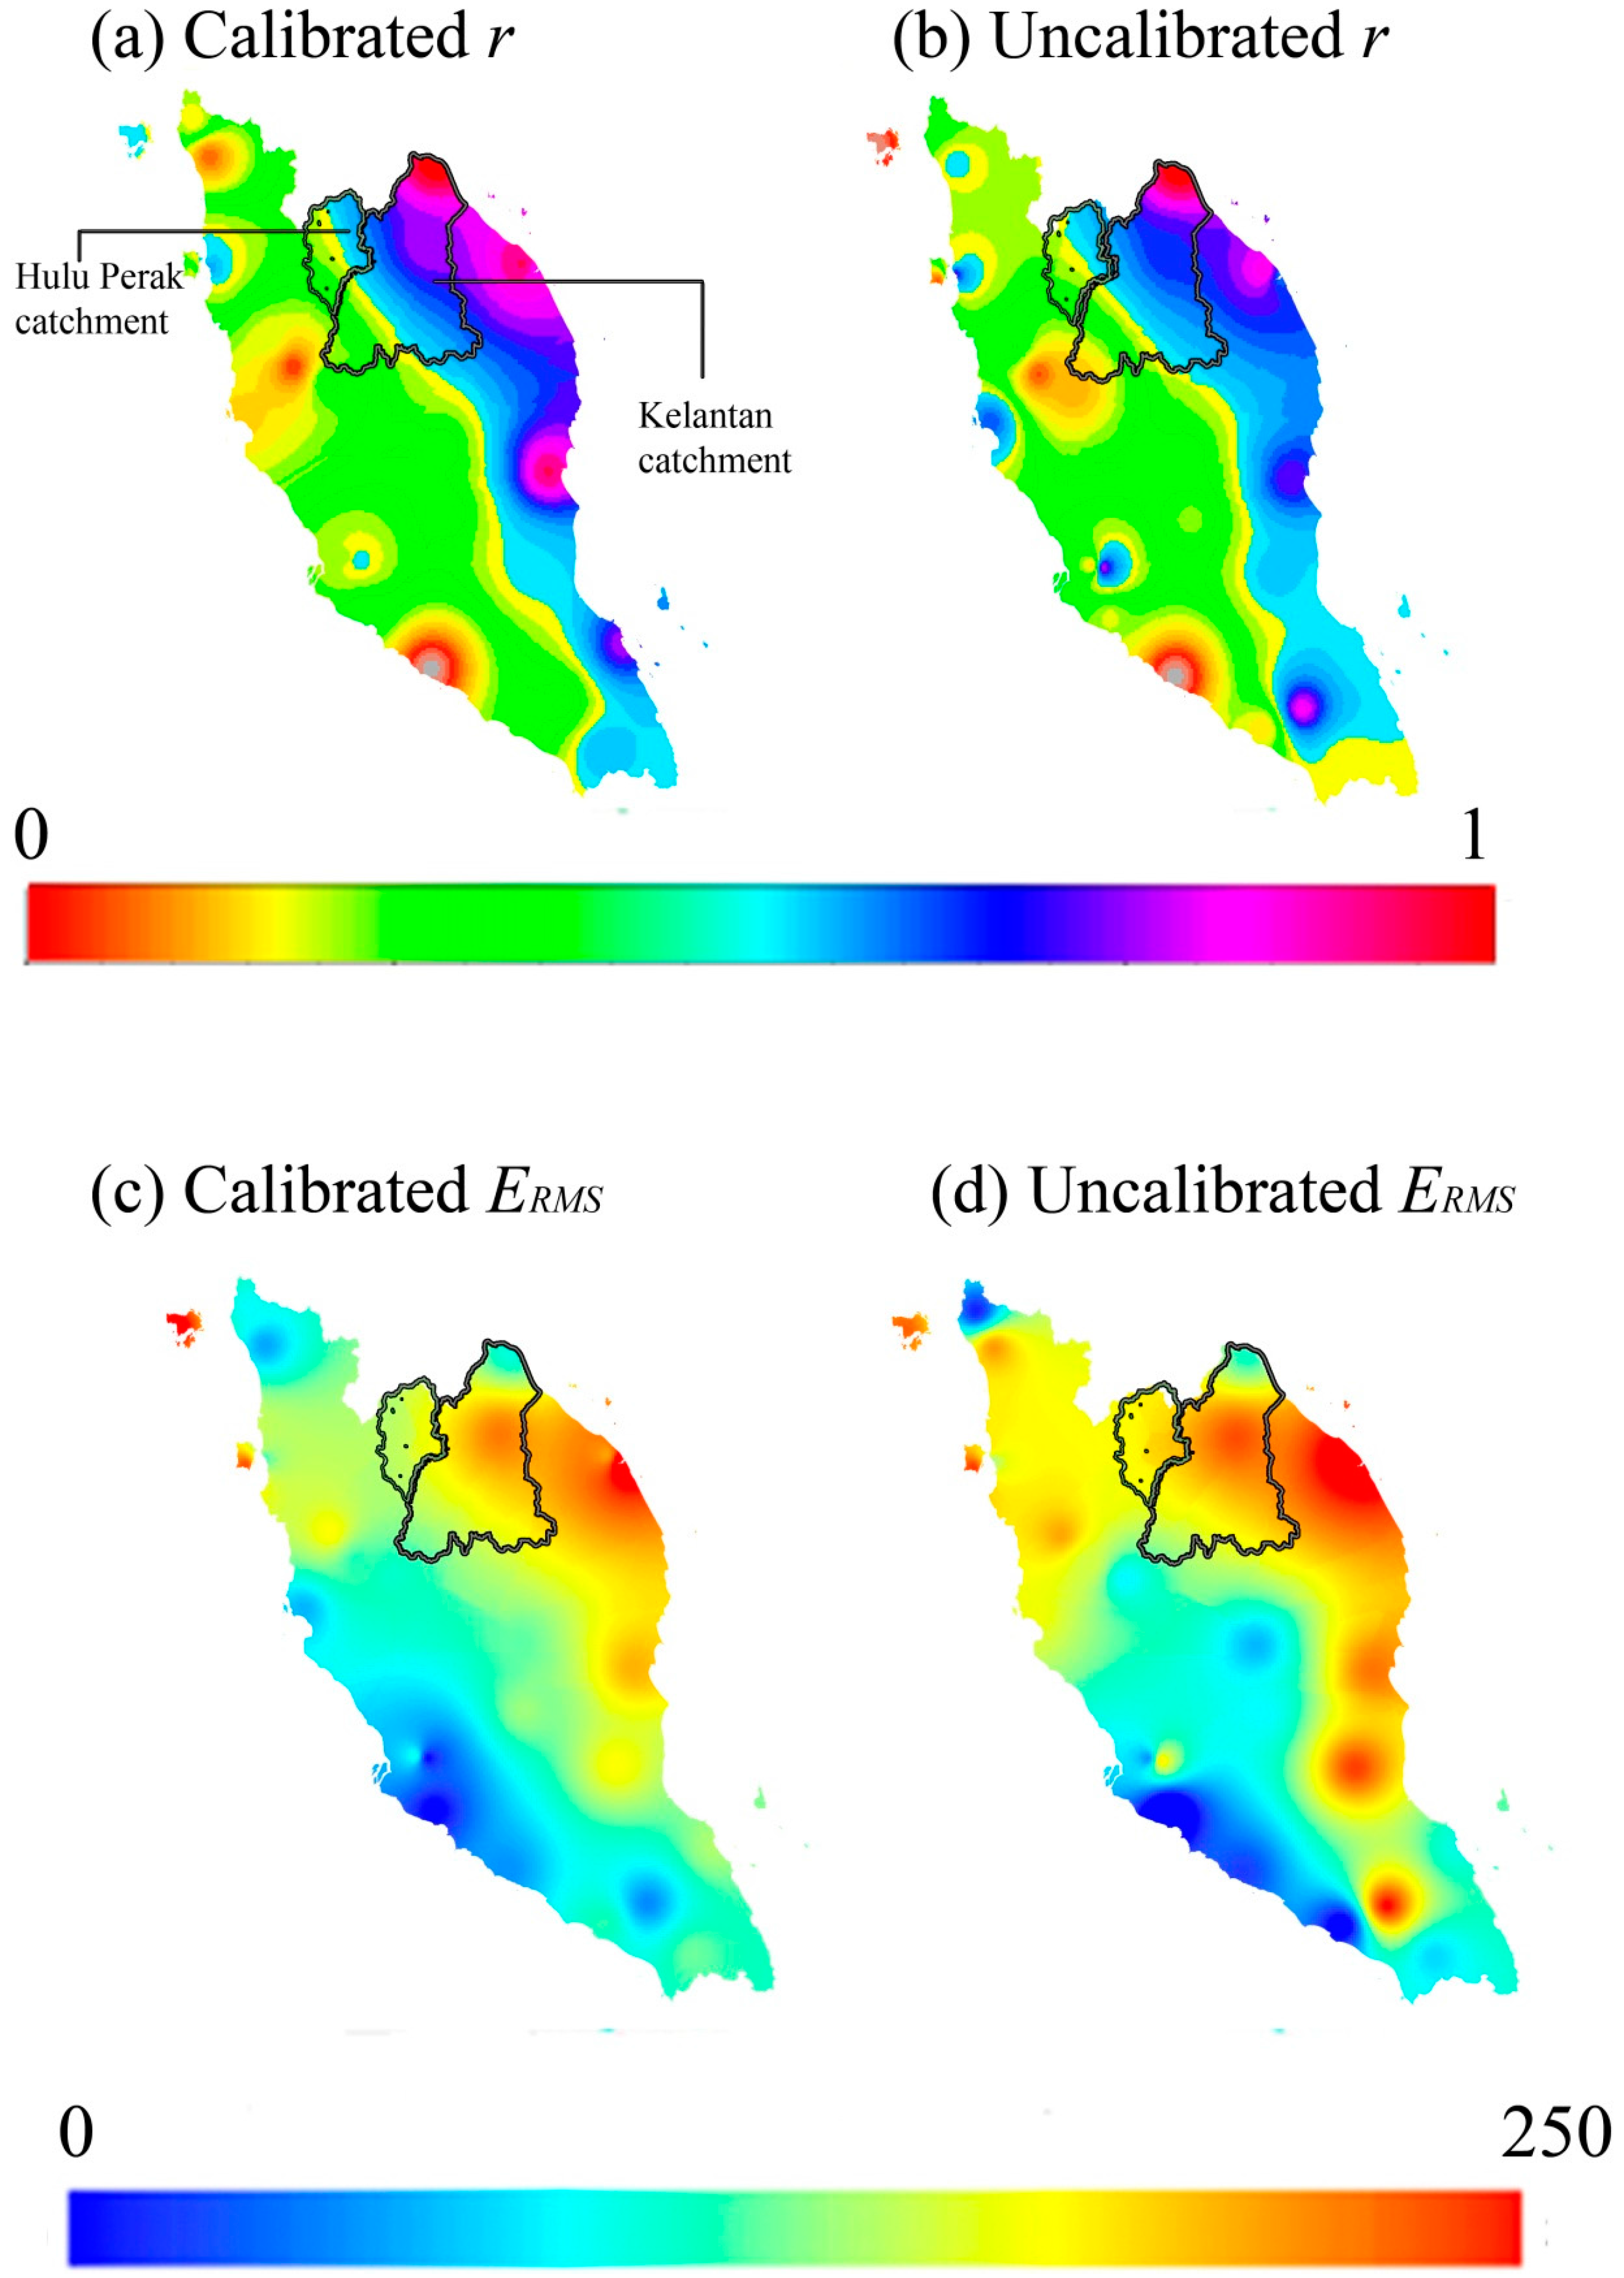
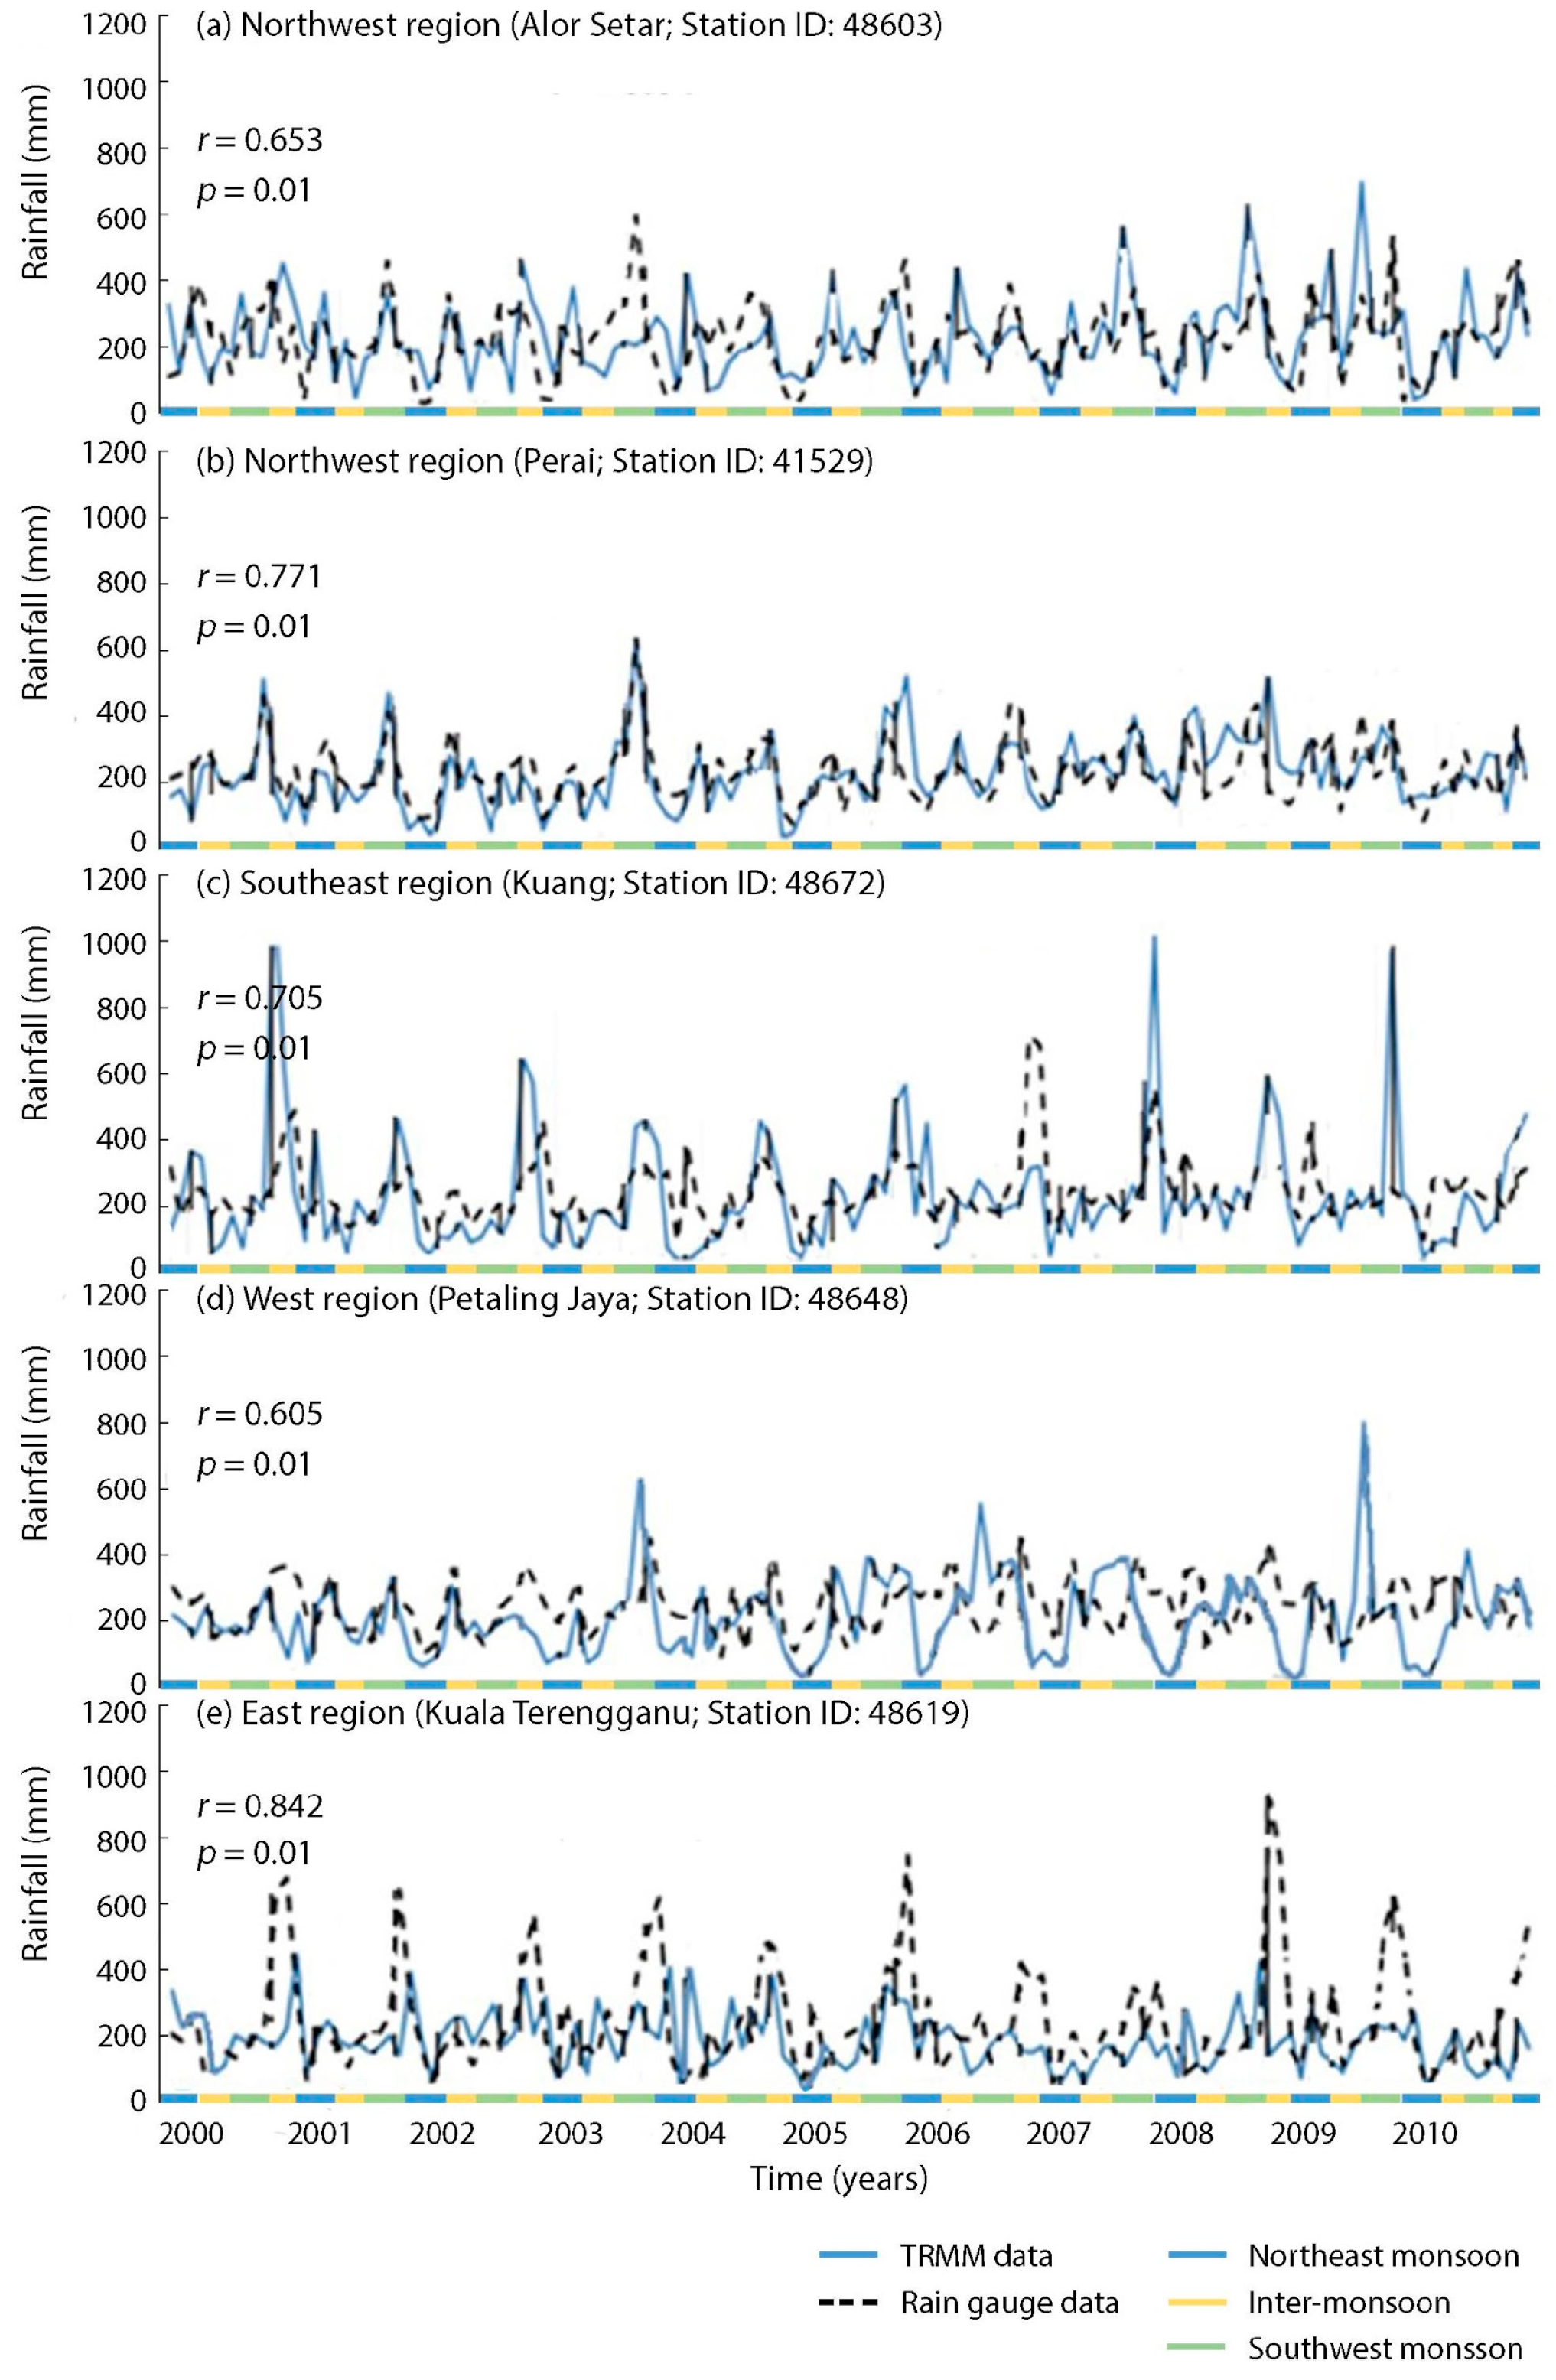
3.1. Validation of TMPA Rainfall Calibrated with Un-Calibrated Data

For the comparison of un-calibrated and calibrated TMPA data, we analyze the statistical indices mentioned above and present the results in Figure 6. Statistical bias is an important and useful statistical metric that reflects the precision of rainfall after calibration. Figure 6a shows the improvement in the calibrated rainfall values, with reduction of 35 mm in the Alor Setar station after calibration compared to the other four stations. Despite that the Bayan Lepas and Alor Setar are in the similar climatic region, i.e., in the north of Peninsular Malaysia, bias for the former station was higher (around 40%) than the latter, which may be due to a maritime effect around Bayan Lepas, which is located on the Penang island. The differences in bias for Alor Setar, Kluang, and Kuala Terengganu stations were less than 20%, indicating a similar pattern of improvement after calibration across those stations. Although the sample used to validate the calibration showed a reduction in quality, Figure 7 indicates an overall improvement due to calibration, which is evident from wide spread regression values (from light to dark blue legend in Figure 7a,b). In this study, the hydrologic model that used TMPA data for the calibration of rainfall to generate spatial maps was subject to sources of negligible errors for Hulu Perak compared to that of Kelantan catchments, as evident from a visual assessment (Figure 7). The Correlation co-efficient also supports the improvement after calibration (r = 0.7 − 0.9). The mean absolute error ( M A E ) and Nash-Sutcliffe (NS), shown respectively in Figure 6b,d, show an almost similar trend for all stations, while the later matrices are +0.2, −0.8 and −0.4, respectively, for Alor Setar, Prai and Kuala Terengganu stations. However, the differences for Kuala Terengganu are small and at an acceptable range. However, the trends of NS (+0.55, −0.04) and M A E (+76 mm, +1 mm) for Petaling Jaya and Kluang stations are opposite (Figure 6d). The ERMS (Figure 6c) rainfall values, estimated from TMPA calibrated data, are similar in trend with the M A E for all the stations. Most of the high-ranged rainfall values were located around the eastern region, while the low-ranged were located around the southeast region (Figure 7). However, smaller extent of the red area (~200 mm) shown in Figure 7c compared to that of Figure 7d indicate the rainfall data sets improved, after calibrations in terms of the ERMS values. This data calibration improvement pattern agrees well with the temporal variations presented in Figure 2, where the differences between calibrated TMPA and ground measurements are evident.

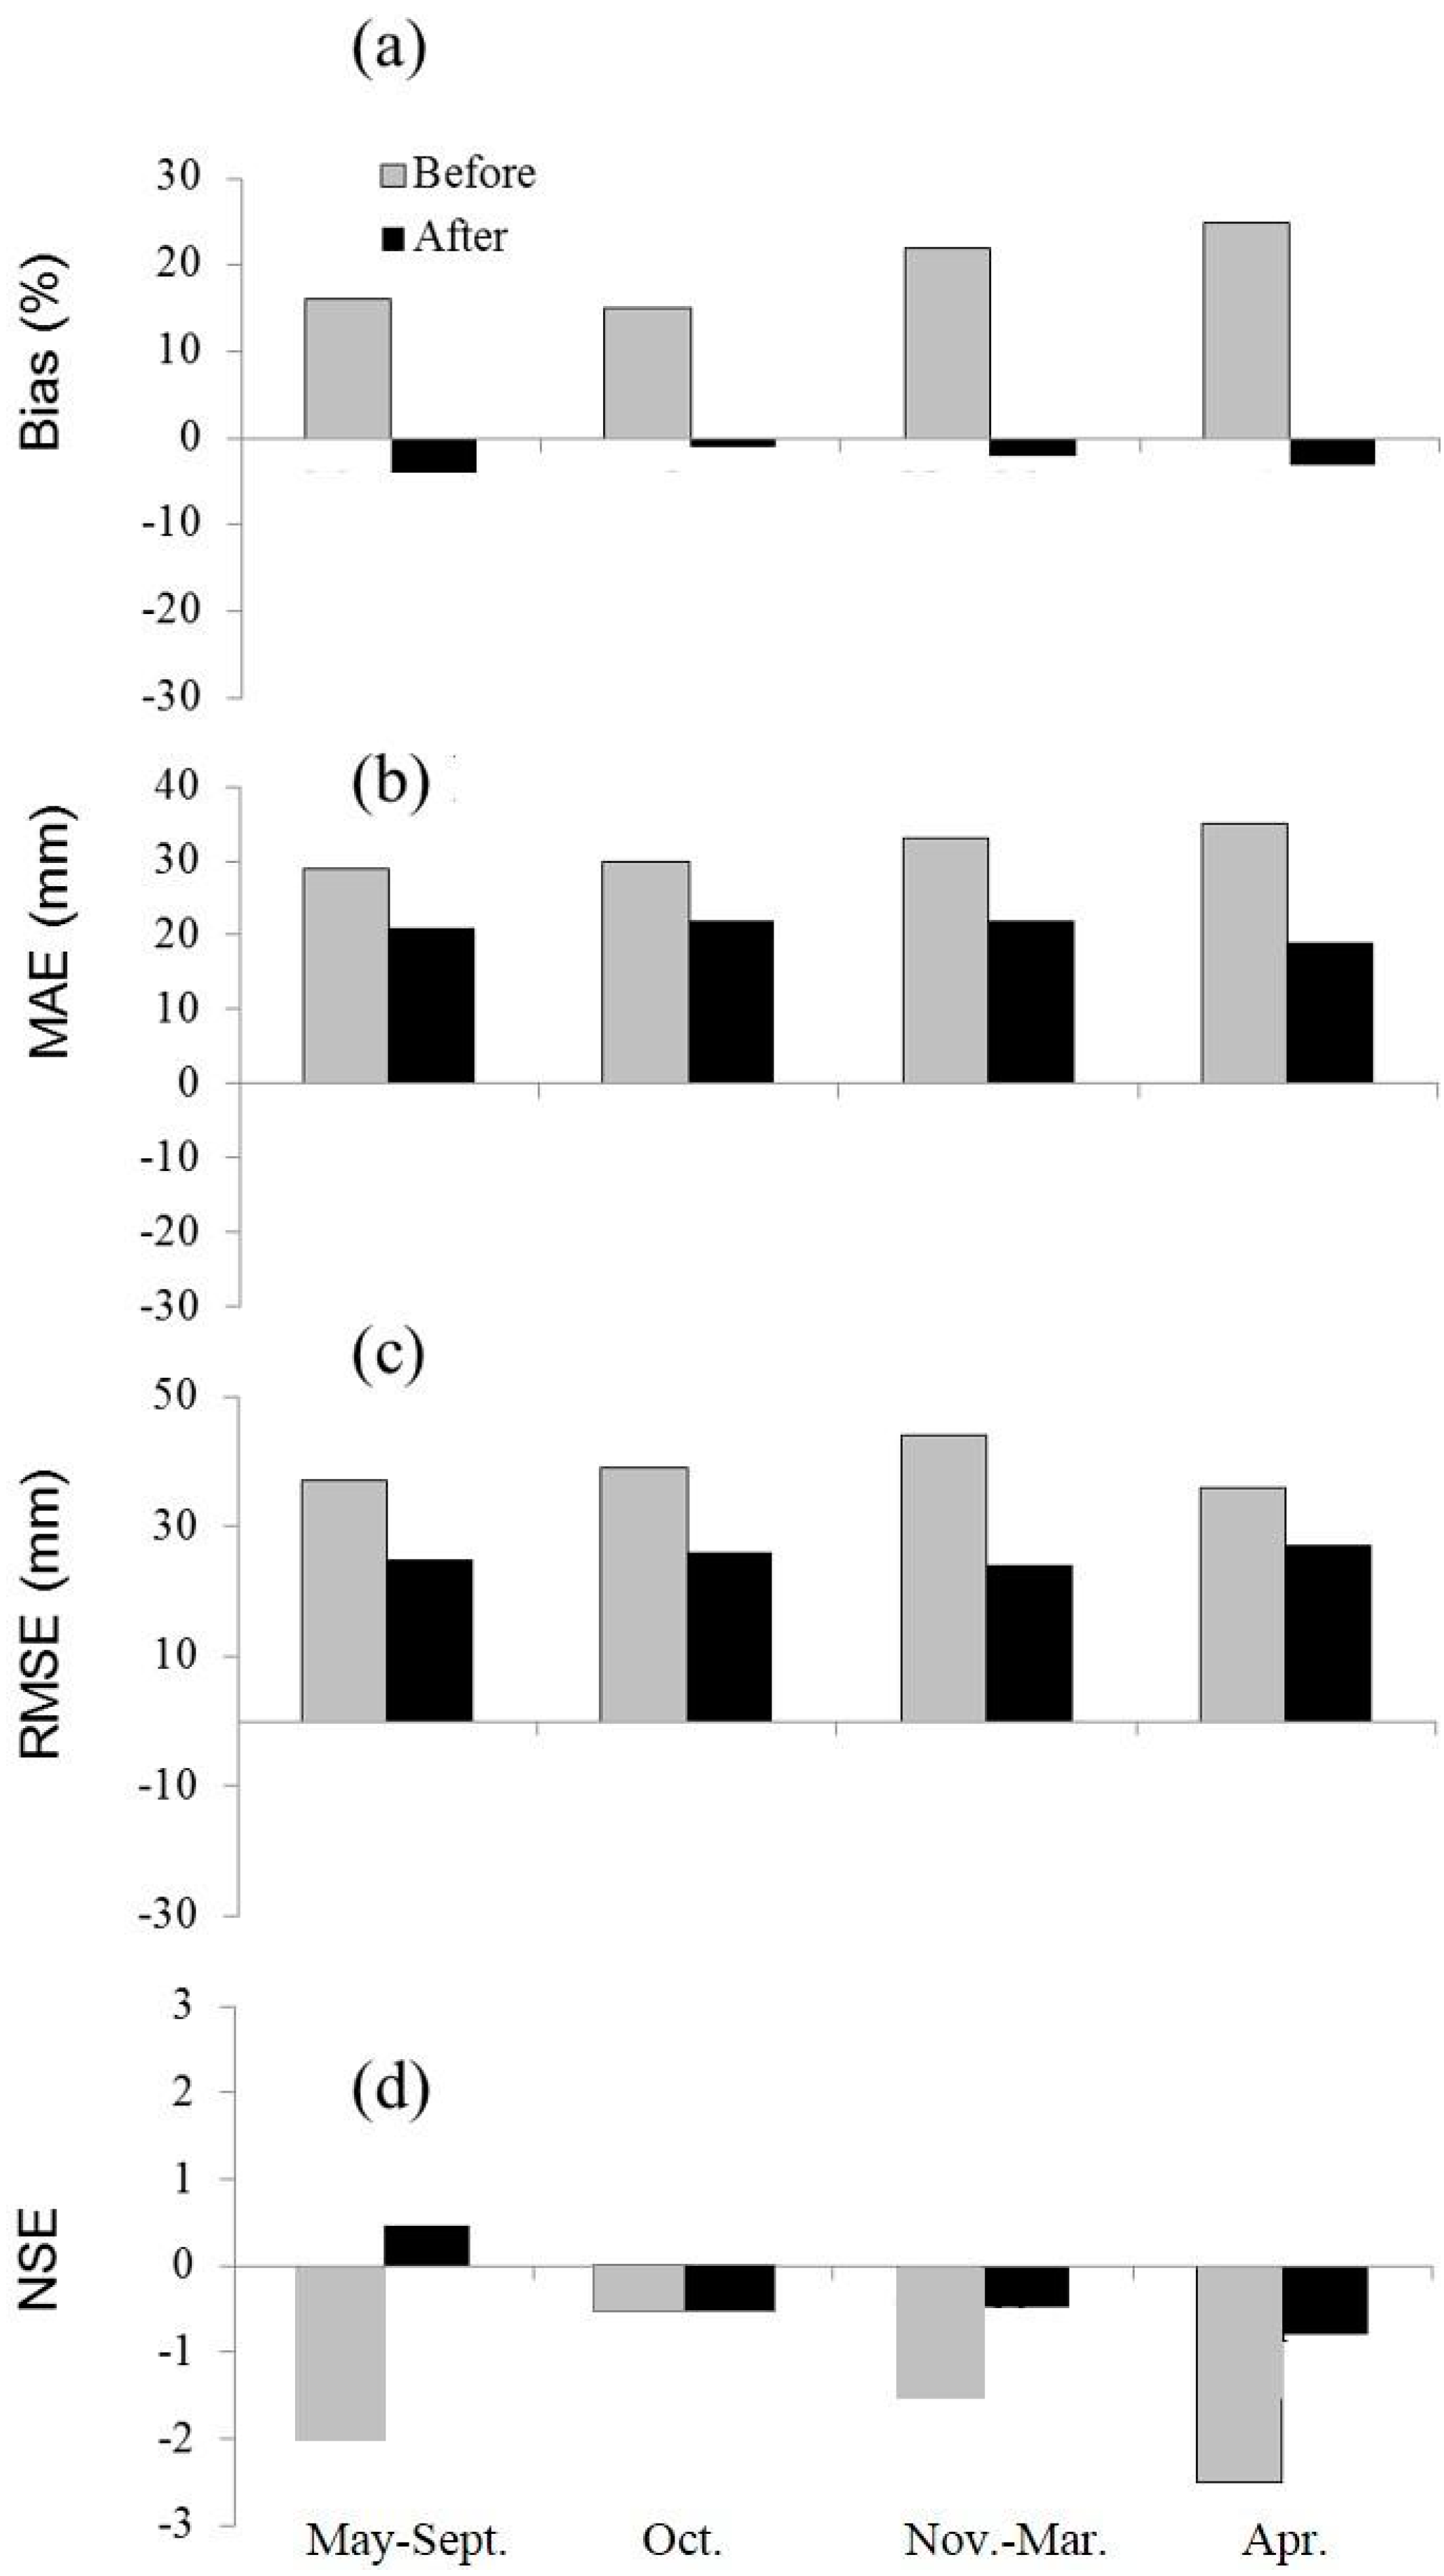
3.2. Assessment of MODIS 16 Calibrated Data

The performance of the calibrated MODIS 16, estimated from the statistical measures, is presented in Figure 8. Figure 8a shows that all months were calibrated with maximum value differences during the IM season (25 mm during March–April). As for the M A E (Figure 8b) and the ERMS (Figure 8c), the trends are similar to each other and the error difference ranges from −10 mm to −20 mm. Calibration of MODIS evapotranspiration led to improvements in drought monitoring (rainfall measurements) which is indicated by the NSE values (Figure 8d) with a range between −0.36 (IM) and 0.5 (SWM). In the aspects of seasonal rainfall prediction, larger improvements were indicated by NSE ranges from −0.36 to −0.25 for IM and −2.0 to 0.3 for SWM, while there was no improvement for NEM season after calibration.

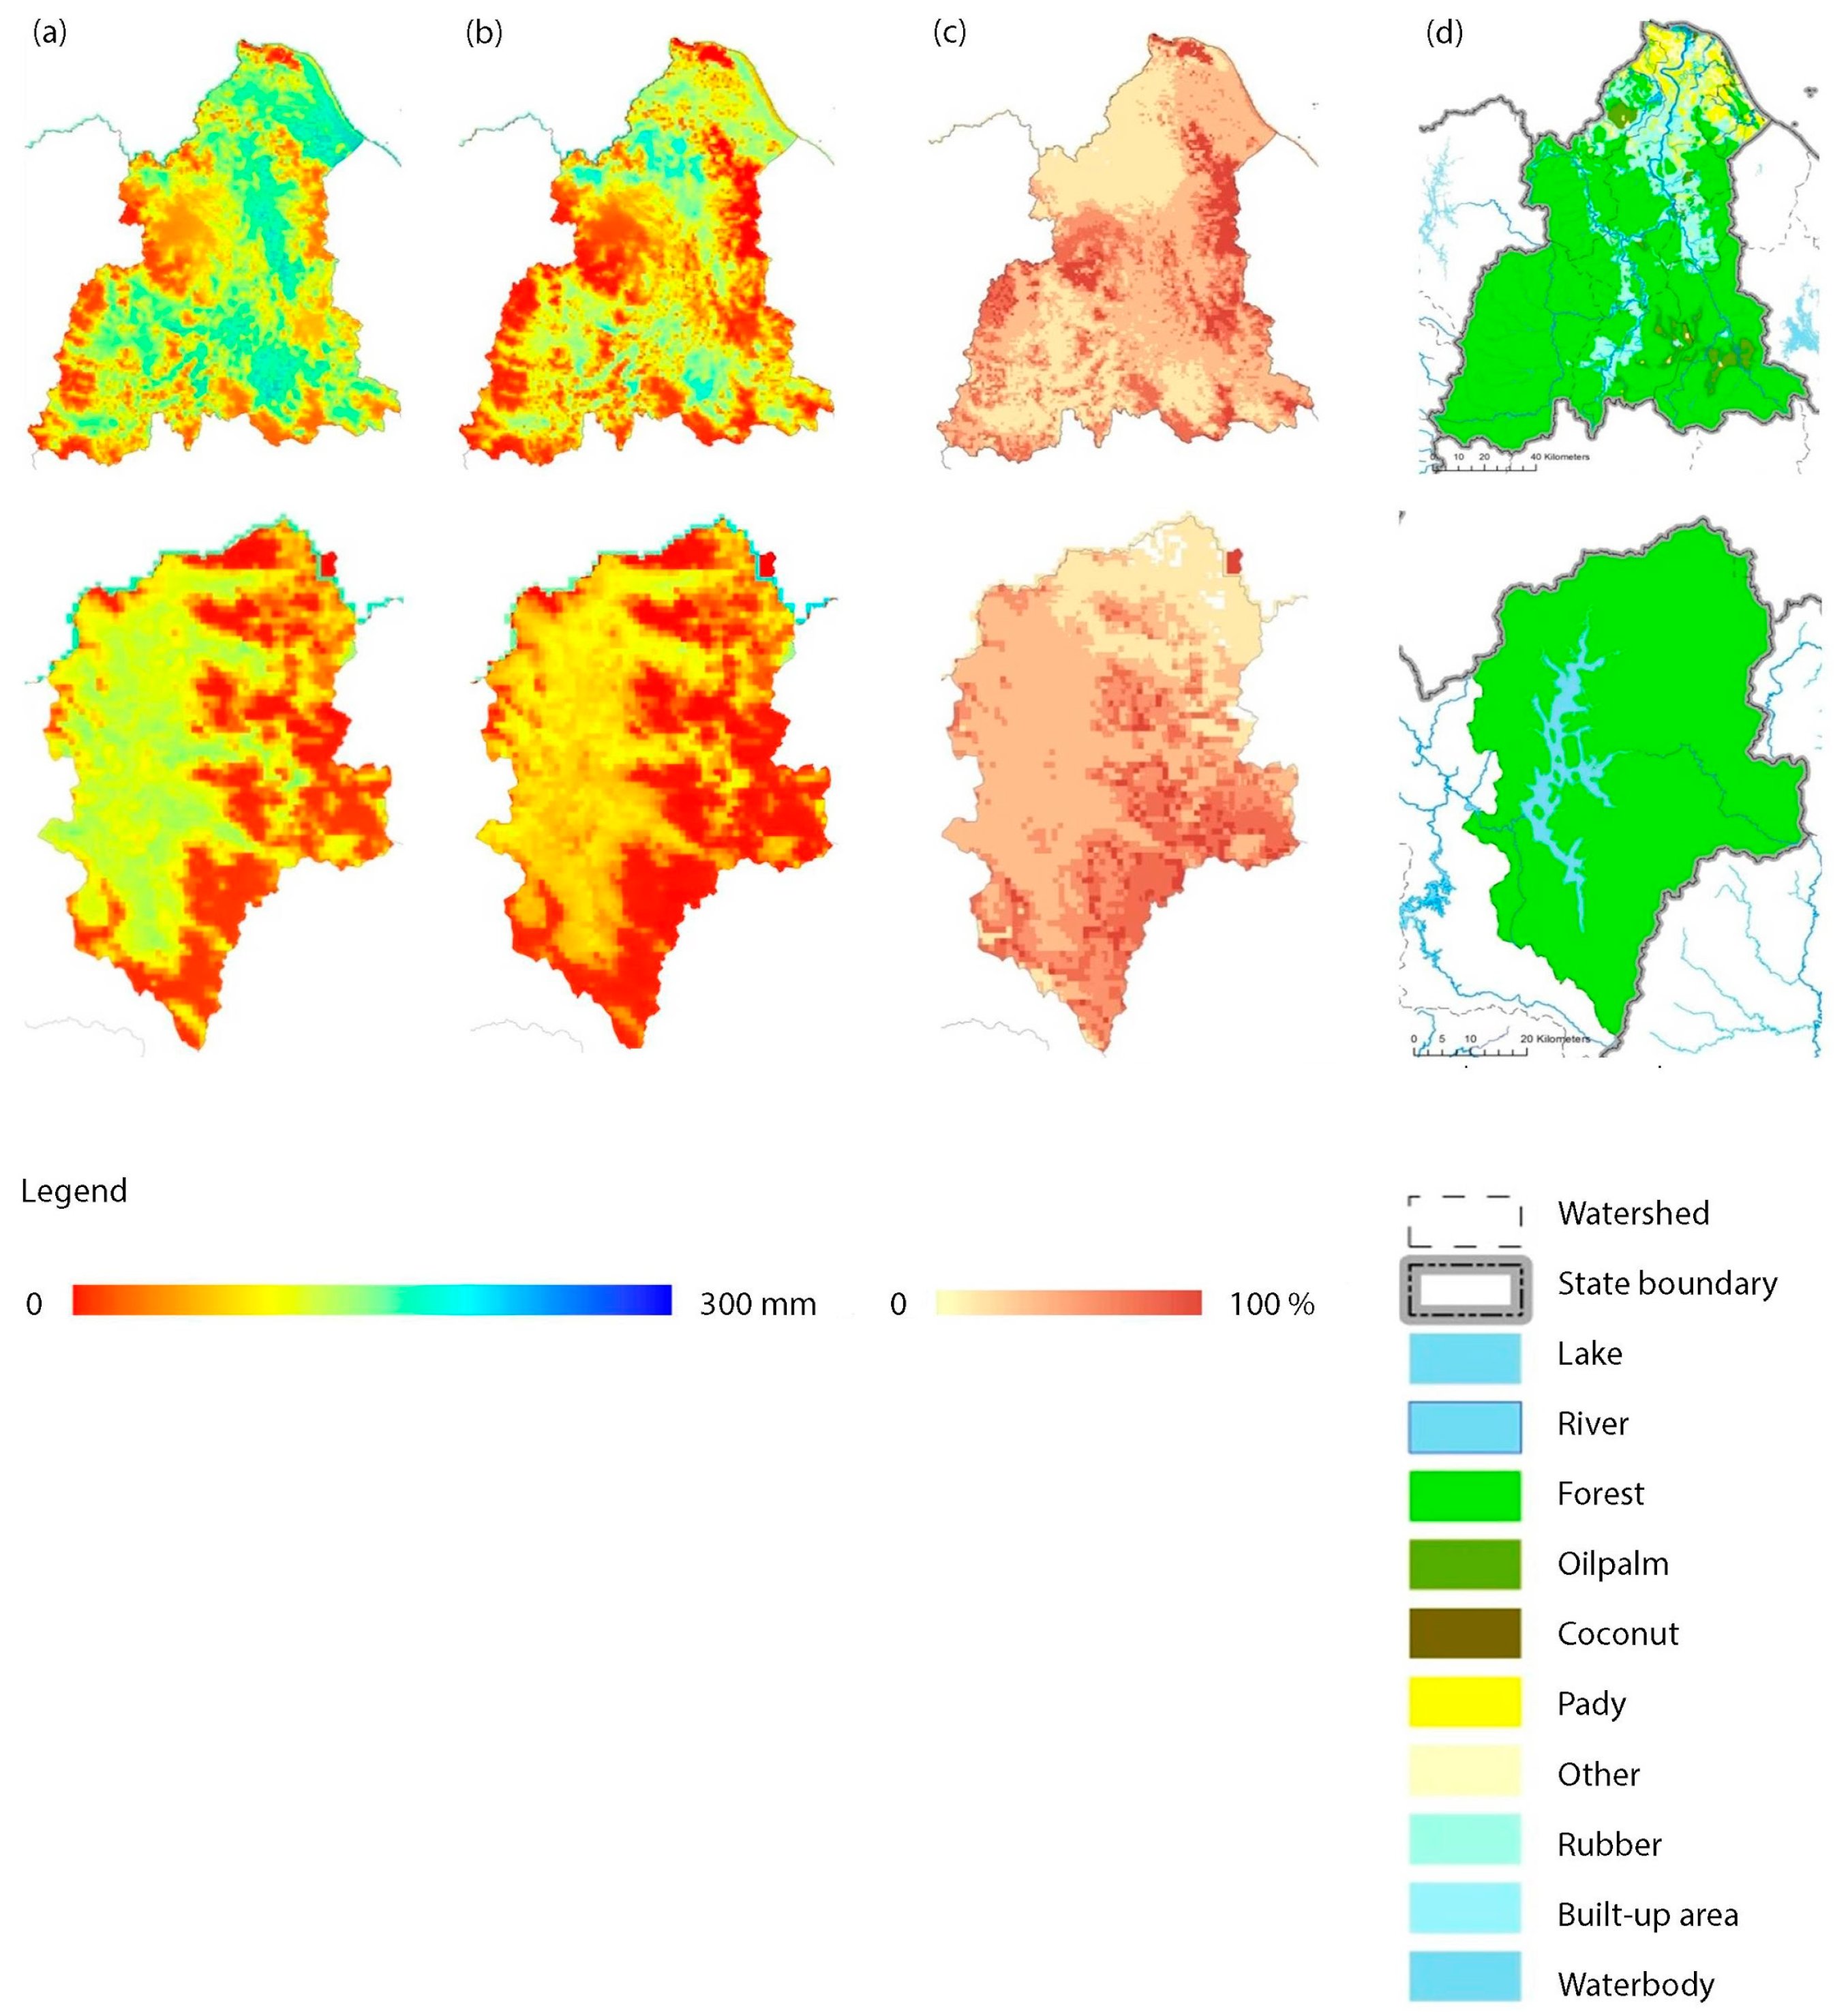
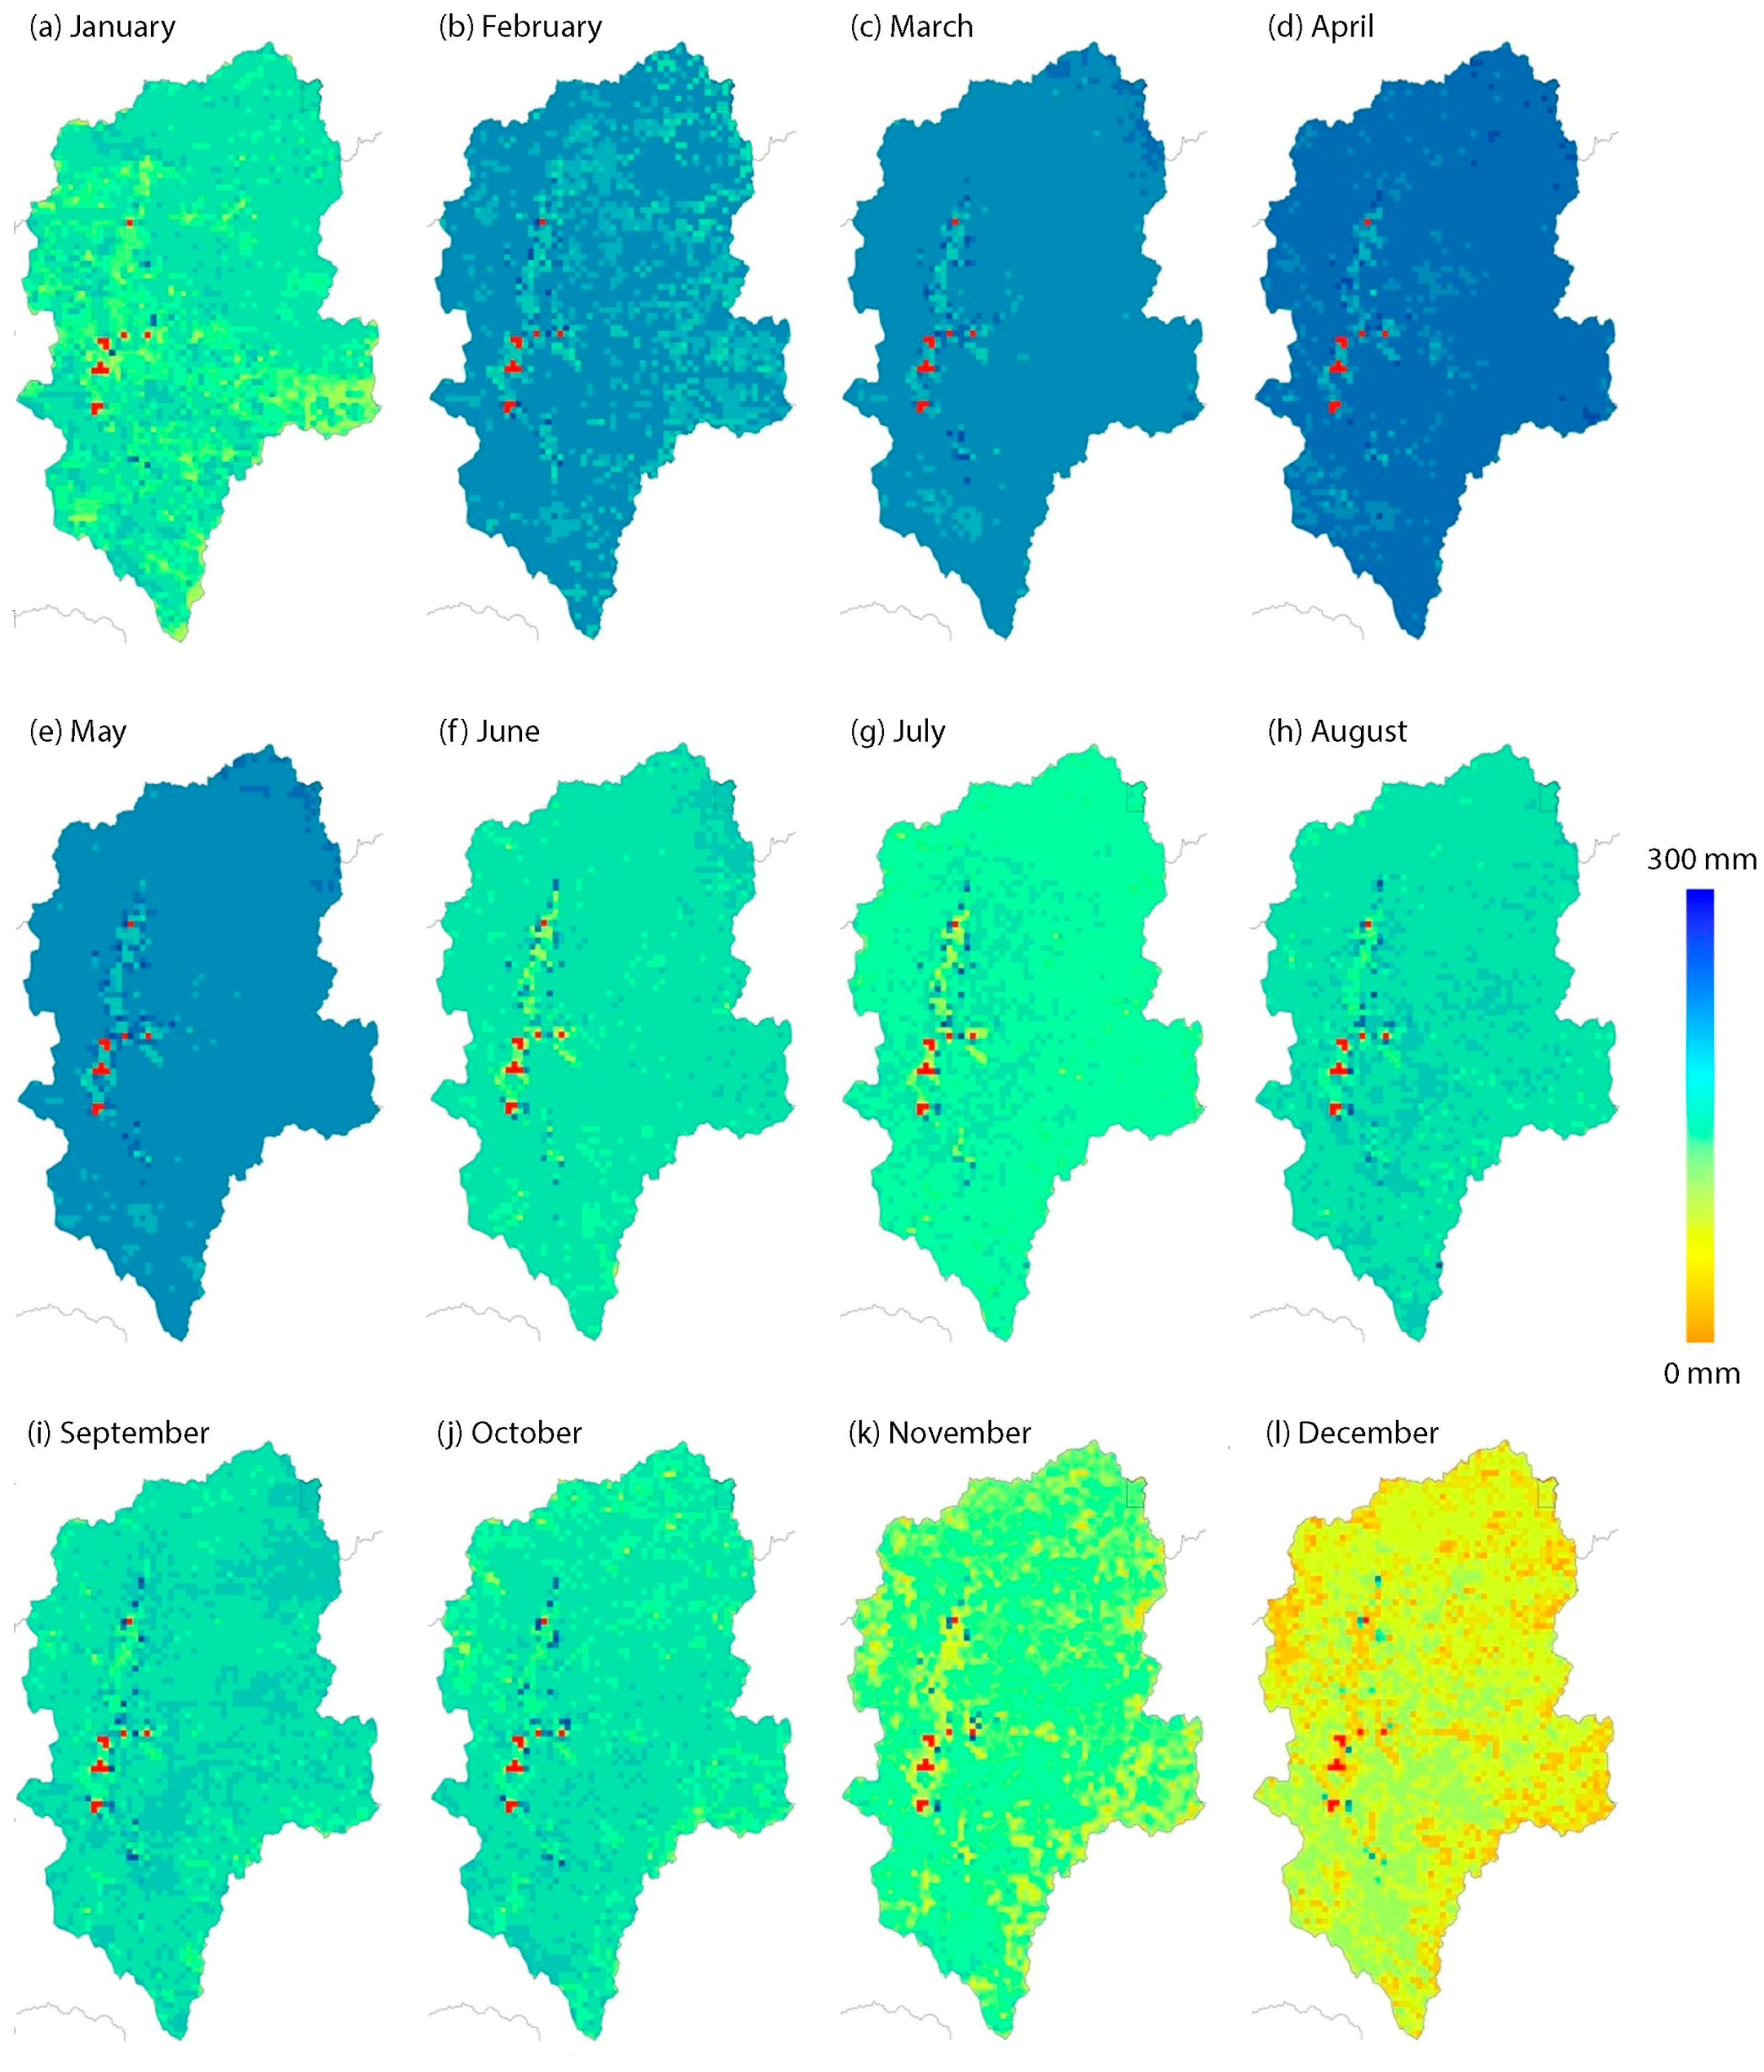
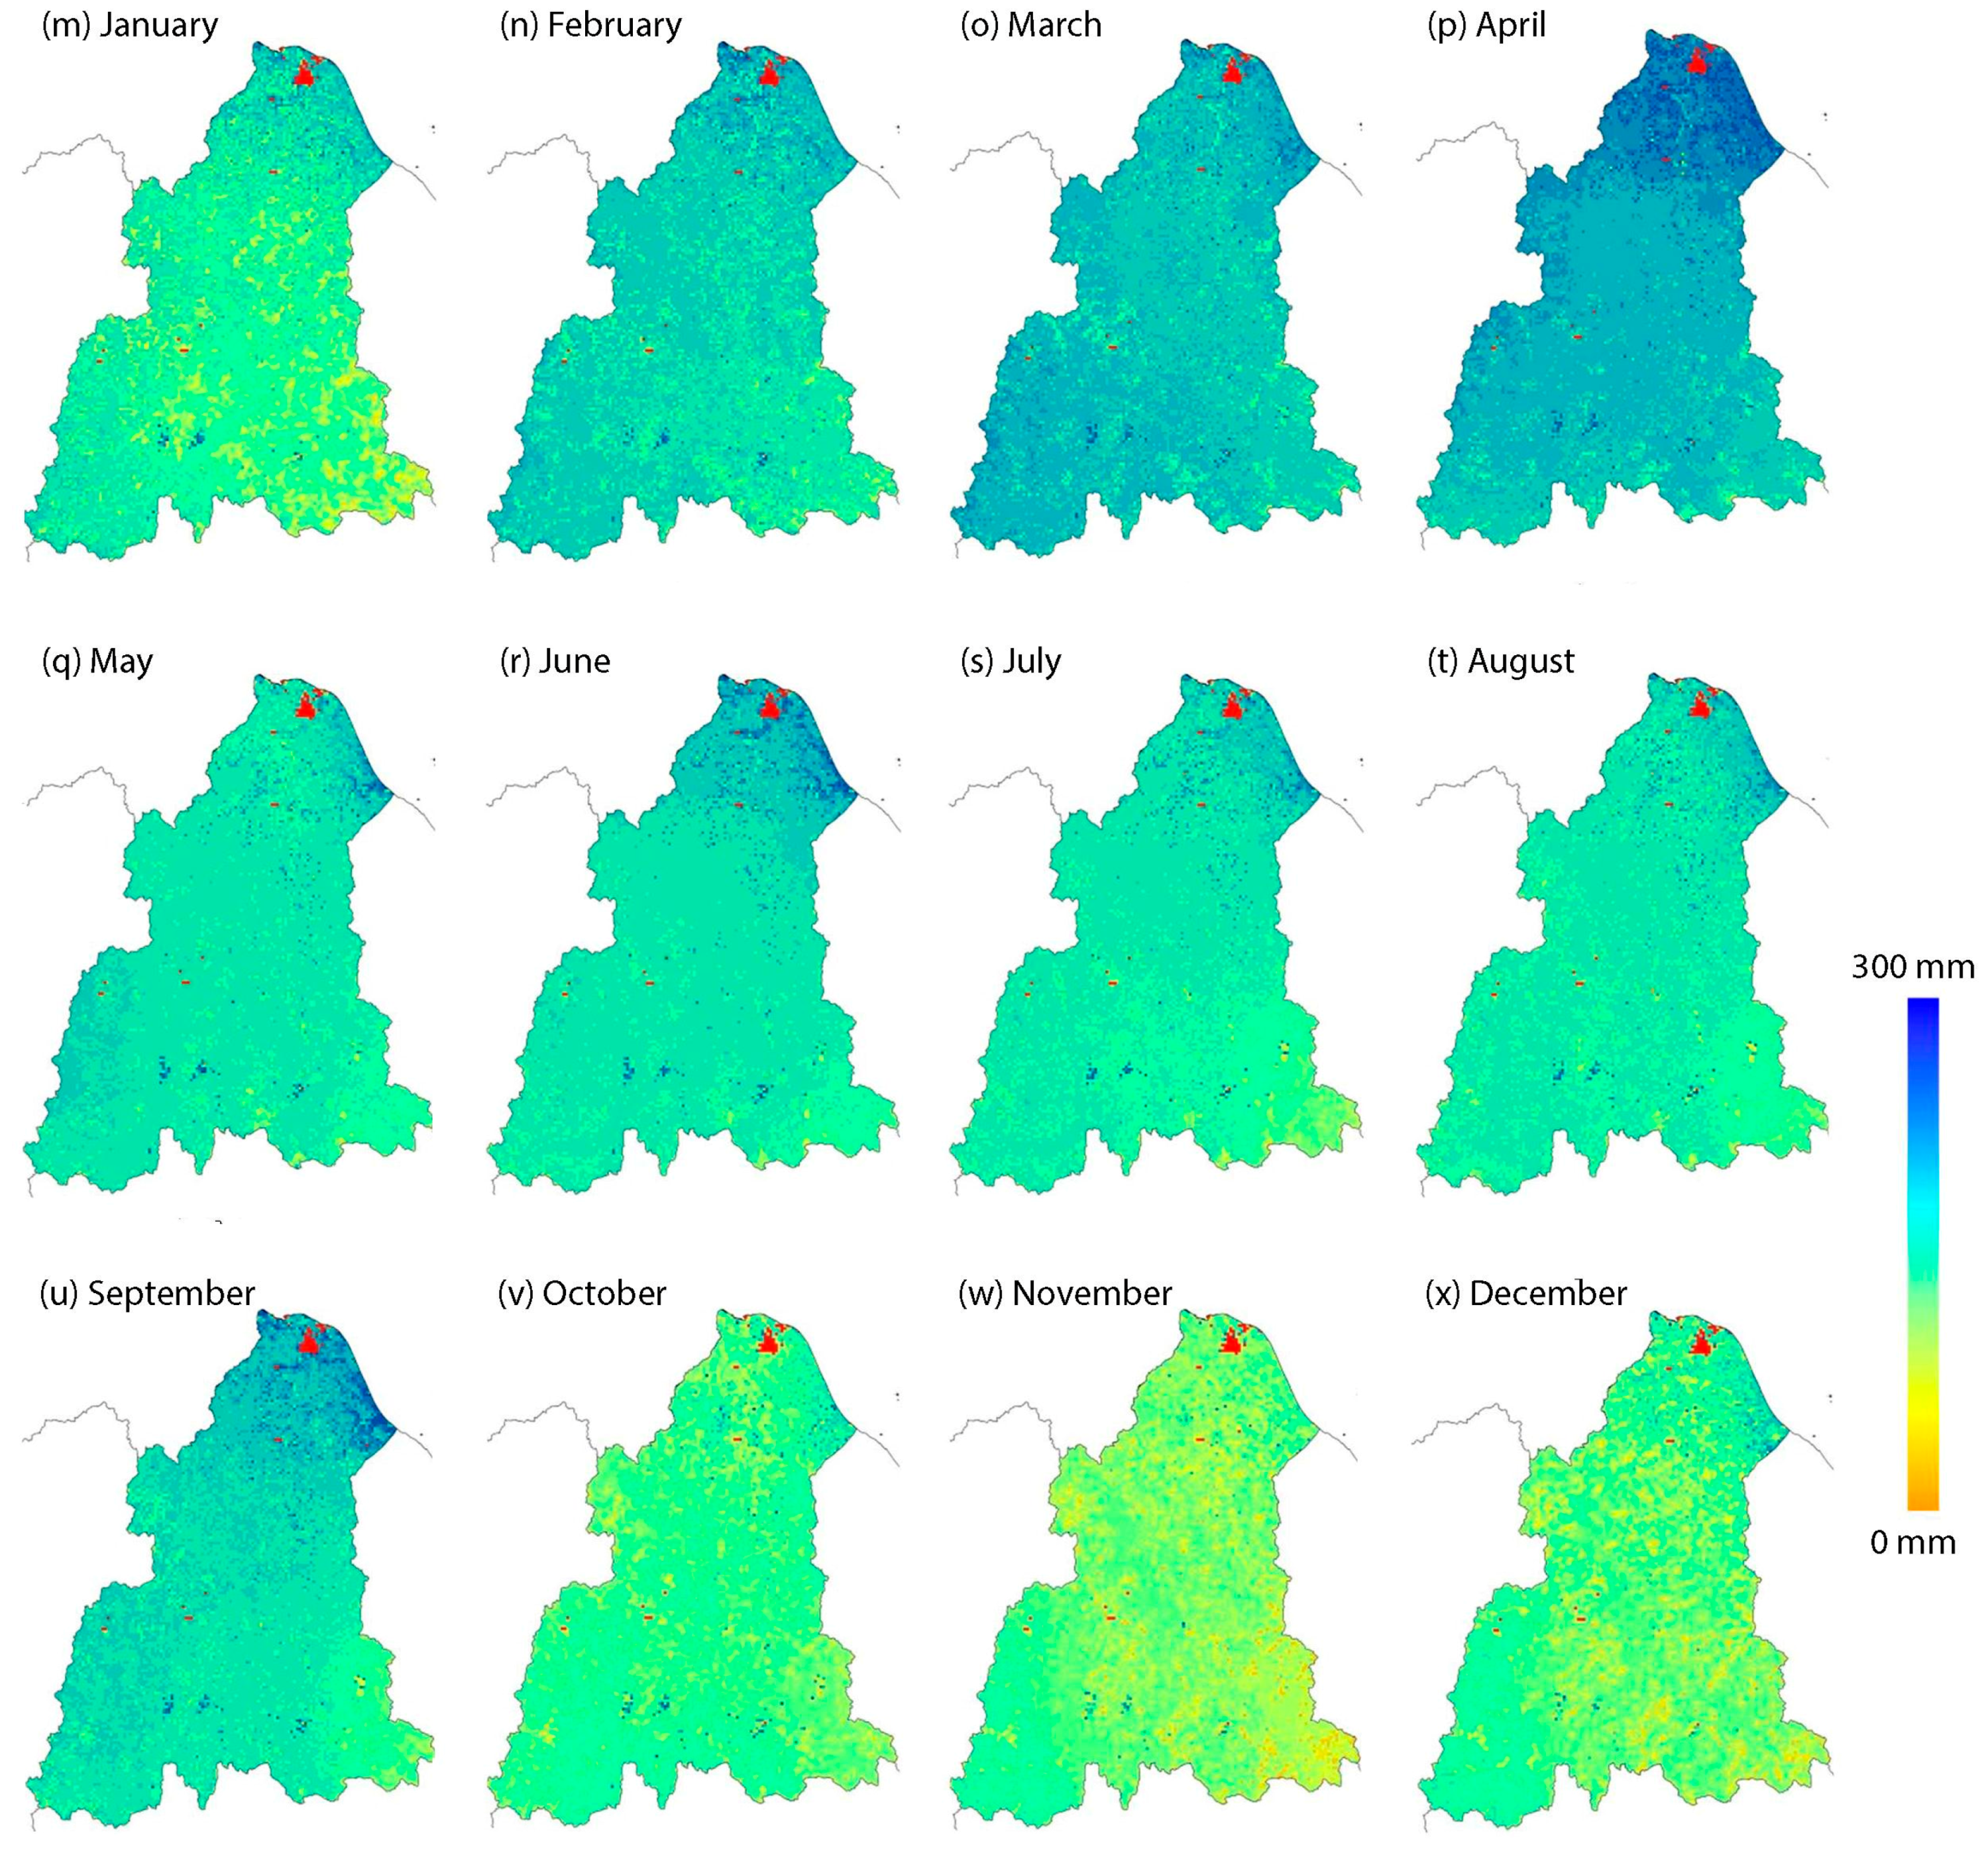
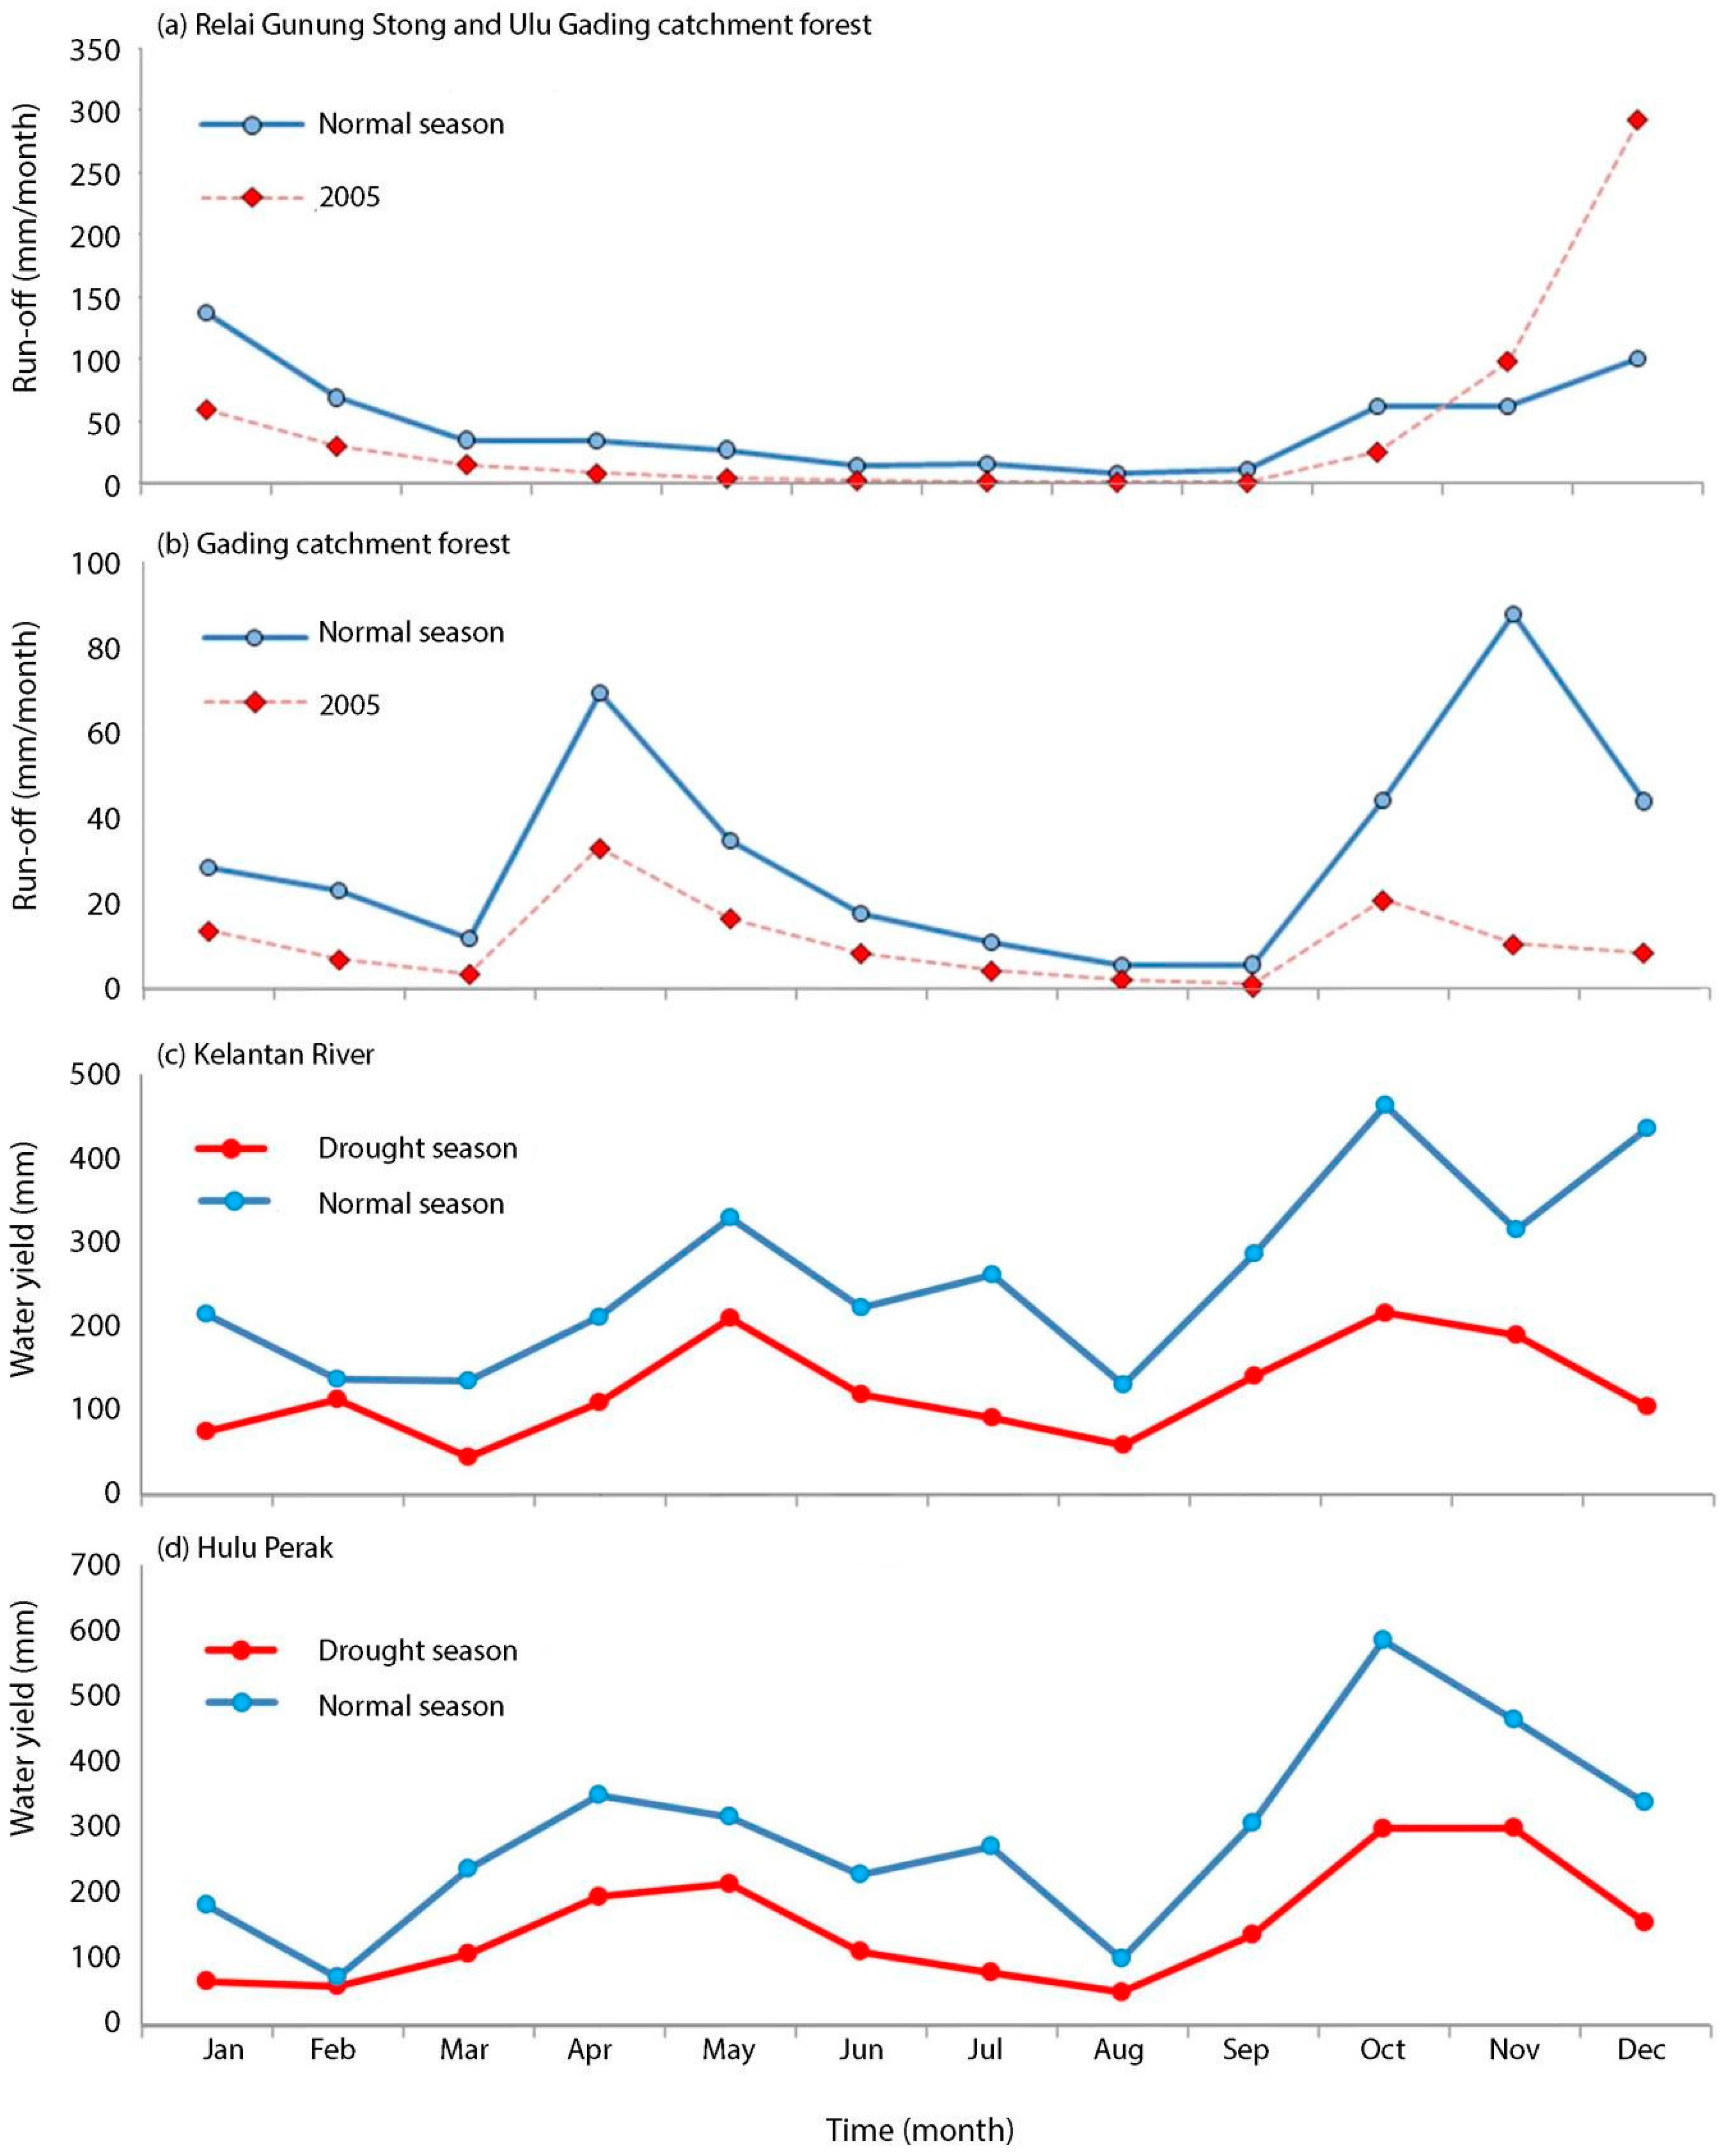
3.3. Assessment of Spatial-Based Run-off Deficit

The satellite-based run-off map of Kelantan state during normal conditions (in July), the drought season (in July) of 2005, and run-off relative deficiency are shown, respectively, in Figure 9a–c. In order to assist with a comprehensive visual aided analysis of spatial variations in run-off and land-use, the corresponding land-use map is also added to this illustration (Figure 9d).
From a visual inspection, it can clearly be identified that the run-off decreased in many areas when the drought reached its peak during July 2005. The average run-off computed for normal seasons (91.9 mm/month), i.e., in the years 2003 and 2004, was significantly greater than the drought season (84.0 mm/month), i.e., in the year 2005. The relative run-off deficiency maps (Figure 9c), estimated for Kelantan state and Hulu Perak show that approximately 34.7% and 42.9% of the total area experienced a deficit greater than 40%. A large portion of Kelantan (41%) and Hulu Perak (43%) experienced moderate run-off deficits which ranges from 20% to 39%. In contrast, a small portion of land over the Kelantan (24.1%) and Hulu Perak (13.8%) experienced a small run-off at low spatial extent (<20%).

3.3.1. Land-Use Versus Run-off Deficiency Analysis

The classification of the run-off deficit to their respective land-use is shown in Table 4 and their distribution patterns are shown in Figure 9c,d. A combined analysis of land-use and run-off deficits has revealed that forested areas experienced the highest run-off deficits. About 87.5% of Kelantan experienced more than 60% run-off deficit. Other major land-uses, rubber (6.7%), oil palm (1.1%) and paddy (2.1%), experienced less than 10% run-off deficit. This indicates that approximately 29.1% of the total forest areas experienced more than 40% run-off deficit, which is comparable to the homogenous areas of Hulu Perak (22.2%). Those affected areas are within Kelantan forest reserve (FR) catchment areas, including Ulu Gading FR, Sg. (Sungai = river) Durian FR, Sg. Rek FR, Sg. Relai FR, Sg. Lebir, and Gunung Stong Utara FR. Statistics also shows that about 20% of the forest areas, representing approximately 4062 km2, experienced more than 40% run-off deficit. There was catchment-wide (Kelantan and Hulu Perak) reduction in evapotranspiration, possibly caused by the rainfall deficits during April–June in 2005 (Figure 10).

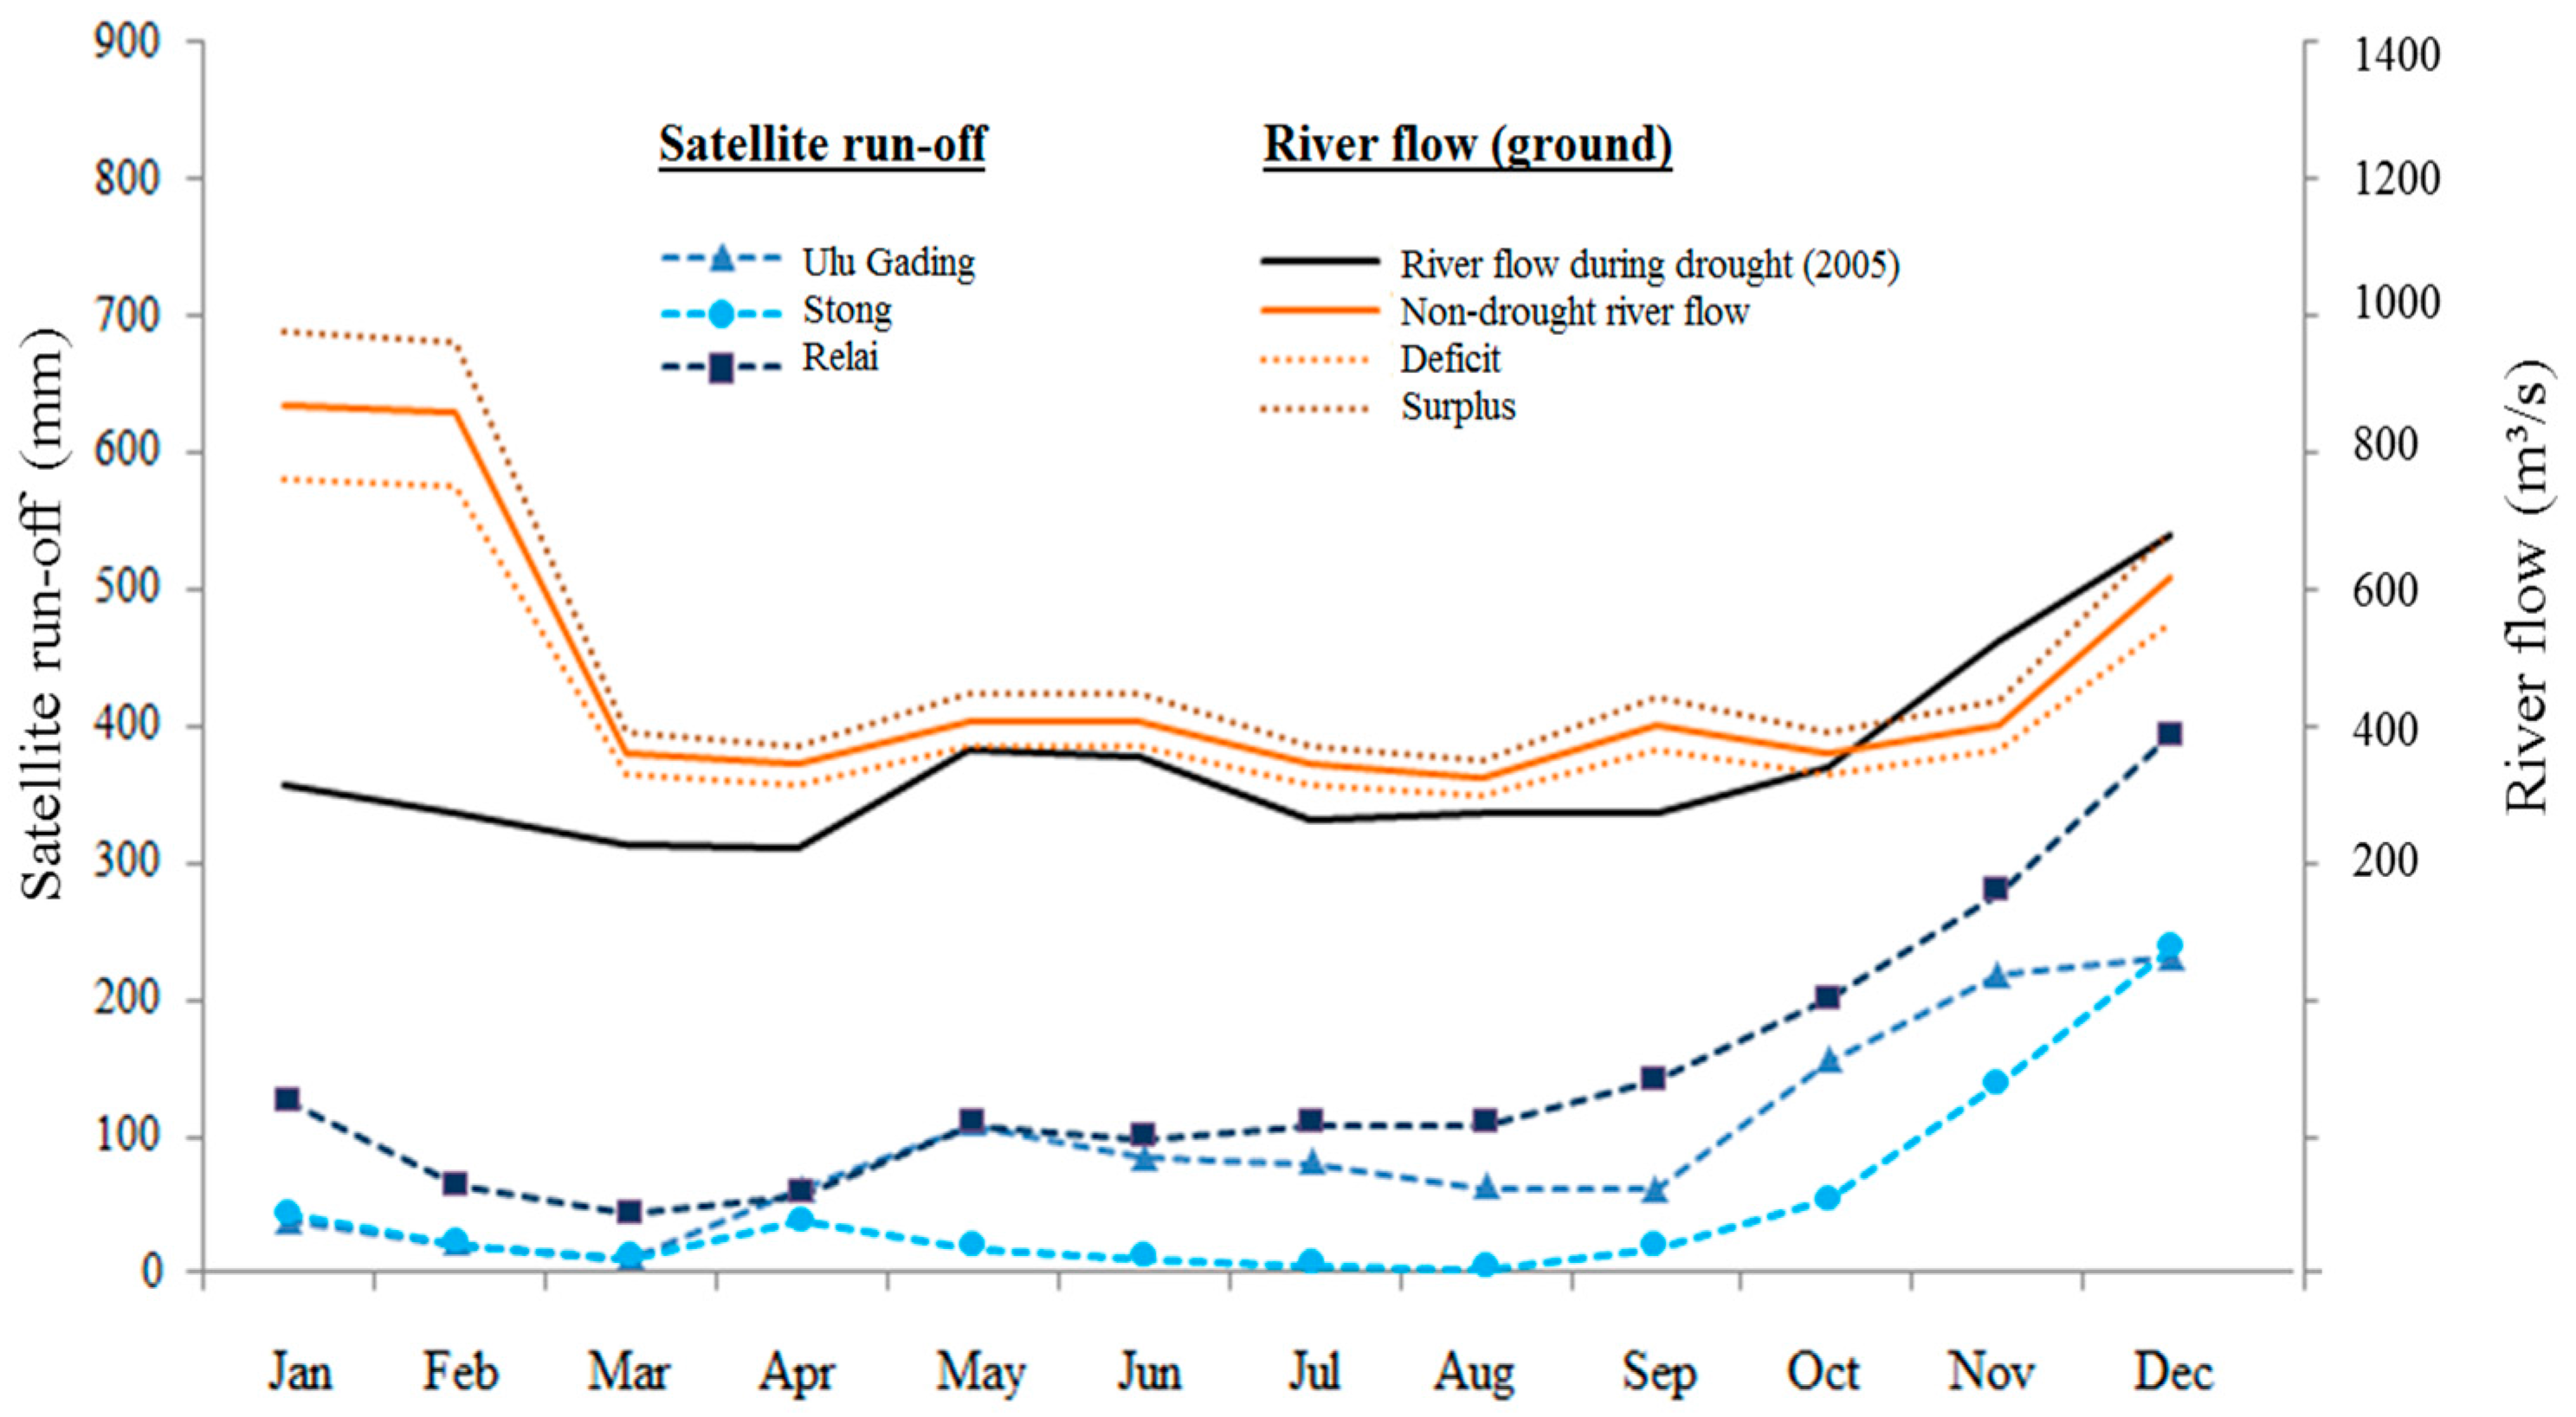
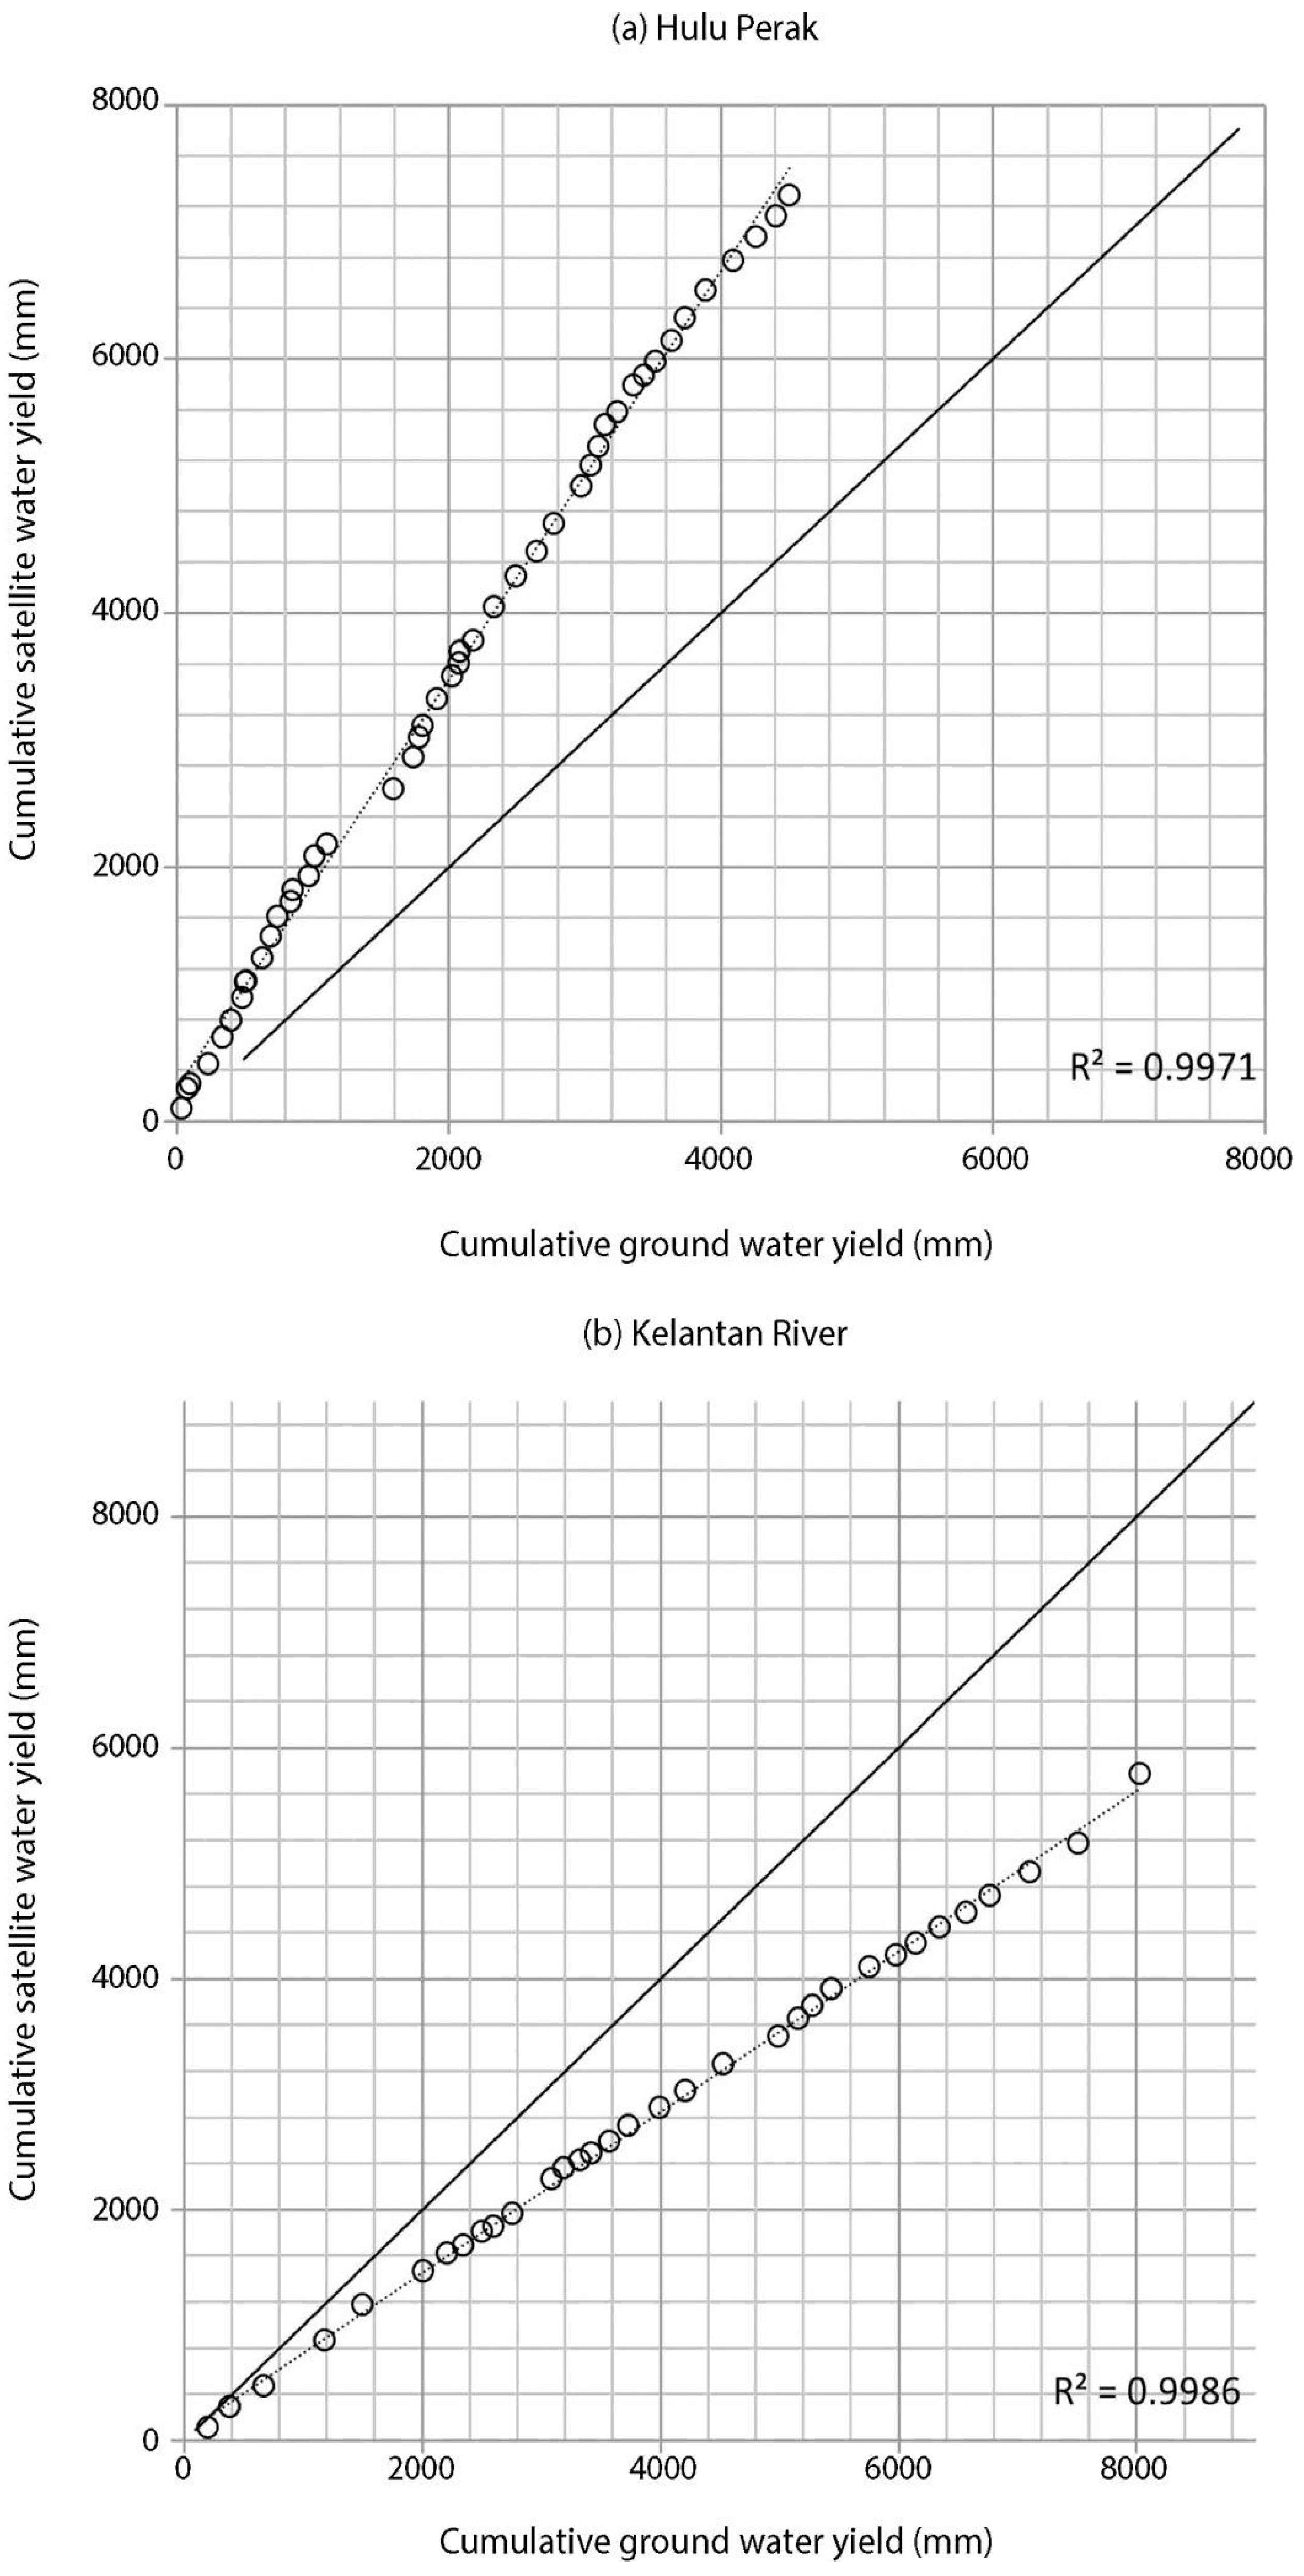
3.3.2. Comparison between Satellite-Based Run-Off and Actual River Flow

Comparison between the measured river flow in the Kelantan River and the corresponding satellite-based run-off values on three forest catchments indicates that low run-off leads to river flow reduction (Figure 11). The three major catchments, namely Ulu Gading, Gunung Stong, and Relai contribute water flow to the Kelantan River, while only one catchment contributes water flow to the Hulu Perak River. In addition, the average monthly run-off of those three catchments consistently declined from January and reached a minimum in July, 2005 (Figure 12). The run-off of those forest catchments declined by 57% during January–March, 80% during April–June, and 90% during July–September 2005. The lowest average run-off was less than 3 mm/month in July, while normal run-off was 18 mm/month.
The three statistical error matrices including bias, Nash-Sutcliffe, and root mean square were computed to capture spatiotemporal variability of drought-related variables such as water yield for the Hulu Perak and Kelantan rivers (Figure 13). Overall, the results show that there is a nearly perfect water yield between satellite-based predicted water yield and ground observations. The NSE values ranged between 0.0 and 0.7 for Hulu Perak, and 0.4 and 0.8 for Kelantan catchments, indicating algorithms are hydrologically consistent for drought monitoring, except unsatisfactory statistical measures computed for Kelantan in April and for Hulu Perak in February. Those sources of error might be associated with reduced sensor sensitivity due to reduced atmospheric water during the dry season. The overall performance between the actual and satellite based river flow is presented in Figure 14. The double mass curve (DBM) shows that there is an underestimation of water yield for Kelantan, and an overestimation for Hulu Perak. However, NS used to measure the capability and reliability of the hydrologic model shows that, overall, 91.6% of data is in high agreement with ground measurement for both areas.

4. Discussion

Recent studies have linked rainfall deficits, soil thermal stress and vegetation growth and mortality to drought [2,3,5,6,7,9,11,12,15,20,25,27,28,29,30,31,32,36,50,51,52], highlighting the need for operational drought monitoring systems that can show drought intensity, location and extent [16]. In response, this study devised an operational procedure and algorithm, a run-off model, from TMPA rainfall and MODIS evapotranspiration products for spatiotemporal drought assessment (Figure 3 and Figure 4). The model is based on a measure of water stress, calculated by run-off deficit (Equations (1) and (2)) before (2002–2003) and during (2005; El Niño) drought events, where we employed the concept of water balance equation (Figure 2). Besides run-off deficits, satellite-based estimates of vegetation, temperature, rainfall conditions [2], and ground-based information about land-use, cover, and soils [53], were also used for drought monitoring.
The concept of integrating rainfall and evapotranspiration variability into run-off deficit mapping on a continuous and regular per pixel basis is a potentially important new approach to monitor spatial drought. Unlike other ground- or satellite-based drought indices [25], the advantageous aspect of the proposed approach is the detectability of changes for assessing hydrologic conditions, especially across tropical humid regions where local wind and climate patterns dramatically change [31]. Furthermore, the simplicity of the calculation process should make the technique practical for operational drought monitoring systems (Figure 8 and Figure 10). The TMPA rainfall and MODIS satellite data, which are the primary data inputs to the proposed model, can be retrieved through an open source internet data sharing policy.
The proposed technique was proved to be useful in identifying the impact of the drought on land-use (Figure 9 and Figure 10). In the forest mensuration aspect, the logged timber would be difficult to be transported through shallow-river trawling. Furthermore, a forest catchment severely affected by long-term drought may lead to a reduction in river flow and, consequently, may cause scarcity of freshwater supplies [54,55]. Such drought conditions may affect the whole community due to water scarcity for irrigated crops and, thereby, may reduce crop production [56]. Water rationing would need to be implemented in those critical areas identified by an efficient drought monitoring system. The operational procedure of this draught monitoring system can be used to identify the spatial extent of drought-vulnerabilities for a given land-use, and to map drought risks if socioeconomic factors are taken into account [56], although approaches need to be thoroughly investigated across a wide range of socioeconomic dimensions and climate regions.
The multitemporal and spatial observation of the run-off changes can be a useful indicator for the onset of drought warning and monitoring systems. The acquired information would enable scientists and decision-makers to study the spatiotemporal patterns and behavior of the run-off. Temporal rainfall deficiency detection within forested catchment areas which can be the major factor in the drought occurrence in tropical areas can be made in a more comprehensive manner.
The operational hydrological drought monitoring based on satellite observations could effectively identify the complex spatio-temporal drought distribution [57]. Understanding the global perspective of drought distribution is fundamental to monitoring the cause and effects of specific regional droughts [58]. The identification of drought-vulnerable areas and suitable locations for climate monitoring stations can be designed based on satellite-based drought products. The establishment of more systematic and effective drought management systems, such as the Famine Early Warning System (FEWS-NET) and the Monitoring Agricultural Resources (MARS) in Africa can be done, but they should be more suited to the local climatic systems. In the future, many African countries are likely to see negative impacts on subsistence agriculture due to the effects of global warming. Increased climate variability is forecasted, with more frequent extreme events. Initiatives for managing climate change and increased climate variability therefore requires baseline information on satellite-based drought indicators for future monitoring and anomaly detection [59].
Findings have indicated that the fully satellite-based run-off models can assess and quantify drought impacts from a local catchment perspective of Peninsular Malaysia. Studies [60,61] show that in the east and northeast regions of the Peninsular Malaysia where critical drought occur, the models provide a powerful tool for monitoring drought conditions. Given the ground-based observations are very limited and unevenly distributed across Peninsular Malaysia, satellite-based run-off models could lead to improvement in drought monitoring, and seasonal forecasts in this region. The developed drought monitoring methods provide complementary information, and it could lead to a better understanding of (i) the operational application of drought monitoring at spatiotemporal scale (Figure 10); (ii) the ecosystem response to hydro-climatic variability (Figure 11 and Figure 12); and (iii) the ability to assessing a precise and comprehensive grid-based drought conditions and distributions (Figure 13 and Figure 14).

5. Conclusions

The use of satellite measurements to assess drought is a significant and relevant step to understanding global climatic changes. This study provides a basic guideline on how droughts can be monitored and assessed operationally using satellite observations. Many demonstrations on the operational use of satellites have been developed for detailed monitoring and mapping of floods and droughts with the combination of in situ data. Gathering sufficient information on the spatial and temporal nature of droughts will require the installation of additional ground-stations at high spatial coverage, which would be logistically expensive. Fully satellite-based drought monitoring can supplement in situ data by providing consistent observations with global coverage and would be cost-effective. The spatiotemporal maps have the ability to identify drought vulnerable areas, indicating that the satellite-based run-off model of rainfall and evapotranspiration can be used for climate change impact assessment from local to global scales. Knowledge gained from this study could be useful for developing spatiotemporal drought identification methods and assessing and quantifying the impact of drought on water-related ecosystems (e.g., freshwater productivity) across tropical regions-similar to hydro-climatic characteristics of Peninsular Malaysia. Rainfall is a vital component of the hydrologic cycle and plays a key role in monitoring drought, especially in water-limited ecosystems, and in conserving watershed areas to support economic activities. The rapid changes of rainfall and evapotranspiration in the Southeast Asian humid tropical areas, particularly under climatic or hydrologic extremes such as drought, can be effectively monitored at a regional scale using satellite multi-sensor products. The impact of drought on the carbon cycle, water storage, and broadly drought-induced climate changes can therefore be studied in a comprehensive manner.

Acknowledgments

The authors would like to thank Universiti Teknologi Malaysia Flagship Grant (Q.J130000.2409.03G06) for the financial support of this study. We also acknowledge the Meteorological Service of Malaysia for providing the rain gauge data, and the Drainage and Irrigation Department Malaysia for providing the river flow data. Post-doctoral assistantships (Q.J130000.21A2.02E92) and QJ130000.21A2.02E71 of Universiti Teknologi Malaysia is also acknowledged. The authors would like to thank the Assistant Editor, Nelson Peng and three anonymous reviewers, whose constructive comments and inputs significantly improved the article.

Author Contributions

M.H. conceived, designed and is the principal investigator of the study; M.I.N., M.I.A. and M.R.M. performed the digital image processing including the code programming; M.N.R., A.B.P., and M.S.H. analyzed the data; A.R.Y. and S.W.J. assisted in field verification; M.H. and M.S.H. wrote and edit the paper.

Conflicts of Interest

The authors declare no conflict of interest.

Appendix

Table A1. Location of the Malaysian meteorological stations. Notes: the listed stations were operational since 1980s; A denotes rainfall and other climatic variable, B denotes rainfall, and C denotes streamflow observation stations.
No.IDNameTypesRegionLatitude (° ′ ′′)Longitude (° ′ ′′)Height (m.s.l) (m)
148604ChupingANorthwest6 29 00100 16 0022
248600LangkawiANorthwest6 20 00099 44 006.4
348603Alor SetarANorthwest6 12 00100 44 004
448602ButterworthANorthwest5 28 00100 23 002
541529PeraiANorthwest5 21 00100 24 001
648601Bayan LepasANorthwest5 18 00100 15 003
748674MersingAEast2 27 00103 50 0043.6
848642Batu EmbunAEast3 58 00102 21 0059
948657KuantanAEast3 47 00103 13 0015
1048653TemerlohAEast3 28 00102 23 0039
1148649Muadzam ShahAEast3 03 00103 05 0033
1248618Kuala TerengganuAEast5 23 00103 06 005
1348619Kuala Terengganu M.C.AEast5 20 00103 08 0035
1448615Kota BharuAEast6 10 00102 17 004.6
1548616Kuala KraiAEast5 32 00102 12 0068.3
1648661Ulu ChanisBEast2 48 45102 56 15N/A
1748625IpohAWest4 35 00101 06 0039
1848620SitiawanAWest4 13 00101 42 007
1948623Lubuk MerbauAWest4 48 00100 54 0077.2
2048631Cameron HighlandsAWest (Highland)4 28 00101 23 001472
2148647SubangAWest3 07 00101 33 0017
2248648Petaling JayaAWest3 06 00101 39 0045.7
2348650Sepang KLIAAWest2 43 00101 42 0016.3
2448658Ldg. SungkaiBWest3 58 15101 18 00N/A
2548665MelakaASouthwest2 16 00102 15 009
2648672KluangASouthwest2 01 00103 19 0088.1
2748670Batu PahatASouthwest1 52 00102 59 006.3
2848679SenaiASouthwest1 38 00103 40 0037.8
295721442Sg. KelantanCEast5 45 45102 09 00N/A
304809443Sg. PerakCWest4 49 10100 57 55N/A

References

  1. Wilhite, D.; Svoboda, M.; Hayes, M. Understanding the complex impacts of drought: A key to enhancing drought mitigation and preparedness. Water Resour. Manag. 2007, 21, 763–774. [Google Scholar] [CrossRef]
  2. Du, L.; Tian, Q.; Yu, T.; Meng, Q.; Jancso, T.; Udvardy, P.; Huang, Y. A Comprehensive drought monitoring method integrating MODIS and TRMM data. Int. J. Appl. Earth Obs. Geoinform. 2013, 23, 245–253. [Google Scholar] [CrossRef]
  3. Zargar, A.; Sadiq, R.; Naser, B.; Khan, F.I. A review of drought indices. Environ. Rev. 2011, 19, 333–349. [Google Scholar] [CrossRef]
  4. Rhee, J.; Im, J.; Park, S. Regional drought monitoring based on multi-sensor remote sensing. In Remote Sensing of Water Resources, Disasters, and Urban Studies; Thenkabail, D., Ed.; CRC Press: Florida, USA, 2015; pp. 401–415. [Google Scholar]
  5. Vyas, S.S.; Bhattacharya, B.K.; Nigam, R.; Guhathakurta, P.; Ghosh, K.; Chattopadhyay, N.; Gairola, R.M. A combined deficit index for regional agricultural drought assessment over semi-arid tract of India using geostationary meteorological satellite data. Int. J. Appl. Earth Obs. Geoinform. 2015, 39, 28–39. [Google Scholar] [CrossRef]
  6. Anderson, M.C.; Allen, R.G.; Morse, A.; Kustas, W.P. Use of Landsat Thermal Imagery in monitoring evapotranspiration and managing water resources. Remote Sens. Environ. 2012, 122, 50–65. [Google Scholar] [CrossRef]
  7. Wilhite, D.A.; Sivakumar, M.V.K.; Pulwarty, R. Managing drought risk in a changing climate: The role of national drought policy. Weather Clim. Extremes 2014, 3, 4–13. [Google Scholar] [CrossRef]
  8. Rossi, G.; Vega, T.; Bonaccorso, B. Methods and Tools for Drought Analysis and Management; Springer: Dordrecht, The Netherlands, 2007; p. 421. [Google Scholar]
  9. Miyan, M.A. Droughts in Asian least developed countries: Vulnerability and sustainability. Weather Clim. Extremes 2015, 7, 8–23. [Google Scholar] [CrossRef]
  10. Wilhite, D.A. Drought as a Natural Hazard: Concepts and Definitions; Routledge: London, UK, 2000; p. 18. [Google Scholar]
  11. Mildrexler, D.; Yang, Z.; Cohen, W.B.; Bell, D.M. A forest vulnerability index based on drought and high temperatures. Remote Sens. Environ. 2016, 173, 314–325. [Google Scholar] [CrossRef]
  12. Nam, W.; Hayes, M.J.; Svoboda, M.D.; Tadesse, T.; Wilhite, D.A. Drought Hazard assessment in the context of climate change for South Korea. Agric. Water Manag. 2015, 160, 106–117. [Google Scholar] [CrossRef]
  13. Delhomme, J.P. Kriging in the Hydrosciences. Adv. Water Resour. 1978, 1, 251–266. [Google Scholar] [CrossRef]
  14. Tao, T.; Chocat, B.; Liu, S.; Xin, K. Uncertainty Analysis of interpolation methods in rainfall spatial distribution—A case of small catchment in Lyon. J. Water Resour. Prot. 2009, 1, 136–144. [Google Scholar] [CrossRef]
  15. Swain, S.; Wardlow, B.D.; Narumalani, S.; Tadesse, T.; Callahan, K. Assessment of vegetation response to drought in Nebraska using Terra-MODIS land surface temperature and normalized difference vegetation index. GISci. Remote Sens. 2011, 48, 432–455. [Google Scholar] [CrossRef]
  16. Aghakouchak, A.; Farahmand, A.; Melton, F.S.; Teixeira, J.; Anderson, M.C.; Wardlow, B.D.; Hain, C.R. Remote sensing of drought: Progress, challenges and opportunities. Rev. Geophys. 2015, 53, 452–480. [Google Scholar] [CrossRef]
  17. McVicar, T.R.; Jupp, D.L.B. The current and potential operational uses of remote sensing to aid decisions on drought exceptional circumstances in Australia: A review. Agric. Syst. 1998, 57, 399–468. [Google Scholar] [CrossRef]
  18. Goerner, A.; Reichstein, M.; Rambal, S. Tracking seasonal drought effects on ecosystem light use efficiency with satellite-based PRI in a Mediterranean forest. Remote Sens. Environ. 2009, 113, 1101–1111. [Google Scholar] [CrossRef]
  19. Yao, Y.; Liang, S.; Qin, Q.; Wang, K.; Zhao, S. Monitoring global land surface drought based on an improved evapotranspiration model. Int. J. Appl. Earth Obs. Geoinform. 2011, 13, 447–457. [Google Scholar] [CrossRef]
  20. Mu, Q.; Zhao, M.; Kimball, J.S.; McDowell, N.G.; Running, S.W. A remotely sensed global terrestrial drought severity index. Bull. Am. Meteor. Soc. 2013, 94, 83–98. [Google Scholar] [CrossRef]
  21. Yirdaw, S.Z.; Snelgrove, K.R.; Agboma, C.O. GRACE satellite observations of terrestrial moisture changes for drought characterization in the Canadian Prairie. J. Hydrol. 2008, 356, 84–92. [Google Scholar] [CrossRef]
  22. Swenson, S.; Wahr, J.; Milly, P.C.D. Estimated accuracies of regional water storage variations inferred from the gravity recovery and climate experiment (GRACE). Water Resour. Res. 2003, 39. [Google Scholar] [CrossRef]
  23. Wang, L.; Qu, J.J.; Hao, X. Forest fire detection using the normalized multi-band drought index (NMDI) with satellite measurements. Agric. For. Meteorol. 2008, 148, 1767–1776. [Google Scholar] [CrossRef]
  24. Rahimzadeh Bajgiran, P.; Darvishsefat, A.A.; Khalili, A.; Makhdoum, M.F. Using AVHRR-based vegetation indices for drought monitoring in the northwest of Iran. J. Arid Environ. 2008, 72, 1086–1096. [Google Scholar] [CrossRef]
  25. Park, S.; Im, J.; Jang, E.; Rhee, J. Drought assessment and monitoring through blending of multi-sensor indices using machine learning approaches for different climate regions. Agric. For. Meteorol. 2016, 216, 157–169. [Google Scholar] [CrossRef]
  26. Sheffield, J.; Goteti, G.; Wood, E.F. Development of a 50-year high-resolution global dataset of meteorological forcings for land surface modeling. J. Clim. 2006, 19, 3088–3111. [Google Scholar] [CrossRef]
  27. Zhou, T.; Nijssen, B.; Huffman, G.J.; Lettenmaier, D.P. Evaluation of real-time satellite precipitation data for global drought monitoring. J. Hydrometeor 2014, 15, 1651–1660. [Google Scholar] [CrossRef]
  28. Melendez-Pastor, I.; Navarro-Pedreño, J.; Gómez, I.; Koch, M. Detecting drought induced environmental changes in a Mediterranean wetland by remote sensing. Appl. Geogr. 2010, 30, 254–262. [Google Scholar] [CrossRef]
  29. Rojas, O.; Vrieling, A.; Rembold, F. Assessing drought probability for agricultural areas in Africa with coarse resolution remote sensing imagery. Remote Sens. Environ. 2011, 115, 343–352. [Google Scholar] [CrossRef]
  30. Milewski, A.; Elkadiri, R.; Durham, M. Assessment and comparison of TMPA satellite precipitation products in varying climatic and topographic regimes in Morocco. Remote Sens. 2015, 7, 5697–5717. [Google Scholar] [CrossRef]
  31. Sahoo, A.K.; Sheffield, J.; Pan, M.; Wood, E.F. Evaluation of the tropical rainfall measuring mission multi-satellite precipitation analysis (TMPA) for assessment of large-scale meteorological drought. Remote Sens. Environ. 2015, 159, 181–193. [Google Scholar] [CrossRef]
  32. Nichol, J.E.; Abbas, S. Integration of remote sensing datasets for local scale assessment and prediction of drought. Sci. Total Environ. 2015, 505, 503–507. [Google Scholar] [CrossRef] [PubMed]
  33. AghaKouchak, A.; Mehran, A.; Norouzi, H.; Behrangi, A. Systematic and random error components in satellite precipitation data sets. Geophys. Res. Lett. 2012, 39. [Google Scholar] [CrossRef]
  34. Oki, T.; Musiake, K. Seasonal change of the diurnal cycle of precipitation over Japan and Malaysia. J. Appl. Meteorol. 1994, 33, 1445–1463. [Google Scholar] [CrossRef]
  35. Wang, Y.; Herzschuh, U. Reassessment of holocene vegetation change on the upper Tibetan Plateau using the pollen-based REVEALS model. Rev. Palaeobot. Palynol. 2011, 168, 31–40. [Google Scholar] [CrossRef]
  36. Houborg, R.; Rodell, M.; Li, B.; Reichle, R.; Zaitchik, B.F. Drought indicators based on model-assimilated gravity recovery and climate experiment (GRACE) terrestrial water storage observations. Water Resour. Res. 2012, 48. [Google Scholar] [CrossRef]
  37. Wong, C.L.; Venneker, R.; Uhlenbrook, S.; Jamil, A.B.M.; Zhou, Y. Variability of rainfall in Peninsular Malaysia. Hydrol. Earth Syst. Sci. 2009, 6, 5471–5503. [Google Scholar] [CrossRef]
  38. Malaysian Meteorological Department. Climate Change Scenarios for Malaysia 2001–2099; Malaysian Meteorological Department: Selangor, Malaysia, 2009. [Google Scholar]
  39. Climate Prediction Center. Available online: http://www.cpc.ncep.noaa.gov/products/analysis_monitoring/ensostuff/ensoyears.shtml (accessed on 15 May 2016).
  40. Thornthwaite, C.W.; Mather, J.R. The Water Balance; Drexel Institute of Technology, Laboratory of Climatology: Centerton, NJ, USA, 1955; p. 104. [Google Scholar]
  41. Mahmud, M.R.; Numata, S.; Matsuyama, H.; Hosaka, T.; Hashim, M. Assessment of effective seasonal downscaling of TRMM precipitation data in Peninsular Malaysia. Remote Sens. 2015, 7, 4092–4111. [Google Scholar] [CrossRef]
  42. Kleidon, A.; Heimann, M. A method of determining rooting depth from a terrestrial biosphere model and its impacts on the global water and carbon cycle. Glob. Chang. Biol. 1998, 4, 275–286. [Google Scholar] [CrossRef]
  43. Hydrology and Water Resources Division Department of Irrigation and Drainage Malaysia. Drought Report of Peninsular Malaysia; Hydrology and Water Resources Division Department of Irrigation and Drainage Malaysia: Lumpur, Malaysia, 2005. [Google Scholar]
  44. Goddard Earth Sciences Data and Information Services Center. Available online: http://mirador.gsfc.nasa.gov/cgi-bin/mirador/presentNavigation.pl?tree=project&project=TRMM (accessed on 15 May 2016).
  45. Mu, Q.Z.; Zhao, M.S.; Running, S.W. Improvements to a MODIS global terrestrial evapotranspiration algorithm. Remote Sens. Environ. 2011, 115, 1781–1800. [Google Scholar] [CrossRef]
  46. Bastiaanssen, W.G.M.; Ahmad, M.D.; Chemin, Y. Satellite surveillance of evaporative depletion across the Indus Basin. Water Resour. Res. 2002, 38, 1273–1282. [Google Scholar] [CrossRef]
  47. Nadzri, M.I.; Hashim, M. Validation of satellite precipitation using TRMM recent products. In Proceedings of the 34th Asian Conference on Remote Sensing, Bali, Indonesia, 20–24 October 2013; pp. 1992–1999.
  48. Nadzri, M.I.; Hashim, M. Validation of MODIS data for localized spatio-temporal evapotranspiration mapping. IOP Conf. Ser. Earth Environ. Sci. 2014, 18. [Google Scholar] [CrossRef]
  49. Mu, Q.; Heinsch, F.A.; Zhao, M.; Running, S.W. Development of a global evapotranspiration algorithm based on MODIS and global meteorology data. Remote Sens. Environ. 2007, 111, 519–536. [Google Scholar] [CrossRef]
  50. Hao, C.; Zhang, J.; Yao, F. Combination of multi-sensor remote sensing data for drought monitoring over Southwest China. Int. J. Appl. Earth Obs. Geoinform. 2015, 35, 270–283. [Google Scholar] [CrossRef]
  51. Bolten, J.D.; Crow, W.T.; Zhan, X.; Jackson, T.J.; Reynolds, C.A. Evaluating the utility of remotely sensed soil moisture retrievals for operational agricultural drought monitoring. IEEE J. Sel. Top. Appl. Earth Obs. Remote Sens. 2010, 3, 57–66. [Google Scholar] [CrossRef]
  52. Van Dijk, A.I.J.M.; Beck, H.E.; Crosbie, R.S.; de Jeu, R.A.M.; Liu, Y.Y.; Podger, G.M.; Timbal, B.; Viney, N.R. The millennium drought in Southeast Australia (2001–2009): Natural and human causes and implications for water resources, ecosystems, economy, and society. Water Resour. Res. 2013, 49, 1040–1057. [Google Scholar] [CrossRef]
  53. Brown, J.F.; Wardlow, B.D.; Tadesse, T.; Hayes, M.J.; Reed, B.C. The vegetation drought response index (VegDRI): A new integrated approach for monitoring drought stress in vegetation. GISci. Remote Sens. 2008, 45, 16–46. [Google Scholar] [CrossRef]
  54. Cáceres, M.D.; Martínez-Vilalta, J.; Coll, L.; Llorens, P.; Casals, P.; Poyatos, R.; Pausas, J.G.; Brotons, L. Coupling a water balance model with forest inventory data to predict drought stress: The role of forest structural changes vs. climate changes. Agric. For. Meteorol. 2015, 213, 77–90. [Google Scholar] [CrossRef]
  55. Xie, J.; Zha, T.; Zhou, C.; Jia, X.; Yu, H.; Yang, B.; Chen, J.; Zhang, F.; Wang, B.; Bourque, C.P.-A.; et al. Seasonal variation in ecosystem water use efficiency in an urban-forest reserve affected by periodic drought. Agric. For. Meteorol. 2016, 221, 142–151. [Google Scholar] [CrossRef]
  56. Yaduvanshi, A.; Srivastava, P.K.; Pandey, A.C. Integrating TRMM and MODIS satellite with socio-economic vulnerability for monitoring drought risk over a tropical region of India. Phys. Chem. Earth Parts A/B/C 2015, 83–84, 14–27. [Google Scholar] [CrossRef]
  57. Golian, S.; Mazdiyasni, O.; AghaKouchak, A. Trends in meteorological and agricultural droughts in Iran. Theor. Appl. Climatol. 2014, 119, 679–688. [Google Scholar] [CrossRef]
  58. Hoerling, M.; Kumar, A. The perfect ocean for drought. Science 2003, 299, 691–694. [Google Scholar] [CrossRef] [PubMed]
  59. Grimes, D.I.F.; Diop, M. Satellite-based rainfall estimation for river flow forecasting in Africa. I: Rainfall estimates and hydrological forecasts. Hydrol.l Sci. J. 2003, 48, 567–584. [Google Scholar] [CrossRef]
  60. Zin, W.Z.W.; Jemain, A.A.; Ibrahim, K. Analysis of drought condition and risk in Peninsular Malaysia using Standardised Precipitation Index. Theor. Appl. Climatol. 2013, 111, 559–568. [Google Scholar] [CrossRef]
  61. Tangang, F.T.; Juneng, L.; Salimun, E.; Sei, K.M.; Le, L.J.; Muhamad, H. Climate change and variability over Malaysia: Gaps in science and research information. Sains Malays. 2012, 41, 1355–1366. [Google Scholar]
Figure 1. Maps of the study area, illustrating watershed and land-use types for the Kelantan and Hulu Perak catchments, boundaries of local climate regions, and the location of meteorological data collecting stations over Peninsular Malaysia (also referred to Table A1).
Remotesensing 08 00633 g001
Figure 2. (ae) Comparison of monthly rainfall data from calibrated TRMM multi-satellites precipitation analysis data (TMPA) with rain gauge data over different regions (referred to the local climate regions, shown in Figure 1) in Peninsular Malaysia for 2000–2010; p denotes the probability level of significance, and r denotes the correlation coefficient.
Remotesensing 08 00633 g002
Figure 3. Overall methodology of drought assessment.
Remotesensing 08 00633 g003
Figure 4. Standard procedure of run-off estimates using the satellite data.
Remotesensing 08 00633 g004
Figure 5. The scheme followed for the estimation of evapotranspiration using the MODIS 16 algorithm (Source: Mu et al., 2007); LAI denotes leaf area index, and EVI denotes enhanced vegetation index.
Remotesensing 08 00633 g005
Figure 6. The results of the monthly TMPA computed for the years between 2006 and 2010 for different stations representing each local climate region (refer to Figure 1 and Table A1), illustrating the differences in bias (a); mean absolute error (b); root mean square error (c); and Nash-Sutcliffe value (d) before and after calibration.
Remotesensing 08 00633 g006
Figure 7. Correlations (r) (a and b for calibrated and uncalibrated respectively) and residual mean square error (ERMS) (c and d for calibrated and uncalibrated respectively) between rain gauge and satellite-based TMPA, illustrating spatiotemporal variations and performance of the TMPA rainfall; interpolated values derived from discrete rain gauges are presented in color gradient.
Remotesensing 08 00633 g007
Figure 8. The plots of bias (a); mean absolute error (b); root mean square error (c); and Nash-Sutcliffe efficiency value (d) computed with the validation process for the MODIS evapotranspiration and data from 26 meteorological stations, collected in the years between 2006 and 2010 in different seasons, illustrating the differences before and after calibration.
Remotesensing 08 00633 g008
Figure 9. The run-off maps of normal (a) and drought seasons (b); percent run-off (c); and land-use (d), illustrating the drought cases in July 2005 for Kelantan (upper row) and Hulu Perak (lower row) states.
Remotesensing 08 00633 g009
Figure 10. Maps of monthly evapotranspiration during the drought period for Hulu Perak (al) and Kelantan (mx).
Remotesensing 08 00633 g010aRemotesensing 08 00633 g010b
Figure 11. Comparison between the actual river flow and satellite run-off estimates from severely affected sub-catchments in the Kelantan basin.
Remotesensing 08 00633 g011
Figure 12. The plots of monthly average run-off in the normal and drought seasons for Relai, Gunung Stong and Ulu Gading Forest (a); and Gading Catchment Forest catchment (b); Kelantan (c); and Hulu Perak River (d).
Remotesensing 08 00633 g012
Figure 13. The test of significance based on bias, Nash-Sutcliffe, and root mean square error for the satellite-based water yield of the Hulu Perak (a) and the Kelantan (b) rivers.
Remotesensing 08 00633 g013
Figure 14. Plots of cumulative water yield in the period between January 2000 and December 2010, analyzed with the double mass curve for the Kelantan (a) and the Hulu Perak (b) rivers, illustrating satellite-based versus ground-simulated run-off.
Remotesensing 08 00633 g014
Table 1. Reported periods on El Niño episodes by the Malaysian Meteorological Department. Source: [39].
El Nino Episode
BeginningEnd
May 2002February 2003
June 2004June 2005
August 2006February 2007
June 2009May 2010
Table 2. Comparison of mean monthly rainfall data from rain gauge with TMPA uncalibrated and calibrated data respectively over the region. Note: S/G = satellite/gauge.
RegionNo. of GaugesMean Monthly Rainfall (mm) Derived fromS/G ratio
GaugeUncalibrated TMPACalibrated TMPAUncalibratedCalibrated
Northwest6202.15138.26172.830.680.90
East10225.2489.41129.590.400.68
Southwest3167.5998.42131.230.590.79
West9210.21149.87187.340.710.92
Peninsular28201.3118.99155.250.600.82
Table 3. Computed mean and satellite based gauge (S/G)-ratios of the potential evapotranspiration (ET) measurements using ground temperature and MODIS data for the meteorological stations (referred to Figure 1 and Table A1).
Station (ID)Mean Ground Computed ET (mm/month)Mean MODIS ET (mm/month)Monthly S/G Ratio
Chuping (48604)147.3205.41.4
Alor Setar (48603)149.5126.30.8
Butterworth (48602)169.9106.30.6
K. Bharu (48615)135.6119.00.9
KualaTerengganu (48619)237.7166.80.7
Ipoh (48625)155.635.00.2
Kuantan (48657)123.987.20.7
Subang (48647)133.6139.51.0
Melaka (48665)132.879.70.6
Senai (48679)129.560.90.5
Table 4. Classified areas (km2) in the run-off deficit map by five major land-use types for the state of Kelantan and Hulu Perak. Note: F = Forest, OP = Oil palm, P = Paddy, R = Rubber, O = Others, N/A = not available.
Run-off Deficit (%)Land-Use (km2)
KelantanHulu Perak
FOPPROFOPPRO
100–80903558410498137N/AN/AN/AN/A
79–601508605816061542N/AN/AN/AN/A
59–40178011210330298722N/AN/AN/AN/A
39–2038374194829023281409N/AN/AN/AN/A
<202510121234533172453N/AN/AN/AN/A

