1. Introduction
Despite the noteworthy advances achieved in the field of through-wall radar (TWR) technology, most systems currently available are complex, expensive, and bulky owing to the necessity to achieve adequate performance in terms of imaging resolution [
1,
2,
3,
4,
5,
6,
7,
8]. For these reasons, apart from the military sector, such systems have limited applicability and are not suitable for civilian applications where large scale and long-term investigations with cost-effective sensing devices are usually demanded. In some cases, it is just sufficient to get situation awareness about the inspected region simply by detecting human presence or motion. Accordingly, simple and low-cost sensors possibly arranged to form a sensor network become very attractive for many real-life applications. Besides surveillance and security, emerging fields which may benefit from the availability of such simple and low cost devices are ambient assisted living and elderly care, where radar signatures can be profitably exploited to recognize human gait [
9,
10,
11,
12,
13,
14] and monitor the movements of elderly subjects in smart homes with the aim to detect falls [
15,
16].
Continuous Wave (CW) Doppler radar sensors constitute the simplest and less expensive technological solution for human activity detection and classification. These sensors were introduced in 1970s demonstrating, for the first time, the concept of contactless vital signs detection [
17,
18]. In recent years, the technological advances have triggered numerous studies on CW Doppler radars devoted on one hand to the miniaturization and sensitivity improvement [
19,
20] and on the other hand to their assessment in new applicative contexts [
21,
22,
23,
24,
25,
26]. In medicine, these radar systems have been proposed for preventing sudden infant death syndrome [
22], tumor tracking in radiation therapy [
22], sleep monitoring [
23], imaging cardiac motion [
24], monitoring of elderly subjects in smart homes [
16], and detection of sleep breathing disorder episodes in living animals [
25]. CW Doppler radars have been recently proposed also as intelligent occupancy sensors as an alternative or to be integrated with currently available sensors, i.e., based on ultrasound and passive infrared technology, which are characterized by a high rate of false alarms and failure to detect static subjects [
26].
This letter is concerned with the development of a short range CW Doppler radar with the goal of detecting human presence in through-wall scenarios. The implemented radar architecture is based on a two-channel homodyne receiver that measures the in-phase (I) and quadrature (Q) component of the signal reflected by human subjects in the scene. The amplitude of such signals is highly influenced by human motion and, to a lesser degree, by tiny physiological movements of the human chest wall due to breathing activity. Micro Doppler signatures related to heartbeat are hardly detectable since the radar operates at relatively low frequencies to meet the wall penetration capability requirement. The basic idea underlying this work is the exploitation of different signal variability related to motion and breathing patterns in order to discriminate between situations where subjects are moving or static inside the surveillance area. This goal is pursued by an ad hoc developed detection algorithm that automatically provides a real-time output. The detection performance of the overall system (hardware plus software) is assessed by means of experimental tests carried out in a public indoor scenario.
It must be stressed that, unlike previous works [
9,
10,
11,
12,
13,
14] which have been mainly focused on the classification of human activities based on the spectral features of the radar signal, this work presents a simple radar system and a computationally efficient detection approach to gain real-time situation awareness of a through-wall scene comprising one or several subjects. To the best of the authors’ knowledge, such an approach has not been applied so far to solve this problem. Indeed, the research emphasis in this frame has been mostly devoted to target imaging, detection, and tracking, which are generally pursued by resorting to ultra-wide-band (UWB) radar systems [
2]. Moreover, a physical and bulky antenna array has to be deployed to achieve adequate image resolution and satisfactory detection/tracking performance [
2,
6].
2. Radar System Description
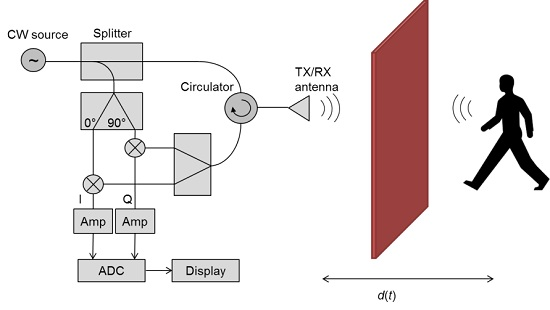
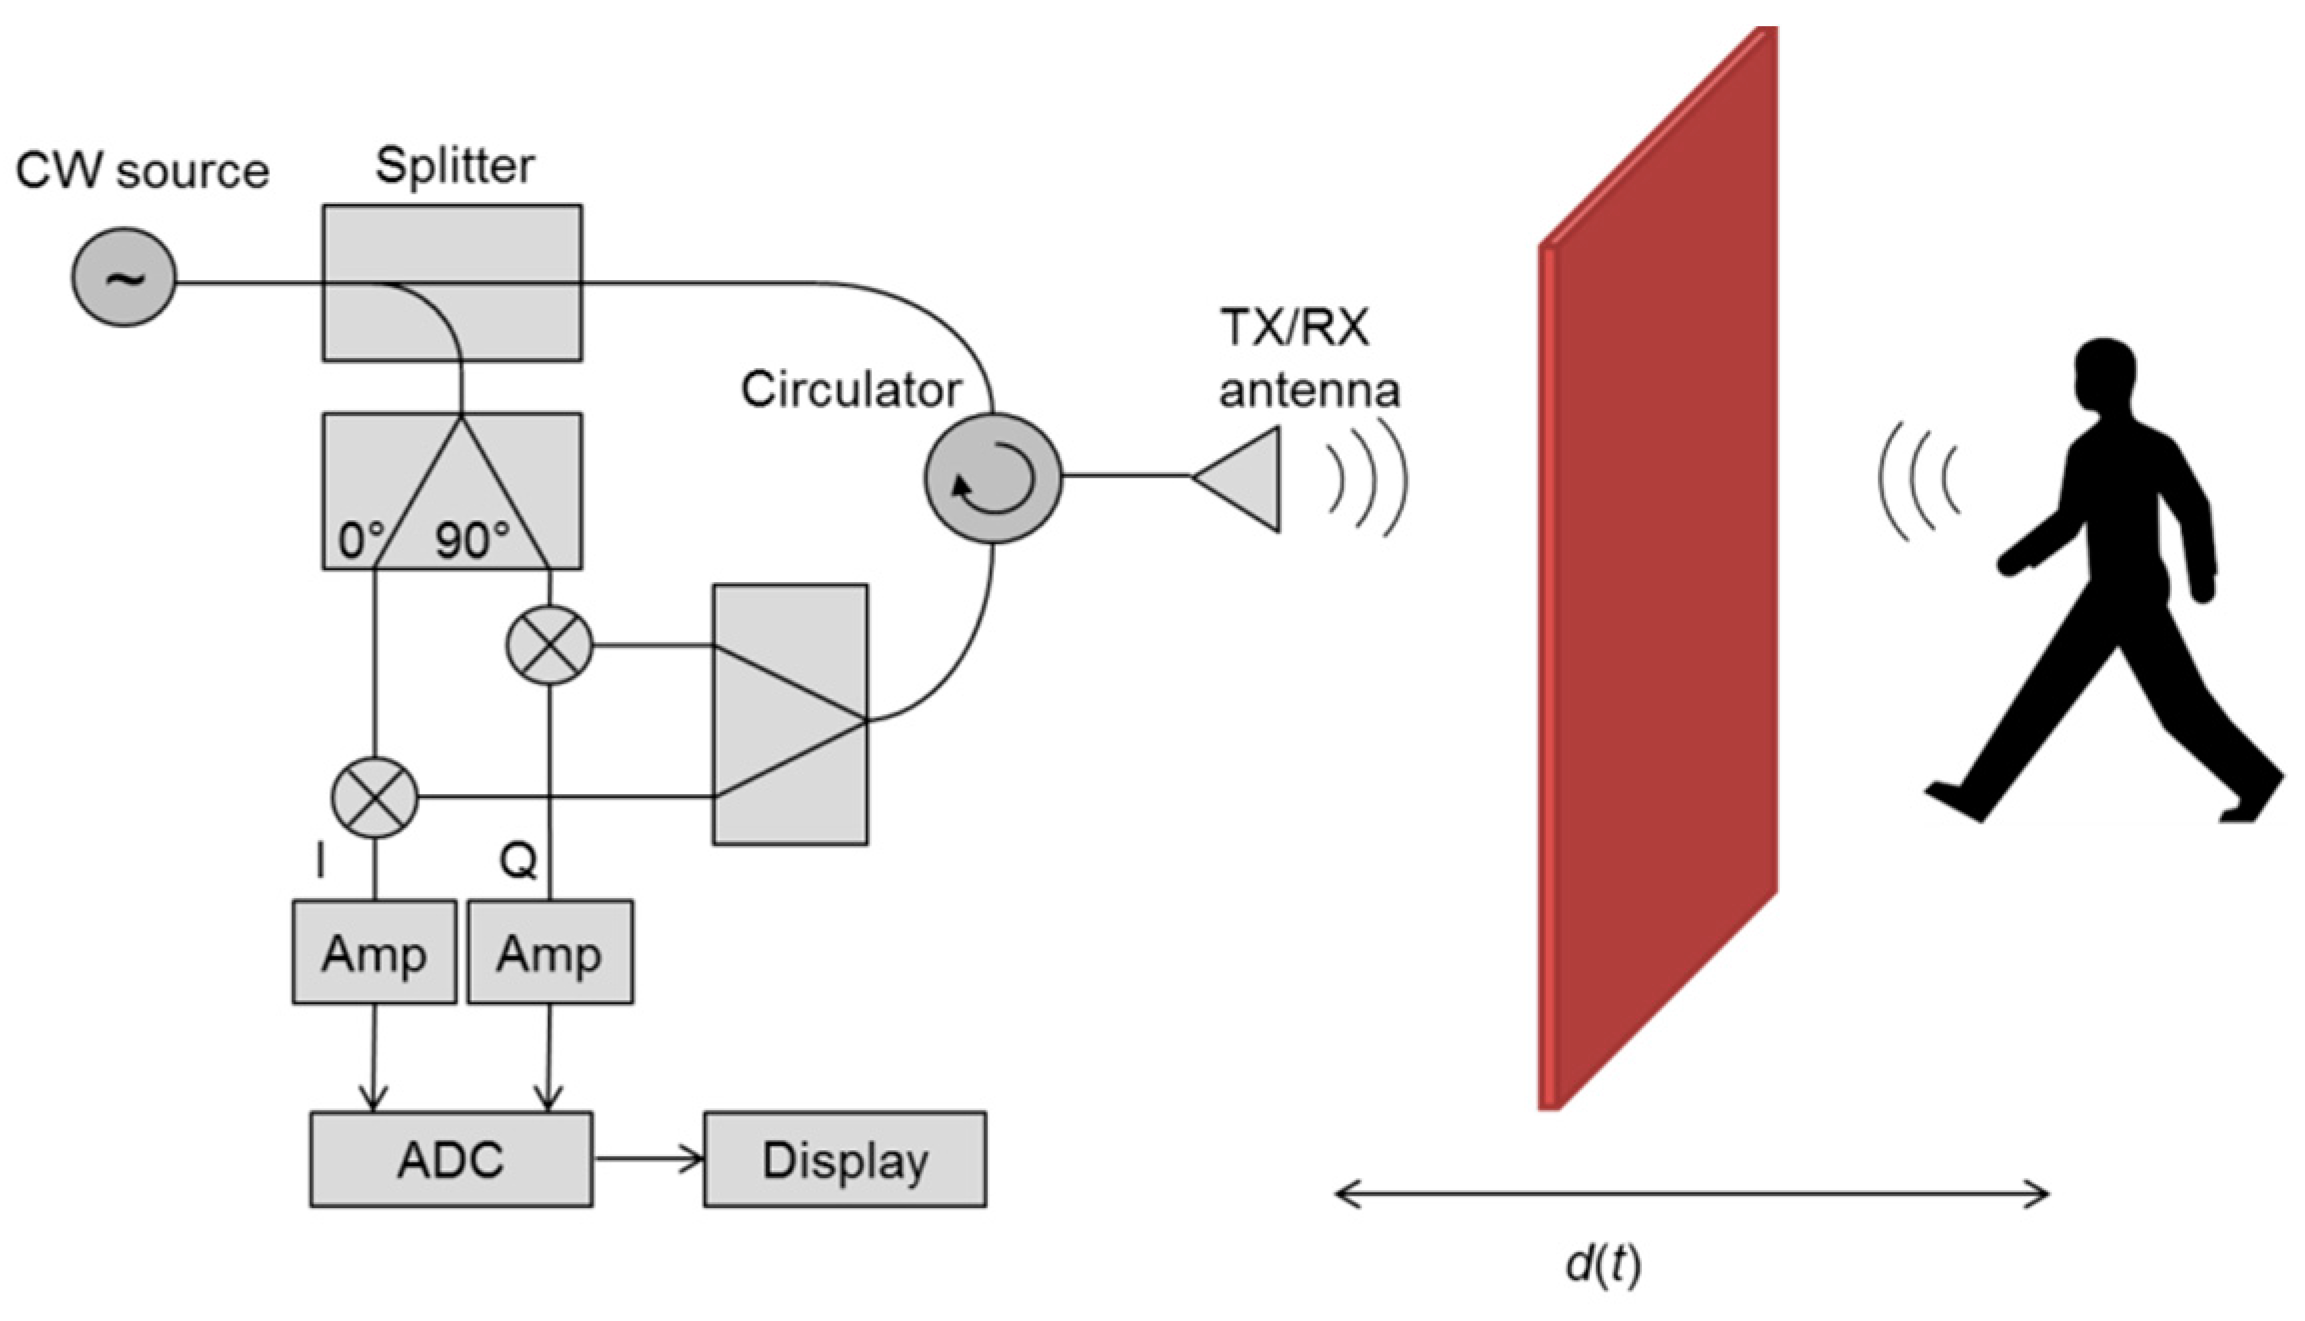
The radar system architecture and the operative scenario are depicted in
Figure 1. A microwave source generates a CW signal
with
being the amplitude,
the frequency, and
the phase noise. Such a signal is partly radiated by the radar antenna and partly used to generate two reference signals with a ninety degree phase offset, which are employed as local oscillators for signal demodulation.
The transmitting and receiving channels are decoupled by means of a circulator so that a single antenna is deployed for transmitting and receiving the radio signal. The radar echo reflected from the target and available at the antenna output is given by
where the amplitude term
accounts for target cross-section and propagation effects,
is the time-varying distance between the target and the radar,
is the free-space wavelength (
is the wavespeed). The signal
is split into two signals which are downconverted to baseband yielding the
I and
Q components, i.e.,
where
is the residual phase noise. Few inessential amplitude factors are omitted in Equations (2) and (3) in order to simplify notation; however these formulas clearly highlight the non-linear (phase) modulation caused by human movements and breathing activity through the time varying distance
. The baseband
I and
Q signals are finally amplified and digitized for subsequent data processing.
Different demodulation schemes have been proposed in recent years to exploit at the same time the information carried by the
I and
Q components [
22]. Among them, arctangent demodulation is very attractive since it allows compensation of the non-linear phase modulation effect, which can result in a sub-optimal detection point for periodic movements (i.e., breathing). However, its use in real-life operating conditions is challenging since proper calibration of DC offsets is required in order to achieve accurate angular information. The DC offsets are produced by hardware but even from static targets and stationary parts of targets. Therefore, repeated calibrations are required in response to changes in the environment.
In this work, for sake of simplicity, we select one between the
I or
Q signal on the basis of the stronger variability, e.g., greater standard deviation, in order to achieve a satisfactory sensitivity. Furthermore, the DC component of the selected (
I or
Q) signal is filtered because only their variations are representative of motion and breathing activities. The resulting signal, here denoted as
y(
t), is given as input to the detection algorithm described in
Section 3.
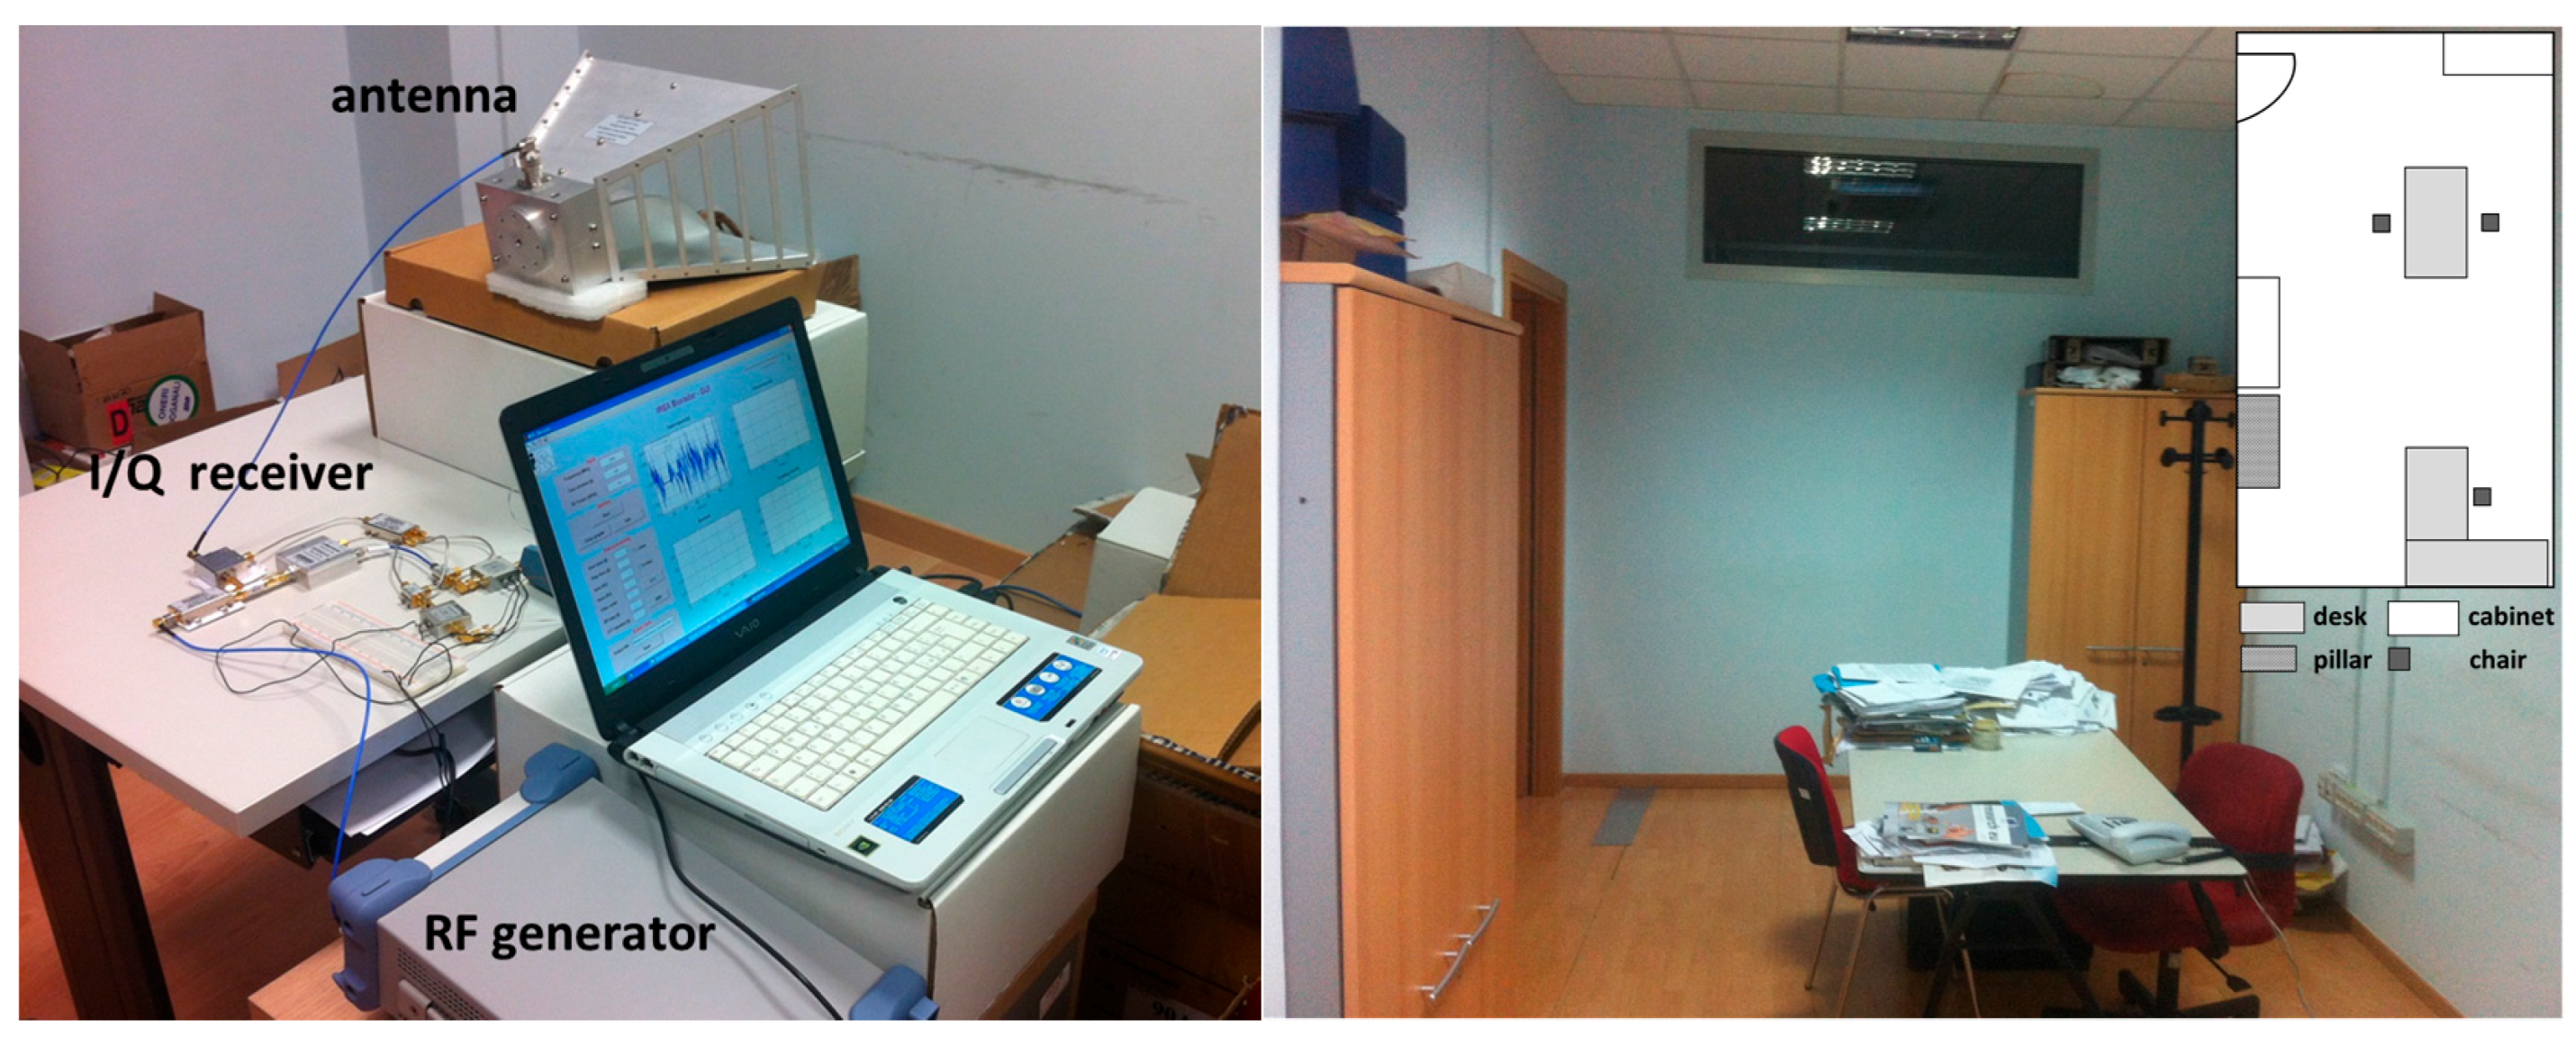
The left and right panels of
Figure 2 are photographs showing the measurement set-up employed for the experimental tests and the through-wall scenario, respectively. The radar is implemented by using a radiofrequency signal generator as a CW source (18 dBm emitted power), a wideband horn antenna (10 dB typical gain), and coaxial off-the-shelf components (power splitters, circulator, mixers, and amplifiers) to build up the receiver. The baseband voltages are recorded by means of a digital acquisition board. The radar antenna is placed at a stand-off distance of 0.8 m above the ground and 1 m away from a 0.2 m thick plasterboard wall. The through-wall scene consists in a 7 m long and 3 m wide room containing some pieces of furniture (desks, cabinets, chairs). Several experimental tests are carried out at 2.3 GHz with one or more humans moving inside the room and the radar data are recorded over a time window of 120 s with a sampling time of 0.05 s.
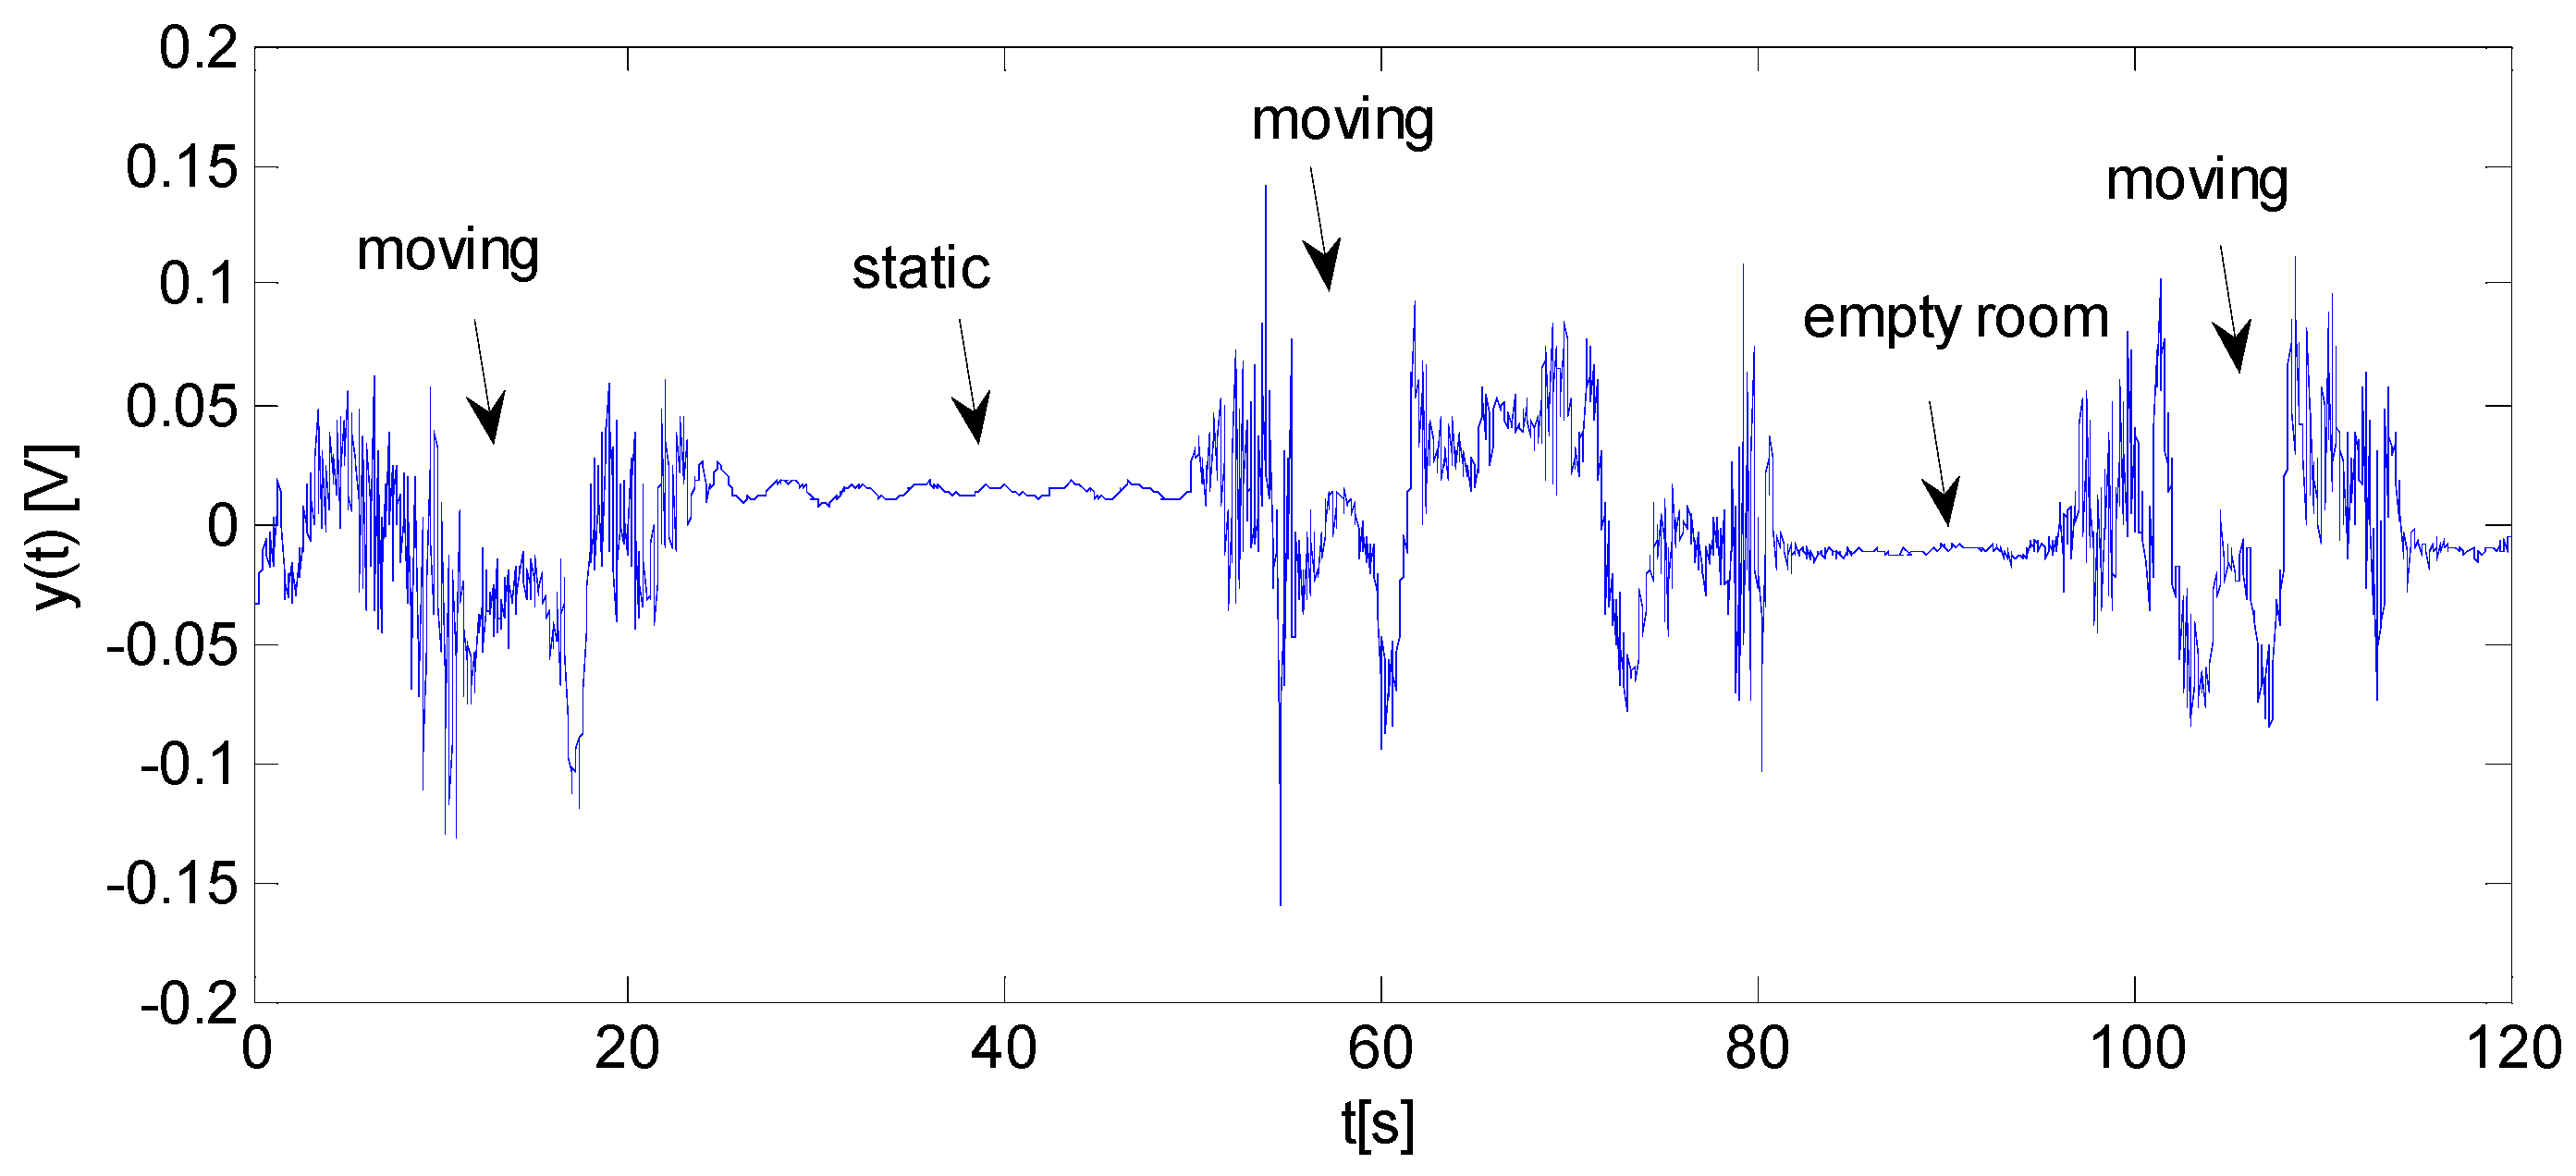
Figure 3 is a typical measurement result showing the temporal characteristics of the radar signal recorded when an adult male (1.8 m height) performs different activities inside the room. Specifically, signal fluctuations with higher intensity (around 0.1 V) arise in the time intervals when the subject is moving. On the other hand, when the subject is still between [25, 50] s, the signal exhibits smaller and periodic amplitude oscillations (around 0.01 V), which are produced by breathing activity. Of course, the magnitude of such oscillations is dependent on the distance among radar and target (3 m in this example), target cross-section, and target orientation. Finally, when the subject leaves the room in the interval [80, 95] s, the signal variability is very modest and essentially determined by the system noise level (around 1 mV).
The experimental data plotted in
Figure 3 suggest the possibility to detect humans and discriminate different situations (no human, static subjects, moving subjects) in through-wall scenarios.
3. Data Processing Approach and Experimental Results
An ad hoc algorithm is developed for human activity detection, which provides an automatic decision in real-time. We denote with the discrete-time version of the radar signal y(t), where is the total number of samples. Let us indicate with a windowed version of the time series , with being the number of samples inside the window. Such a window is progressively translated forwards of one sample up to the last sample in the data sequence. The algorithm consists in the next two steps:
(i) Computation of the standard deviation for each time window, i.e.,
where
is the average value of the sequence
over the sliding window
m;
(ii) Application of the following three hypotheses
testing decision rule
where
and
(
) are proper thresholds and
is a ternary output. When
, the algorithm decides that no human is located behind the wall (hypothesis
),
means that one or several static subjects are present (hypothesis
), and
indicates the presence of one or several moving subjects (hypothesis
). Note that the decision rule defined by Equation (5) requires fixing the thresholds
and
, which are here determined according to the following learning procedure.
Twelve training datasets are initially recorded over a time window of 120 s in the following conditions:
(i) Four datasets in the case of an empty room;
(ii) Four datasets with a static subject in the room. In order to account for data amplitude variability related to the target range and cross-section, two different subjects (A and B) located respectively at a stand-off distance of 2.2 m and 3.7 m away from the radar take part to the experiments;
(iii) Four datasets with a single moving subject. In this case, two acquisitions are performed with subjects A and B, separately.
Each record is partitioned into
contiguous intervals having duration
, and the standard deviation of the radar signal
, is evaluated for each data interval
. Afterwards, the threshold space
-
is discretized and the decision rule Equation (5) is applied in order to determine the optimal threshold values
and
maximizing the overall detection rate (
), i.e.,
where the
is the detection rate achieved under the hypothesis
,
.
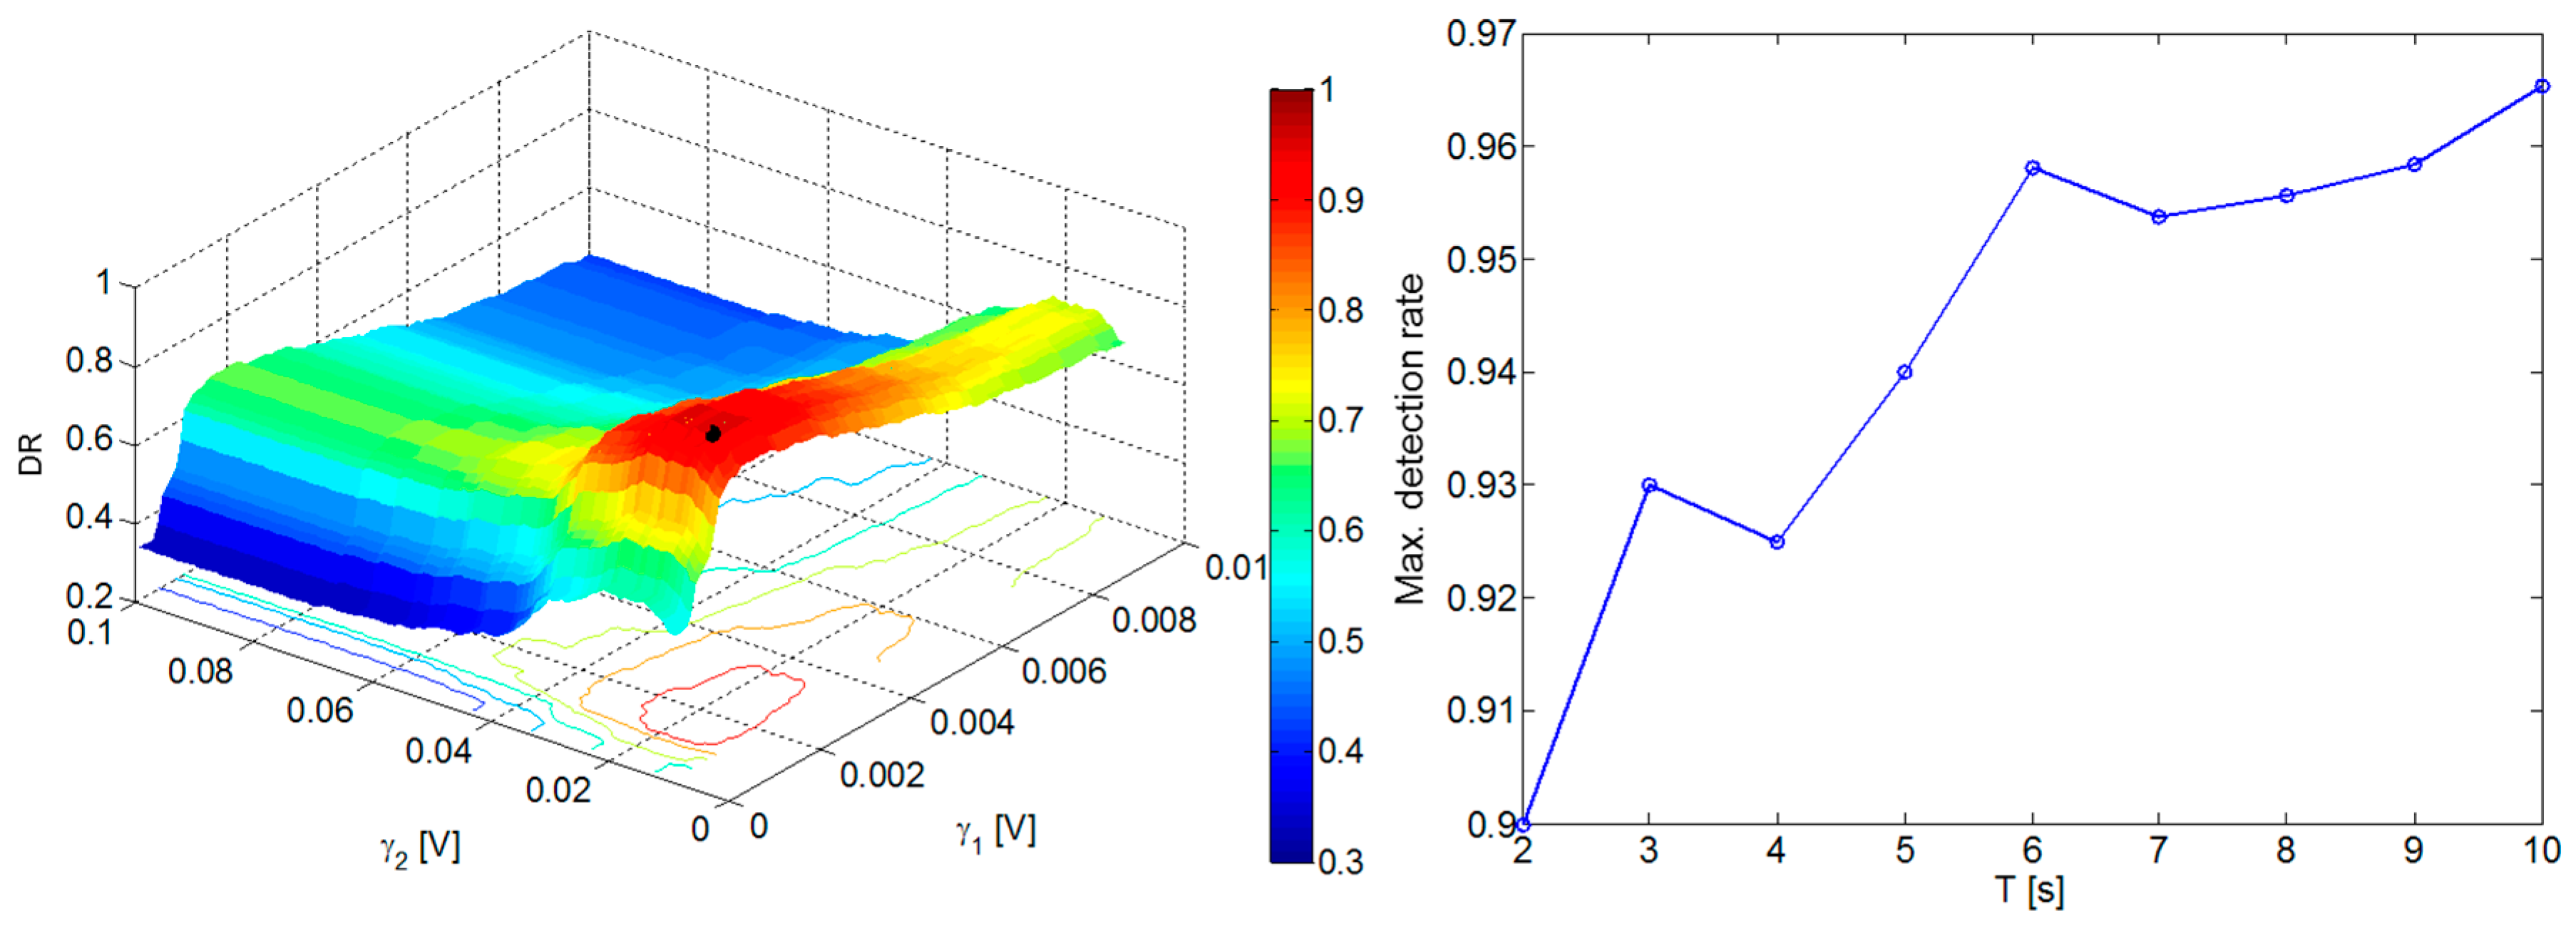
Figure 4 provides a 2D representation of the training detection rate versus thresholds
and
for data intervals having length
s. The obtained results have an intuitive physical justification. For low values of
(below 0.001 V), a poor
(less than 0.5) is attained regardless of
since several false alarms arise under the hypothesis
, i.e., when nobody is present in the room. On the other hand, for high
values (e.g., above 0.002 V), the
decreases because missing detections become significant under the hypothesis
(stationary targets). A similar phenomenon can be observed when considering the
behavior versus
. In this case, low threshold values (below 0.01 V) increase the number of false alarms under hypothesis
, while high
values (e.g., above 0.02 V) increase the number of missing detections under hypothesis
(moving targets). However, it can be seen that there exists two optimal thresholds
and
that yield the maximum
. These thresholds values are
V and
V, which provide a detection rate of 0.9542 (see black circle in left plot of
Figure 4).
It is natural to wonder about the effect of the window length
on the achievable
. In answer to this question, the threshold learning procedure is repeated for different values of
in the interval [2, 10] s with a step of 1 s. The maximum learning detection rate evaluated as a function of
is depicted in the right plot of
Figure 4. As can be seen, small window lengths yield a lower detection rate with respect to the case of windows with longer duration. Of course, it must be also taken into account that a longer window implies a greater delay to get situational awareness about the scene. As this aspect may be crucial for real-time applications, a trade-off between detection accuracy and system promptness has to be established in practice. Based on the data reported in
Figure 4,
s is selected as an optimal compromise for this study.
It is worthwhile to remark that the optimal thresholds and are implicitly dependent on the scenario. This implies that a new calibration has to be performed if the system is deployed in a new environment.
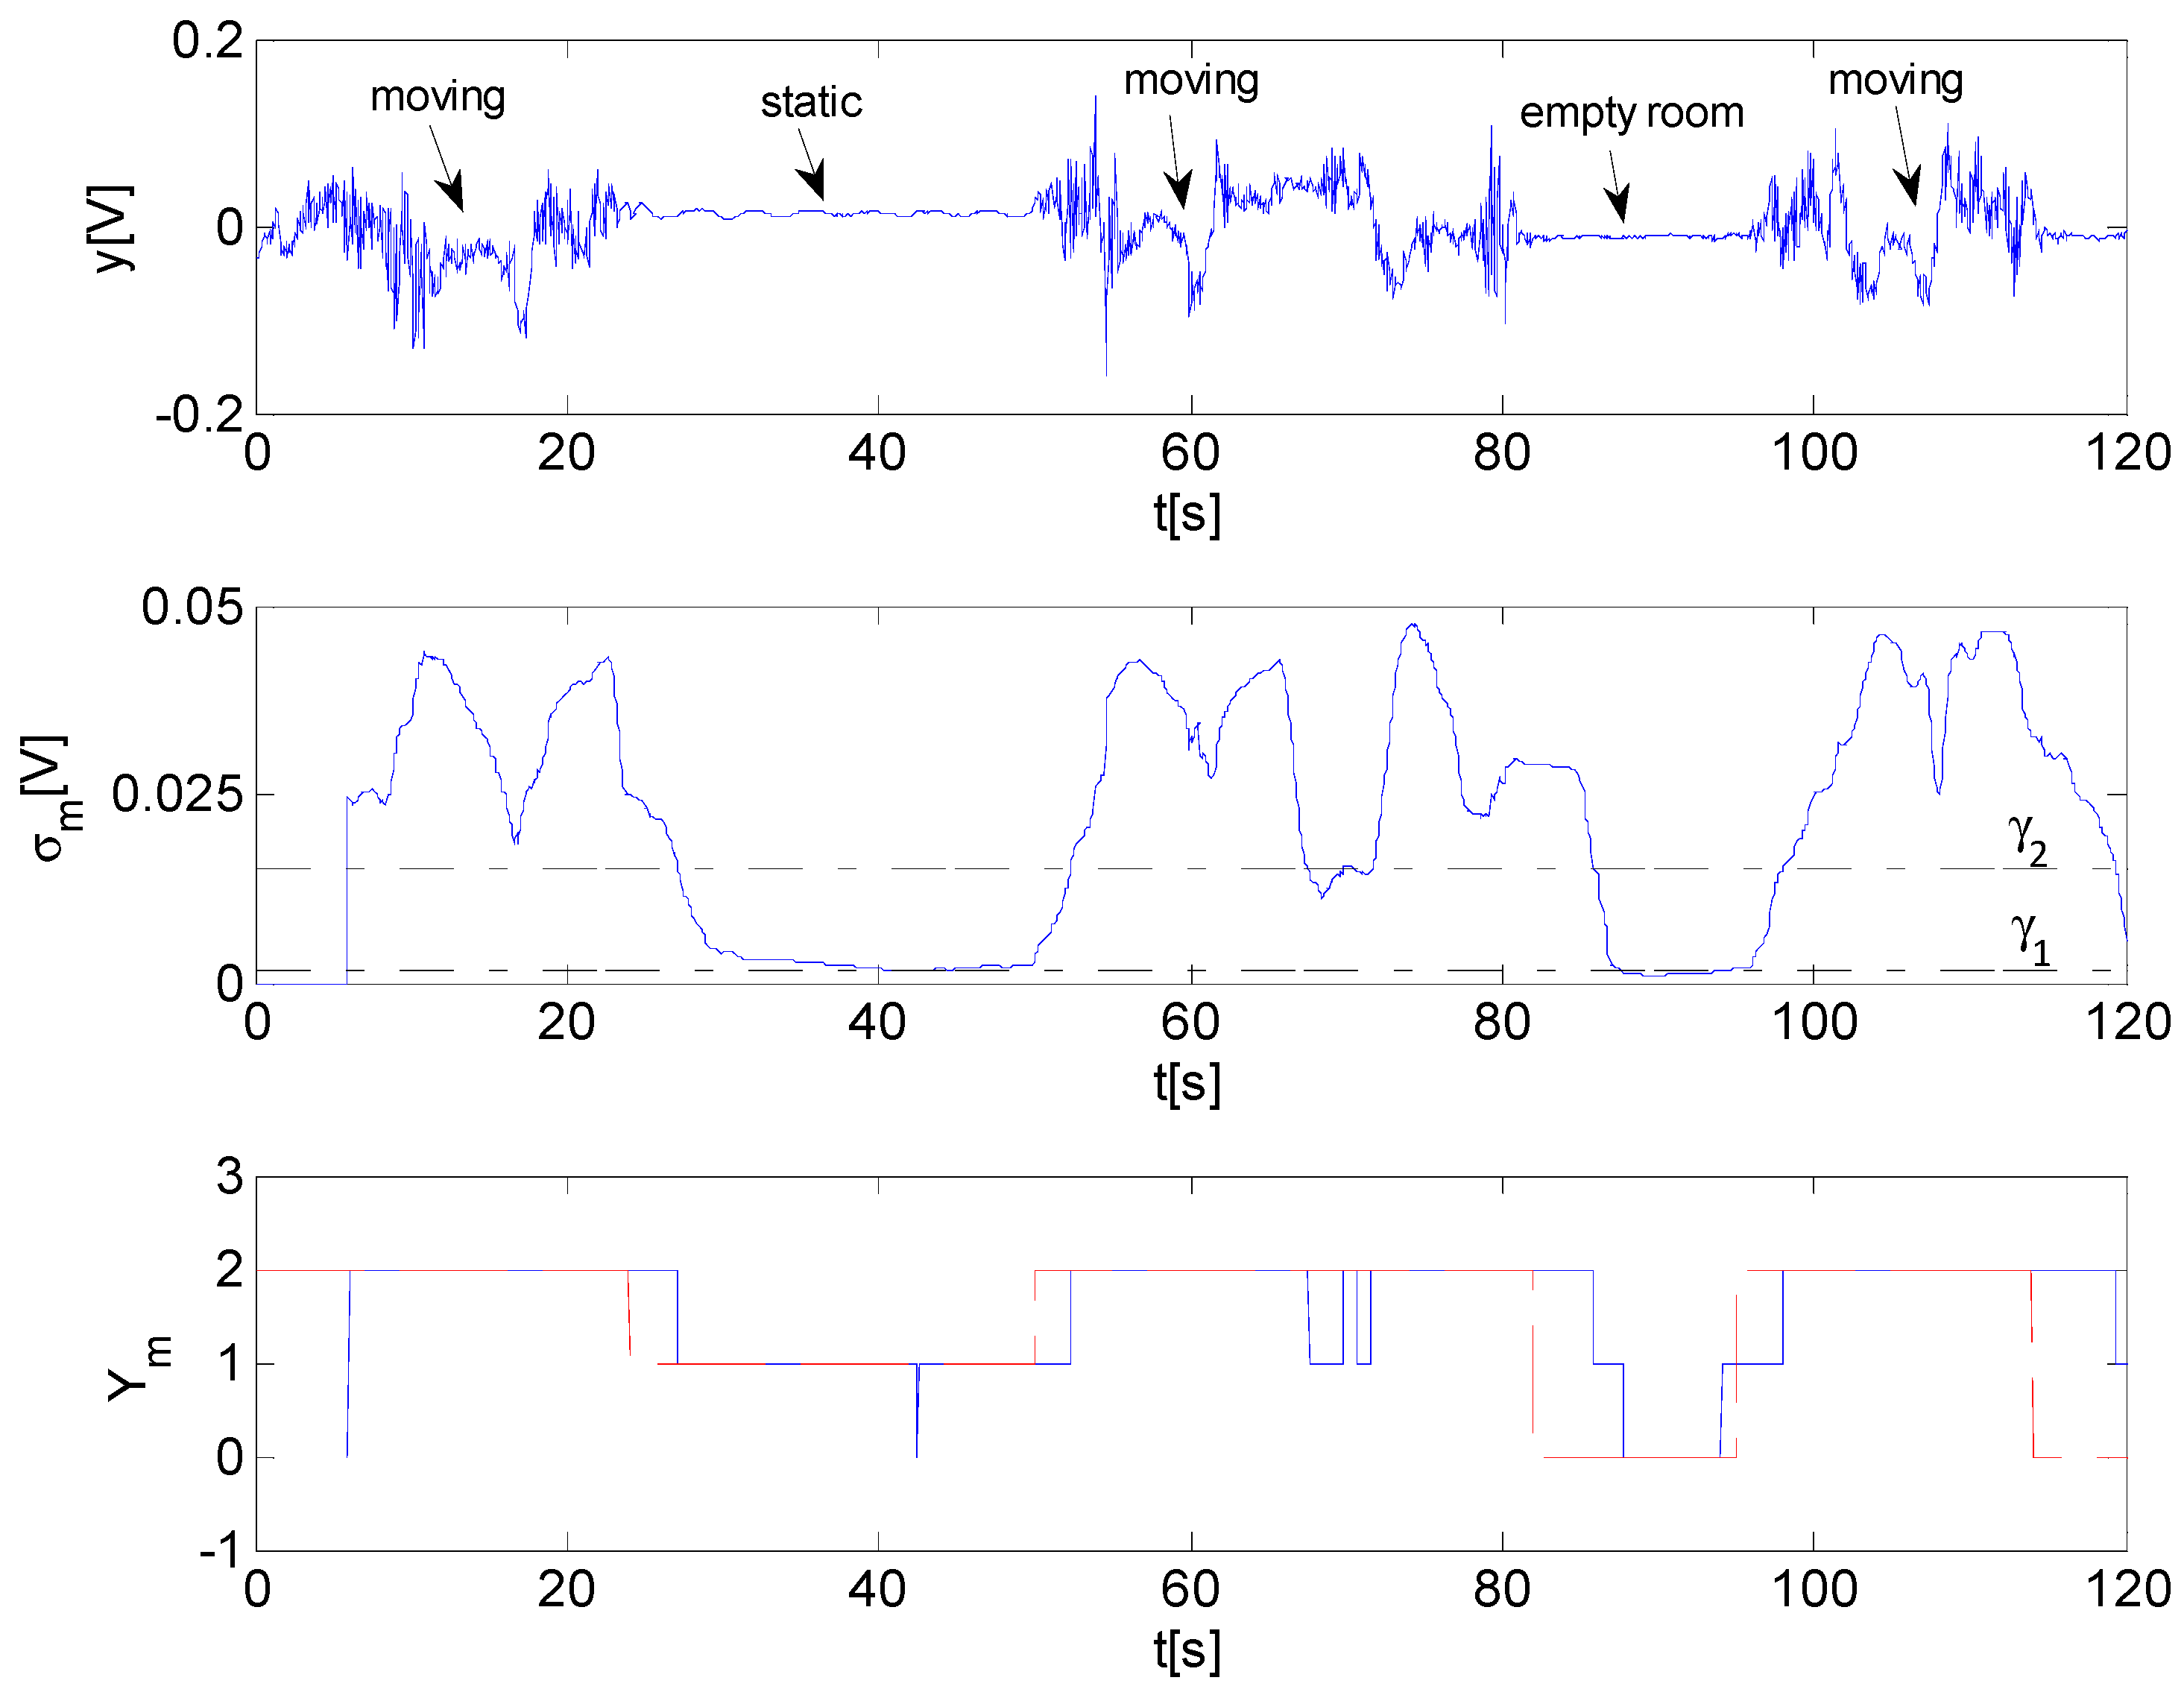
Experimental tests are performed in order to appraise the system performance. In the following, we describe the results of some representative test cases. The first one is concerned with a through-wall scene comprising a single human, which was previously described in
Figure 3. The corresponding data processing results are illustrated in
Figure 5. Specifically, the middle panel shows the behavior of the standard deviation versus time for a window length
s. The threshold values
and
are represented by two black dashed lines. As expected, the standard deviation assumes high values in time intervals where the subjects walks, while it is lower when the subject is still and even smaller when nobody is present in the room. The output of the detection algorithm is displayed in the bottom plot of
Figure 5 (blue solid line) and compared to the ground truth (red dashed line). The ground truth is determined by monitoring the room with a video camera simultaneously to radar operation. Interestingly, the output of the detection algorithm very reliably reproduces the ground truth save for an expected time delay occurring in correspondence of the transition between two different situations. The entity of such a delay depends on the window length and it is experimentally found to be about half window length, i.e.,
s. It is also remarkable to point out few detection errors made in the time interval [60, 80] s where the subject is declared to be static. This phenomenon is caused by the low signal amplitude because the subject is quite far from the radar at a range of about 8 m and the line of sight between target and radar is further obstructed by a pillar (see inset in right photo of
Figure 2). Therefore, an ambiguity unavoidably arises because such lower signal levels are comparable to those observed in the presence of a static subject. In order to evaluate the system performance in a more objective and quantitative manner, the detection rate defined in Equation (6) is evaluated on the basis of the algorithm output after neglecting the bias effect related to the time delay. The estimated value is found equal to
= 0.98 thus fully confirming the system effectiveness.
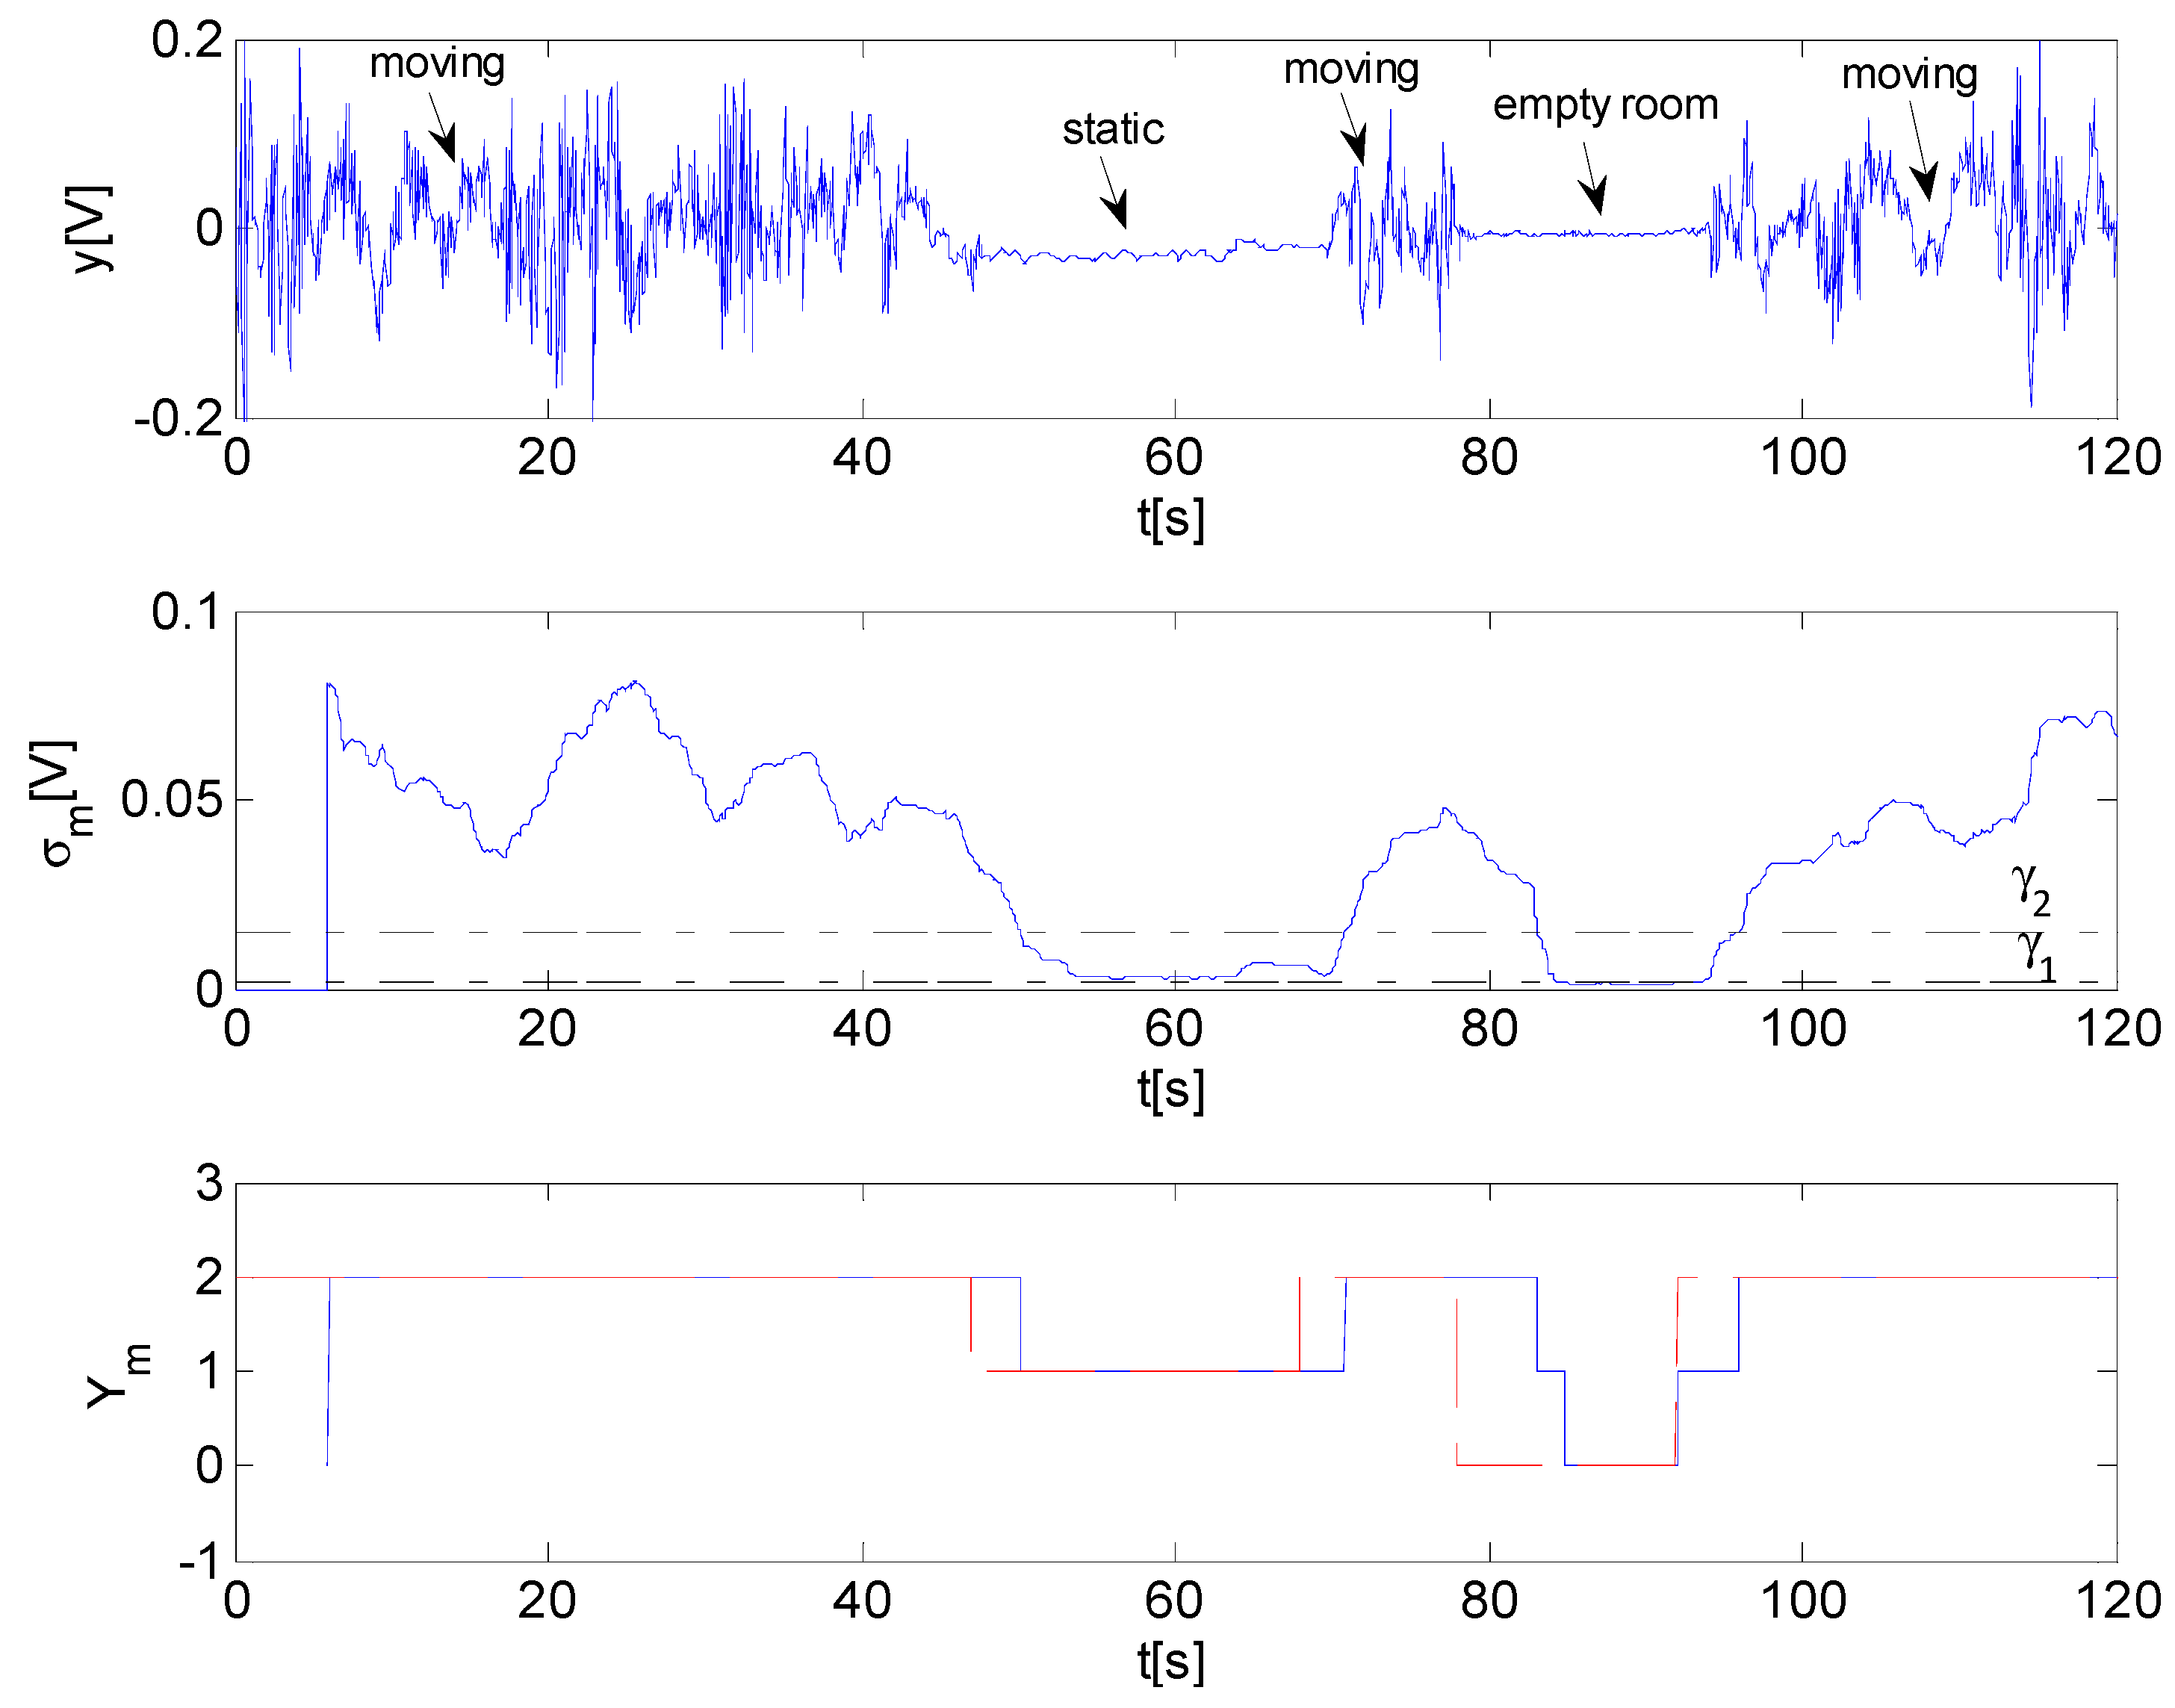
Figure 6 displays the radar signal (top plot) and data processing results (middle and bottom plots) when the same scenario comprises two human subjects performing different actions (see black arrows). It turns out that the output of the detection algorithm reliably reproduces the ground truth also in this case with a
equal to one.
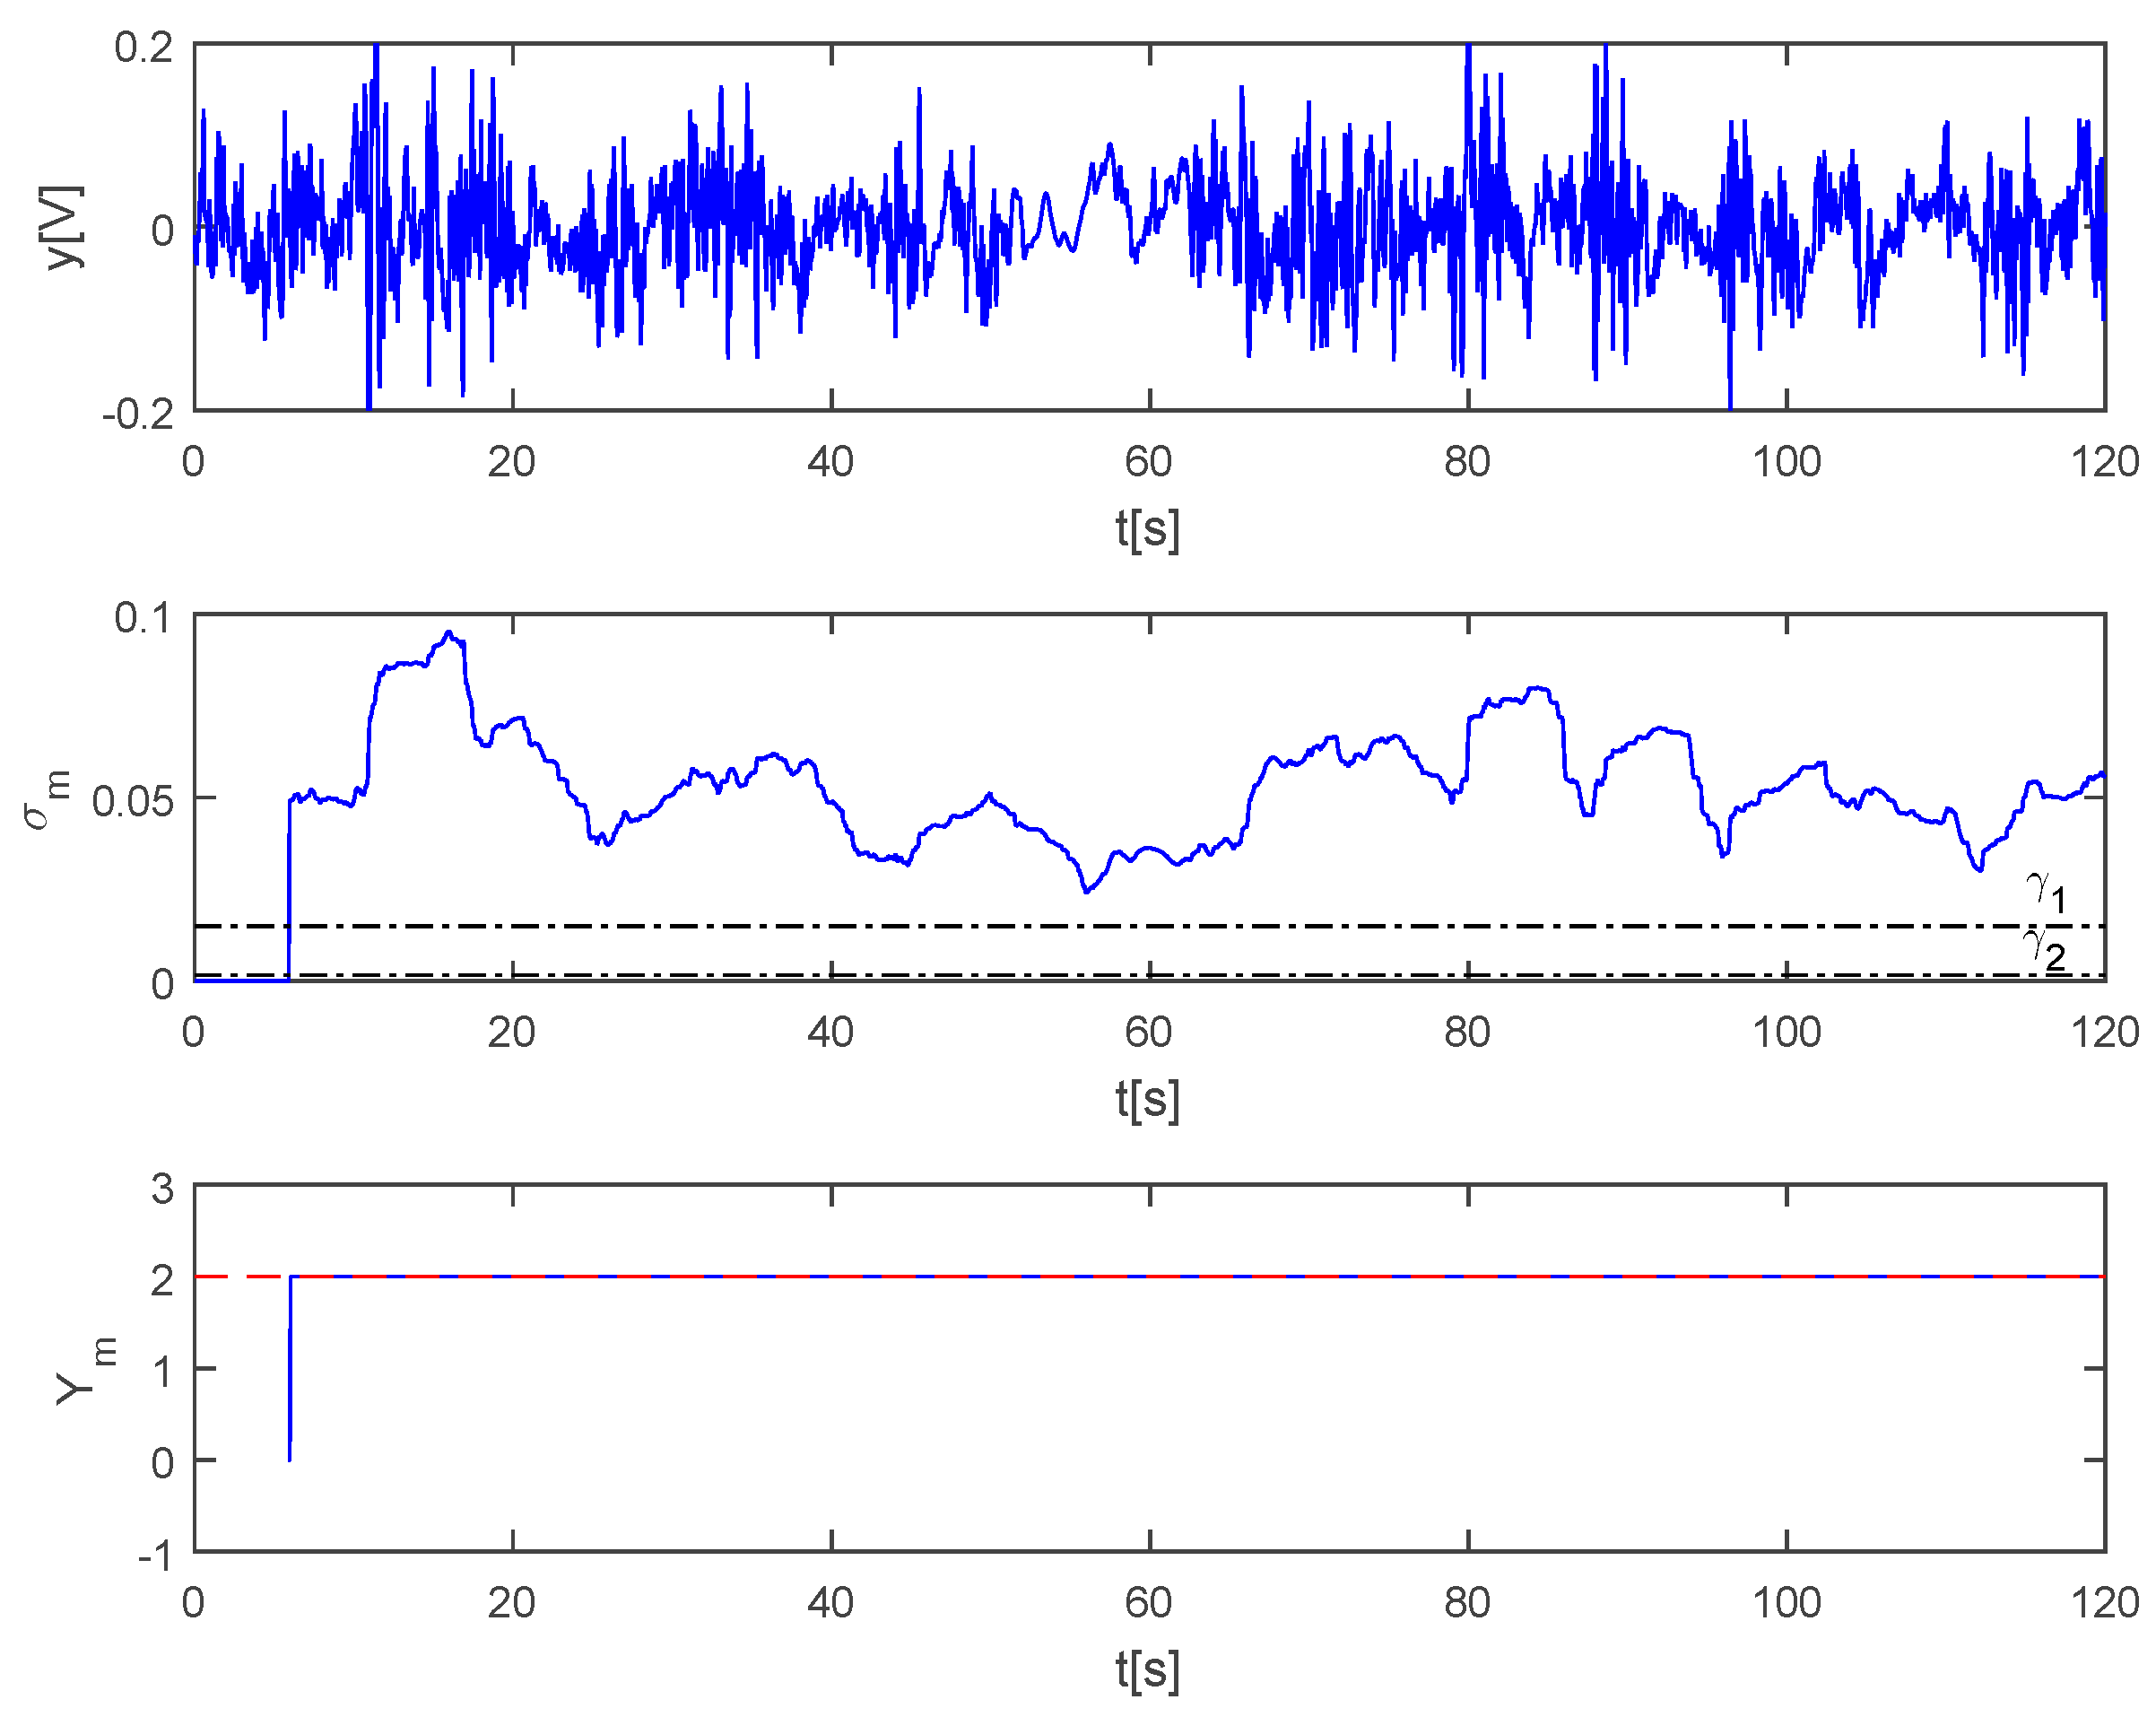
The results of a further experimental test pertaining to three humans moving persistently in the room during the whole acquisition interval are reported in
Figure 7. It can be seen that the system turns out to be very reliable also in this case being characterized by a
equal to one.
A video showing the system operation and its reliability in the two-human scenario (
Figure 6) is available online as supplementary material.


