Article

Mapping Dynamics of Inundation Patterns of Two Largest River-Connected Lakes in China: A Comparative Study

1
Key Laboratory of Watershed Geographic Sciences, Nanjing Institute of Geography and Limnology, Chinese Academy of Sciences, Nanjing 21008, China
2
State Key Laboratory of Lake Science and Environment, Nanjing Institute of Geography and Limnology, Chinese Academy of Sciences, Nanjing 21008, China
*
Author to whom correspondence should be addressed.
Remote Sens. 2016, 8(7), 560; https://doi.org/10.3390/rs8070560
Submission received: 9 March 2016 / Revised: 16 June 2016 / Accepted: 28 June 2016 / Published: 30 June 2016
(This article belongs to the Special Issue What can Remote Sensing Do for the Conservation of Wetlands?)

Abstract

:
Poyang Lake and Dongting Lake are the two largest freshwater lakes in China. The lakes are located approximately 300 km apart on the middle reaches of the Yangtze River and are differently connected through their respective tributary systems, which will lead to different river–lake water exchanges and discharges. Thus, differences in their morphological and hydrological conditions should induce individual lake spatio-temporal inundation patterns. Quantitative comparative analyses of the dynamic inundation patterns of Poyang Lake and Dongting Lake are of great importance to basic biogeochemical and ecological studies. In this study, using Moderate Resolution Imaging Spectoradiometer (MODIS) satellite imagery and a geographic information system (GIS) analysis method, we systematically compared the spatio-temporal inundation patterns of the two river-connected lakes by analyses of the lake area, the inundation frequencies (IFs) and the water variation rates (WVRs). The results indicate that there was a significant declining trend in the lakes’ inundation area from 2000 to 2011. The inundation areas of Poyang Lake and Dongting Lake, decreased by 54.74% and 40.46%, with an average annual decrease rate of 109.74 km2/y and 52.37 km2/y, respectively. The alluvial regions near Dongting Lake expressed much lower inundation frequencies, averaged over multiple years, than the alluvial regions near Poyang Lake. There was an obvious spatial gradient in the distribution of water inundation for Poyang Lake; the monthly mean IF slowly increased from north to south during the low-water, rising, and high-water periods. However, Dongting Lake expressed a clear zonal distribution of water inundation, especially in the low-water and rising periods. In addition, the WVRs of the two lakes differently changed in space throughout the year, but were in good agreement with the changing processes of water expansion or shrinkage. The different inundation frequencies and water variation rates in the two lakes may possibly depend on many intrinsic factors, including surface discharges from their respective tributaries, river–lake water exchanges and the lakes’ topographical characteristics. These findings are valuable for policymakers because they may lead to different decisions and policies for these two complex river–lake systems.

Graphical Abstract

1. Introduction

Freshwater lakes are valuable natural resources for human beings and have regional ecological and environmental functions, such as climate regulation, flood and drought control, and wildlife habitats [1,2]. In recent years, many freshwater lakes throughout the world have been undergoing dramatic changes in their water inundation and morphology [3,4,5]. These changes greatly affect the spatial availability of freshwater resources, which can disturb terrestrial and aquatic environments, thereby altering wildlife ecosystems and posing threats to regional sustainable development [6,7]. Therefore, understanding spatio-temporal inundation patterns and processes are critical for lake ecological conservation, flood/drought prevention and water resource management and planning [8,9,10].
Located on the south bank of the middle Yangtze River, Poyang Lake and Dongting Lake are the two largest freshwater lakes in China [11] (see Figure 1). As the major water bodies of global priority eco-regions [12], Poyang and Dongting Lakes play an important role in maintaining the water resources of the Yangtze River and healthy aquatic ecosystems in the region [13]. During recent decades, however, the water inundations of these two lakes have undergone remarkable spatio-temporal changes [14,15,16] that have resulted in significant hydrological, ecological and economic consequences [7,17,18]. Consequently, water inundation changes in the two lakes have received considerable scientific attention [14,19,20,21,22,23].
In fact, changes in lake inundation are the result of many factors, including variations in climate conditions [5], population change [24], economic development [25], lake morphology and inlet/outlet flows [23]. As for Poyang Lake and Dongting Lake, there are some similar, as well as different, intrinsic factors between them. For example, the lakes are co-existed at 30 degrees north latitude and share the same subtropical humid monsoon climate. As another example, the morphological and limnological conditions of Poyang Lake and Dongting Lake differ [13]. The lakes are differently connected through Yangtze River and through their respective tributary systems, which will lead to different river–lake water exchanges and discharges [16]. For this reason, the spatio-temporal inundation patterns of the two lakes should have individual characteristics. Nevertheless, to our knowledge, previous research has mainly focused on the inundation changes within a single lake. Little is known about the similarities and differences in the dynamic inundation changes in these two large lakes. Are the changing trends in lake area and inundation frequency equivalent in Poyang and Dongting? Do the water expansion or shrinkage variation rates differ? Where and why do the differences in the inundation patterns occur? The answers to these questions are of great interest and importance for hydro-ecologists and policymakers, as it may help to provide guidance on how to make corresponding programs and policies of lake ecological conservation, flood/drought prevention and land use planning. Therefore, a systematic comparative analysis of the dynamic inundation patterns of China’s two largest river-connected lakes remains a challenge.
With the objective of filling the above-mentioned gaps, the main goal of this study was to systematically compare the spatio-temporal inundation patterns and processes of the two large river-connected lakes using multi-temporal satellite images and a GIS analysis method. Following this introduction, the study area and dataset are described in Section 2, and the detailed methodology and procedures are presented in Section 3. The results of the comparative analysis of the inundation patterns of the two lakes are addressed in Section 4, and the possible causes for the differences are discussed in Section 5. Our conclusions are given in Section 6. Our findings will be helpful for hydrological, biogeochemical, and ecological studies of these two complex river–lake systems and will be useful for local governments tasked with corresponding hydrological planning and proposals.

2. Study Area and Data Used
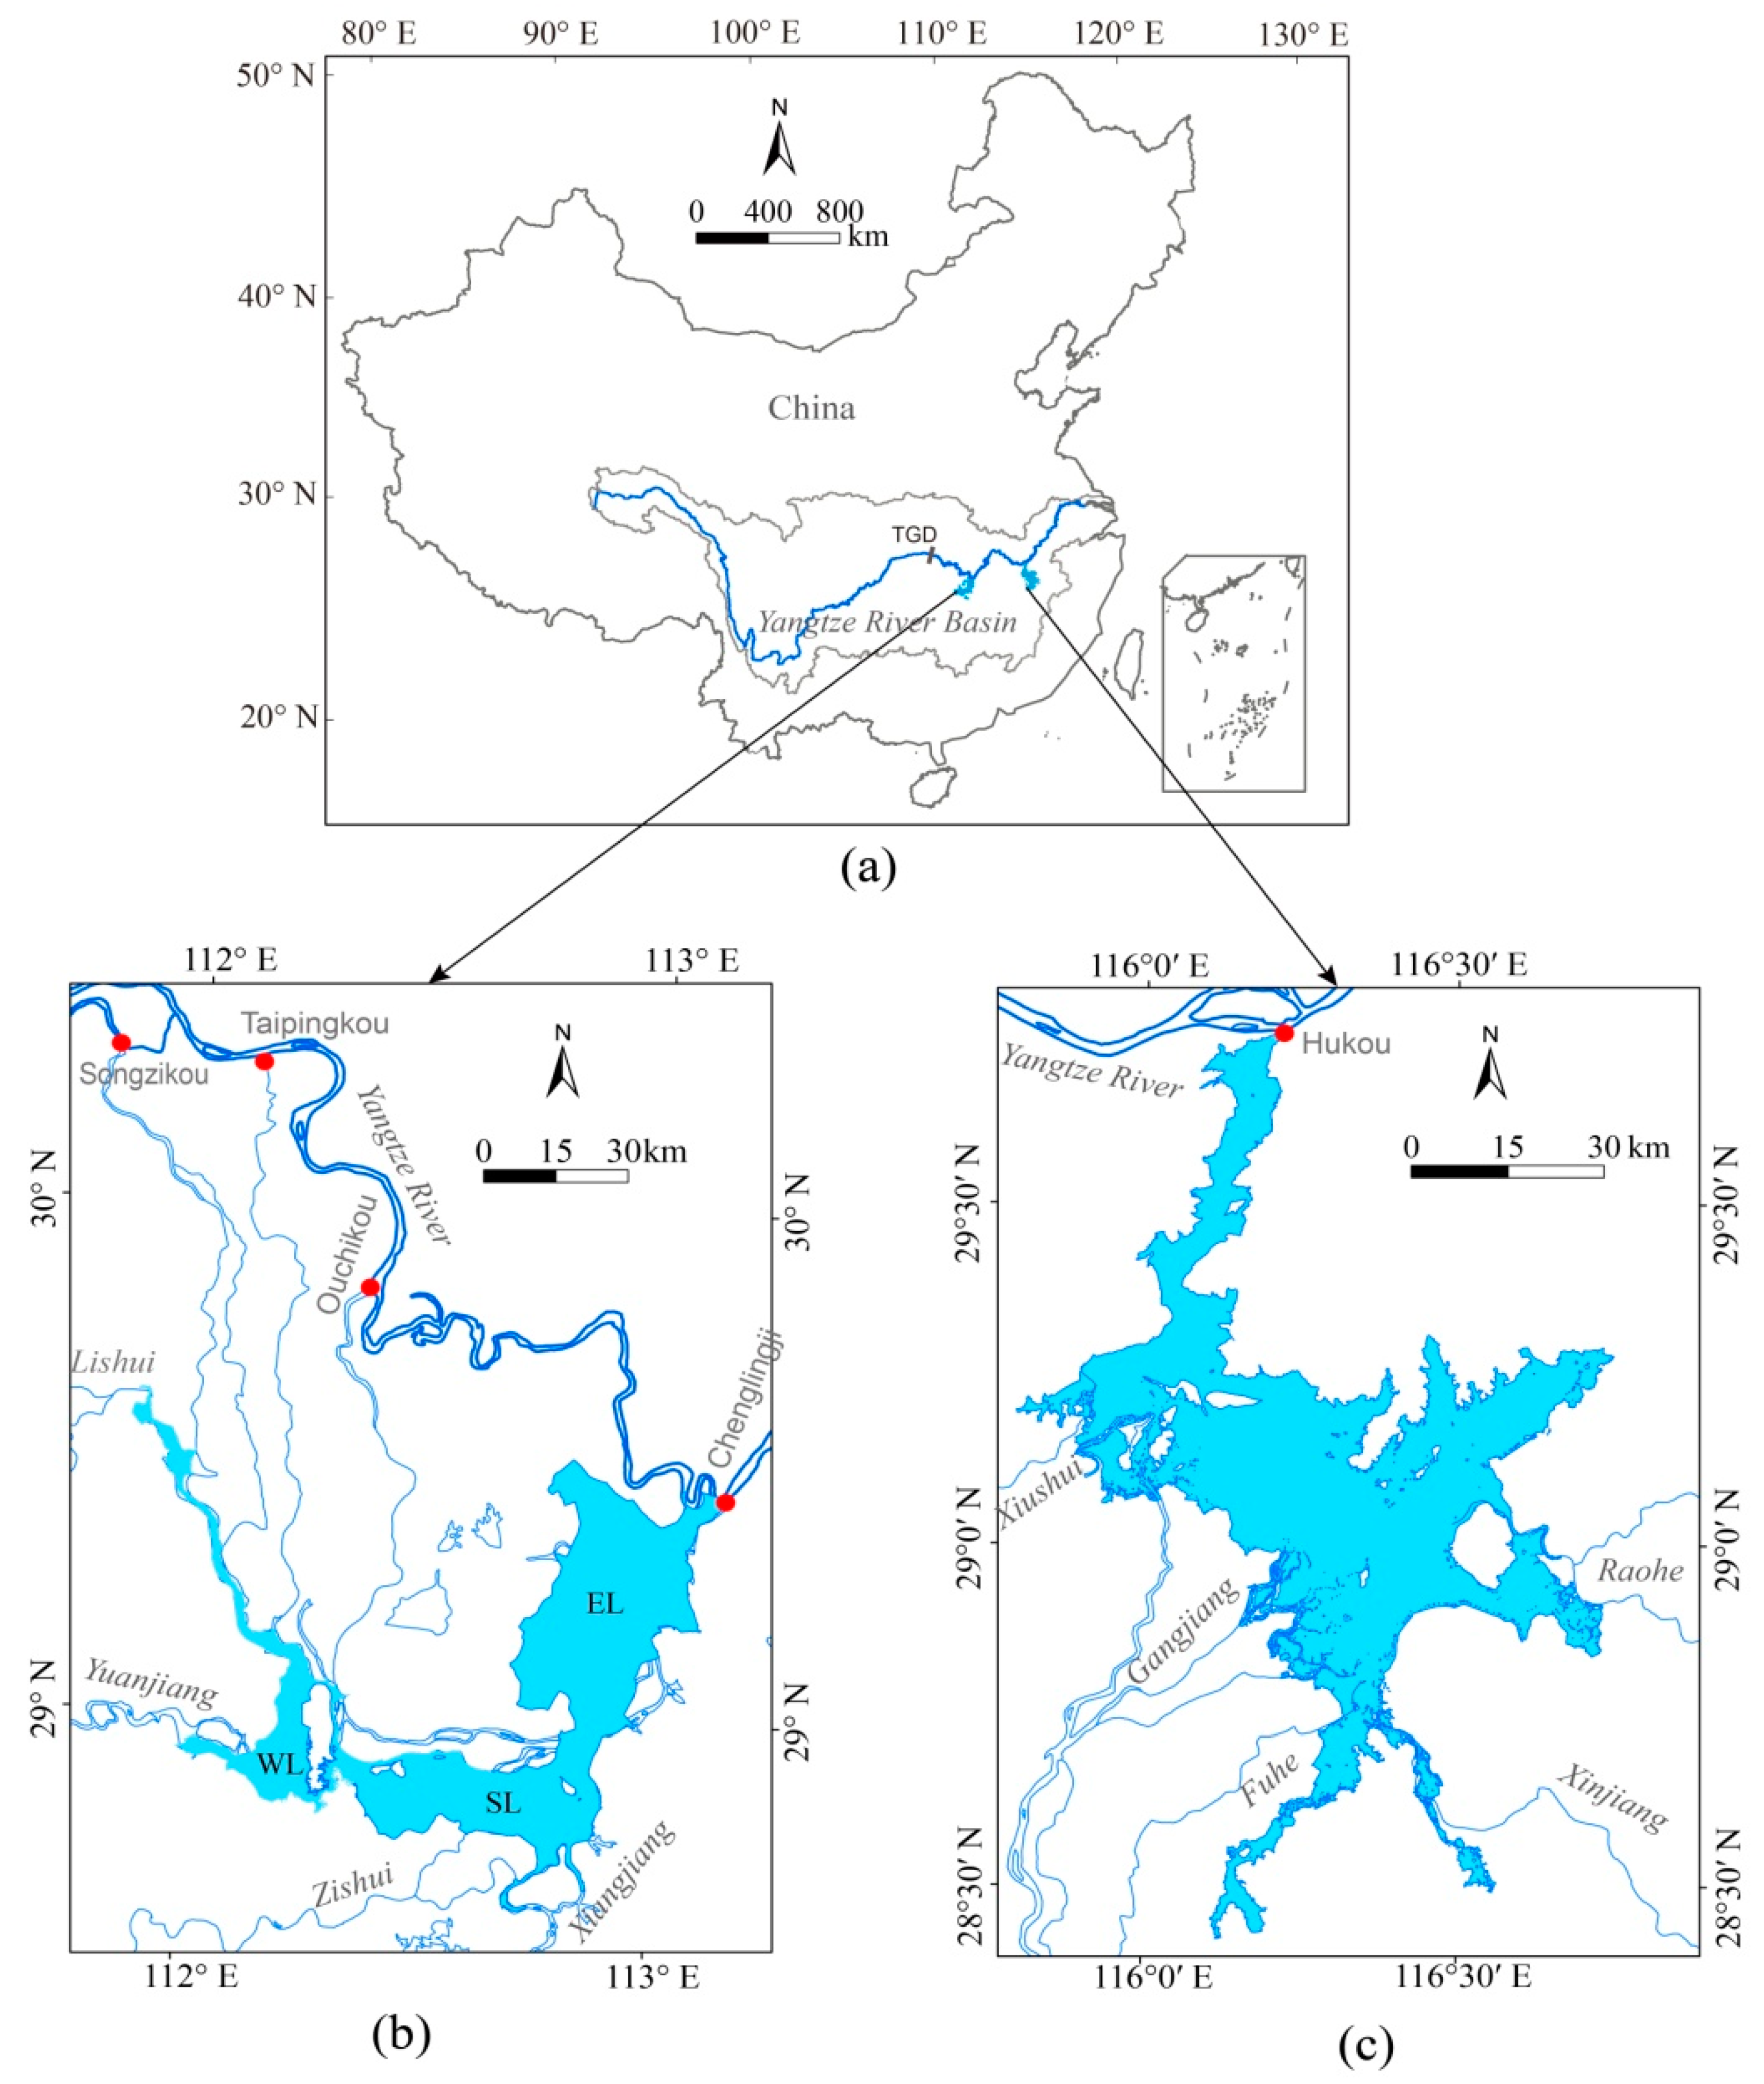
2.1. Study Area

The locations of Poyang Lake and Dongting Lake are depicted in Figure 1. They are located approximately 300 km apart on the alluvial plain of the middle reaches of the Yangtze River. The two lakes have complex water regimes because of their respective water flows from upstream sources and river–lake water exchanges with the Yangtze River [26]. Their water inundation patterns not only depend on inflows from the rivers in the catchments but also the Yangtze River flow [13]. The particular hydrological regime creates a rich biodiversity in both Poyang Lake and Dongting Lake. They are recognized as the most important wetlands in the world by the Ramsar Convention on Wetlands (http://www.ramsar.org/sites/default/files/documents/library/outreach_actionplan_china.pdf).
Generally, both Poyang Lake and Dongting Lake have strongly seasonal inundation areas because of seasonal variations in precipitation and water exchange with the Yangtze River.
(1)
Poyang Lake:
Poyang Lake (28°22′–29°45′N, 115°47′–116°45′E), which is located in the northern part of Jiangxi Province, is the largest freshwater lake in China. It is 173 km long from north to south, and has a lakeshore of 1200 km and an average depth of 8.4 m [27]. The lake is geographically divided into two parts by Songmen Mountain; the southern part is wide and shallow, whereas the northern part is narrow and deep [15]. As shown in Figure 1c, Poyang Lake receives water flows primarily from five rivers: Xiushui, Ganjiang, Fuhe, Xinjiang and Raohe and discharges into the Yangtze River via the Hukou. Therefore, the seasonality of the precipitation in the five catchments induces significant variations in lake inundation throughout the year [28]. The lake expands to a large water surface area (>3000 km2) in the high-water season (June to August) but shrinks to a small area (<1000 km2) during the low-water season (December to February) [23,26].
(2)
Dongting Lake:
Dongting Lake (28°30′–30°20′N, 111°40′–113°40′E) is the second largest lake in China and lies in the northeastern part of Hunan Province. As shown in Figure 1b, water and sediment from three outlets (Songzikou, Ouchikou and Taipinkou) on the south bank of the Yangtze River and four rivers (Xiangjiang, Zishui, Yuanjiang and Lishui) in Hunan Province enter Dongting Lake, which flows into Yangtze River at Chenglingji after the adjustment of the lake [29]. This complex river–lake relation develops a more complicated water regime than that of Poyang Lake [13,30]. Under subtropical monsoon effects, Doingting Lake also presents clear seasonal changes in its water inundation. The lake’s surface area varies from 500 km2 to 2500 km2 in the low-water and high-water seasons, respectively. The water inundation is usually segregated into three sections: East Lake (EL), South Lake (SL) and West Lake (WL) (see Figure 1) during the low-water season, but the sections are connected to one another in the high-water season [29]. In recent decades, the serious reduction in the size of Dongting Lake has led to a deterioration of its flood diversion and storage capacities, and flood disasters have become more frequent.

2.2. Data Acquisition and Pre-Processing

Moderate Resolution Imaging Spectrometer (MODIS) Terra Level-1B data (MOD02_QKM and MOD02_HKM) for 2000–2011 were first acquired from the NASA Goddard Space Flight Center (GSFC) (https://ladsweb.nascom.nasa.gov/data/search.html). MODIS is a global sensor with high frequency repeat coverage and has a significant potential for mapping the extent of wetland and their dynamics at moderate spatial resolutions. To delineate the extents of the water inundations, 466 and 385 cloud-free images covering Poyang Lake and Dongting Lake, respectively, were used. There was at least one scene for each month (except for October 2001, April 2002, January 2003 and September 2011 for Dongting Lake). The MOD02_QKM and MOD02_HKM datasets contained Level-1B calibrated and geo-located radiances for the visible and near infrared (NIR) bands. DN (digital number) values in the green band (0.54–0.57 μm) at a 500 m resolution were extracted from MOD02_HK, and DN values in the NIR band (0.84–0.88 μm) at a 250 m resolution were extracted from MOD02_QKM. The MODIS green band was resampled to 250 m resolution to match the resolution of the MODIS NIR band. All of the acquired MODIS images were projected into Universal Transverse Mercator (UTM) projection with a World Geodetic System (WGS-84) datum.
In addition, the second data type was comprised of rainfall, runoff and bottom topography data for the Poyang and Dongting Lake drainage basins between 2000 and 2011, which were provided by the Jiangxi/Hunan Provincial Hydrological Bureau of China. Rainfall and runoff data were collected daily from hydrologic stations on the two lakes. These data were used to understand the spatial distributions and changing processes of the lake inundation patterns during the different water regime periods.

3. Methodology

In this study, the daily MODIS data were used to map and compare the spatial and temporal dynamics of the surface inundation patterns of Poyang and Dongting Lakes. The methodology was comprised of three components. First, the inundation extent was delineated using the normalized difference water index (NDWI). NDWI is defined as the difference of the reflectance observed in the green band and the near infrared (NIR) band divided by the sum of the two reflectance values, and can differentiate water surfaces from most terrestrial features [31]. In practice, both the surface reflectance and at-sensor radiance can be used to calculate NDWI. Our previous study showed that the use of either surface reflectance or radiance could achieve equivalent results in water delineation [32]. Likewise, void values are common in surface reflectance products, at-sensor radiance are often preferable for water surface delineation [32]. Therefore, we utilize radiance rather than surface reflectance in this study. The MODIS radiance values were first transformed into NDWI. Then, the water inundation extent was delineated using a threshold segmentation algorithm [32]. An optimal threshold value between water surface and non-water features was determined through analyzing the frequency distribution of grey levels in the histogram of NDWI. Second, we used a GIS analysis method to illustrate the inundation frequencies of the two lakes. Inundation frequency (IF) is calculated using the number of inundation divided by the number of derived images in each grid cell and describes the probability of water submerge; Third, to evaluate the regional differences in the intensity of the water surface variation, an indicator called the water variation rate (WVR) was also used in this study. The IF and WVR methods are defined as follows:
P ( m ) = 1 N m t = 1 N m w m , t × 100
P ( y ) = 1 12 m = 1 12 P ( m ) × 100
W V R = U A n + i U A i n T A n + i × 100
where P(m) and P(y) are the monthly and annual inundation frequencies, respectively; m is the month of the year; Nm is the number of days inundated in month m; and wm,t denotes whether a pixel is inundated, with unity indicating inundation and zero indicating no inundating. UAi and UAn+i are the inundation areas at times i and n+i, and TAn+i denotes the total land area at time n+i (Figure 2). To derive the WVR, the study area was first divided into geographical gridding units with optimal size for the landscape. In each grid, the WVR was calculated month by month using Equation (3). Then, cluster analysis was performed on the grid-based monthly WVR values using a Nearest-neighbor interpolation (NNI) algorithm, which can evaluate the spatial dynamic speed of inundation changing in different regions of the study area. Additional details of these methods can be found in our previous publications [23,33].

4. Results

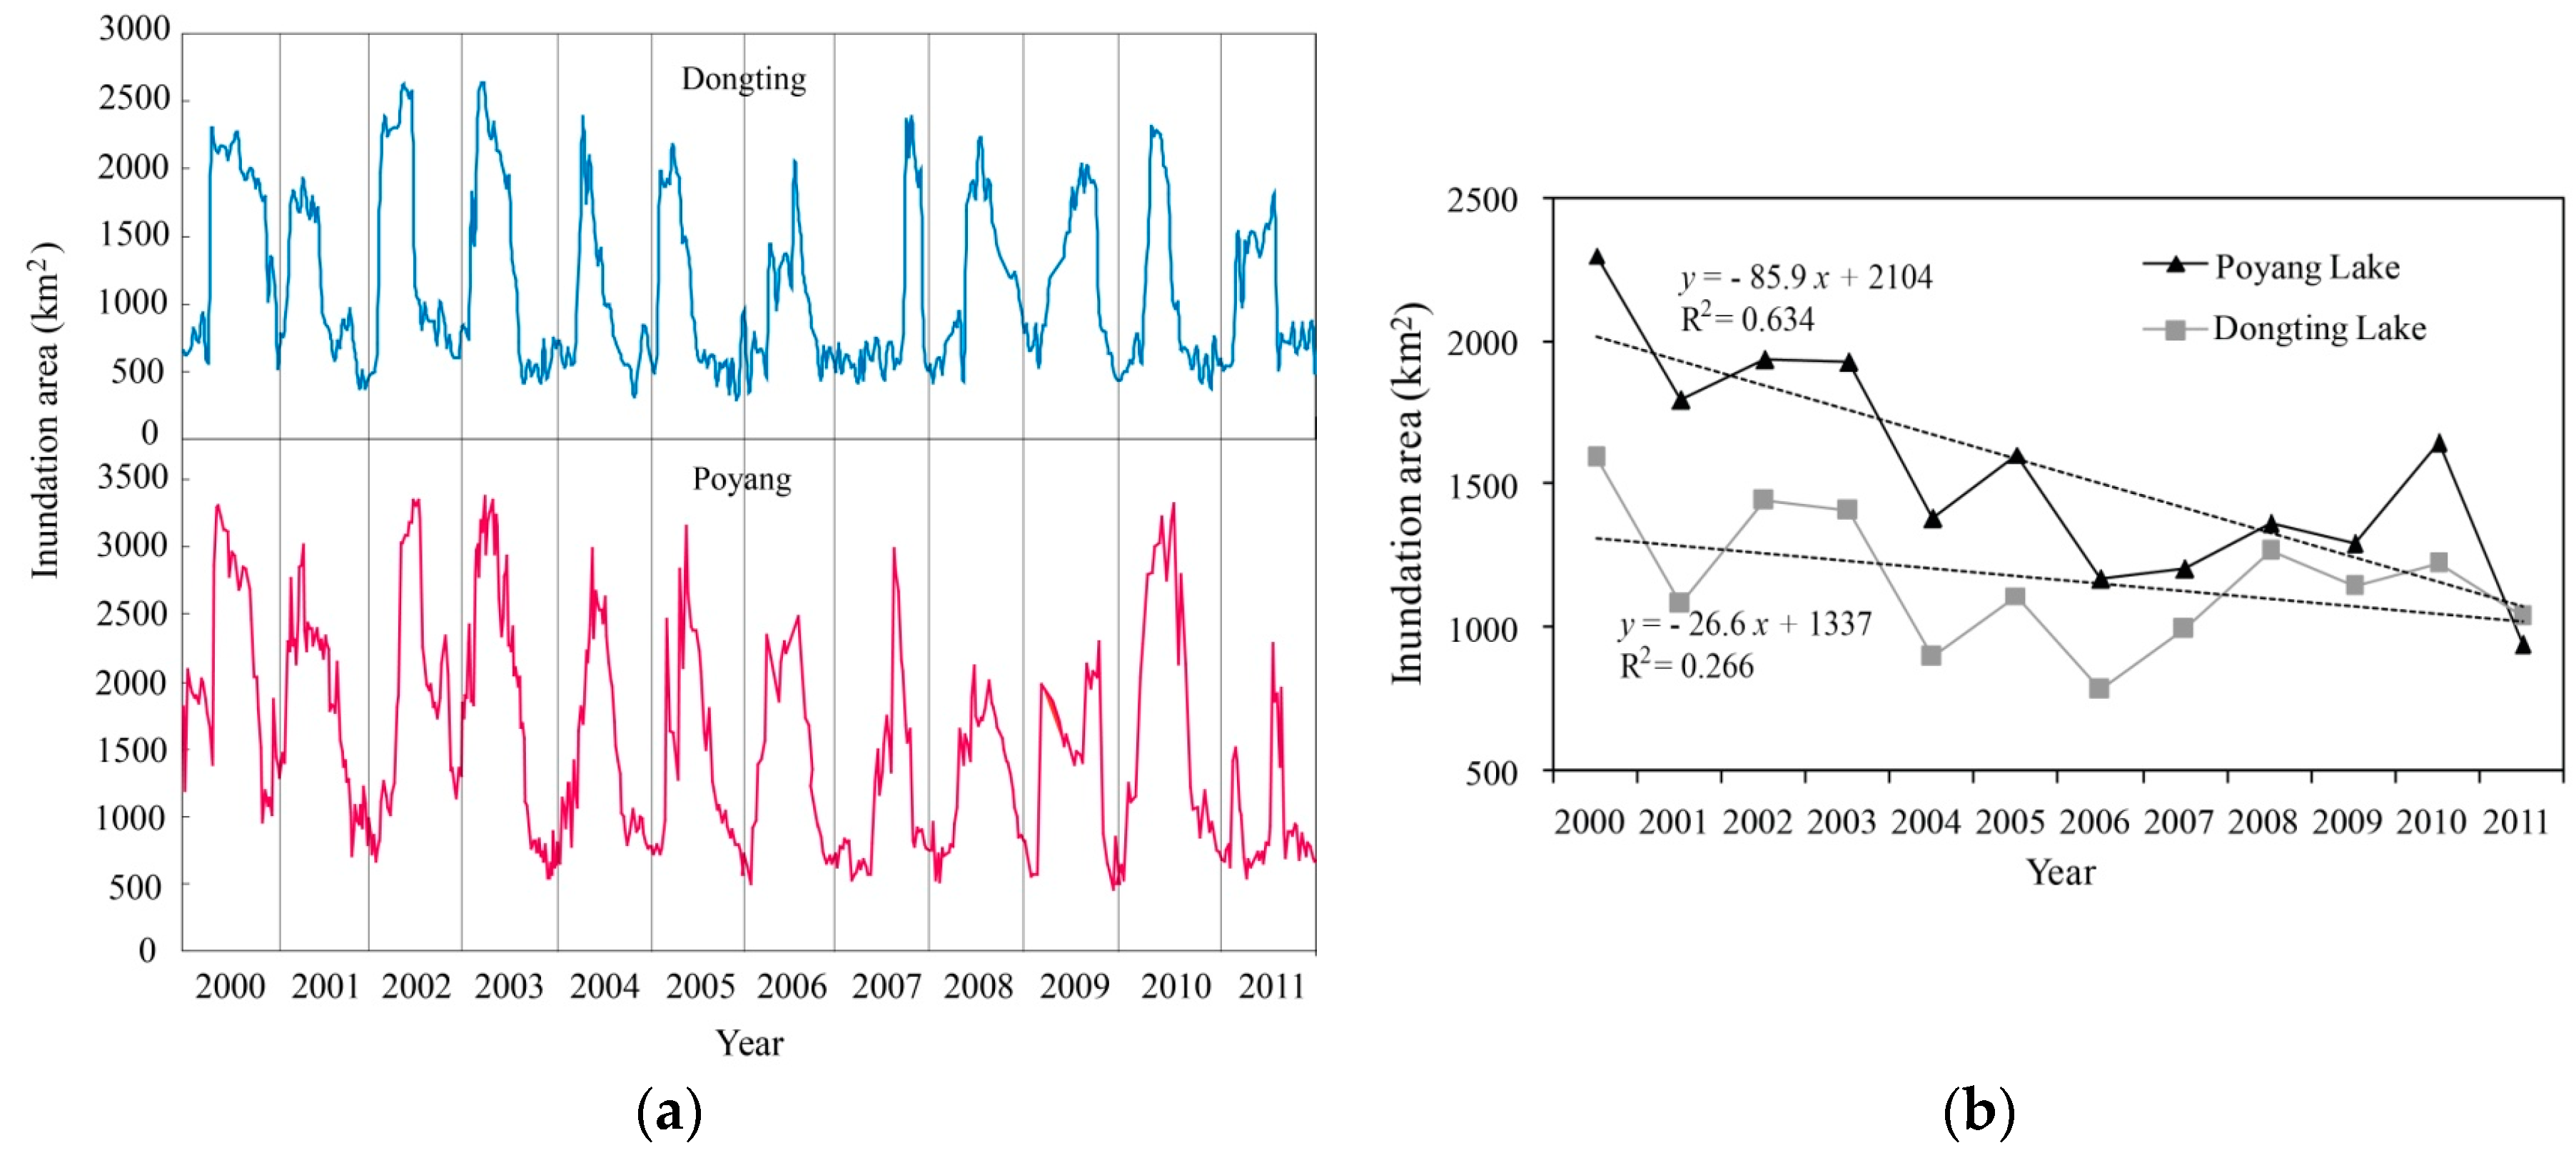
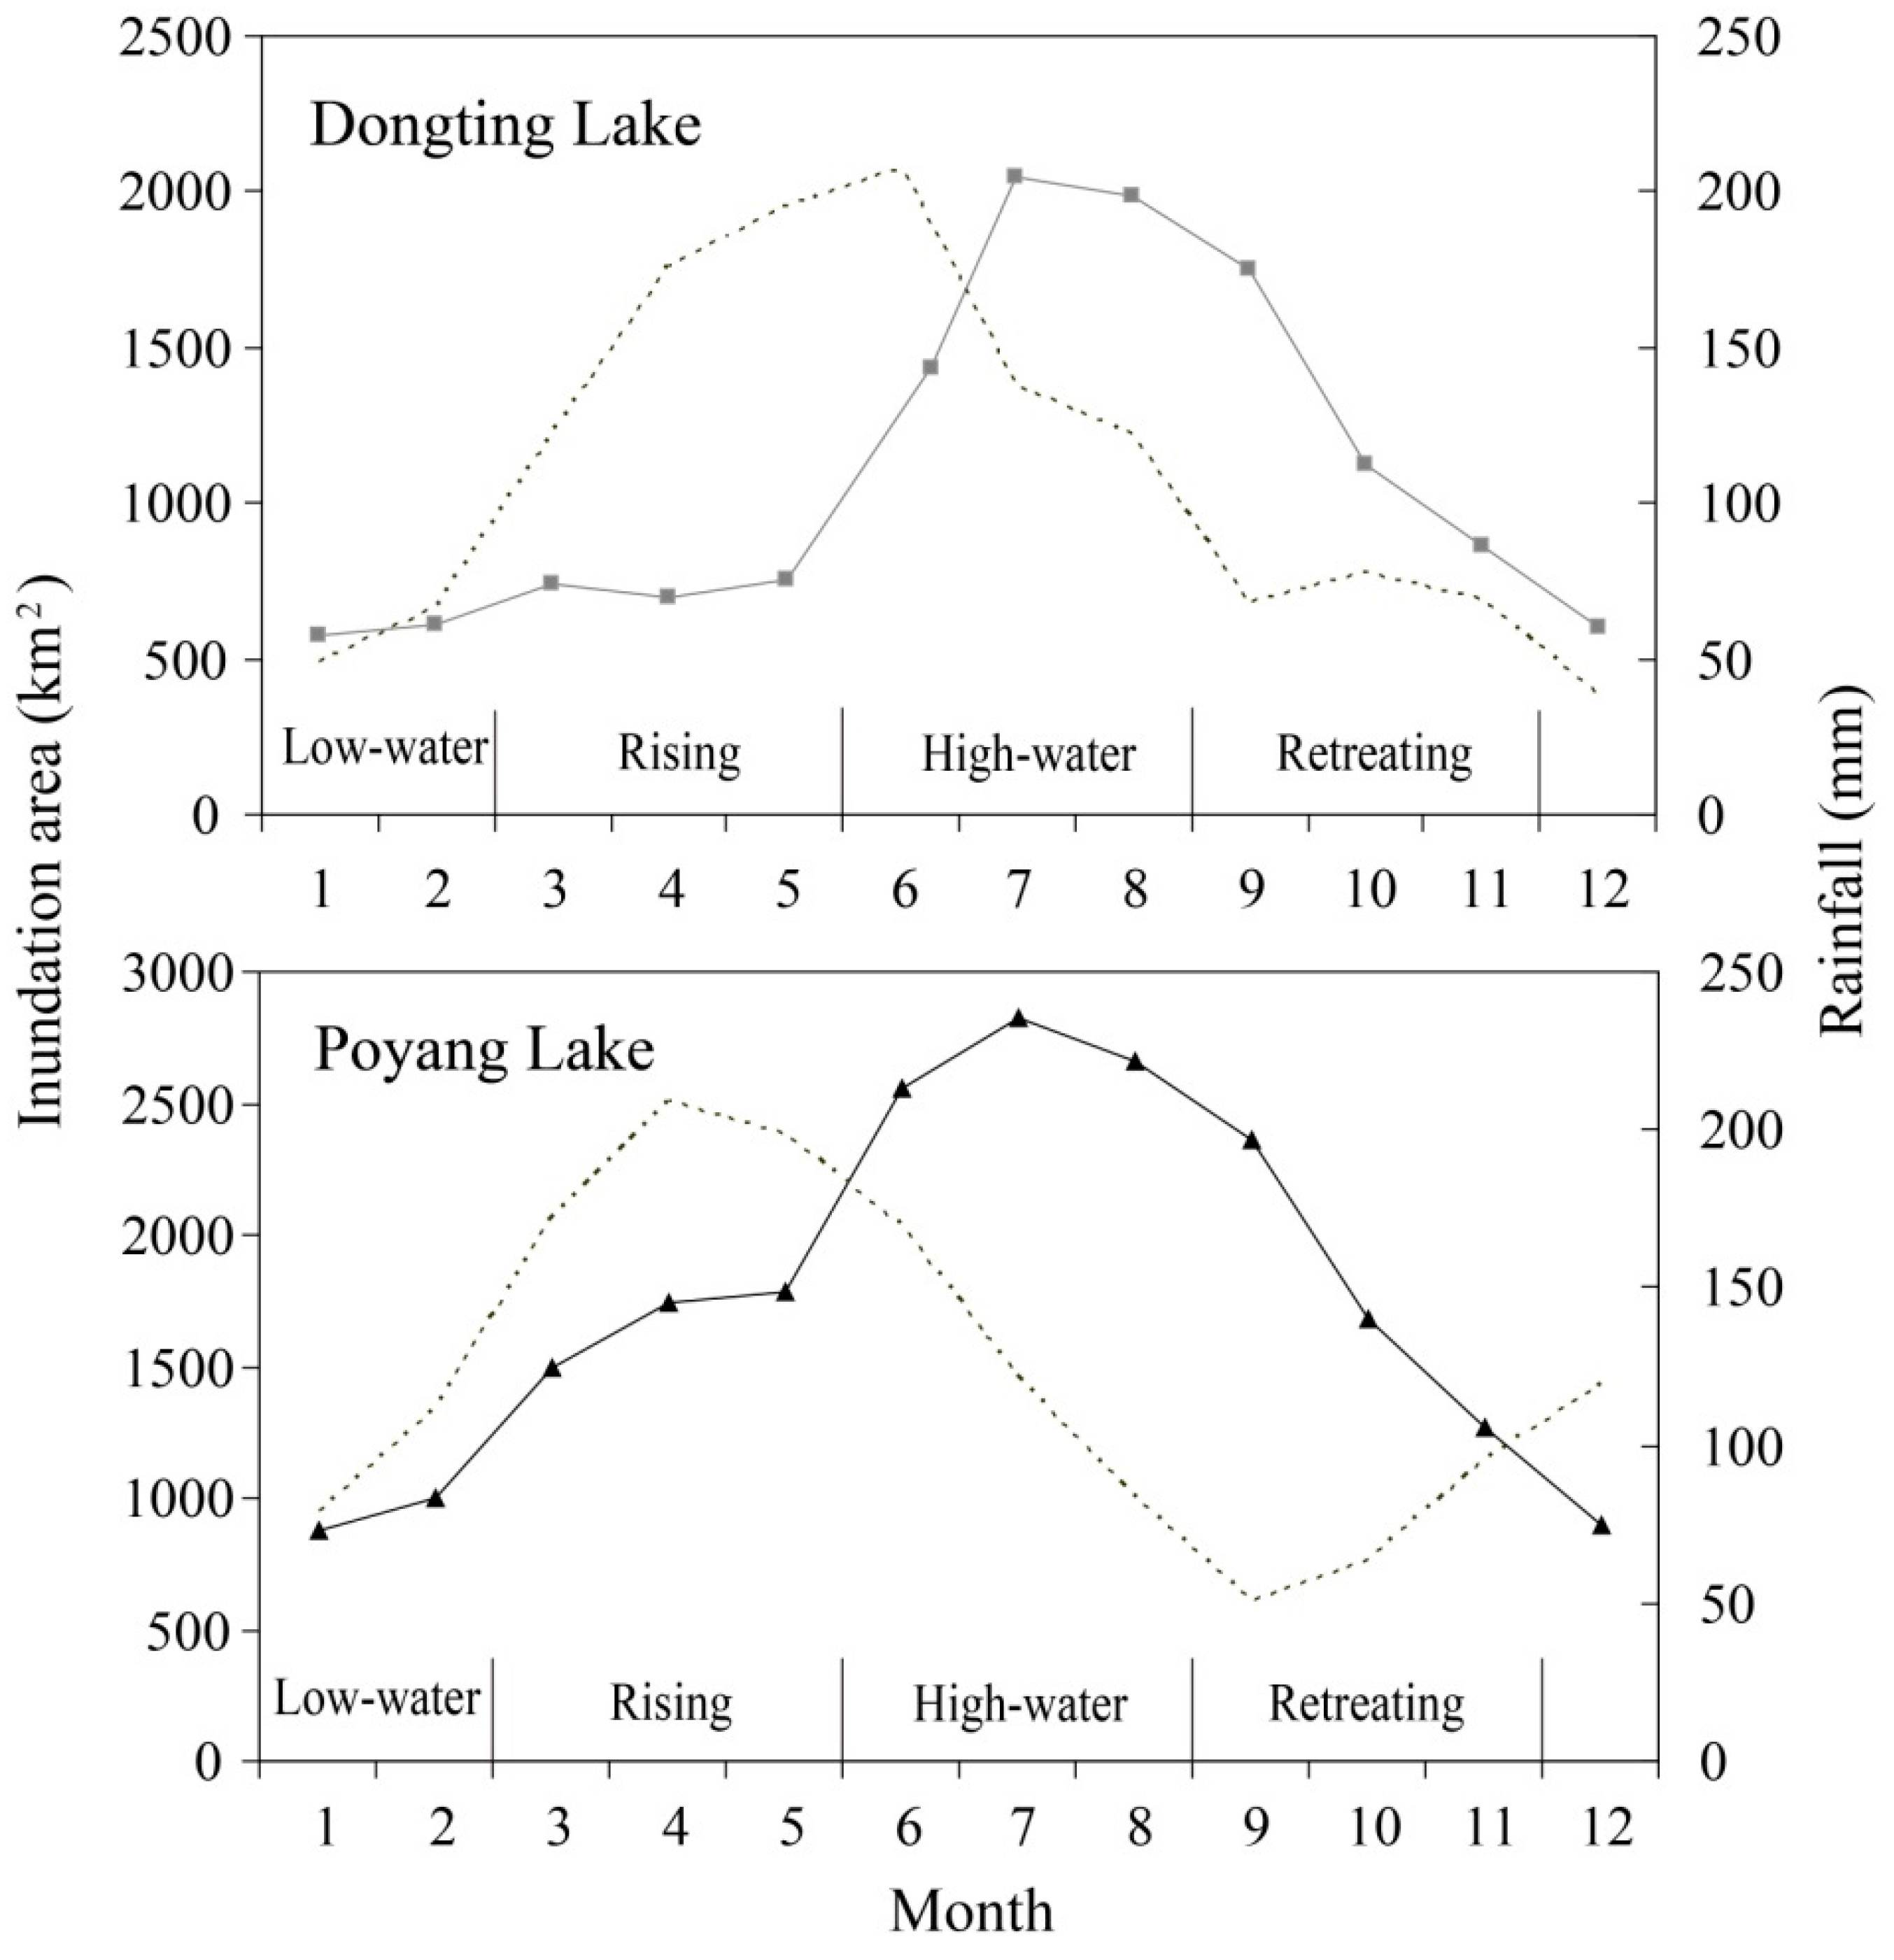
4.1. Temporal Dynamics of the Lake Inundation Area

Figure 3a shows the time series of the delineated water inundation areas in Poyang Lake (red line) and Dongting Lake (blue line). In general, there was a unimodal rise and fall in the flooded areas during most years, although multiple flood peaks occasionally occurred, especially in Poyang Lake. The time series of the inundation areas showed considerable seasonal and inter-annual variabilities for each lake. On a seasonal scale, Dongting Lake had a smaller maximum seasonally inundated area of ~2500 km2. The yearly maximum areas of inundation were also variable for the two lakes, and there were greater relative variations in Poyang Lake. In addition, to further compare the inter-annual changes in water inundation, the average inundation areas in each calendar year from 2000 to 2011 for the two lakes were quantified and are presented in Figure 3b. Meanwhile, corresponding linear regression fits were performed between the annual average inundation areas and time to obtain Pearson’s correlation coefficients (r) (p value less than 0.05). The regressions indicate that there were significant differences in the temporal variations in the area of the two lakes during 2000–2011. The annually averaged inundation areas were higher for Poyang Lake than those for Dongting Lake. Likewise, these differences gradually decreased from 2000 to 2011, with the exception of 2010. As shown in Figure 3b, the inundation areas of the two lakes decreased over the last decade, and significant declining trends can be seen in the dotted lines. The declining inundation trend for Poyang Lake was noticeably pronounced. The water inundation areas decreased by 54.74% and 40.46%, with average annual rates of decrease of 109.74 km2/y and 52.37 km2/y for Poyang Lake and Dongting Lake, respectively.
The mean seasonal cycles of the two lakes’ inundation areas over the MODIS observation period are depicted in Figure 4. Generally, both Poyang Lake and Dongting Lake had strongly seasonal inundation areas because of seasonal variations in precipitation and water exchange with the Yangtze River. The maximum areas always occurred during the flood season from June to September, and the areas substantially shrank to only a few hundred square kilometers during the dry season. However, there were differences in the timings of the increase and decrease in water in Poyang Lake and Dongting Lake. As shown in Figure 4, floodplain inundations in Dongting Lake tended to peak during June–August, a month after the months of maximum rainfall (June). Similarly, in Poyang Lake, the inundation peaks occurred 2–3 months after the period of maximum rainfall (April). Therefore, the comparison of the mean seasonal cycles of inundation and rainfall shows how each lake had variable time lags between the occurrences of rainfall in the watershed and flooding on the floodplains. The difference in the timings of the inundations reflects the movement of river runoff from the catchments to the floodplains and the locations of the lakes relative to the reaches of the Yangtze River.

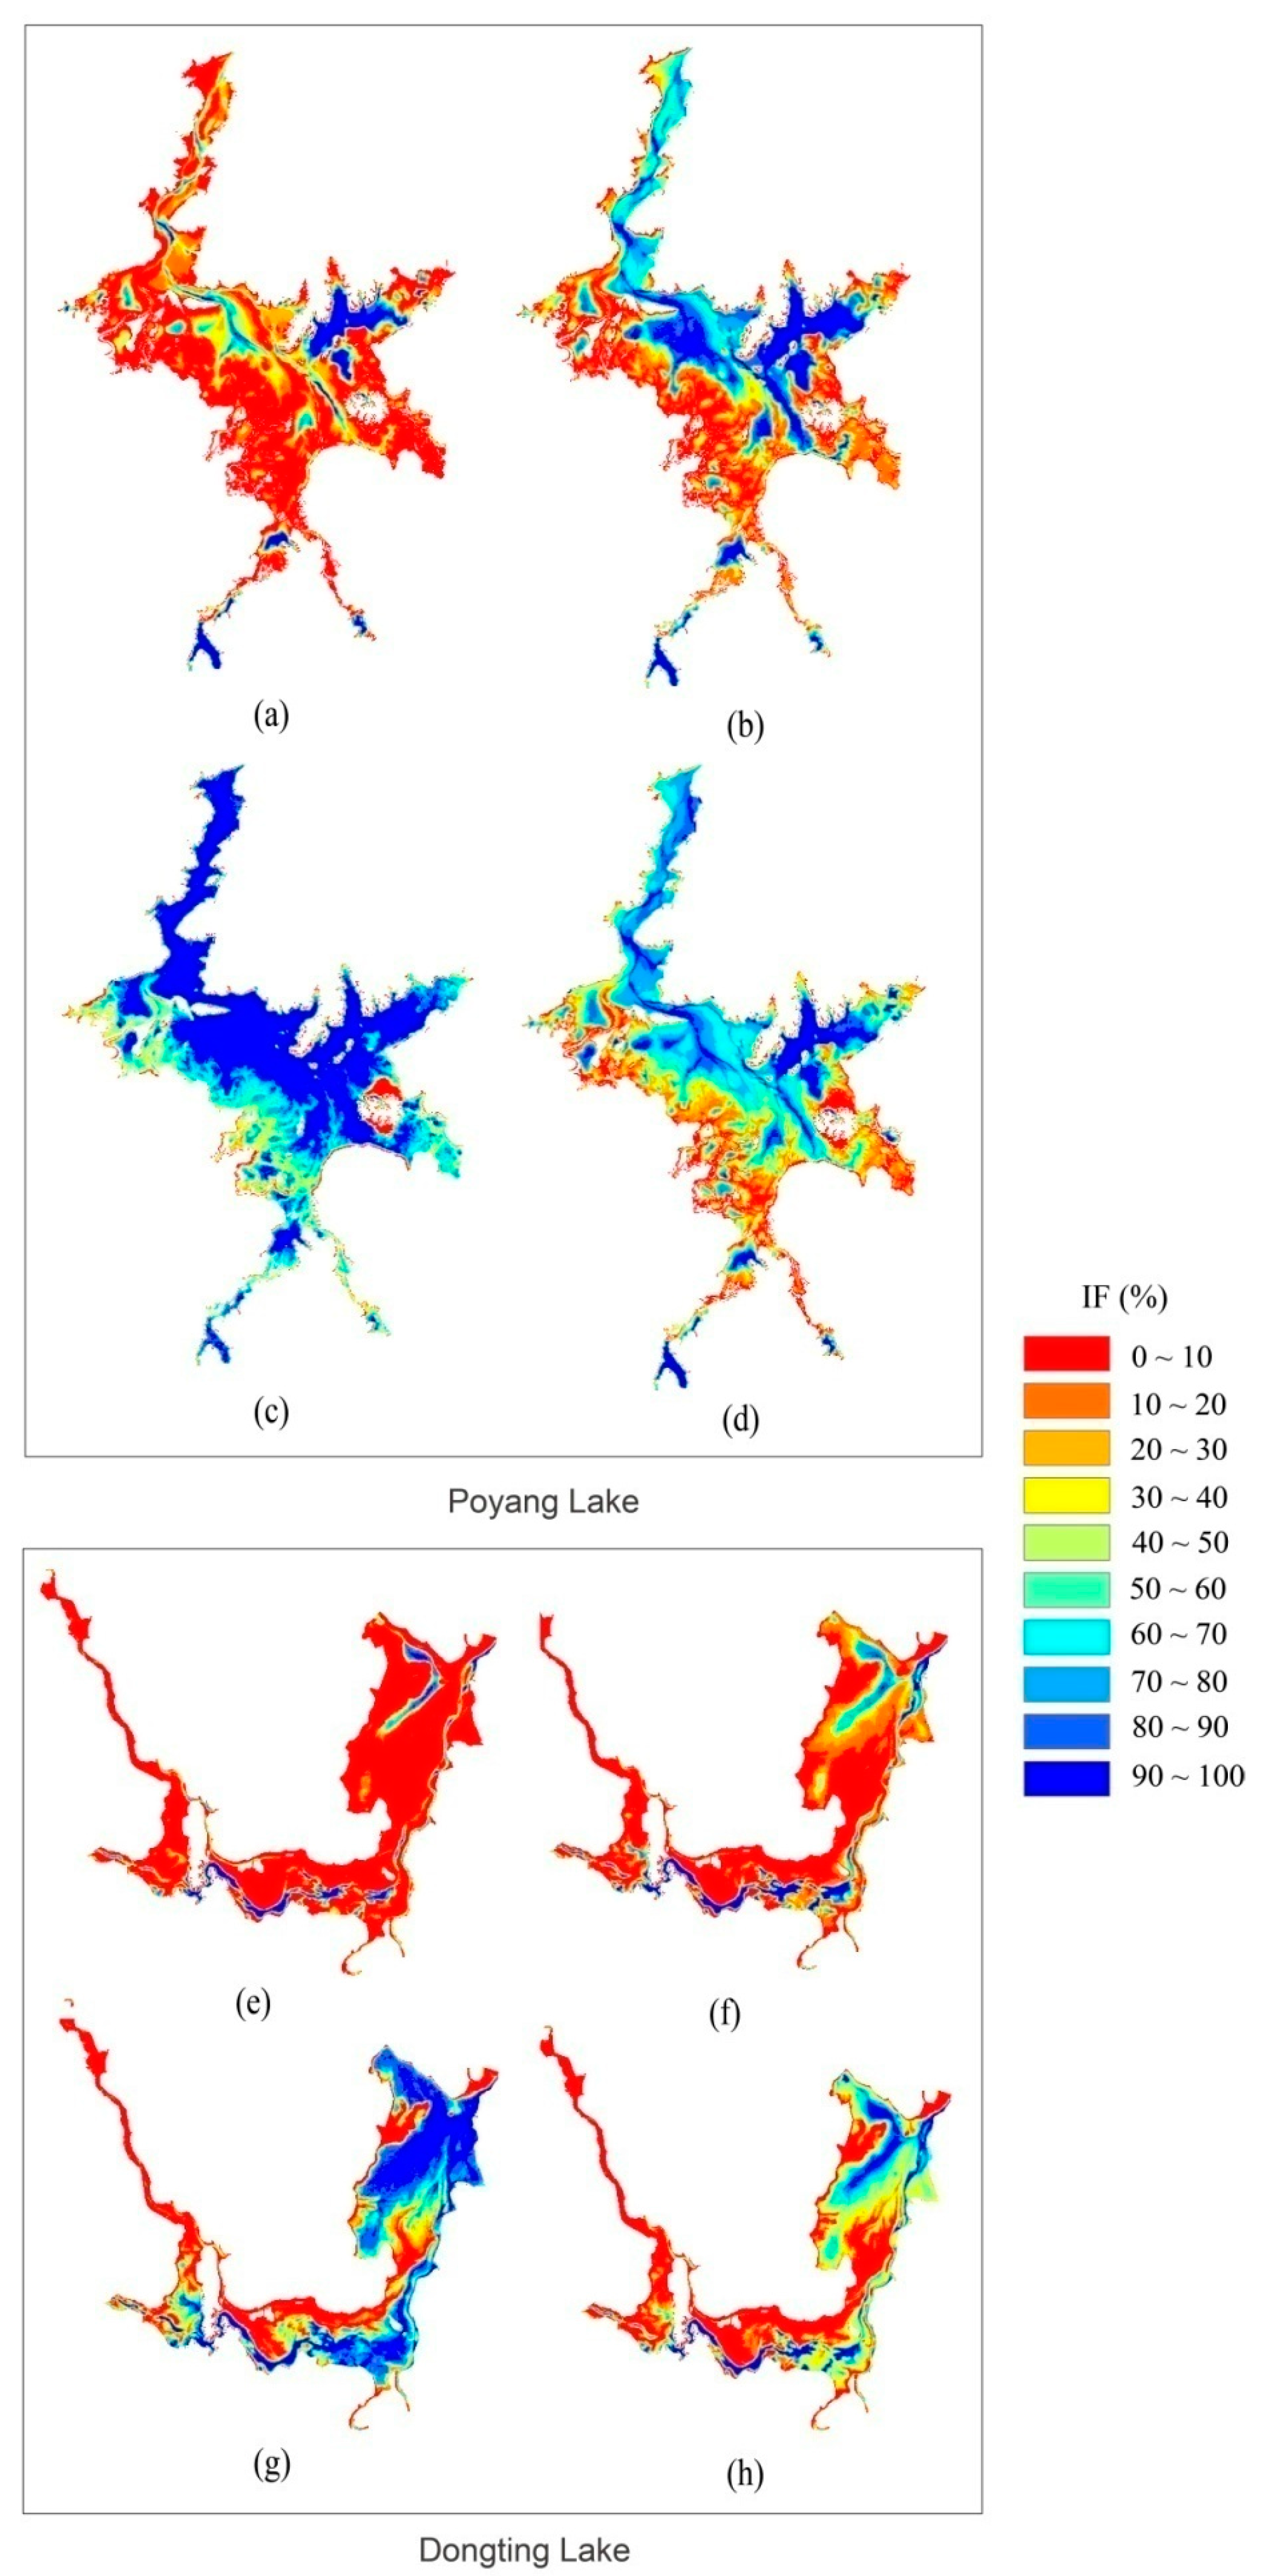
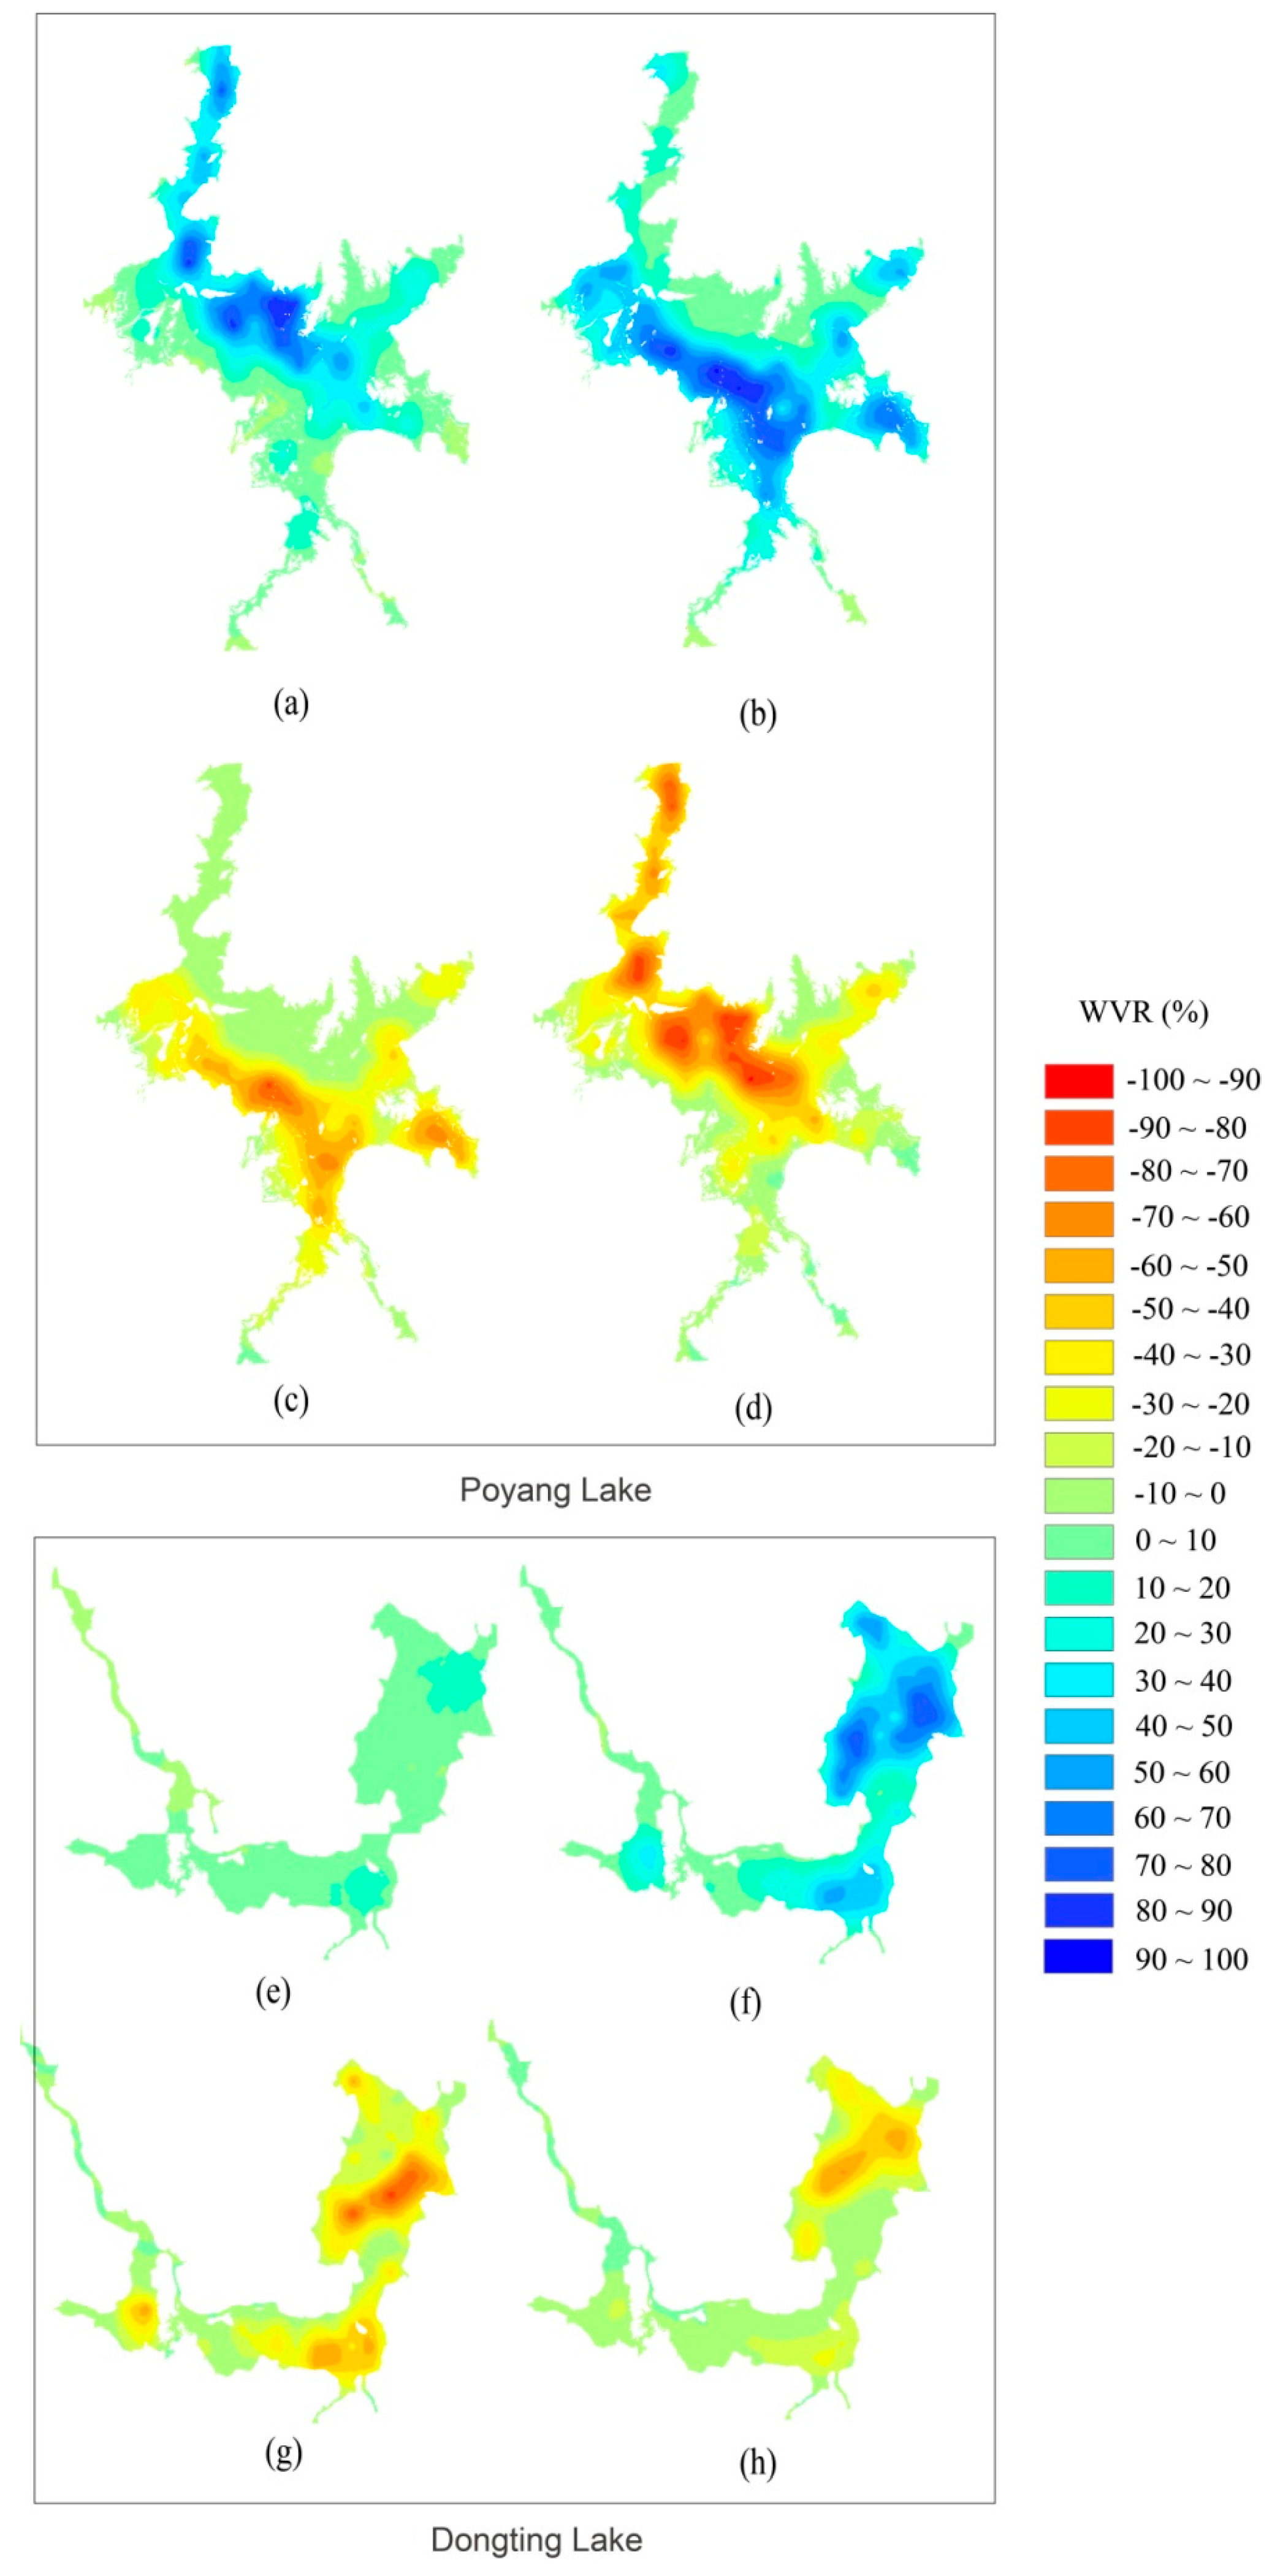
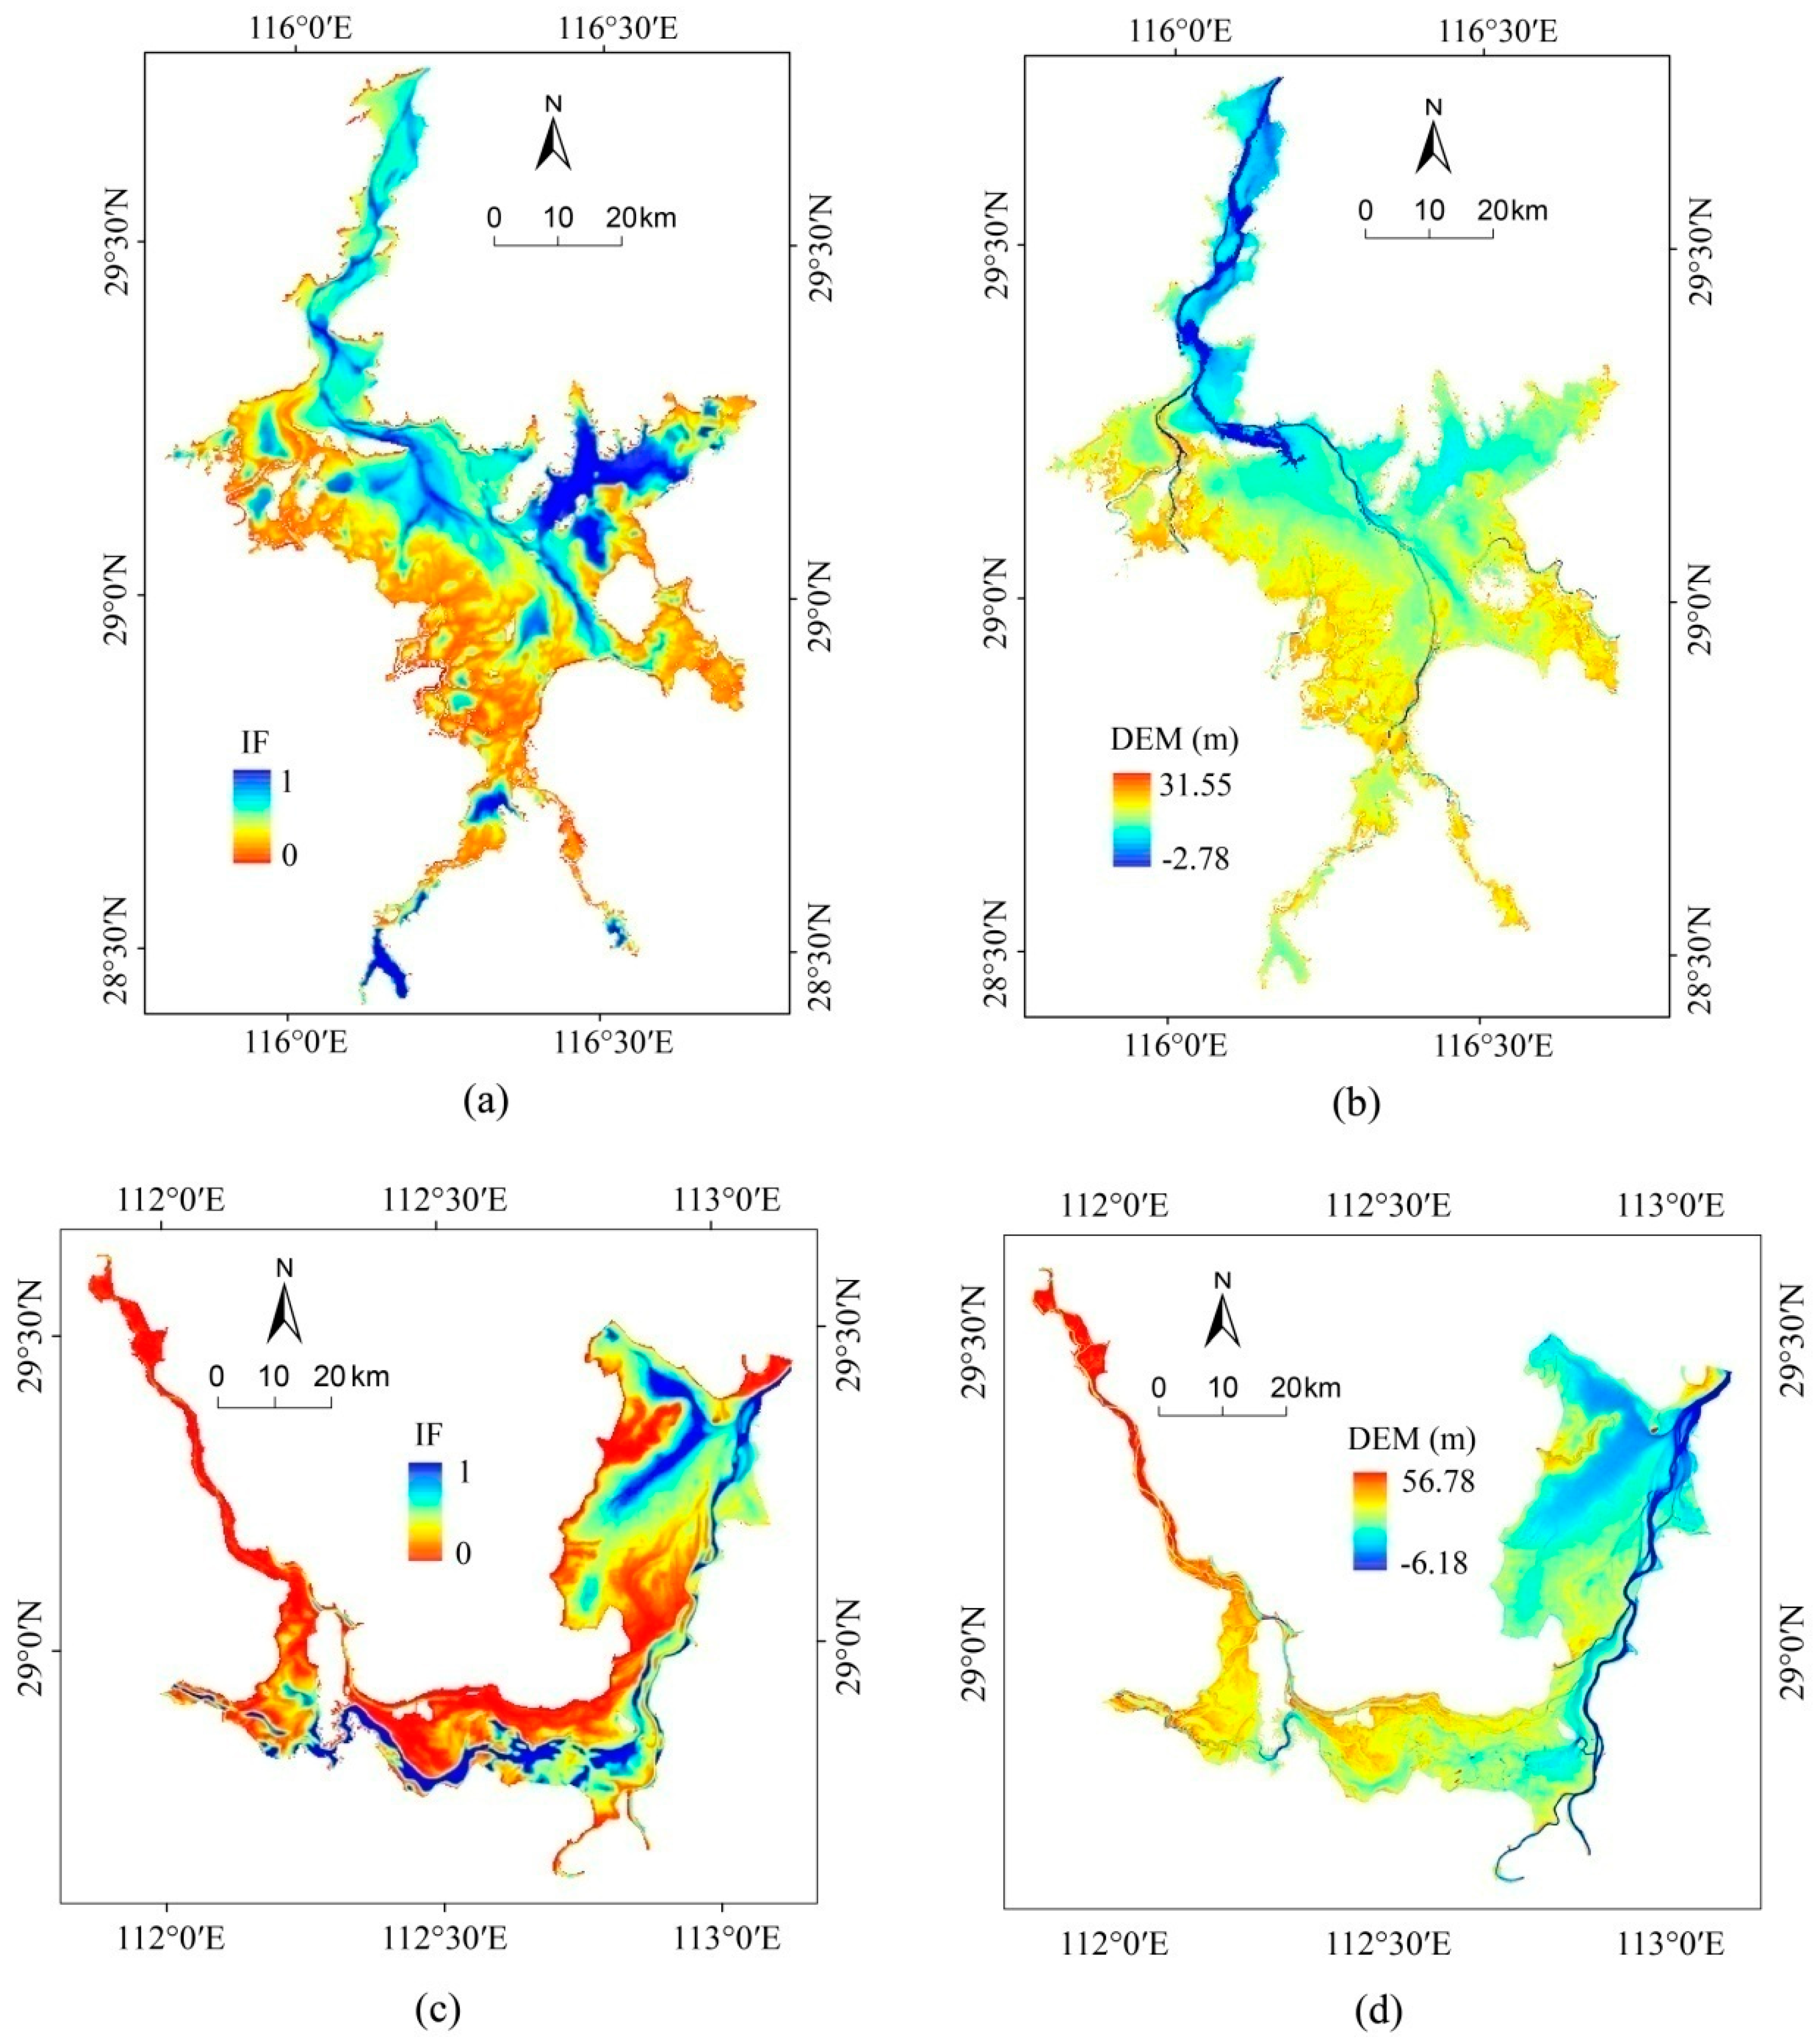
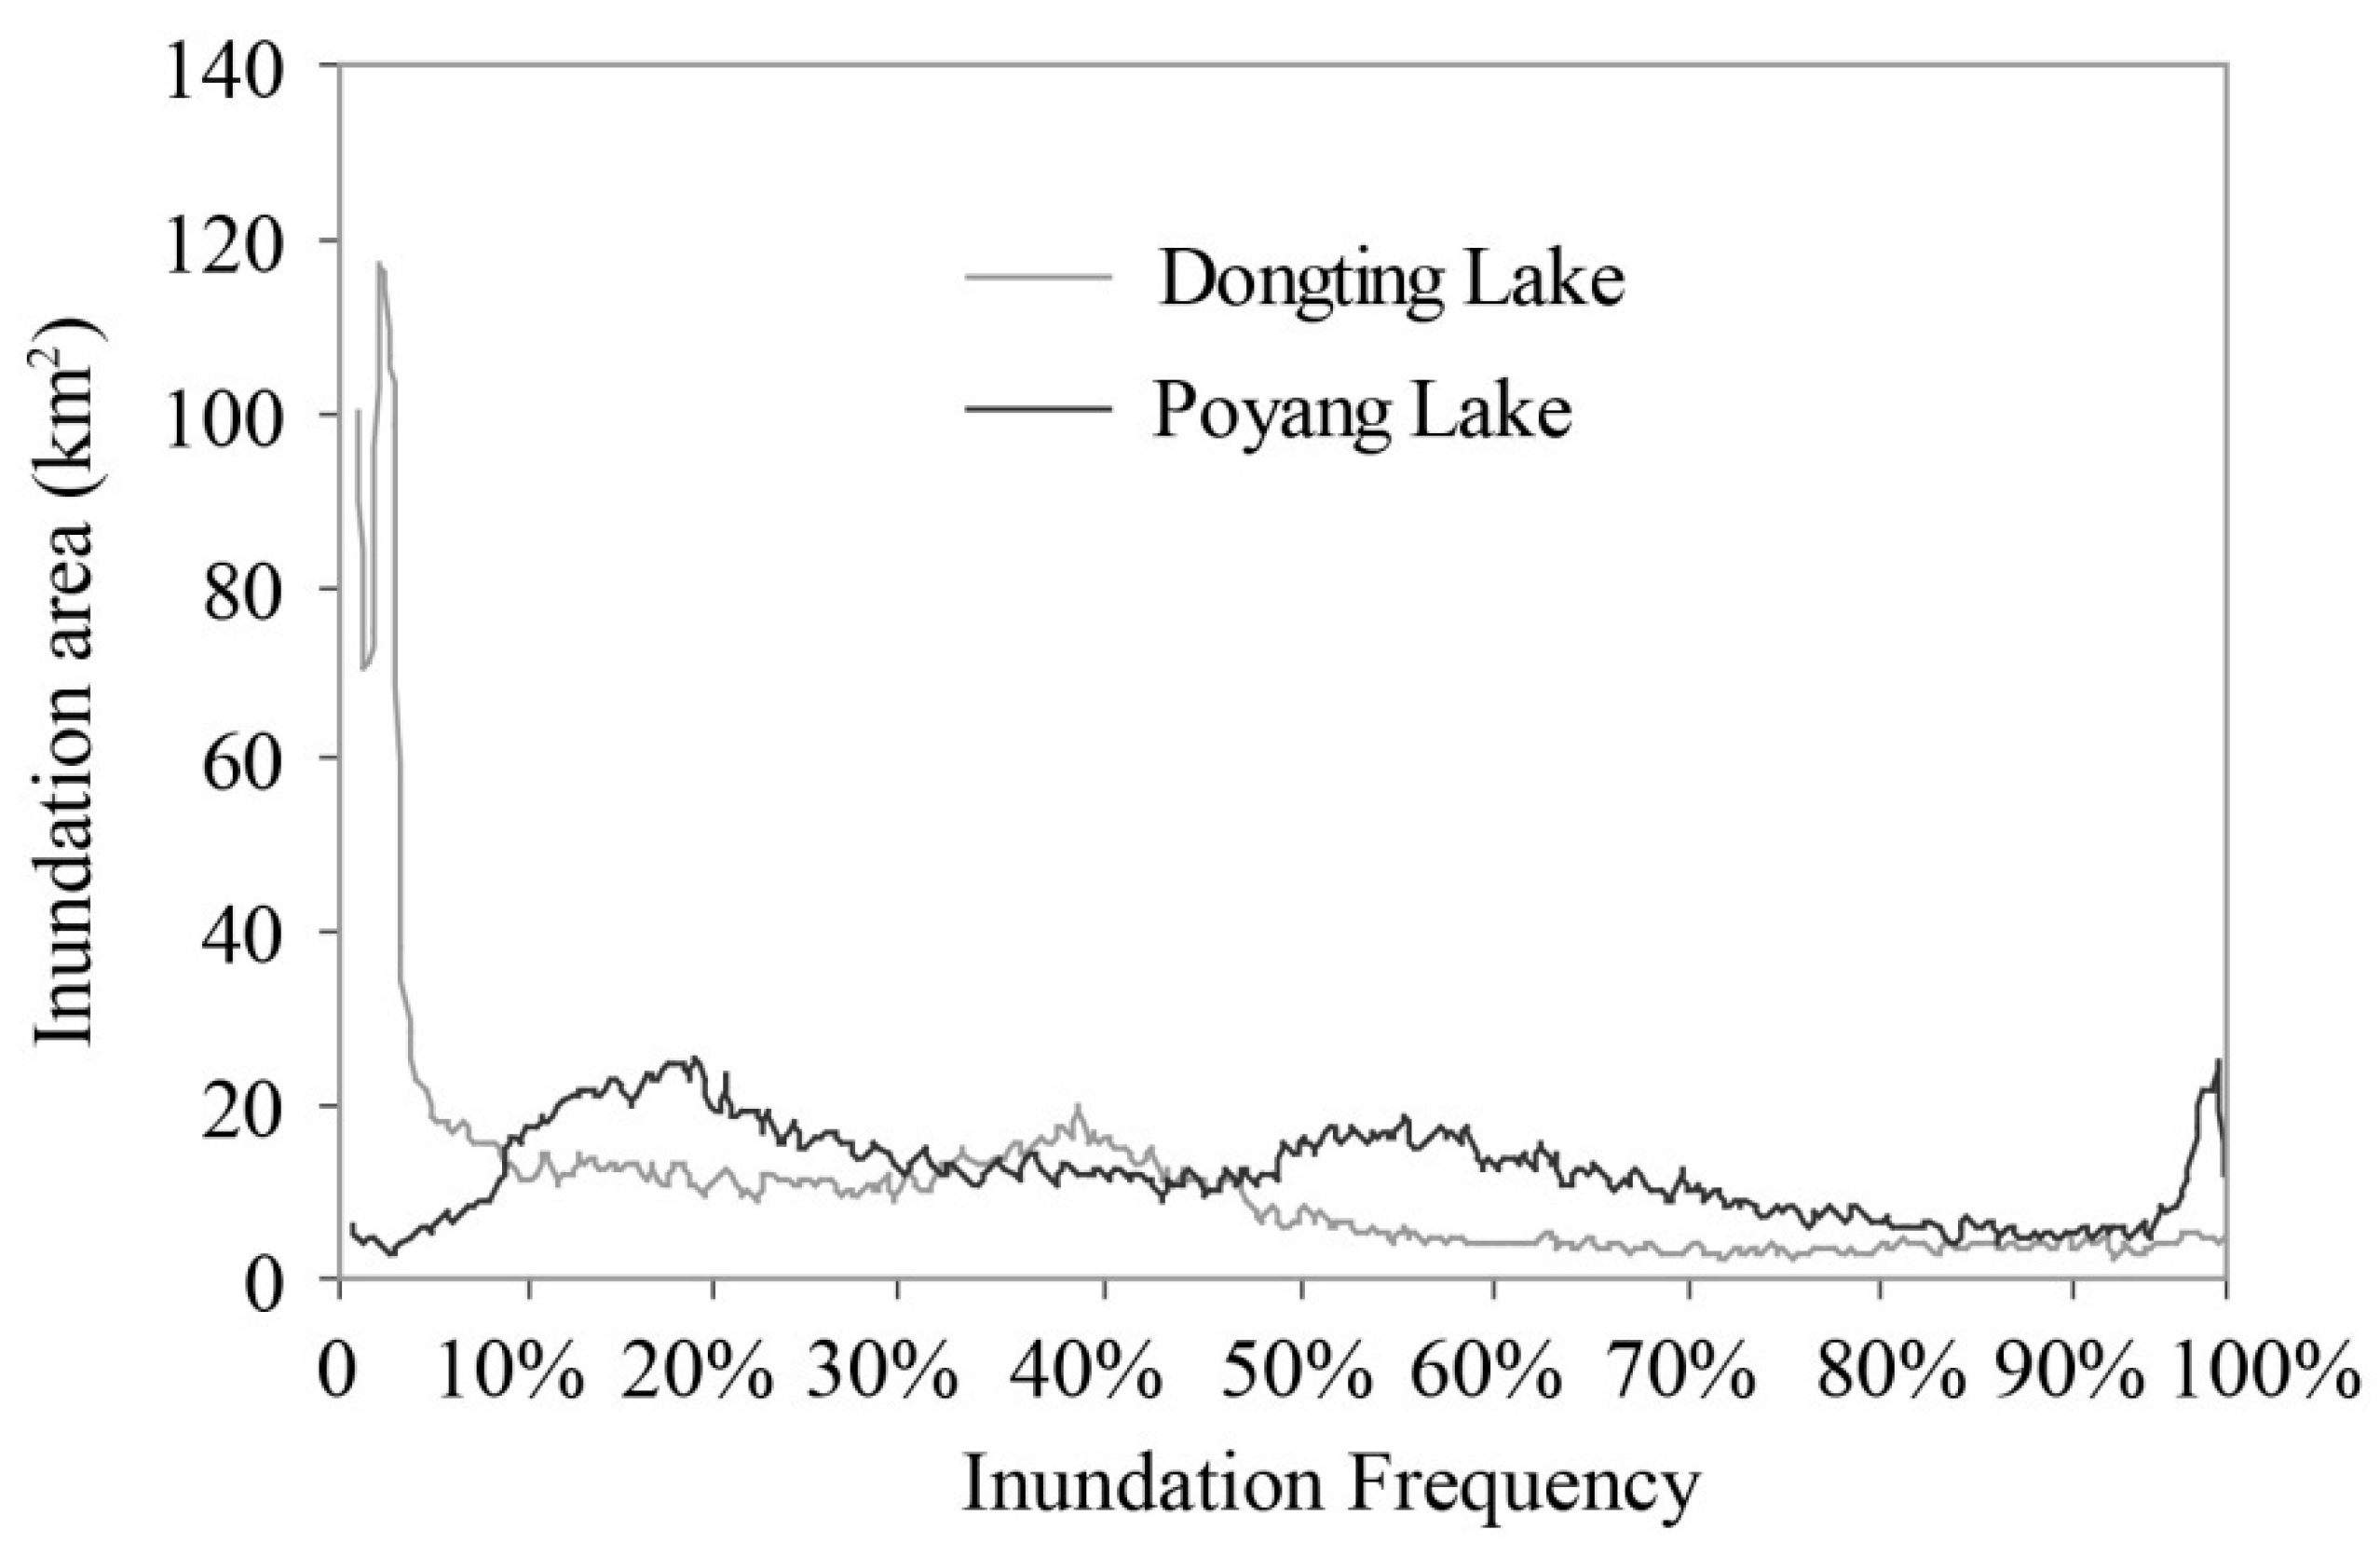
4.2. Spatial Dynamics of the Lake Inundation Extents

Figure 5 presents the spatial patterns of the multi-year mean inundation frequencies (left column) and bottom topography (right column) in Poyang Lake and Dongting Lake. In each lake, the inundation frequency illustrates the spatial distribution of the count of inundation days as a percentage of the total mapping days during 2000–2011. The darker red color indicates a lower inundation frequency, and the darker blue color indicates a larger inundation frequency on the grid. As can be observed in Figure 5, the spatial patterns of the multi-year mean inundation frequencies show good agreement with the bottom topographic characteristics, and the inundation frequencies differed within both lakes. There is a good negative correlation between bottom elevation and inundation frequency in each lake (r = −0.62 and r = −0.68 for Poyang and Dongting Lake, respectively, p < 0.001). Most of the grids with higher frequencies (nearly 60%–90%) were distributed near river channels or sub-lakes in both Poyang Lake and Dongting Lake. This distribution is because the inundations in the lakes always begin with high discharges in the river channels. Likewise, some of the sub-lakes were separated from the main lakes, especially in the low-water periods, which produced higher mean inundation frequencies in those regions. In contrast, the alluvial regions of the two lakes had obviously lower inundation frequencies. In particular, the alluvial regions of Dongting Lake (mainly to the north in WL and SL) had much lower inundation frequencies than the alluvial regions of Poyang Lake (mainly in the south). Compared to Poyang Lake, Dongting Lake has a greater ability to accept sediment from Yangtze River (through the three outlets), which has produced a much higher topography in the alluvial regions (Figure 5). Therefore, the differences in the distribution patterns of the inundation frequencies are mainly controlled by the benthic topographies.
To further reveal the characteristics of the inundation patterns for each lake, the inundation areas as a function of different inundation frequencies for Poyang Lake and Dongting Lake were calculated and are plotted in Figure 6. Significant differences can be observed between the two lakes as the inundation frequency change. The inundation area of Dongting Lake varied considerably for different inundation frequencies, ranging from a maximum of ~120 km2 (at an inundation frequency of <5%) to only ~5 km2 (at an inundation frequency of >50%). However, the inundated areas for different inundation frequencies in Poyang Lake were much more equally distributed and ranged from ~5 km2 to ~25 km2. In addition, except for the mean inundation frequencies of ~40% and <10%, the inundation area of Poyang Lake was generally higher than that of Dongting Lake.
Figure 7 shows maps of the evolution of the estimated mean inundation frequencies for the two lakes during the different water regime periods. Poyang Lake and Dongting Lake generally experience four main types of water regimes: a low-water period (December–February), rising period (March–May), high-water period (June–August), and retreating period (September–November). From year to year, the extent of inundation varies with the monsoonal weather, depending on the amount and intensity of local precipitation. As shown in Figure 7, the inundation frequencies varied greatly and with obvious seasonality in both Poyang Lake and Dongting Lake. Large areas with high inundation frequencies occurred in the high-water periods, whereas relatively small areas with high inundation frequencies mainly occurred in the low-water periods. Except for the artificial lakes and sub-lakes, during the low-water season, only the main lake regions were inundated, with a narrow meandering distribution of inundations in the EL and SL of Dongting Lake (Figure 7g) and in the northern part of Poyang Lake (Figure 7a). In addition, it can be seen from the mean inundation frequency maps in each of the regime periods that there was a visible difference in their spatial locations between Poyang Lake and Dongting Lake. Overall, Poyang Lake had an obvious spatial gradient of water inundation throughout a year, and the monthly mean inundation frequency increased slowly from north to south during the low-water, rising, and high-water periods. However, there was a clear zonal distribution of water inundation in Dongting Lake, especially in the low-water and rising periods. This might have been the result of heavy sediment loads delivered by floodwaters. Likewise, the mean inundation frequency for Dongting Lake rapidly increased radially from the lake’s center to its shore.
Figure 8 shows the multi-year mean water surface variation rates (WVR) during the water regime periods for the two lakes. In Figure 8, the water expansion is represented in blue (with positive WVRs), and the water shrinkage is represented in red (with negative WVRs). It was observed that the water variation rates of the two lakes changed differently in space throughout a year but were in good agreement with the changing water expansion (Figure 8a,b,e,f) and water shrinkage processes (Figure 8c,d,g,h). For Poyang Lake, during the process of water expansion, the northern lake (regions of the body of the main lake) had the highest expansion rate from the low-water to the rising periods (Figure 8a), which was followed by the southern lake (alluvial regions) from the rising to the high-water periods (Figure 8b). However, during the process of water shrinkage, the sequence of the lake shrinkage intensity was opposite to that of the lake expansion. In other words, the southern lake had the highest shrinkage rate from the high-water to the retreating periods (Figure 8c). The higher shrinkage rate then shifted to the northern lake from the retreating to the low-water periods (Figure 8d). In contrast, significant differences were observed in the spatial distributions of the WVRs of Dongting Lake. During the process of water expansion, Dongting Lake exhibited a relatively low expansion rate from the low-water to the rising periods (Figure 8e), and only the main lake body of EL and SL had WVRs of 10%–20%. From the rising to the high-water periods, the WVR rapidly increased radially from the centers of EL (60%–90%), SL (30%–60%) and WL (20%–30%) to the alluvial regions (Figure 8f). During the process of water shrinkage, the spatial distribution of the WVR was similar to that during the water expansion, but the WVR from the high-water to the retreating periods (Figure 8g) was higher than that of the retreating to low-water periods (Figure 8h).

5. Discussion

In the middle reaches of the Yangtze River Basin, Dongting Lake and Poyang Lake are the primary lakes that are naturally connecting to the Yangtze mainstream. The similarities and differences in the inundation patterns and processes in the two lakes may depend on many intrinsic factors, which include climate conditions, population growth and economic development, surface discharges from their respective tributaries, river–lake water exchanges and the topographical characteristics of the lakes.
First, because both Poyang Lake and Dongting Lake are connected to the Yangtze River and have same climate conditions (subtropical humid monsoon climate), the seasonal variations in the inundation patterns of the two lakes were similar and were characterized by a single peak. Generally, Poyang Lake and Dongting Lake are gradually recharged from their respective tributaries, which result in increasing inundation from January–May. At that time, the upstream part of the Yangtze River also receives its annual peak precipitation, which increases its discharge from June to August. After August, the low-water season begins and lasts through December, and the water discharge from their upstream is very low, which causes the inundation areas to decrease rapidly during that period. That is why the areas and inundation frequencies of the two lakes reach their maxima from June–August and drop to their minima in the dry season. In addition, the changes and inter-annual variations in the two lakes’ surface area were possibly attributed to the combined effect of growing population and associated human activities (e.g., levee construction, aquaculture, water-use and poplar planting) [34,35,36]. Especially in the past decades, due to the demand for more farmlands triggered by the rapid population and socio-economic development, large areas of the two lakes’ surface have been encroached by irrationally land reclamation [36].
Second, the water exchange relations between the Yangtze River, Poyang Lake and Dongting Lake are substantially different [37]. The effects of river–lake water exchanges on Dongting Lake are much more complicated than the effects on Poyang Lake. The ability of the Yangtze River and Dongting Lake to exchange water includes two aspects: the ability of the Yangtze River to replenish Dongting Lake (through the three outlets) and the ability of Dongting Lake to replenish the Yangtze River (through Chenglingji). However, the river–lake relation for Poyang Lake is only expressed by its ability to replenish the Yangtze River (through Hukou). For this reason, the different spatial inundation patterns of the two lakes are primarily the result of the natural hydrodynamic interactions between the lakes’ waters and the Yangtze River flows. Likewise, the complex river–lake water exchange in Dongting Lake should give rise to significant inundation changes. For example, compared to Poyang Lake, the ability of the three outlets to replenish Dongting Lake improves quickly from May–July, which induces a sharply rising inundation area in Dongting Lake (Figure 4). In addition, with the operation of the Three Gorges Dam (TGD) and other hydraulic engineering projects on the main stream of the Yangtze River, the cumulative effect of the hydrological regimes on the river-lake relations of Dongting Lake and Poyang Lake have become increasing obvious.
Third, the two lakes have different topographical characteristics. Unlike Poyang Lake, Dongting Lake has a special geographical location that causes much larger floods and sediment deposition throughput than those of Poyang Lake [29]. The rich sediment in the marshlands has attracted farmers, and several embankments have been built to hold the Yangtze River back and gain more farmland. Therefore, the siltation by mud and sand in Dongting Lake has reduced its storage capacity and caused complex topographical characteristics, especially in the WL, which could give rise to different spatial distribution patterns in the inundation frequency and WVR. In addition, along the Yangtze River, the hydraulic gradient near Dongting Lake is larger than that of Poyang Lake [29]. This also causes an increase in the outflow discharge and accelerates the drainage of Doingting Lake. Although the statuses of the two lakes naturally interact with the local Yangtze level, the topographical characteristics are manifested in the great intra-annual variabilities in the inundation areas. However, such natural connections with the Yangtze River have gradually diminished due to decades of local anthropogenic activities that include levee construction, channel diversion, and floodgate controls [7,26].
The results presented here provide a synoptic summary of the two lakes’ inundation patterns and should have implications for wetland monitoring and hydrology management. Poyang Lake and Dongting Lake are important natural habitats for large concentrations of migratory birds and fish stocks [13]. The structure, function and availability of these biotic habitats are directly impacted by the lakes’ inundation patterns. The dynamic changes in the lakes’ inundation frequencies and WVRs can be used to document the exposure/submersion conditions of the wetlands and to help understand changes in the wetland’s ecological functions. Likewise, the developed inundation maps further can be incorporated to land-use planning decisions [38]. This may help to propose comprehensive flood hazard management strategies and reduce potential flood damage in the two lakes. In addition, the inundation process is an important hydrology characteristic of wetlands and mainly determines the distribution of wetland vegetation. The depth, duration and frequency of inundation affect plant community development [39]. Poyang and Dongting Lakes are vast, highly diverse landscapes with numerous vegetation communities that are subject to a multitude of hydrological conditions. The results of this work can also be used to indicate the different hydrological structures of vegetation communities across the two lakes by analyzing the locations’ inundation frequencies and WVRs.

6. Conclusions

This work mainly addressed the comparative analysis of the dynamic inundation patterns and processes in China’s two largest freshwater lakes using multi-temporal MODIS images from 2000 to 2011. The results demonstrate that there were similarities and differences in the inundation patterns of Dongting Lake and Poyang Lake. Temporally, the two lakes experienced decadal net declines in their inundation areas, with a cumulative decrease of 54.74% for Poyang Lake and 40.46% for Dongting Lake from 2000 to 2011. Spatially, there were obvious regional differences in the inundation frequencies and WVRs of the two lakes. Overall, the alluvial regions of Dongting Lake had much lower inundation frequencies than the alluvial regions of Poayng Lake. During the low-water to high-water periods, there was a north to south gradient in inundation in Poyang Lake, whereas Dongting Lake had a clear zonal distribution pattern. Likewise, the WVRs of the two lakes were spatially different during the different water regime periods. The different inundation frequencies and WVRs in the two lakes can be explained by many intrinsic factors, including surface discharges from their respective tributaries, river–lake water exchanges and the topographical characteristics of the lakes. The findings here have significant implications to future research and management. First, the quantitative comparison of the inundation dynamic characteristics provided here can facilitate the development of corresponding hydrological, ecological and environmental strategies for the two river-connected lakes. For example, the dynamic inundation patterns largely determine wetland plant regeneration, species richness and other ecological conditions. Several hydro-ecologists require this information about inundation frequencies and water variation rates for aquatic ecological research. Likewise, some programs, such irrigation planning, drinking project and future hydraulic engineering in the middle reach of the Yangtze River also require these knowledge of water inundation characteristics over the two lakes. In addition, because of the free availability of most satellite images, for other similar lakes with highly dynamic inundation changes, the methodology of inundation mapping outlined here can also be easily extended to provide dynamic inundation patterns.

Acknowledgments

This work was supported by the State Key Program of National Natural Science of China (41430855), National Natural Science Foundation of China (41401506), 973 Program of the National Basic Research Program of China (2012CB417003), and Natural Science Foundation of Jiangsu Province, China(BK20131056). We thank Hongxia Ji for pre-processing of satellite data.

Author Contributions

Guiping Wu carried out data processing, data analysis and wrote the paper. Yuanbo Liu offered guidance to complete the work and made revisions to the manuscript.

Conflicts of Interest

The authors declare no conflicts of interest.

References

  1. Beeton, A.M. Large freshwater lakes: Present state, trends, and future. Environ. Conserv. 2002, 29, 21–38. [Google Scholar] [CrossRef]
  2. Williamson, C.E.; Saros, J.E.; Vincent, W.F.; Smol, J.P. Lakes and reservoirs as sentinels, integrators, and regulators of climate change. Limnol. Oceanogr. 2009, 54, 2273–2282. [Google Scholar] [CrossRef]
  3. Hampton, S.E.; Izmest’eva, L.R.; Moore, M.V.; Katz, S.L.; Dennis, B.; Silow, E.A. Sixty years of environmental change in the world’s largest freshwater lake e Lake Baikal, Siberia. Glob. Chang. Biol. 2008, 14, 1947–1958. [Google Scholar] [CrossRef]
  4. Lennox, B.; Spooner, I.; Jull, T.; Patterson, W. Post-glacial climate change and its effect on a shallow dimictic lake in Nova Scotia, Canada. J. Paleolimnol. 2010, 43, 15–27. [Google Scholar] [CrossRef]
  5. Gao, H.; Bohn, T.J.; Podest, E.; McDonald, K.C.; Lettenmaier, D.P. On the causes of the shrinking of Lake Chad. Environ. Res. Lett. 2011, 6, 034021. [Google Scholar] [CrossRef]
  6. Ariztegui, D.; Anselmetti, F.S.; Robbiani, J.M.; Bernasconi, S.M.; Brati, E.; Gilli, A.; Lehmann, M.F. Natural and human-induced environmental change in southern Albania for the last 300 years–Constraints from the Lake Butrint sedimentary record. Glob. Planet. Chang. 2010, 71, 183–192. [Google Scholar] [CrossRef]
  7. Du, Y.; Xue, H.P.; Wu, S.J.; Ling, F.; Xiao, F.; Wei, X.H. Lake area changes in the middle Yangtze region of China over the 20th century. J. Environ. Manag. 2011, 92, 1248–1255. [Google Scholar] [CrossRef] [PubMed]
  8. Junk, W.J. The central Amazon floodplain: Ecology of a pulsing system. In Ecological Studies; Springer: New York, NY, USA, 2013; pp. 3–5. [Google Scholar]
  9. Hamilton, S.K.; Suzanne, J.S.; John, M.M. Seasonal inundation patterns in two large savanna floodplains of South America: The Llanos de Moxos (Bolivvia) and the Llanos del Orinoco (Venezuela and Colombia). Hydrol. Process. 2004, 18, 2103–2116. [Google Scholar] [CrossRef]
  10. Decharme, B.; Douville, H.; Prigent, C.; Papa, F.; Aires, F. A new river flooding scheme for global climate applications: Off-line validation over South America. J. Geophys. Res. 2008, 113, D11110. [Google Scholar] [CrossRef]
  11. Wang, S.M.; Dou, H.H.; Chen, K.Z.; Wang, X.C.; Jiang, J.H. Chinese Lake Catalogue; Science Press: Beijing, China, 1998. [Google Scholar]
  12. Olson, D.M.; Dinerstein, E. The Global 200: Priority ecoregions for global conservation. Ann. Mo. Bot. Gard. 2002, 89, 199–224. [Google Scholar] [CrossRef]
  13. Lai, X.J.; Liang, Q.H.; Jiang, J.H.; Huang, Q. Impoundment effects of the Three-Gorges-Dam on flow regimes in two China’s largest freshwater lakes. Water Resour. Manag. 2014, 28, 5111–5124. [Google Scholar] [CrossRef]
  14. Huang, S.F.; Li, J.G.; Xu, M. Water surface variations monitoring and flood hazard analysis in Dongting Lake area using long-term Terra/MODIS data time series. Nat. Hazards 2012, 62, 93–100. [Google Scholar] [CrossRef]
  15. Feng, L.; Hu, C.M.; Chen, X.L.; Cai, X.B.; Tian, L.Q.; Gan, W.X. Assessment of inundation changes of Poyang Lake using MODIS observations between 2000 and 2010. Remote Sens. Environ. 2012, 121, 80–92. [Google Scholar] [CrossRef]
  16. Wang, J.D.; Sheng, Y.W.; Tong, T.S.D. Monitoring decal lake dynamics across the Yangtze Basin downstream of Three Gorges Dam. Remote Sens. Environ. 2014, 152, 251–269. [Google Scholar] [CrossRef]
  17. Liu, Y.B.; Wu, G.P.; Zhao, X.S. Recent declines in China’s largest freshwater lake: Trend or regime shift? Environ. Res. Lett. 2013, 8, 014010. [Google Scholar] [CrossRef]
  18. Feng, L.; Hu, C.M.; Cheng, X.L.; Zhao, X. Dramatic inundation changes of China’s two largest freshwater lakes linked to the Three Gorges Dam. Environ. Sci. Technol. 2013, 47, 9628–9634. [Google Scholar] [CrossRef] [PubMed]
  19. Zhao, X.; Stein, A.; Chen, X.L.; Feng, L. Modeling spatial-temporal change of Poyang Lake marshland based on an uncertainty theory-random sets. Proc. Environ. Sci. 2011, 3, 105–110. [Google Scholar] [CrossRef]
  20. Ding, X.W.; Li, X.F. Monitoring of the water-area variations of Lake Dongting in China with ENVISAT ASAR images. Int. J. Appl. Earth Obs. 2011, 13, 894–901. [Google Scholar] [CrossRef]
  21. Cui, L.J.; Gao, C.J.; Zhao, X.S.; Ma, Q.F.; Zhang, M.F.; Li, W.; Song, H.T. Dynamics of the lakes in the middle and lower reaches of the Yangtze River basin, China, since late nineteenth century. Environ. Monit. Asssess. 2013, 185, 4005–4018. [Google Scholar] [CrossRef] [PubMed]
  22. Deng, F.; Wang, X.L.; Cai, X.B.; Li, E.H.; Jiang, L.Z.; Li, H.; Yan, R.R. Analysis of the relationship between inundation frequency and wetland vegetation in Dongting Lake using remote sensing data. Ecohydrology 2014, 7, 717–726. [Google Scholar] [CrossRef]
  23. Wu, G.P.; Liu, Y.B. Capturing variations in inundation with satellite remote sensing in a morphologically complex, large lake. J. Hydrol. 2015, 523, 14–23. [Google Scholar] [CrossRef]
  24. Du, N.; Ottens, H.; Sliuzas, R. Spatial impact of urban expansion on surface water bodies—A case study of Wuhan, China. Landsc. Urban Plan. 2010, 94, 175–185. [Google Scholar] [CrossRef]
  25. Dewan, A.M.; Yamaguchi, Y. Effect of land cover changes on flooding: Example from Greater Dhaka of Bangladesh. Int. J. Geoinform. 2008, 4, 11–20. [Google Scholar]
  26. Shankman, D.; Liang, Q. Landscape changes and increasing flood frequency in China’s Poyang Lake region. Prof. Geogr. 2003, 55, 434–445. [Google Scholar] [CrossRef]
  27. Zhu, H.H.; Zhang, B. The Poyang Lake; Press of University of Science & Technology: Hefei, China, 1997. [Google Scholar]
  28. Hui, F.; Xu, B.; Huang, H.; Yu, Q.; Gong, P. Modelling spatial-temporal change of Poyang Lake using multitemporal Landsat imagery. Int. J. Remote Sens. 2008, 29, 5767–5784. [Google Scholar] [CrossRef]
  29. Dou, H.S.; Jiang, J.H. The Dongting Lake; Press of University of Science and Technology: Hefei, China, 2000. [Google Scholar]
  30. Yin, H.; Liu, G.; Pi, J. On the river-lake relationship of the middle Yangtze reaches. Geomorphology 2007, 85, 197–207. [Google Scholar] [CrossRef]
  31. McFeeters, S.K. The use of the normalized difference water index (NDWI) in the delineation of open water features. Int. J. Remote Sens. 1996, 17, 1425–1432. [Google Scholar] [CrossRef]
  32. Liu, Y.B.; Song, P.; Peng, J.; Ye, C. A physical explanation of the variation in threshold for delineating terrestrial water surface from multi-temporal images: Effects of radiometric correction. Int. J. Remote Sens. 2012, 33, 5862–5875. [Google Scholar] [CrossRef]
  33. Wu, G.P.; Liu, Y.B. Satellite-based detection of water surface variation in China’s largest freshwater lake in response to hydro-climatic drought. Int. J. Remote Sens. 2014, 35, 4511–4558. [Google Scholar] [CrossRef]
  34. Du, Y.; Cai, S.; Zhang, X. Interpretation of the environmental change of Dongting Lake, middle reach of Yangtze River, China, by 210 Pb measurement and satellite image analysis. Geomorphology 2001, 41, 171–181. [Google Scholar]
  35. Feng, L.; Hu, C.; Chen, X. MODIS observations of the bottom topography and its inter-annual variability of Poyang Lake. Remote Sens. Environ. 2011, 35, 2729–2741. [Google Scholar] [CrossRef]
  36. Yan, D.; Schneider, U.A.; Schmid, E. Interactions between land use change, regional development, and climate change in the Poyang Lake district from 1985 to 2035. Agric. Syst. 2013, 119, 10–21. [Google Scholar] [CrossRef]
  37. Zhao, J.K.; Li, J.F.; Dai, Z.J.; Yan, H. Analysis of water exchange between river and lakes in the middle and lower Yangtze River in low flow years. J. Nat. Resour. 2011, 26, 1613–1627. [Google Scholar]
  38. Dewan, A.M.; Islam, M.M.; Kumamoto, T.; Nishigaki, M. Evaluating flood hazard for land-use planning in Greater Dhaka of Bangladesh using remote sensing and GIS techniques. Water Resour. Manag. 2007, 21, 1601–1612. [Google Scholar] [CrossRef]
  39. Sparks, R.E. Need for ecosystem management of large rivers and floodplains. Bioscience 1995, 45, 168–182. [Google Scholar] [CrossRef]
Figure 1. Geographical location of the study area: (a) China and the Yangtze River Basin; (b) Dongting Lake; and (c) Poyang Lake.
Remotesensing 08 00560 g001
Figure 2. A sketch of the methodology used to derive the WVR.
Remotesensing 08 00560 g002
Figure 3. Variations in the inundation areas of Poyang Lake and Dongting Lake during 2000–2011: (a) time series of the water inundation area; and (b) average inter-annual water inundation area.
Remotesensing 08 00560 g003
Figure 4. Mean monthly inundations in the two lakes over the period of satellite observations (solid line). The monthly means of the inundation areas were calculated from the data in Figure 4. The right Y-axis indicates the monthly rainfall within each lake (dotted line).
Remotesensing 08 00560 g004
Figure 5. (ad) Maps of the estimated multi-year mean inundation frequencies (left column) and bottom topography (right column) for the two lakes during 2000–2011.
Remotesensing 08 00560 g005
Figure 6. Variations in the inundation areas as a function of mean inundation frequency for Poyang Lake and Dongting Lake during 2000–2011.
Remotesensing 08 00560 g006
Figure 7. Maps of the evolution of the mean inundation frequency for the two lakes during the different water regime periods: (ad) Poyang Lake in the low-water, rising, high-water and retreating periods, respectively; and (eh) Dongting Lake in the low-water, rising, high-water and retreating periods, respectively.
Remotesensing 08 00560 g007
Figure 8. Spatial distributions of the water variation rates of water inundation in the two lakes. Variations in the water surface of: Poyang Lake (ad); and Dongting Lake (eh) during the low-water to rising period, rising to high-water period, high-water to retreating period, and retreating to low-water period, respectively. Water expansion is shown in blue, and water shrinkage is shown in red.
Remotesensing 08 00560 g008

