Article

Evaluation of IMERG and TRMM 3B43 Monthly Precipitation Products over Mainland China

1
Collaborative Innovation Center of Yellow River Civilization, Henan University, Kaifeng 475001, China
2
Key Laboratory of Geospatial Technology for the Middle and Lower Yellow River Regions, Ministry of Education, Henan University, Kaifeng 475001, China
3
State Key Laboratory of Information Engineering in Surveying, Mapping and Remote Sensing, Wuhan University, Wuhan 430079, China
4
Collaborative Innovation Centre of Geospatial Technology, Wuhan 430079, China
*
Authors to whom correspondence should be addressed.
Remote Sens. 2016, 8(6), 472; https://doi.org/10.3390/rs8060472
Submission received: 27 February 2016 / Revised: 23 May 2016 / Accepted: 27 May 2016 / Published: 2 June 2016

Abstract

:
As the successor of the Tropical Rainfall Measuring Mission (TRMM), the Global Precipitation Measurement (GPM) mission significantly improves the spatial resolution of precipitation estimates from 0.25° to 0.1°. The present study analyzed the error structures of Integrated Multisatellite Retrievals for GPM (IMERG) monthly precipitation products over Mainland China from March 2014 to February 2015 using gauge measurements at multiple spatiotemporal scales. Moreover, IMERG products were also compared with TRMM 3B43 products. The results show that: (1) overall, IMERG can capture the spatial patterns of precipitation over China well. It performs a little better than TRMM 3B43 at seasonal and monthly scales; (2) the performance of IMERG varies greatly spatially and temporally. IMERG performs better at low latitudes than at middle latitudes, and shows worse performance in winter than at other times; (3) compared with TRMM 3B43, IMERG significantly improves the estimation accuracy of precipitation over the Xinjiang region and the Qinghai-Tibetan Plateau, especially over the former where IMERG increases Pearson correlation coefficient by 0.18 and decreases root-mean-square error by 54.47 mm for annual precipitation estimates. However, most IMERG products over these areas are unreliable; and (4) IMERG shows poor performance in winter as TRMM 3B43 even if GPM improved its ability to sense frozen precipitation. Most of them over North China are unreliable during this period.

1. Introduction

The availability of reliable and accurate precipitation data at regional and global scales is critical to the applications of meteorology, hydrology, and water resources management [1,2,3]. Precipitation exhibits small-scale variability and highly non-normal statistical behavior that requires frequent, closely spaced observations for adequate data representation. However, conventional rain gauge measurements are relatively scarce and poorly distributed over the globe, especially in oceanic, remote, or developing regions. In recent decades, the rapid development of remote sensing technology has brought an unprecedented opportunity for better estimating precipitation than before. A series of satellite-derived global precipitation datasets have been developed, such as the Climate Precipitation Center morphing method [4], Precipitation Estimation from Remotely Sensed Information using Artificial Neural Networks [5], the Global Satellite Mapping of Precipitation Project [6], and TRMM Multi-Satellite Precipitation Analysis (TMPA) [7] products. Among these datasets, TMPA products, which have a relatively high level of accuracy, have been used widely [8,9,10,11,12,13,14,15].
On 27 November 1997, the United States National Aeronautics and Space Administration (NASA) and the Japan Aerospace Exploration Agency (JAXA) joined forces to launch the Tropical Rainfall Measuring Mission (TRMM) satellite. So far, the TMPA algorithm has undergone three major improvements, with the V5, V6, and V7 products released in 2005, 2009, and 2012, respectively. Two types of TMPA products have been created: (1) the 3 h, real-time, gridded precipitation products covers the global latitude belt from 60°N to 60°S; and (2) gauge-adjusted, post-real-time research products (3B42 and 3B43) cover the latitude belt from 50°N to 50°S. TRMM 3B42 and TRMM 3B43 are 3 h and monthly precipitation products, respectively. Satellite-derived precipitation data contains much uncertainty because it estimates precipitation indirectly, and depends on the properties of cloud tops and path-integrated hydrometeor content; therefore, characterizing its error structure creates a major issue related to the usefulness of these estimates [16,17]. Many previous studies have reported on the error and uncertainty characteristics of TMPA products [7,18,19,20,21,22,23,24,25,26,27,28,29]. These efforts both benefited the data users and helped developers improve the retrieval algorithms.
After 17 years, the TRMM came to an end. The NASA and JAXA stopped TRMM’s science operations and data collection on 8 April 2015 after the spacecraft depleted its fuel reserves. As the successor to the TRMM, the Global Precipitation Measurement (GPM) Core Observatory satellite was launched on 27 February 2014 and is setting new standards for precipitation measurements worldwide. The GPM Core Observatory carries a dual-frequency precipitation radar (the Ku-band at 13.6 GHz and Ka-band at 35.5 GHz) and a conical-scanning multichannel GPM Microwave Imager (frequencies range between 10 and 183 GHz). These sensors extend the measurement range attained by TRMM to include precipitation of light intensity as well as falling snow, which accounts for a significant fraction of precipitation falling in the middle and high latitudes. The newly-released Integrated MultisatellitE Retrievals for GPM (IMERG) [30] products provide better spatial resolution (0.1°) and quasi-global coverage (60°N–60°S at present and to be expanded to 90°N–90°S in future releases) than current TMPA products.
As a next-generation precipitation product, IMERG is early in the development and evaluation cycle. Huffman et al. [31] provided a preliminary comparison between the IMERG and TMPA monthly precipitation products for June 2014. Liu [32] continued their work to make a comparison for the boreal summer (June, July, and August) of 2014 and the boreal winter (December, January, and February) of 2015. Nevertheless, these results only show the similarity and differences between IMERG and TRMM 3B43 products. Actually, the accuracy of satellite precipitation estimates is seriously influenced by climate and topography, so it is quite desirable to evaluate the absolute accuracy and error characteristics of IMERG products worldwide by comparing them against precipitation gauge measurements. This effort will greatly benefit hydrology and climatology researchers. As the typical representative of global climate and topography, China, which covers a wide range in terms of latitude, longitude, and elevation, has extremely complex topography and diverse climates, which leads to a dramatic variety in the spatial distribution of precipitation. Therefore, it is important to validate the accuracy of IMERG products over China.
In this study, both IMERG and TRMM 3B43 monthly precipitation products over Mainland China were validated with gauge measurements at multiple spatiotemporal scales. The main objectives are as follows: (1) to analyze the spatiotemporal error structures of IMERG products over Mainland China; and (2) explore the continuity and differences between IMERG and TRMM 3B43 products at a 0.25° spatial resolution. One year of data (March 2014 to February 2015) was used, during which both TRMM and GPM were operational. This analysis provides useful guidance for the application of IMERG data in China and is helpful for IMERG algorithm development and improvement in the future.

2. Study Area and Data
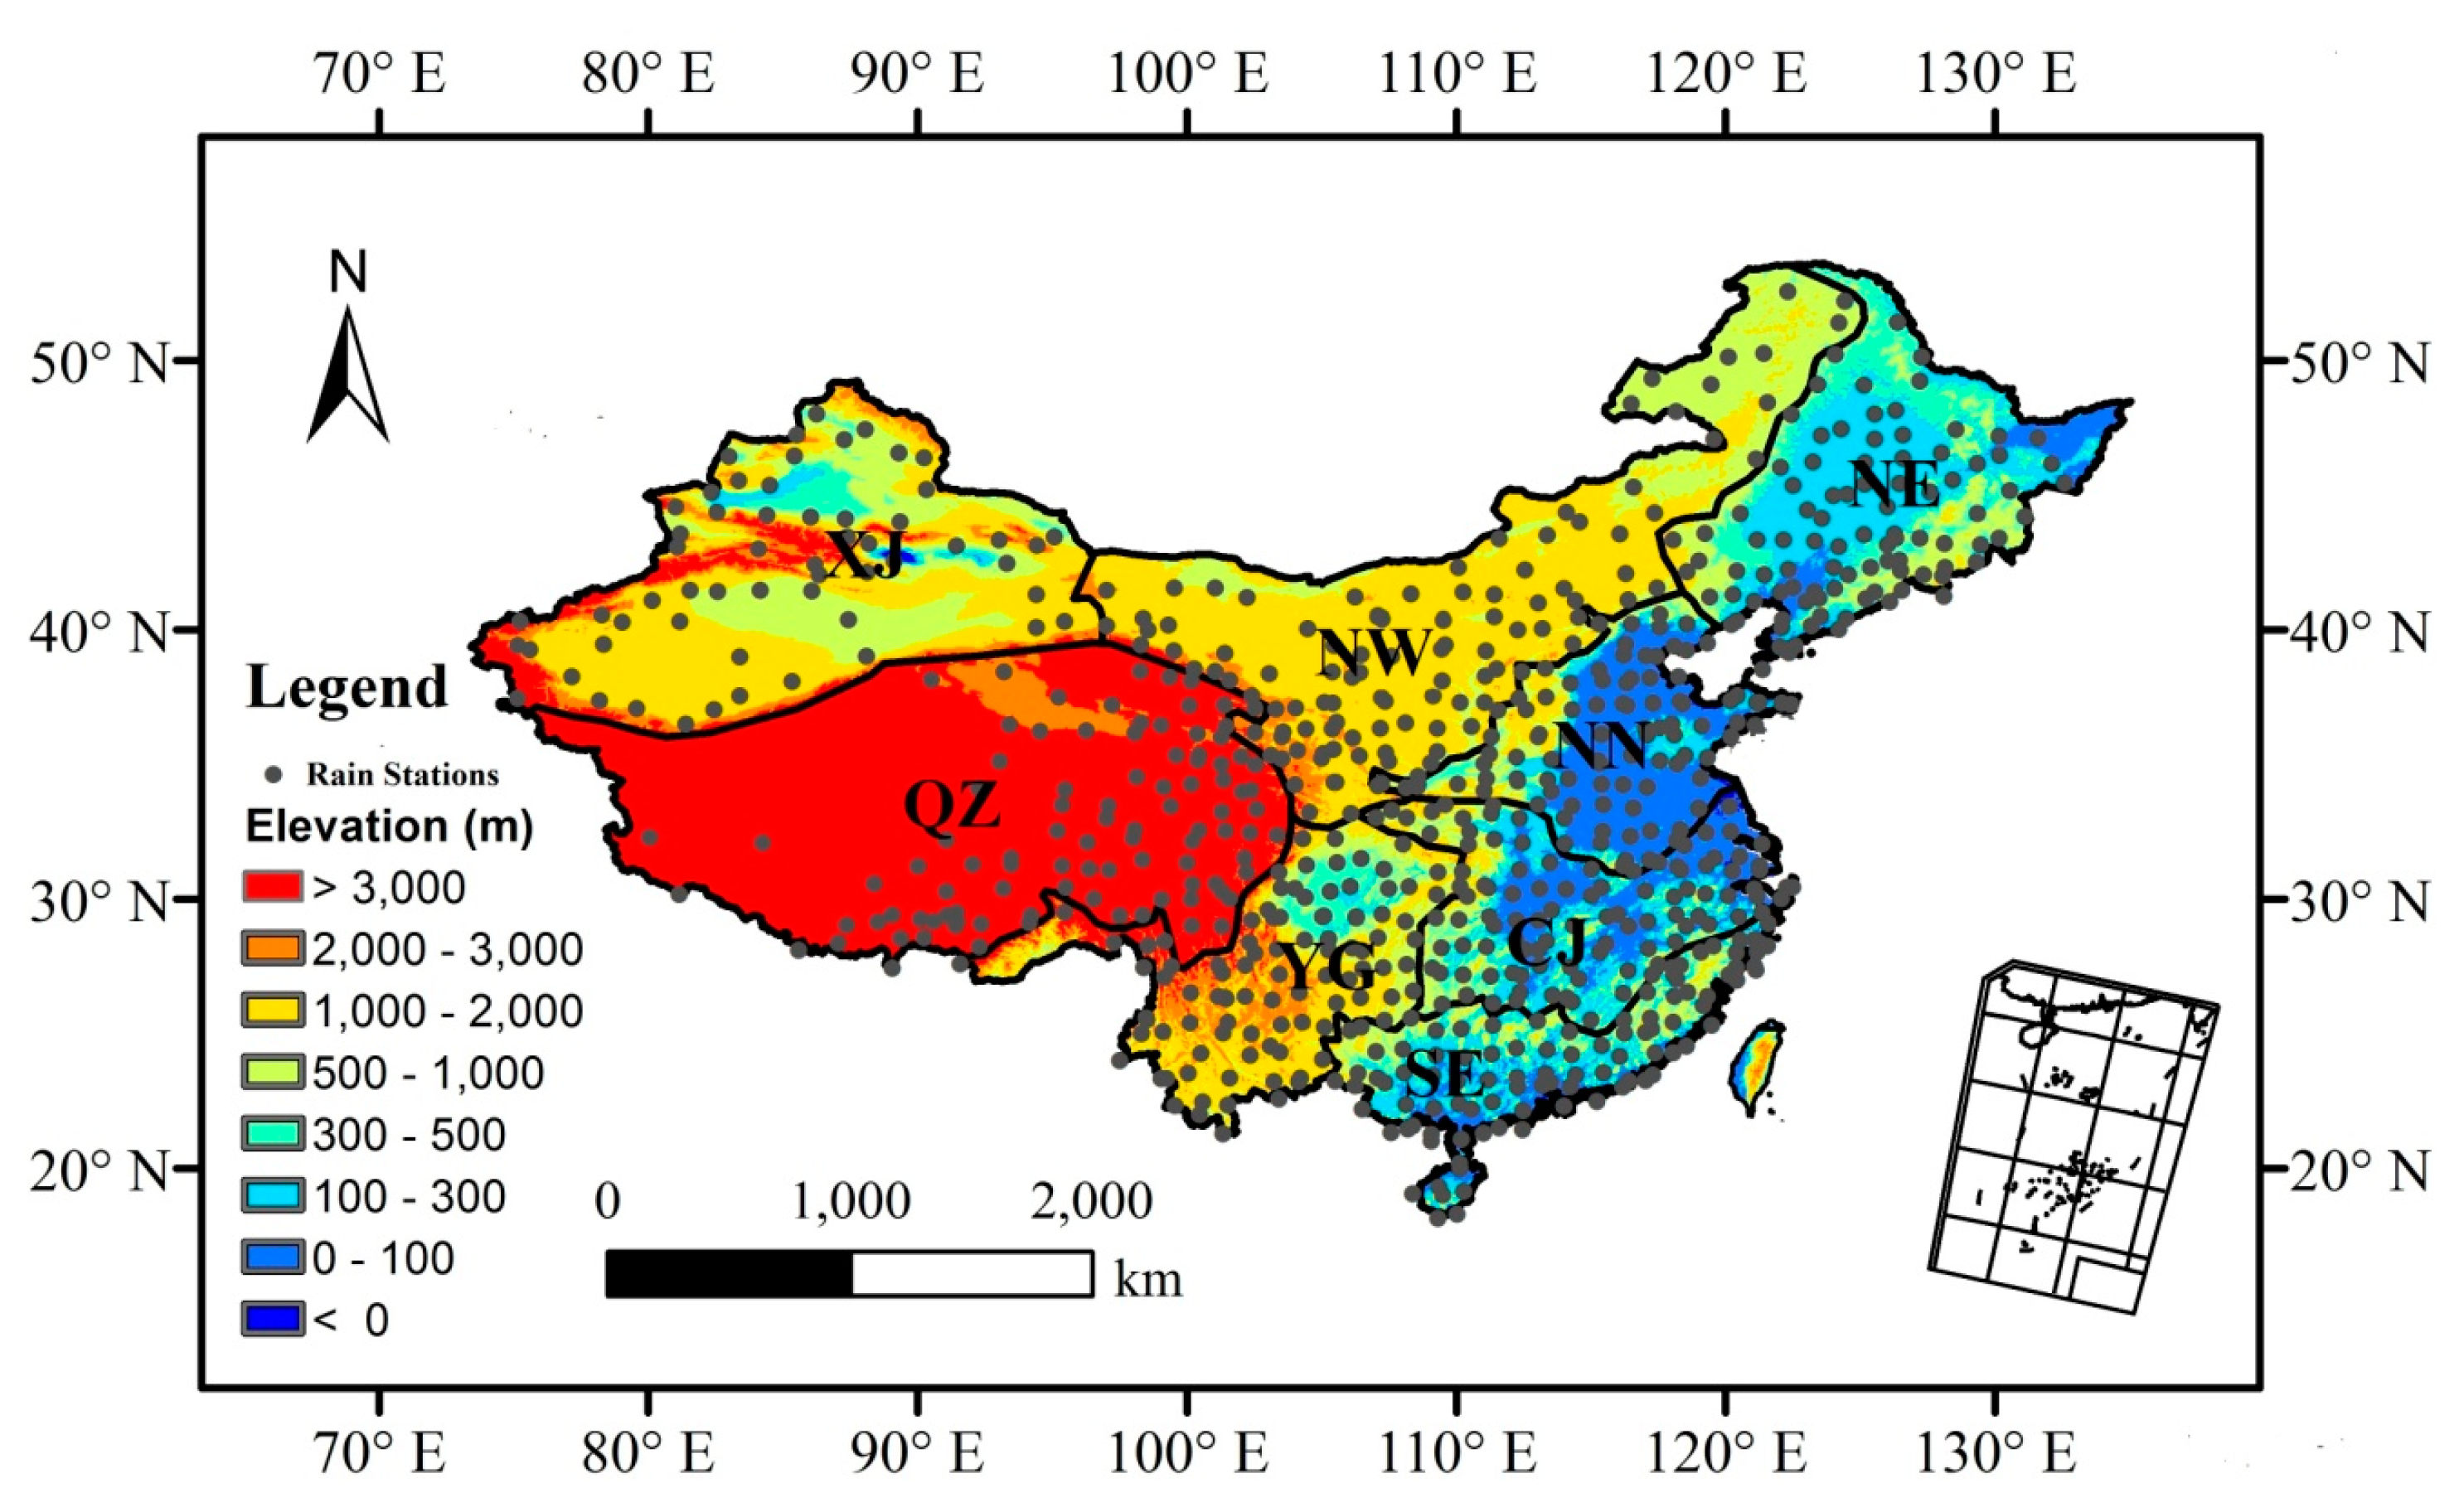
2.1. Study Area

China, located in eastern Asia, covers an area of approximately 9.6 million km2. China features a wide range of climatic patterns, ranging from tropical in the far south to subarctic in the far north and to alpine in the higher elevations of the Tibetan Plateau. The annual precipitation gradually decreases from the southeast to the northwest with an exception in the Qinghai-Tibetan Plateau because of the complexity of the terrain there. In this study, Mainland China is divided into eight sub-regions based on elevation, the distribution of annual precipitation, and mountain ranges (Figure 1) as follows: the Xinjiang region (XJ), the Qinghai-Tibetan Plateau (QZ), Northwestern China (NW), Northeastern China (NE), Northern China (NN), the southwest Yungui Plateau (YG), the plain region of Changjiang (Yangtze) River (CJ), and Southeastern China (SE). XJ is characterized by the arid-semiarid climate with little precipitation over the whole year. The climate of QZ is dictated by the plateau mountain climate with complex topography and high elevation. NW is mainly influenced by the temperate continental climate. NE and NN are primarily controlled by the monsoon climate of medium latitudes. YG, CJ, and SE are dominated by the subtropical monsoon climate.
Monsoon winds [33,34,35] strongly affect seasonal climatic changes. The rainy season mainly occurs from May to September. Southeast and southwest monsoons from the western Pacific Ocean and the equatorial Indian Ocean, respectively, bring a large amount of humid air and deliver the vast majority of the annual precipitation to most of China. The rainy season begins in April and May in the southern provinces of Guangdong, Guangxi, and Hainan. In June, the precipitation moves northward while South China receives additional precipitation with the poetic name, plum-rain weather. The rainy season enters the northern part of the country in July and August, ending in September, and by October the monsoons gradually retreat from Chinese land. Conversely, the Siberian anticyclone dominates in winter and brings cold, dry conditions to much of the country.

2.2. Satellite Precipitation Products

TRMM monitored tropical rainfall as a joint space mission between the NASA and JAXA. Five instruments were on board: the precipitation radar (PR), the TRMM Microwave Imager (TMI), a visible and infrared scanner, the Clouds and Earth’s Radiant Energy Sensor, and a lightning imaging sensor. PR is a more direct measure of rainfall; however, because it operates at a single frequency (13.8 GHz), the estimates of rain rate require careful interpretation. TMI is a passive detector (radiometer) with nine channels: horizontal and vertical polarizations at 10.7, 19.4, 37.0, and 85.5 GHz and only vertical polarization at 21.3 GHz. So far, several precipitation retrieval algorithms have been developed [36,37]. At present, the best estimate of precipitation at fine spatial resolution of 0.25° for the areas between 50°S and 50°N is produced by the TMPA; this algorithm is designed to combine precipitation estimates from various satellite systems, as well as land surface precipitation gauge analyses when possible [7,38]. For this study, the Version 7 TRMM 3B43 monthly precipitation products from March 2014 to February 2015 were downloaded from the TRMM webpage [39]. Monthly data were accumulated to generate the seasonal and annual precipitation estimates.
GPM, the successor of TRMM, has made three critical improvements [40]. First, the orbital inclination has been increased from 35° to 65°, affording coverage of important additional climate zones. Second, the radar has been upgraded to two frequencies, adding sensitivity to light precipitation. Third, “high-frequency” channels (165.5 and 183.3 GHz) have been added to the passive microwave sensor imager, which should facilitate the sensing of light and solid precipitation. IMERG is the Level 3 precipitation estimation algorithm of GPM, which is intended to intercalibrate, merge, and interpolate all satellite microwave precipitation estimates, together with microwave-calibrated infrared satellite estimates, precipitation gauge analyses, and potentially other precipitation estimators at fine time and space scales. The observation interval for GPM is 30 min instead of the 3 h interval for TRMM; therefore, higher temporal precipitation products such as 30 min can be generated. This can greatly benefit some precipitation process studies and applications (flooding, landslide) that need highly frequent precipitation information. Moreover, GPM describes the precipitation process better than TRMM because it attains more samples of precipitation. In this study, the “Final Run” of IMERG monthly precipitation products were used and downloaded from the GPM webpage [41]. The “Final Run” IMERG which combines monthly precipitation gauge analyses is the post-real time research product in the IMERG suite of products, providing more accurate results in regions than others.

2.3. Precipitation Gauge Measurements

The monthly precipitation gauge measurements for this period were collected from more than 750 automatic meteorological stations of the China Meteorological Administration (CMA). The measurements of precipitation are monitored 24 times a day. All data were compiled by the National Meteorological Information Center and subjected to a series of quality controls including examining extreme values and internal consistency check, and removal of questionable data [42,43]. They were downloaded from the website of CMA [44]. Figure 1 shows the spatial distribution of meteorological stations. The stations are distributed sparsely in the western mountains and deserts of China but are considerably denser at low elevations in the east.

3. Methodology

Many previous studies [18,45,46,47,48,49] have used gauge measurements to validate the accuracy of TMPA products. In this study, the error characteristics of IMERG monthly precipitation products over Mainland China were evaluated using gauge measurements at multiple spatiotemporal scales. Moreover, in order to explore the continuity and differences between IMERG and TRMM 3B43 products, IMERG products were regridded by using ENVI software to a spatial resolution of 0.25° (hereafter referred to as “R-IMERG”) to be spatially consistent with TRMM 3B43 datasets. Three-month accumulations: December to February (winter), March to May (spring), June to August (summer), and September to November (autumn) provided information for the seasonal analyses. The annual precipitation estimates were generated by accumulating all 12 monthly data sets.
Statistical evaluation metrics include the following: the Pearson correlation coefficient (r), root-mean-square error (RMSE), the Bias divided by the reference (RB), and relative RMSE (RRMSE) [49,50]. The r measures how well the estimated values correspond to the observed values (Equation (1)). The RMSE is a commonly used measure of the differences between the observed precipitation and the estimated precipitation (Equation (2)). The smaller the numerical value of RMSE is, the closer the observed values are to the precipitation estimations. The RB measures the average tendency of the estimated data to be over- or under-estimated versus observed data (Equation (3)). The RRMSE evaluated the reliability of precipitation estimates in the different regions under consideration of their geographical and seasonal variations (Equation (4)). When the RRMSE value is less than 50%, such estimates are considered to be reliable. Conversely, when the RRMSE is equal to or higher than 50%, the estimates are considered to be unreliable for the region and particular season.
r = i = 1 n ( p i o p ¯ o ) ( p i e p ¯ e ) i = 1 n ( p i o p ¯ o ) 2 i = 1 n ( p i e p ¯ e ) 2
R M S E = i = 1 n ( p i o p i e ) 2 n
R B = i = 1 n ( p i o p i e ) i = 1 n p i o × 100 %
R R M S E = i = 1 n ( p i o p i e ) 2 n p ¯ o × 100 %
where p i o and p i e are observed and estimated precipitation, respectively; p ¯ o and p ¯ e are the means of observed and estimated precipitation, respectively; and n is the total number of stations.

4. Results and Discussion

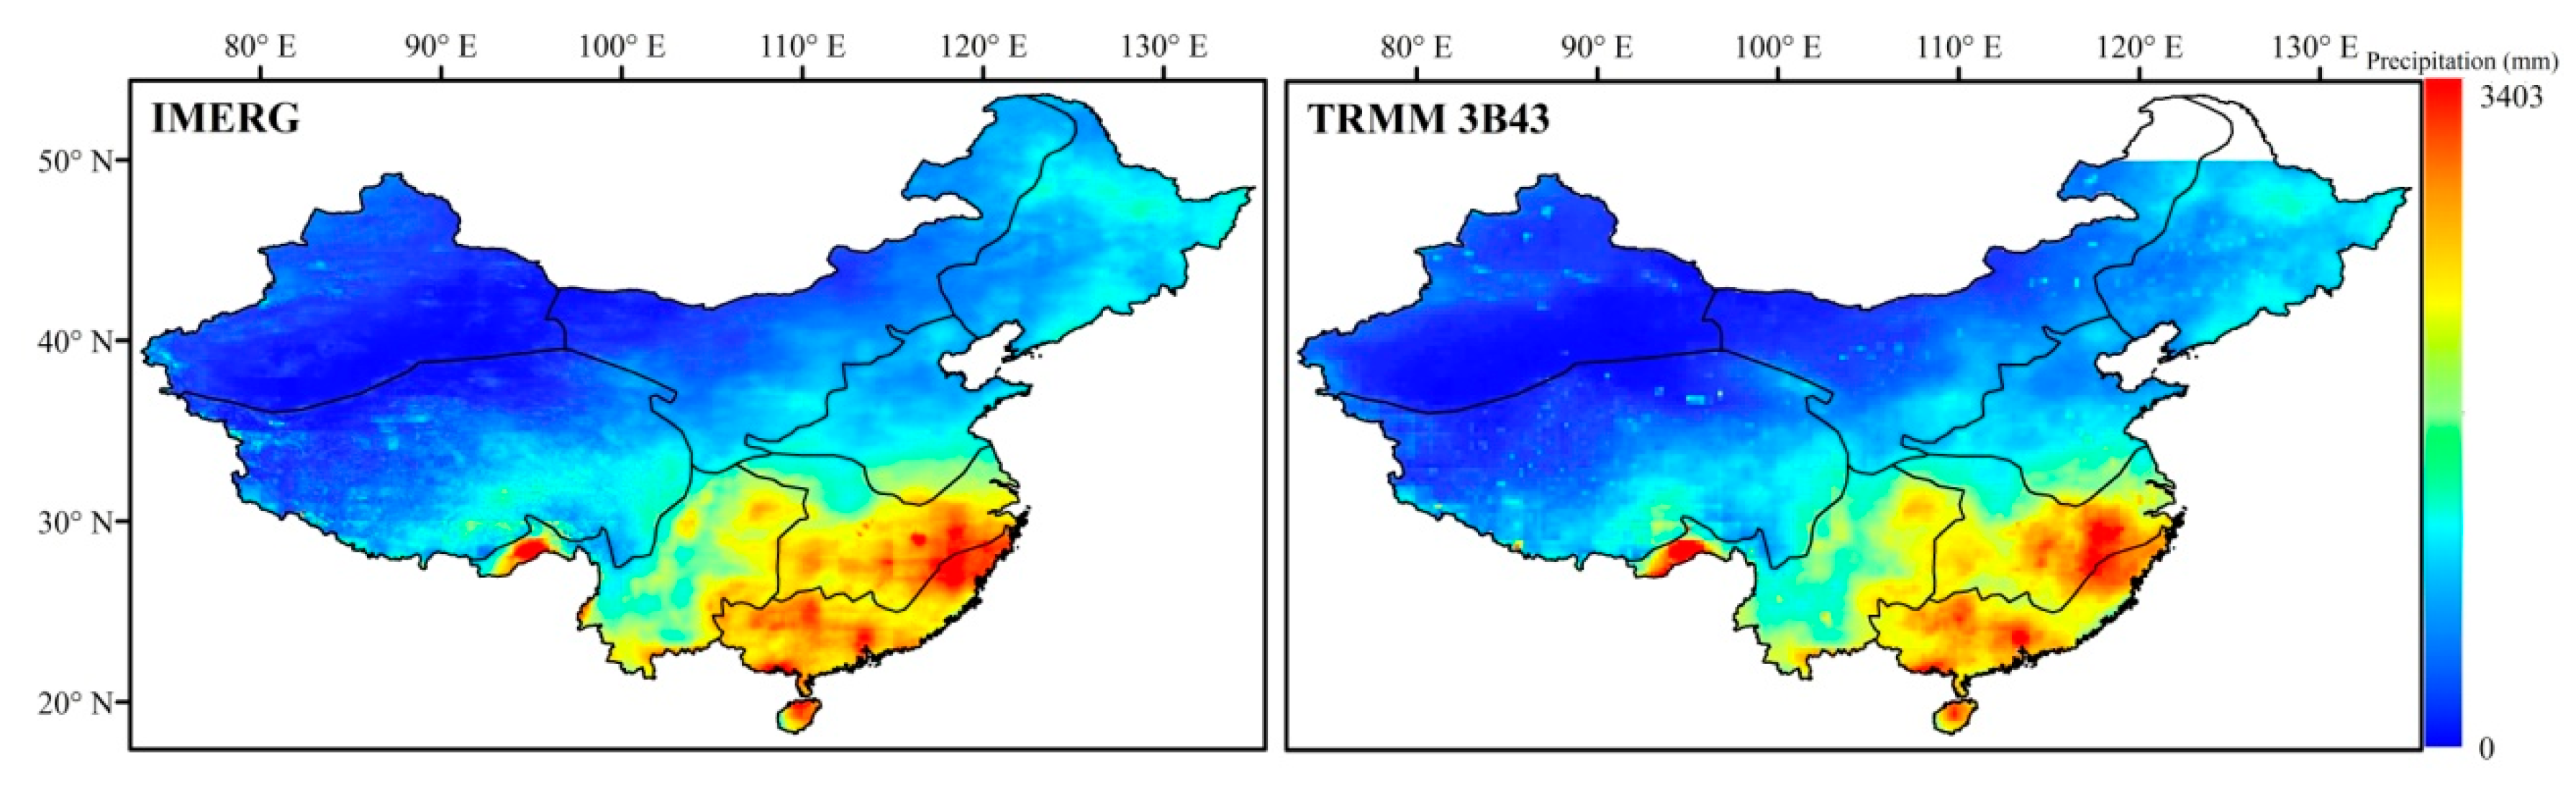
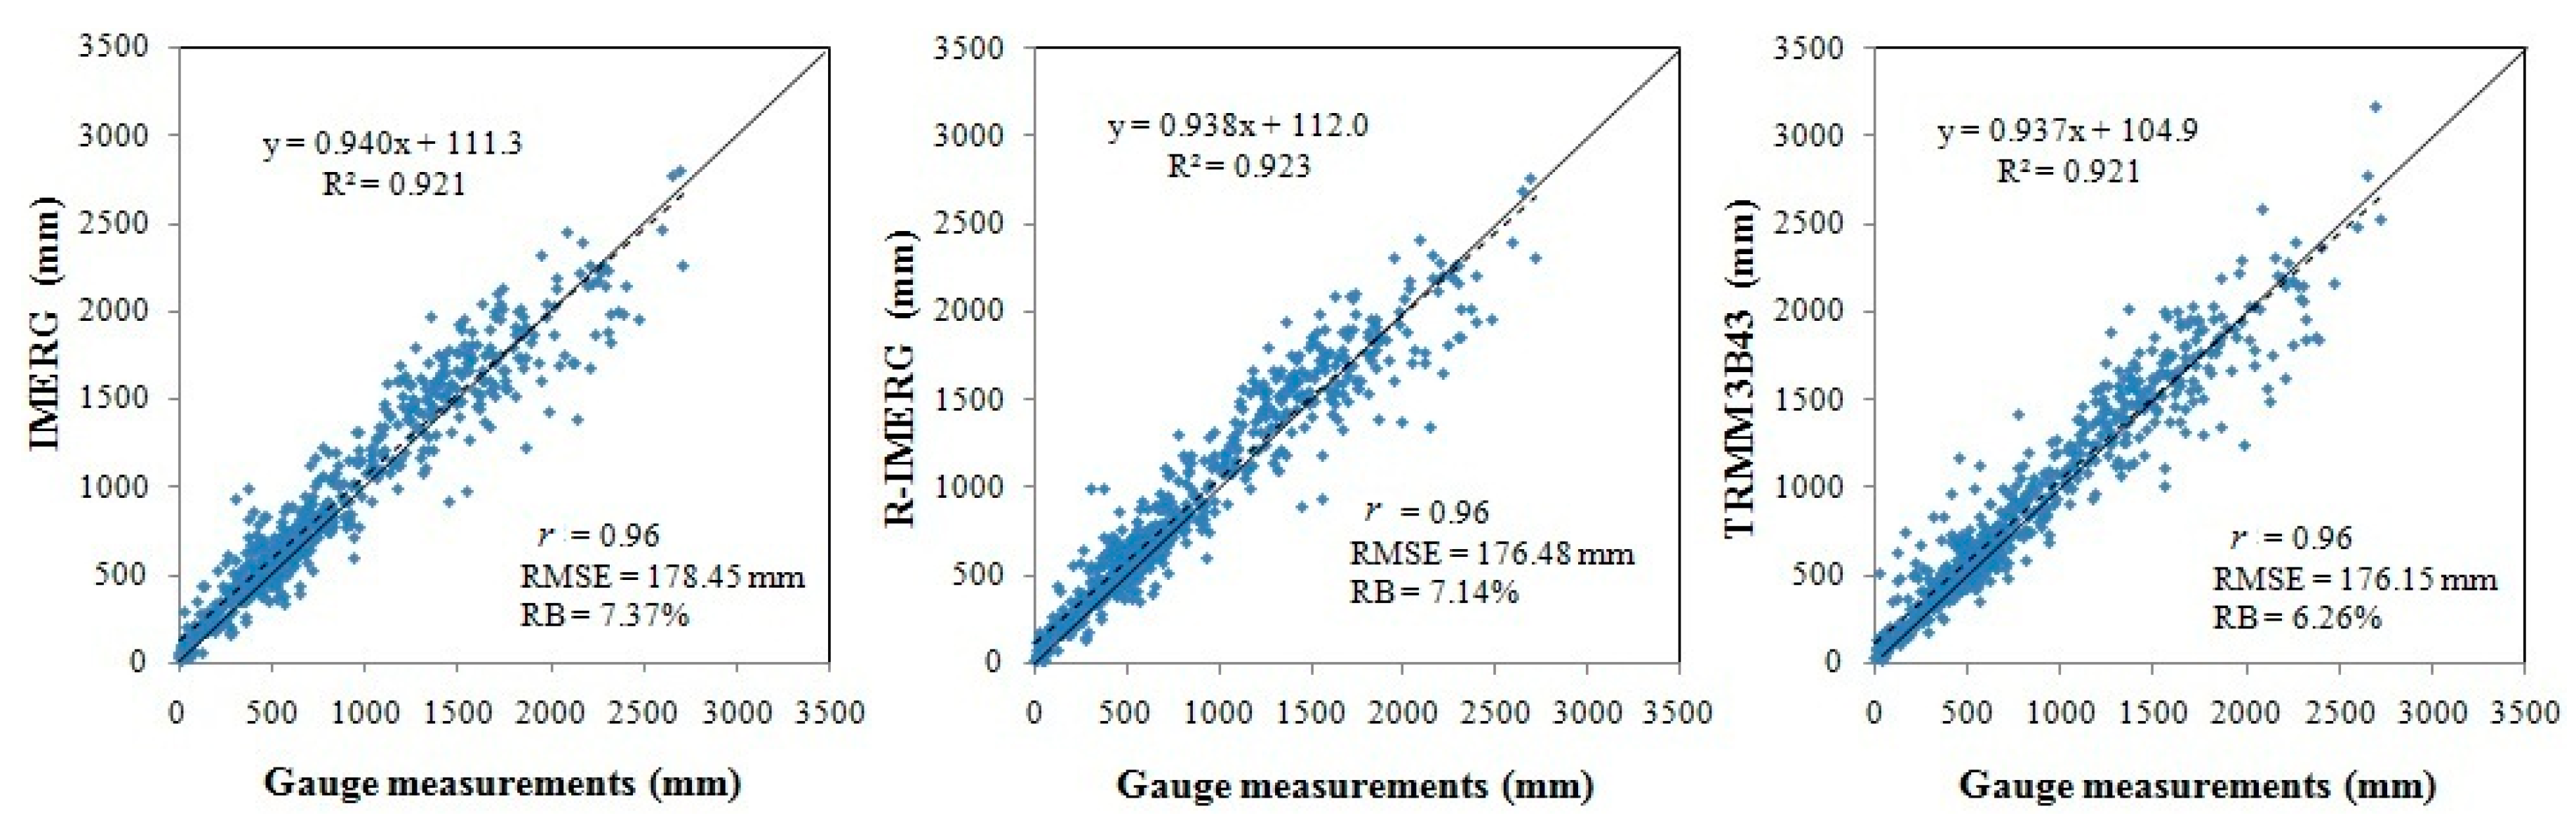
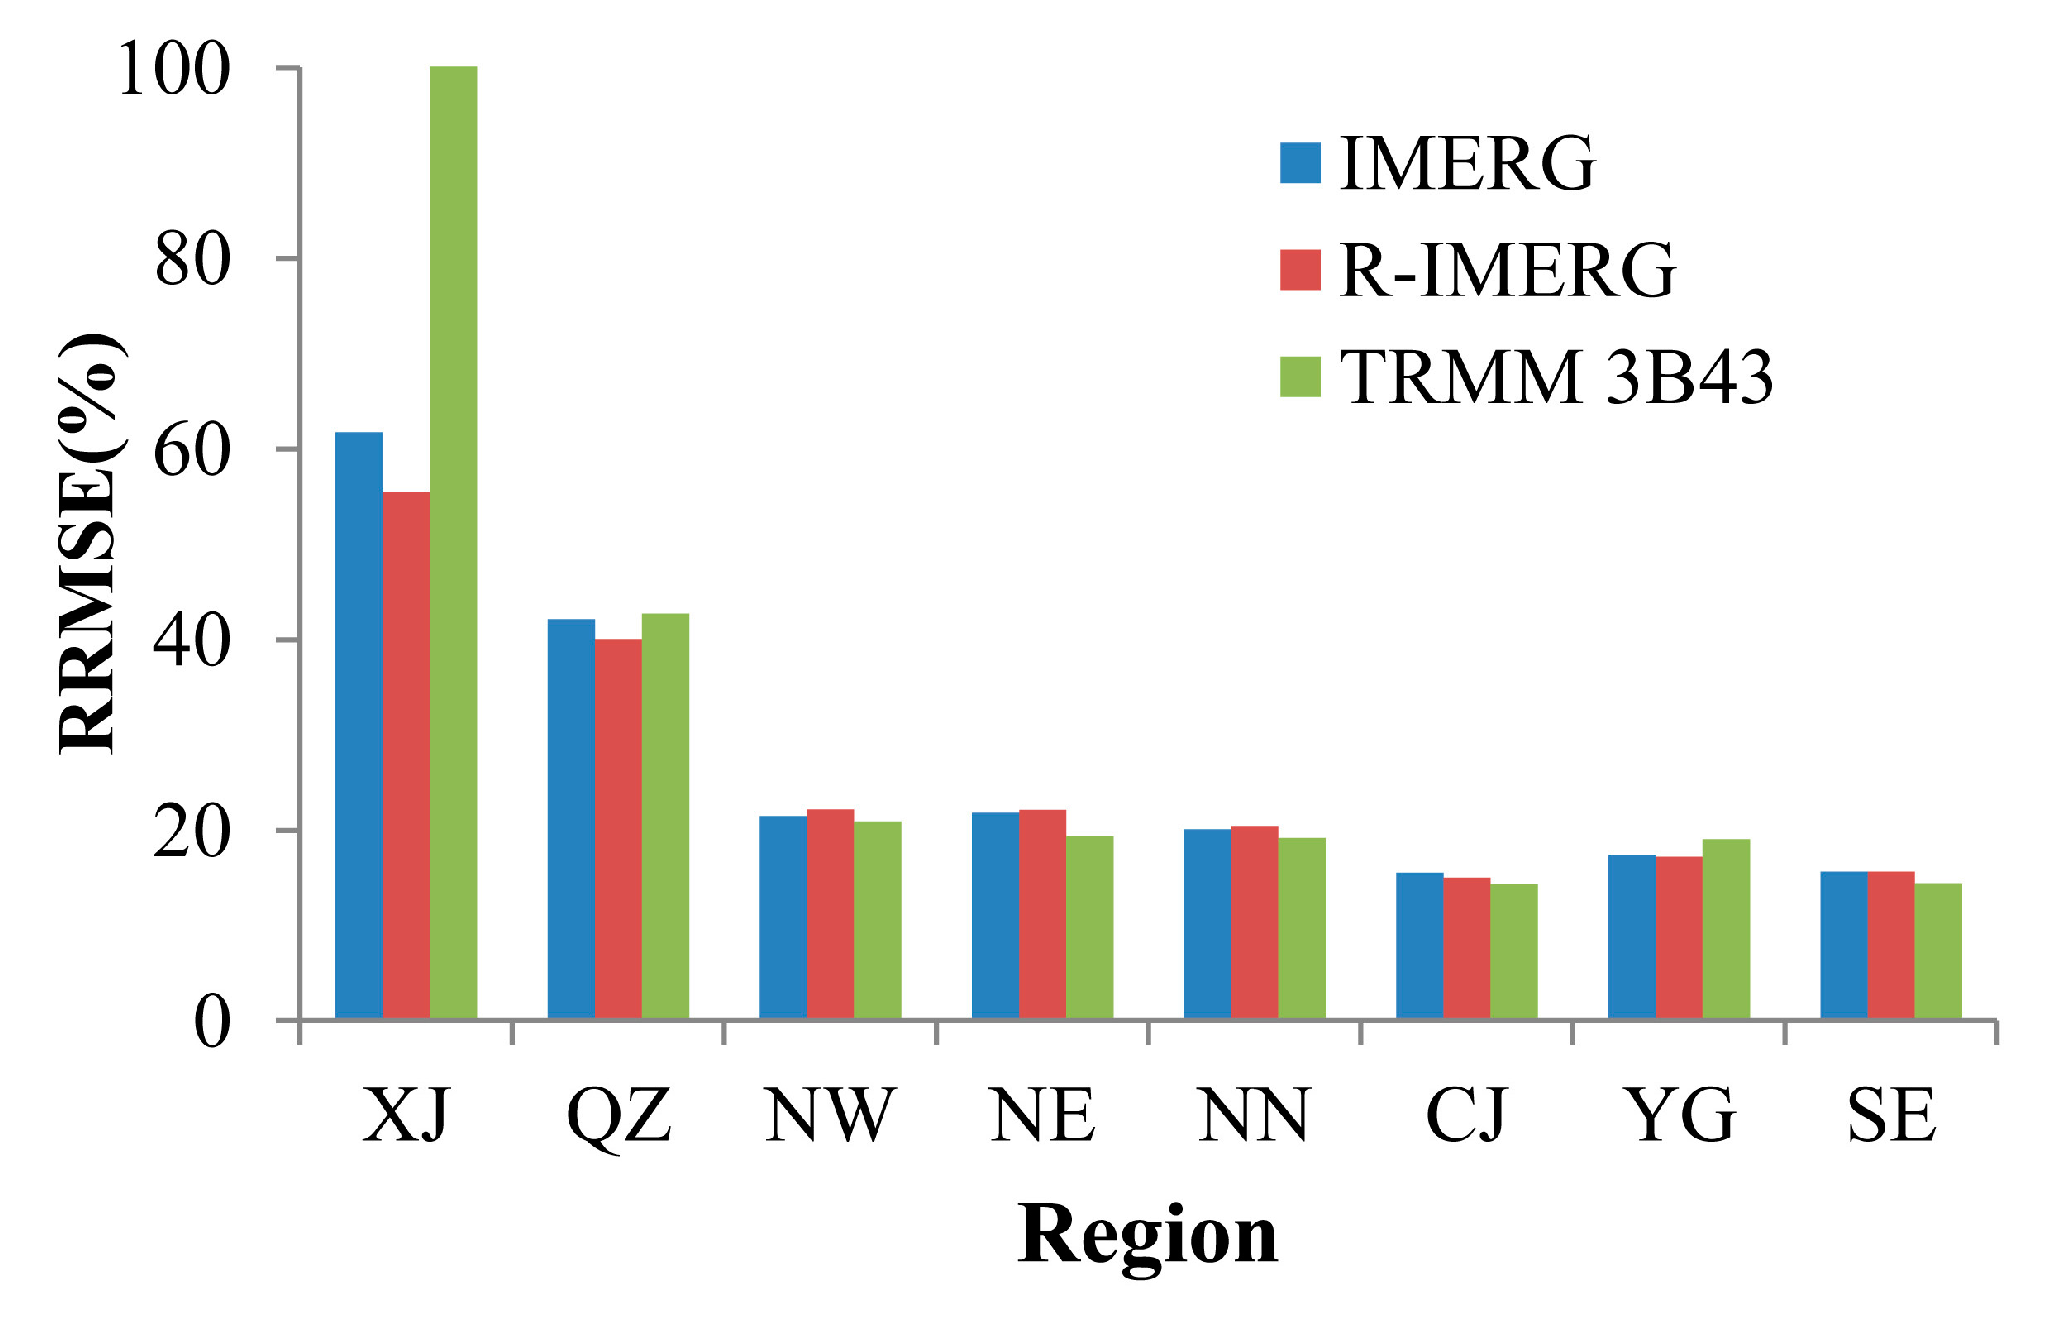
4.1. Evaluation at Annual Scale

Figure 2 shows annual precipitation estimates derived from IMERG and TRMM 3B43 products over Mainland China. Both sets of data share a similar spatial pattern: precipitation increases from northwest (<200 mm) to southeast (>1000 mm), indicating that the characteristics of precipitation vary with longtitude, latitude and elevation. However, the two sets of data contain notable difference. Obviously, IMERG products can provide many more spatial details related to precipitation than TRMM 3B43 products. In North China, TRMM 3B43 creates many isolated grid boxes of anomalous overestimation; Chen [25] reported similar findings based on the TRMM 3B42 dataset. As the interval of observation improved from 3 h for TRMM to 30 min for GPM, many more samples of precipitation were attained by IMERG, so many data can efficiently decrease the power of certain anomalous value. Thus, isolated grid boxes cannot be seen in IMERG precipitation estimates. IMERG data shows more precipitation than TRMM 3B43 data in CJ and SE but less precipitation in QZ and XJ.
The annual precipitation estimates derived from IMERG, R-IMERG, and TRMM 3B43 products are plotted against gauge measurements over the entire extent of Mainland China (Figure 3). Generally, IMERG products perform well, with a high r value of 0.96, a small RMSE of 178.45 mm, and a low RB of 7.3%. Compared with TRMM 3B43 data, R-IMERG precipitation estimates have stronger agreement with gauge measurements, while their RMSE value (176.48 mm) is a little larger; therefore, the two sets of data are regarded as having the same accuracy for annual precipitation estimates. Note that all three products (IMERG, R-IMERG, and TRMM 3B43) show rather small overestimation. However, RB of IMERG is a little larger than that of TRMM 3B43.
Except in NE, QZ and XJ, the agreements between annual precipitation estimates and gauge measurements over sub-regions become stronger from south to north (Table 1). Specifically, the r values for IMERG, R-IMERG, and TRMM 3B43 data increase from 0.79, 079, and 0.82 in SE to 0.93, 0.93, and 0.92 in NW. In contrast, RMSEs decrease from SE to NW. IMERG shows better performance than TRMM 3B43 in XJ and YG because GPM improves its ability to detect light rain, for example, R-IMERG increases r value by 18% and decrease RMSE by 54.47 mm in XJ when compared with TRMM 3B43; however, in the other sub-regions they show the same level of accuracy. Among all sub-regions, IMERG, R-IMERG, and TRMM 3B43 data all have the poorest correlation with gauge measurements in XJ and QZ. XJ experiences an arid and semi-arid climate, and includes the Taklamakan Desert, the largest desert in China; therefore, when sensors onboard the satellites detect the precipitation, the precipitation might partially or totally evaporate before reaching ground during the warm season [51,52]. In terms of QZ, the possible reason for this poor correlation is that most of this region stands at high elevations (over 4000 m). Many previous studies had revealed that TMPA products perform poorly in mountainous area [25,53,54]. These factors also lead to greater overestimation of annual precipitation across QZ and XJ than that in other regions.
Figure 4 demonstrates the RRMSE values of annual precipitation estimates over the eight sub-regions. RRMSEs are all over 50% in XJ but less than 50% in other regions; especially in CJ and SE, values are less than 20%. These findings indicate IMERG, R-IMERG, and TRMM 3B43 products can provide reliable annual precipitation estimates over Mainland China with the exception of data for XJ. Generally, the precipitation estimates are reliable or unreliable where the mean precipitation is high or low, respectively. This is because RMSE varies non-linearly with mean rain rate [55]. Thus, the RRMSE becomes large when the mean rain rate is small. Franchito et al. [47] also reported the similar finding. As a result, although all three products show low RMSEs in XJ (Table 1), their RRMSEs are highest because annual mean precipitation in this region is lowest among all regions. Conversely, despite three products have large RMSEs in SE (e.g., 246.69 mm for TRMM 3B43 products), these data are reliable because of this region’s highest annual mean precipitation

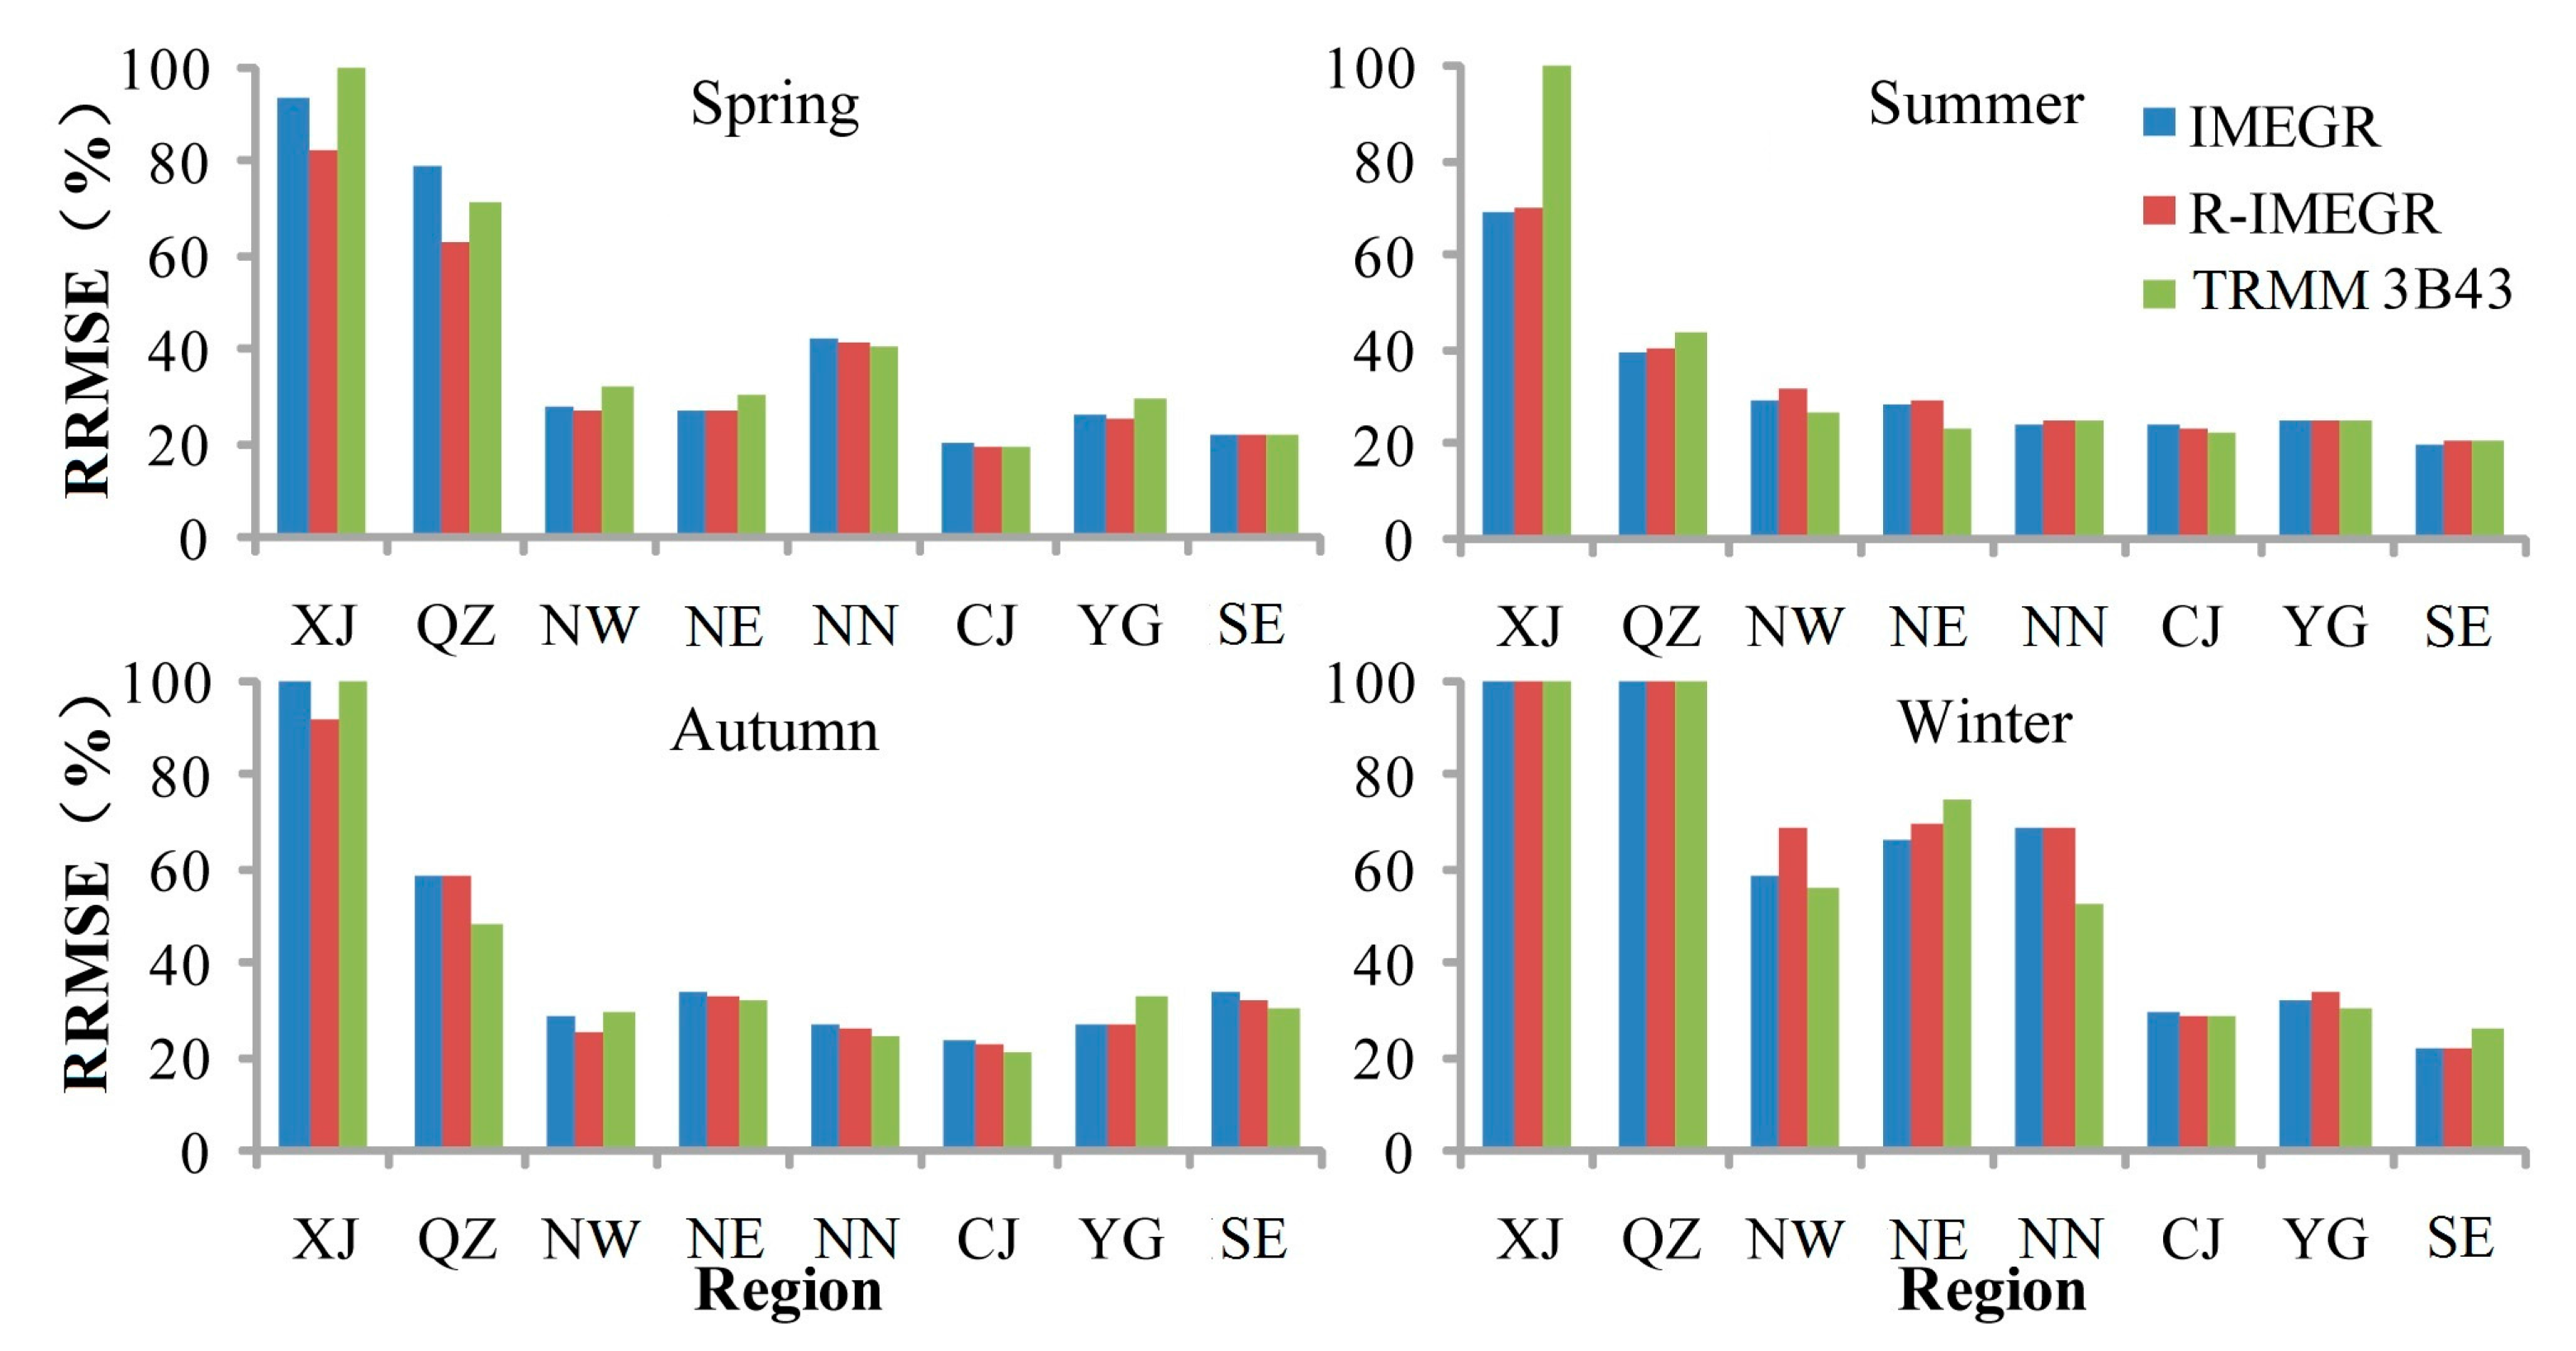
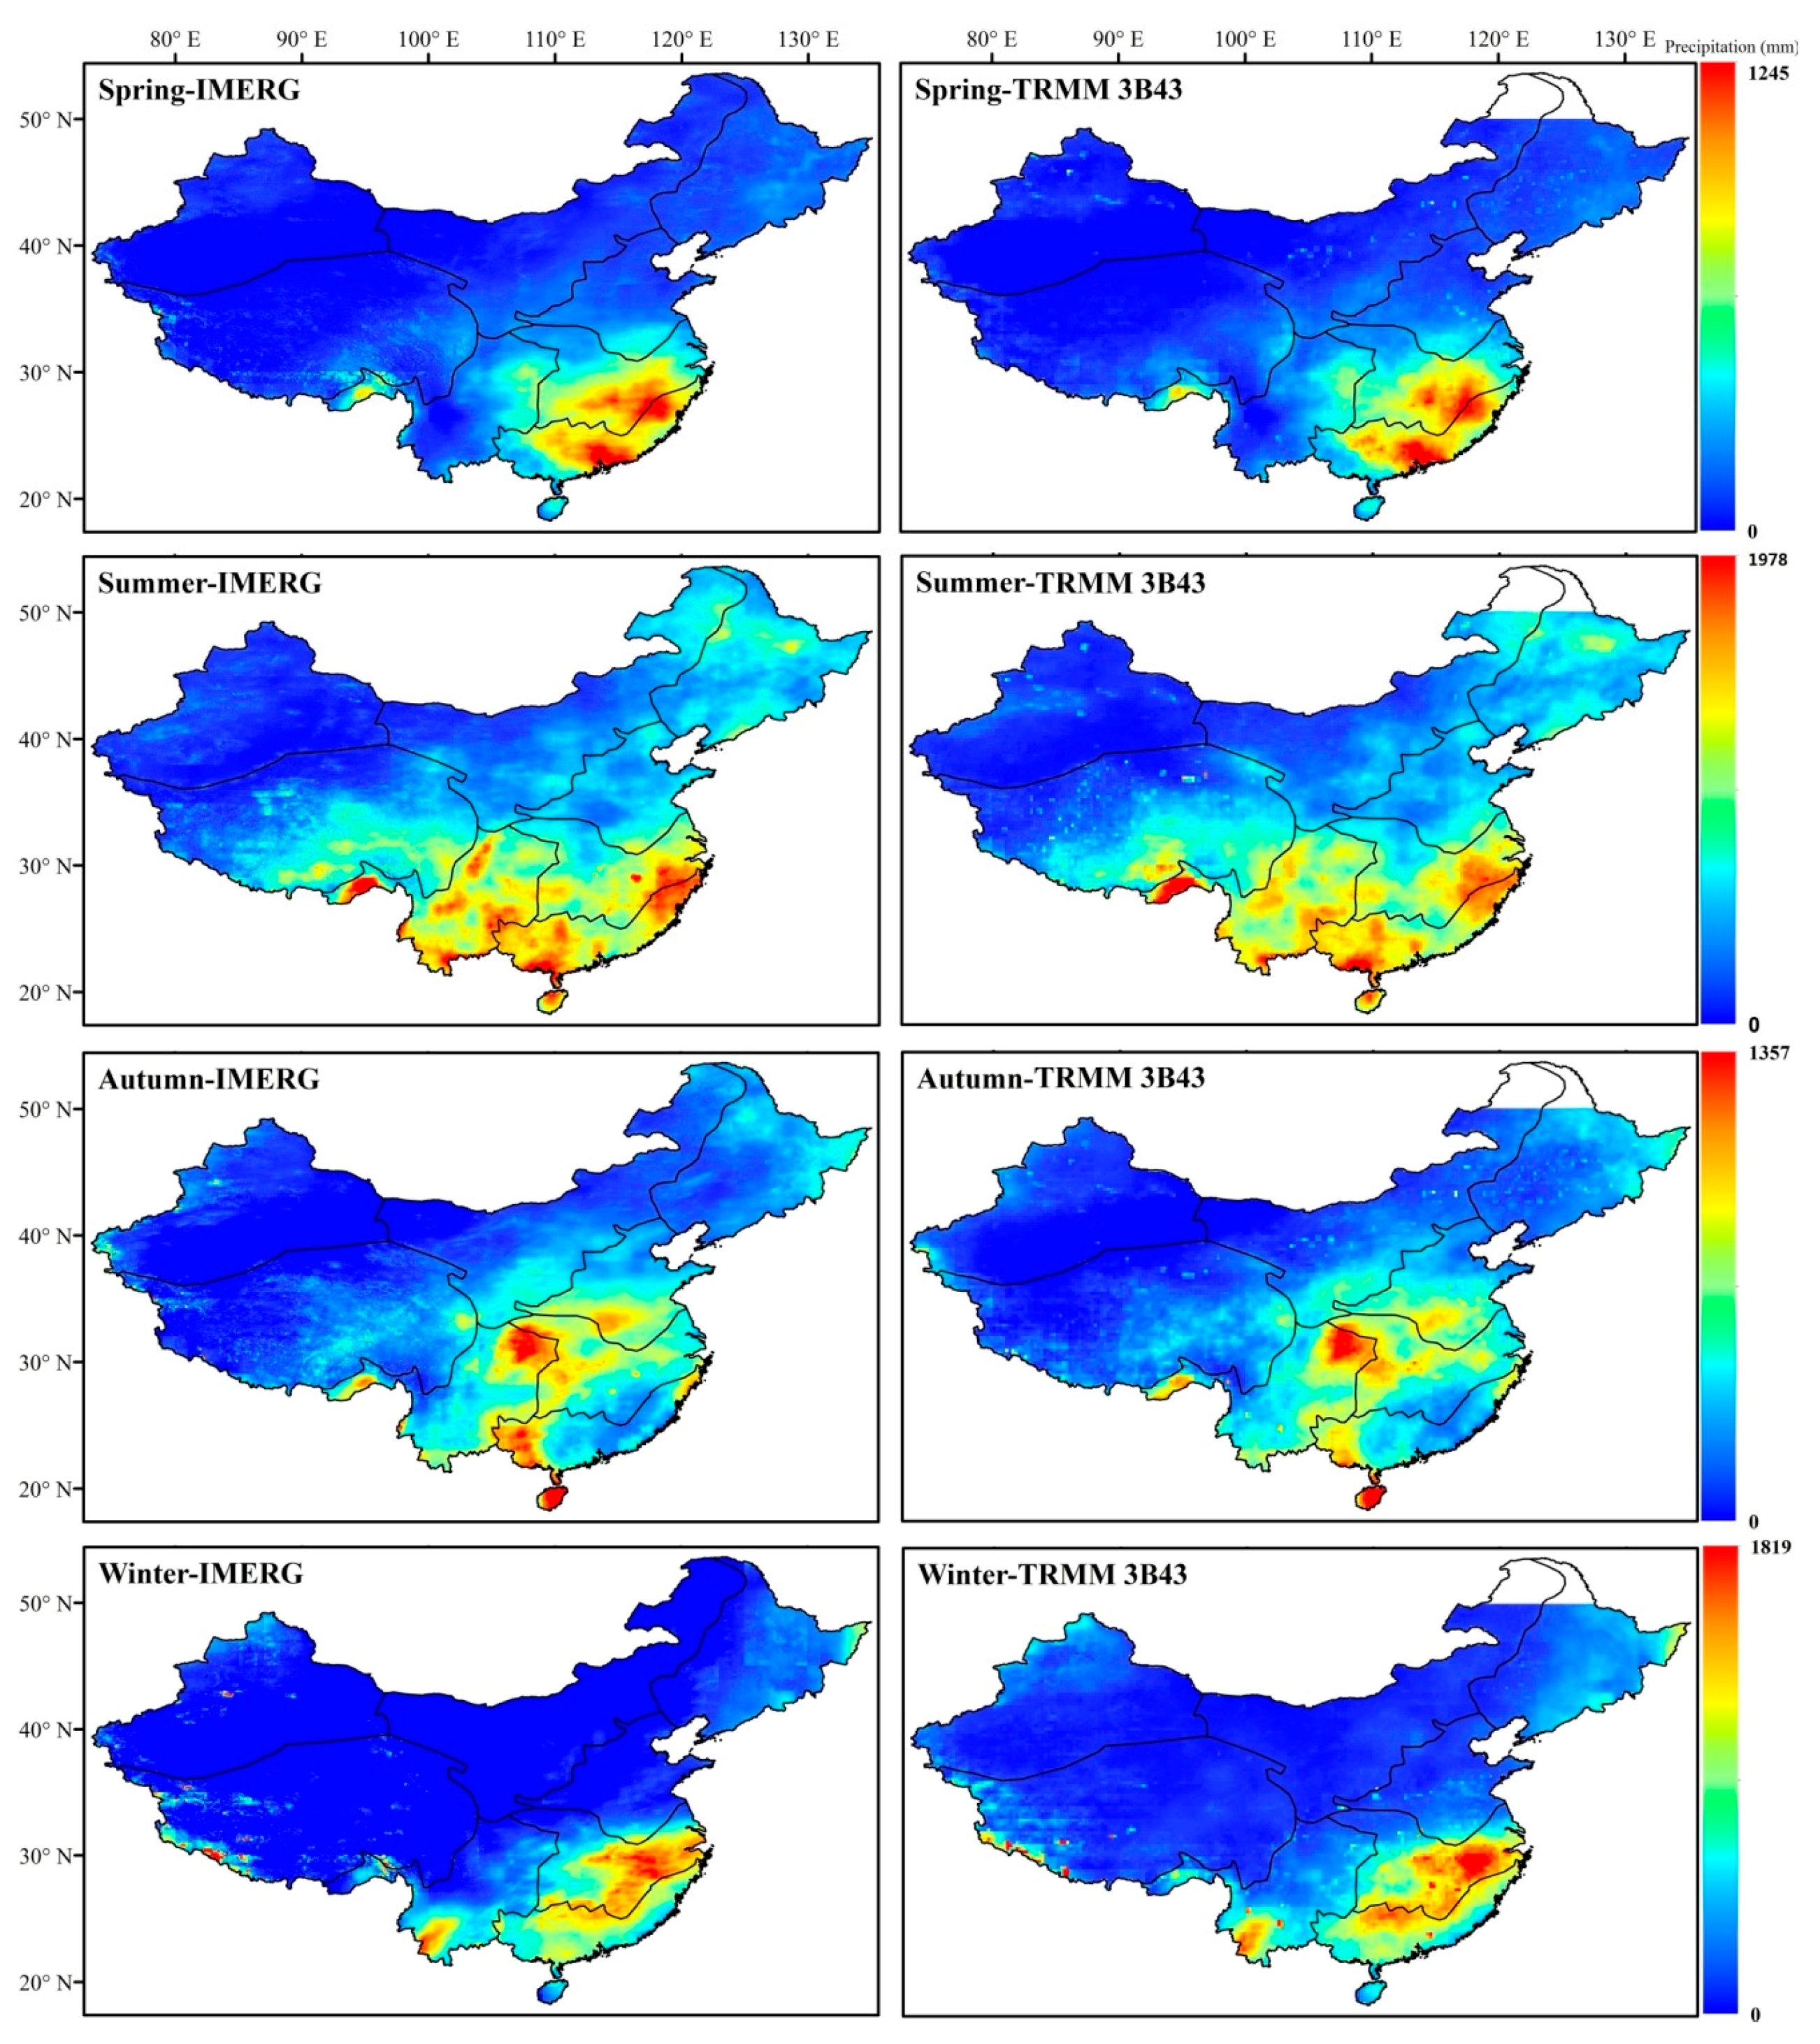
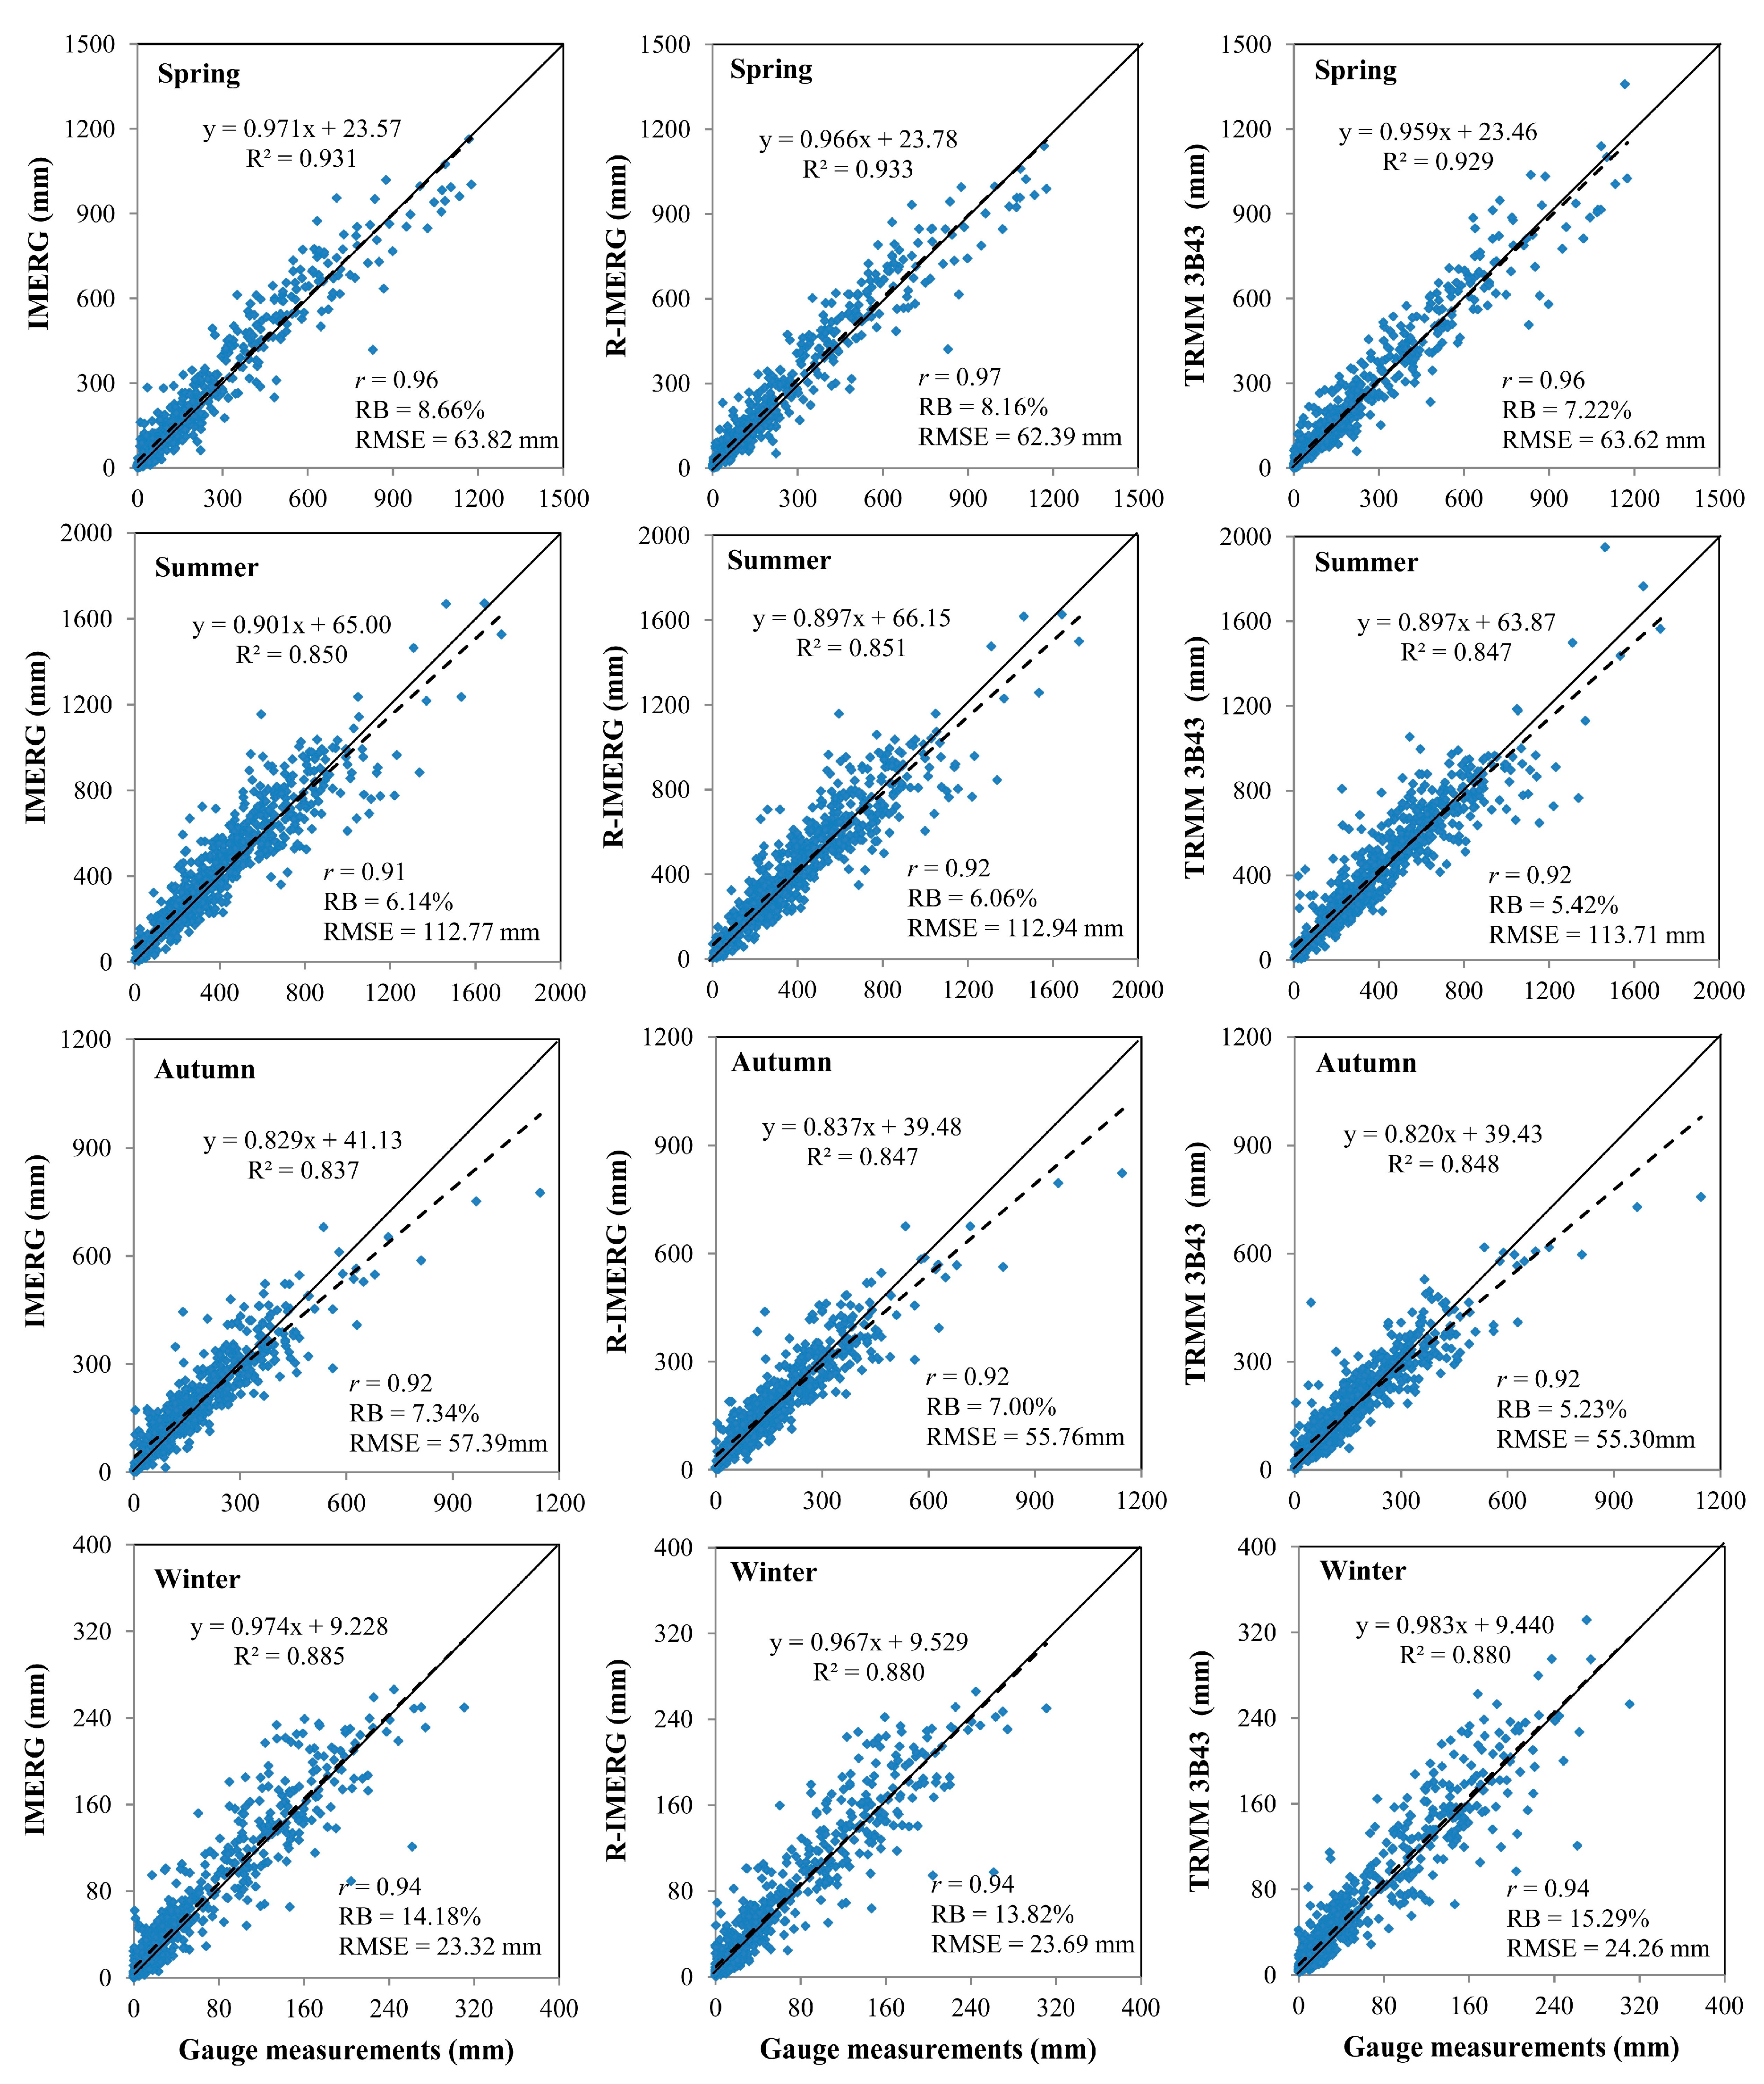
4.2. Evaluation at Seasonal Scale

The seasonal precipitation estimates derived from IMERG and TRMM 3B43 products over Mainland China are shown in Figure 5. They exhibit largely similar spatial patterns in each season. Precipitation rates peak in summer, with slightly lesser amounts falling by in autumn. TRMM 3B43 products still results in many isolated grid boxes of anomalous overestimation in each season, just as shown in annual precipitation.
Figure 6 shows the satellite-derived seasonal precipitation estimates plotted against gauge measurements. IMERG products have high r values of 0.96, 0.92, 0.92, and 0.94 for spring, summer, autumn, and winter, respectively. This indicates IMERG can effectively capture the seasonal patterns of precipitation over Mainland China. Compared with TRMM 3B43, R-IMERG has higher r values and lower RMSE values in spring, summer, and winter, which indicates that IMERG performs a little better than TRMM 3B43 for monitoring seasonal precipitation. Note that both IMERG and TRMM 3B43 have larger overestimates in winter than in other seasons. Snowfall, in North China, is an important factor that seriously affects satellite-derived precipitation estimates. Passive microwave sensors using high-frequency channels might detect an increased amount of scattering associated with the frozen land surface and ice particles in winter [56]. The other issue is that the Legates-Wilmott gauge undercatch corrections [57] are applied to the GPCC data by the TMPA and IMERG developers, so it is possible that that correction is systematically high.
To look further into the error characteristics of three sets of seasonal precipitation estimates, we compared them with gauge measurements in the eight sub-regions (Table 1). The performances of seasonal precipitation estimates vary significantly across China. In general, all three products show poor agreement with gauge measurements in XJ, QZ, and NE (relative low r values from 0.36 to 0.81). However, in other regions, strong agreements occur (relative high r values from 0.66 to 0.94). Compared with TRMM 3B43, R-IMERG results in higher r values and less RMSEs and RBs over XJ, QZ, and YG for three out of four seasons; therefore, R-IMERG performs better in these regions. For example, consider the precipitation estimates for XJ, the r values increase from 0.65 for TRMM 3B43 to 0.78 for R-IMERG in spring. In contrast, R-IMERG performs a little worse than TRMM 3B43 in NN, CJ, and SE where R-IMERG estimates show lower r values and larger RMSEs and RBs than TRMM 3B43 data only during one season. Note that, during winter, all three products have less overestimation in CJ, YG, and SE; these regions receive less snow than other regions or none at all. This again validates the aforementioned analysis related to the limitation of sensors in accurately measuring frozen precipitation.
Figure 7 reveals the seasonal variation of RRMSEs for three sets of seasonal precipitation estimates over the eight sub-regions. Generally, IMERG and TRMM 3B43 products are equally reliable. Among all seasons, summer precipitation estimates prove to be the most reliable while winter precipitation estimates are the least reliable. During summer, the RRMSEs for all three products are lower than 50% for all sub-regions except XJ. One of the main GPM features is to improve the accuracy of snow estimates. However, during winter, IMRGR does not significantly enhance estimation accuracy over North China. This is especially true in NN and NW where R-IMERG has higher RRMSEs than TRMM 3B43. In XJ, despite the fact that IMERG significantly improves the estimation accuracy of precipitation when compared with TRMM 3B43, its estimates still are unreliable in all seasons. Regarding QZ, the reliable precipitation estimates are only available in summer, the rainy season.

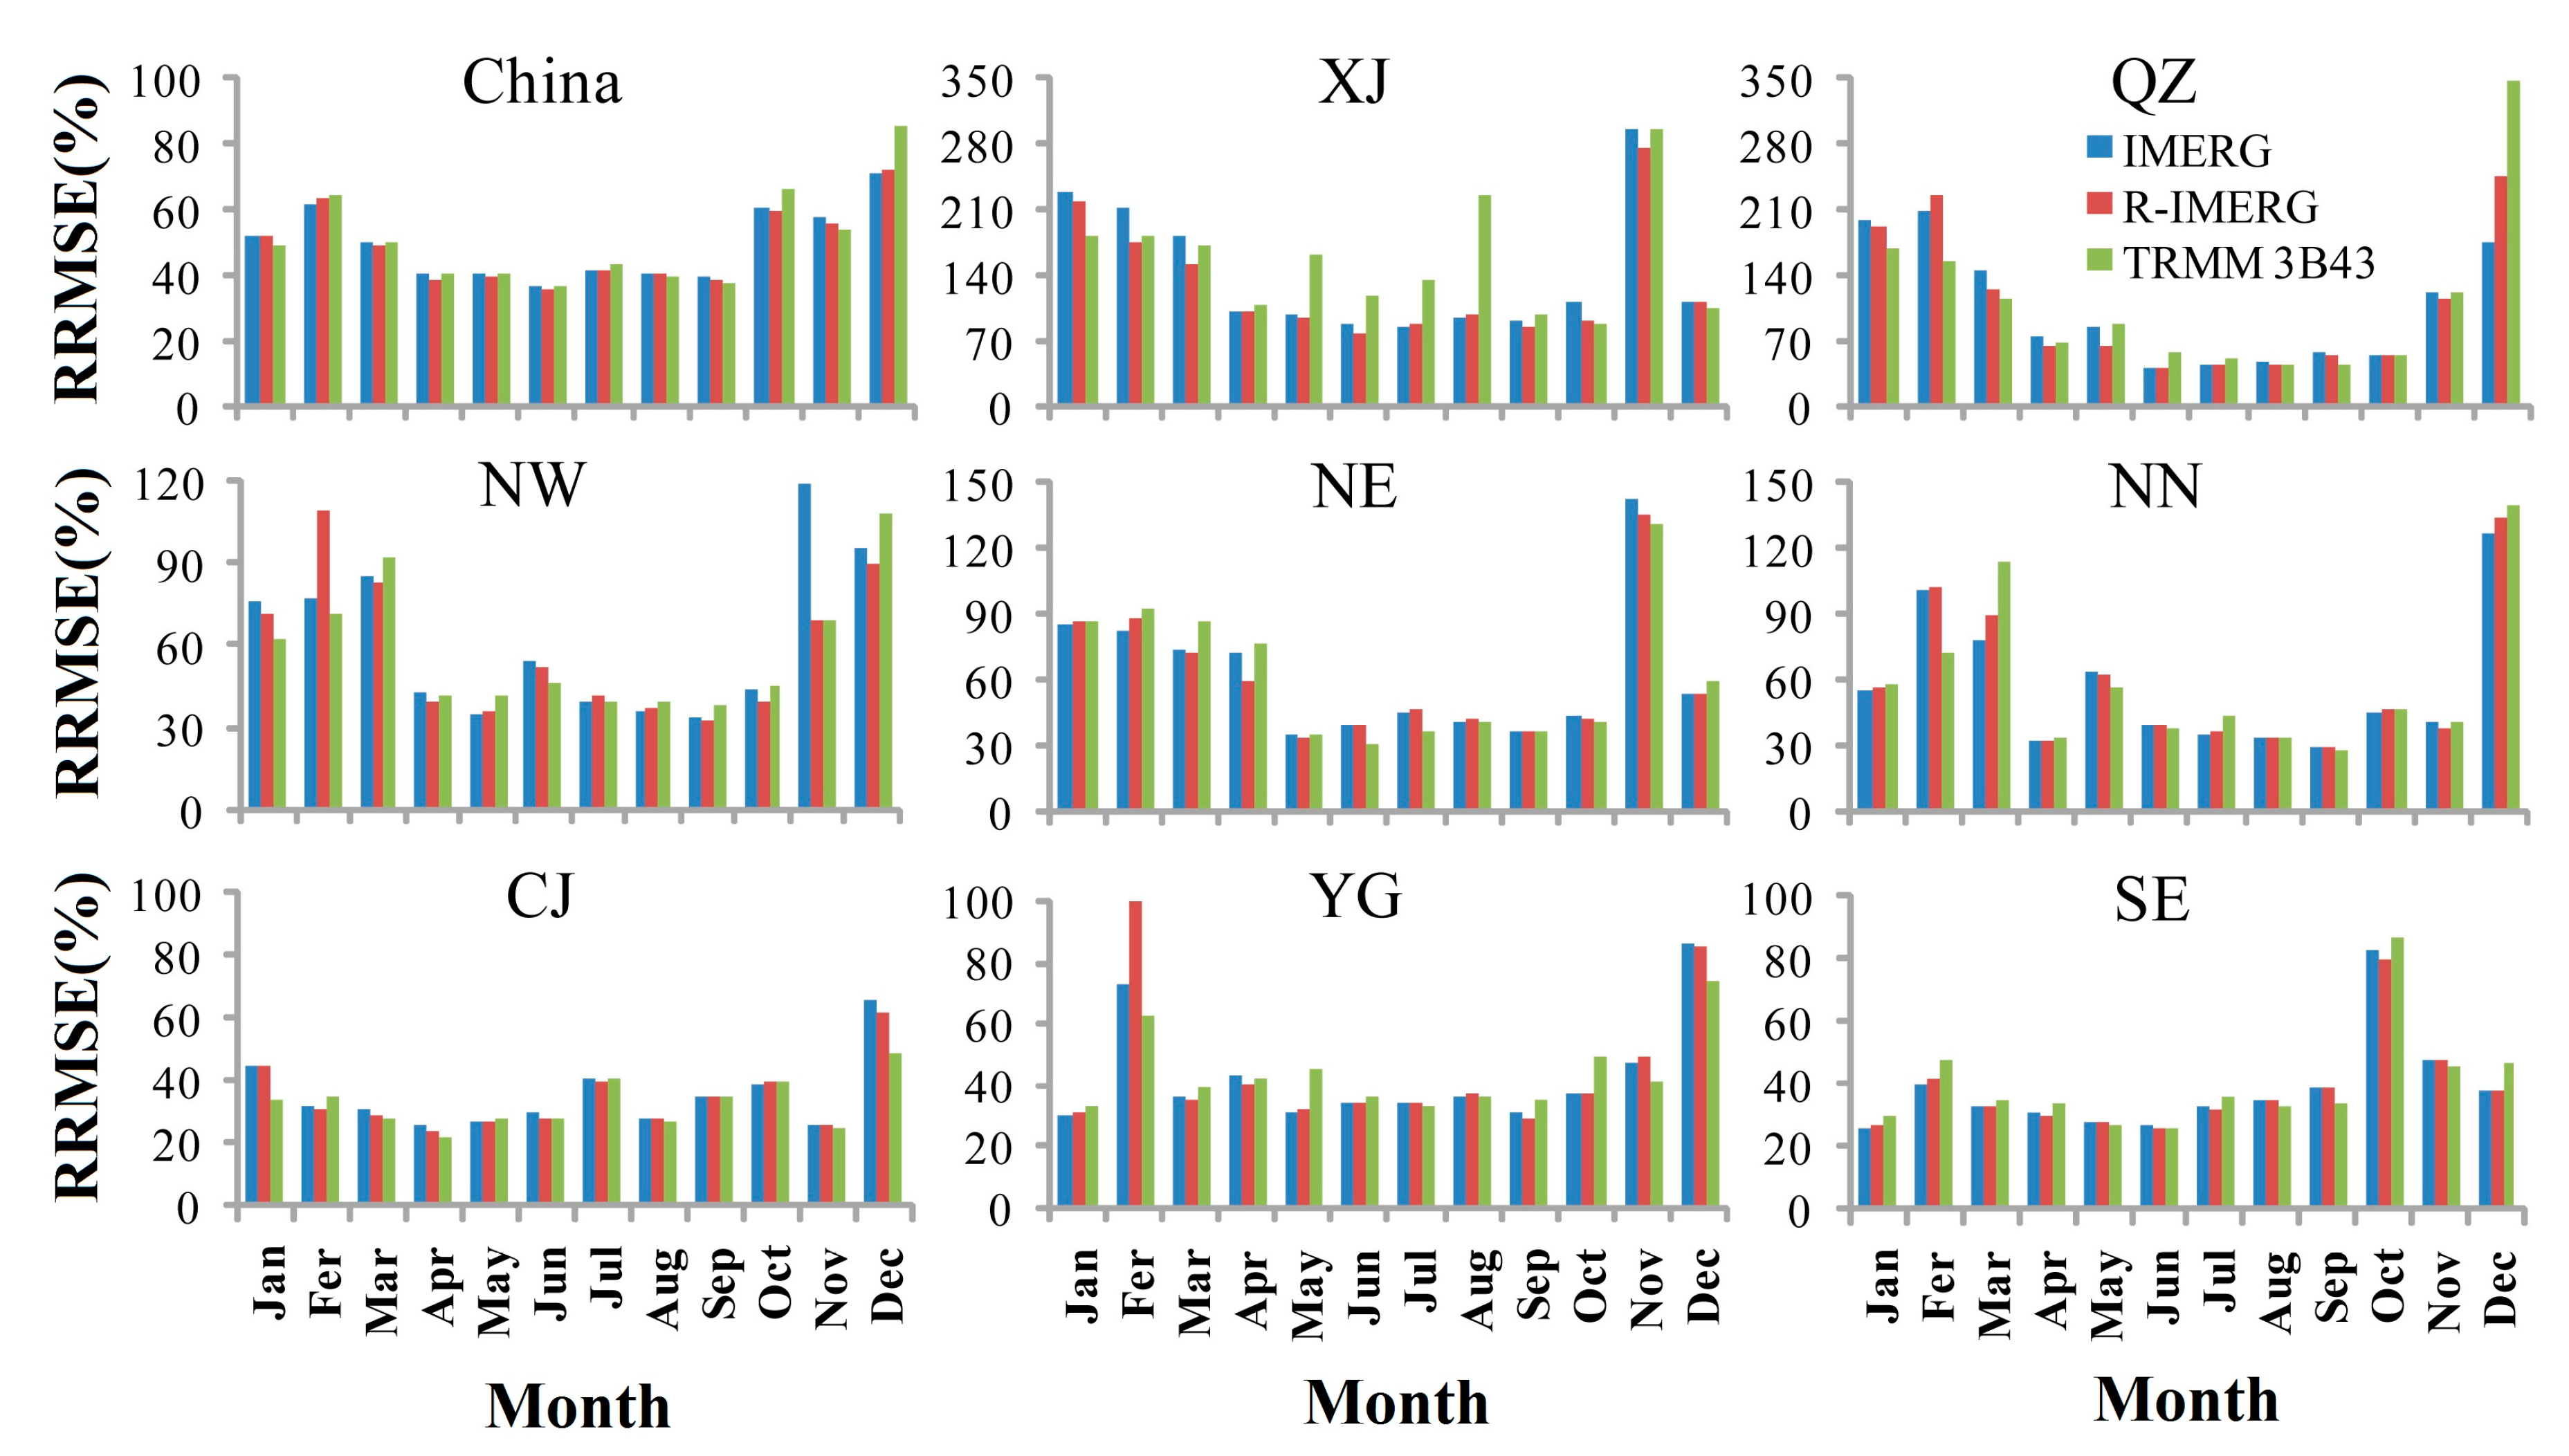
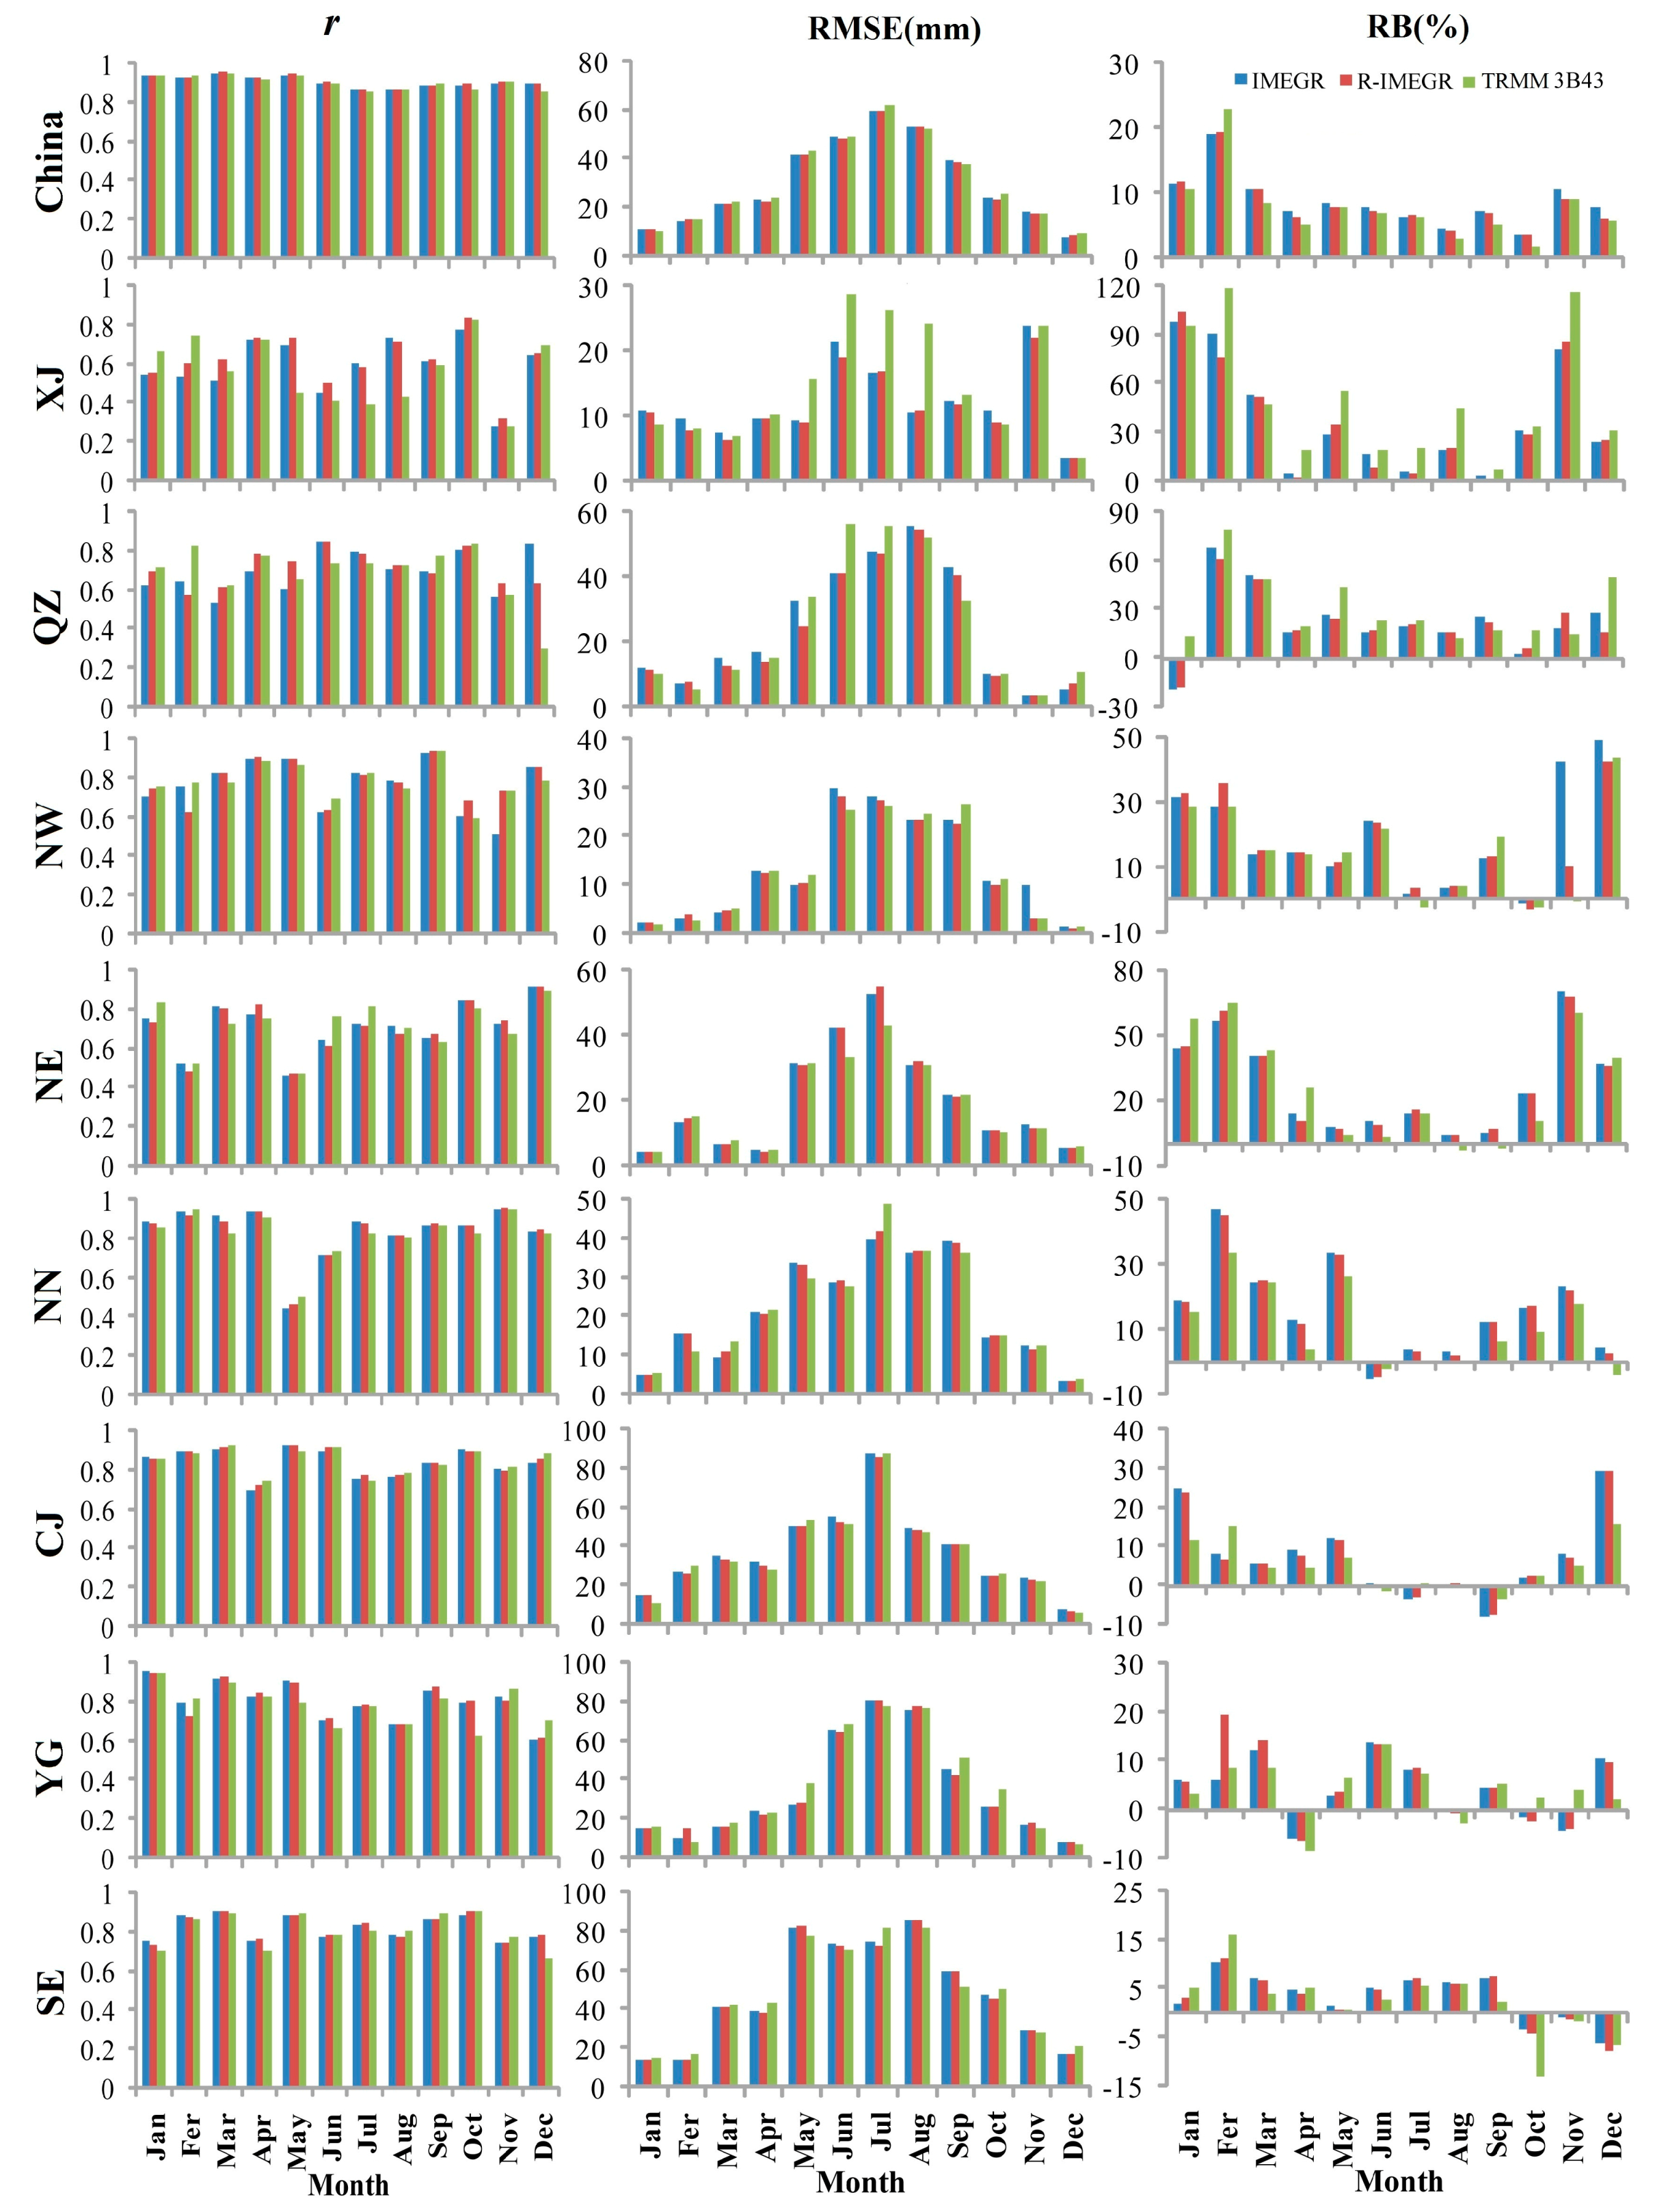
4.3. Evaluation at Monthly Scale

Figure 8 shows the r, RMSE, and RB values for IMERG, R-IMERG, and TRMM 3B43 monthly precipitation estimates over Mainland China and its eight sub-regions. Generally, they agree quite well with gauge measurements at national scale, with r values ranging from 0.86 to 0.96. However, the RMSEs show a distinct temporal pattern. They increase slowly starting in January, and peak in July (59.97 mm, 59.48 mm, and 61.71 mm for IMERG, R-IMERG, and TRMM 3B43 products, respectively) when the lowest correlations occur. After July, the RMSEs begin to decrease gradually, and reach a minimum in December. This pattern is very similar to that of monthly precipitation amounts over Mainland China. The East Asian monsoon occurs from May to September [58] and mainly governs the rainy season over China. Therefore, we conclude that monthly precipitation amounts play an important role in affecting the RMSEs of the satellite-derived precipitation estimates analyzed here. Compared with TRMM 3B43, R-IMERG performs a little better in seven out of twelve months in terms of r and RMSE. Note that three products have small overestimation of precipitation during each month except February. In February, relatively large overestimations occur, with RB values of 19.14%, 19.43%, and 24.18% for IMERG, R-IMERG, and TRMM 3B43, respectively.
To describe spatial differences in the accuracy for three sets of monthly precipitation estimates, the mean of r, RMSE, and RB values (hereafter referred to as “mean r, mean RMSE, and mean RB”) of each dataset for 12 months were computed in each sub-region. Obviously, IMERG, R-IMERG, and TRMM 3B43 all perform better over Southeast China than in XJ, QZ, and NE. The performances of all three products over CJ, YG, and SE are excellent and stable, with r values slightly fluctuating around 0.8 and most of the absolute RBs ranging less than 10%. However, in XJ and QZ, these three datasets perform poorly and unstably, with r and RB values showing large variability (e.g., the r values range from 0.3 to 0.84 for TRMM 3B43 products in QZ), and show evident overestimation almost every month. Yin et al. [59] also found that TMPA products consistently overestimated monthly rainfall over QZ. In terms of the differences between the mean r, RMSE, and RB values of R-IMERG and TRMM 3B43 products, the eight sub-regions can be divided into two categories. One category contains XJ and QZ where apparent differences occur. The remaining regions form the second category where the no obvious differences are observed. One important reason for this is the effect of gauge adjustment. The same gauge product from the Global Precipitation Climatology Centre (GPCC) [60] and the same algorithm for bias correction is applied in TMPA and IMERG. If a great number of gauges are obtained by GPCC in a certain region, gauge adjustment will have a large effect on the accuracy of adjusted precipitation estimates. Otherwise, satellite estimates will have a larger role. GPCC attains fewer gauges over XJ and QZ than other sub-regions. Therefore, satellite estimates play a larger role over XJ and QZ, and IMERG performs better than TRMM 3B43 over these regions due to its improvement of sensors. For example, compared with its predecessor, R-IMERG significantly improves the accuracy of monthly precipitation estimates over XJ, increasing mean r by 6% and decreasing mean RMSE by 3.5 mm. In the remaining regions, gauge adjustment plays a large role and decreases the improvement of GPM sensors to a certain extent, so there are no significant differences between IMERG and TRMM 3B43.
Figure 9 shows the monthly variation of RRMSEs for three sets of monthly precipitation estimates over Mainland China and its eight sub-regions. At the national scale, the monthly data from April to September are reliable, with RRMSEs less than 50%. This occurs mainly because most precipitation falls during this period. The eight sub-regions can be divided into three categories based on the reliability of monthly precipitation data from those regions. The first category includes XJ and QZ where monthly precipitation estimates in most of the 12 months are unreliable, especially in XJ where all monthly data are unreliable. The second category includes NW, NE, and NN where estimates in half of the 12 months are reliable. The third category is composed of CJ, SE, and YG where estimates are reliable most of the time.
The climate types and topography have significant relationships with the accuracy and reliability of satellite-derived precipitation estimates. The average elevation of QZ is over 3000 m, which seriously impacts the accuracy of precipitation estimates. XJ is characterized by an arid and semiarid climate; its smaller precipitation events are difficult to detect accurately with passive microwave sensors. Therefore, both TRMM 3B43 and IMERG had the worst performance over XJ and QZ among all sub-regions. Although IMERG provides more accurate precipitation estimates over these two sub-regions than TRMM 3B43, most of its estimates remain unreliable at monthly, seasonal, and annual scales. The reasons behind this may be related to the following: (1) most of these regions are barren and hard to access on the ground, so few observed data can be attained to calibrate and combine with satellite-derived estimates; and (2) the aforementioned non-linear relationship between RMSE and mean precipitation rate.
TRMM 3B43 shows better performance in YG, CJ, and SE than other sub-regions. That occurs because YG, CJ, and SE are characterized by a subtropical monsoon climate and the aim of the TRMM Mission is to observe precipitation over the tropical and sub-tropical regions of the Earth. Many previous studies have reported that TMPA products have better performance in these areas than others. For GPM, it inherits the advantages of TRMM, so IMERG can also perform well in these regions. Note that both precipitation products have worse performance in YG than CJ and SE, although they have the same climate type. This might be due to the fact that YG is located in the Yunnan-Guizhou Plateau, which has a higher elevation and more rugged terrain than the other two sub-regions (Figure 1). Many studies indicated complex topography might significantly influence the quality of satellite precipitation estimates [24,25,27].
Both TRMM 3B43 and IMERG tend to perform worse over the mid-latitude sub-regions (NW, NE, and NN) than the low-latitude sub-regions (CJ, YG, and SE). The most important reason is that it snows in winter over NW, NE, and NN. The snow and ice surface severely degrade the accuracy of TMPA products. Improvement in snowfall estimates is one of the main GPM mission features; however, as seen in the analysis above, the improvement is not obvious. Liu [32] also found that IMERG failed to improve the estimate accuracy of snow when compared with TRMM 3B43.
As mentioned above, the accuracy of satellite-derived precipitation estimates is mostly dependent on the ability of sensors and the cretrieval algorithm, as well as being affected by complex terrain and climate. Moreover, the time scale also plays an important role in precipitation estimates. The accuracy of precipitation estimates improves over longer time scales. Note that the monthly precipitation estimates in NE in March and April are unreliable, with RRMSEs larger than 50% (Figure 9). However, in this region, the seasonal precipitation estimates in spring are reliable (Figure 7). Similar phenomena can also be seen in NN and NW. When the time scale expands from season to annual, for example, the r values for IMERG increase from 0.92–0.96 (0.6–0.7) to 0.96 (0.74) over Mainland China (XJ). A possible explanation is that at a longer time scale, the positive errors probably counteract the negative errors and allow more accurate and representative data.

5. Summary and Conclusions

In this study, the potentialities and limitations of IMERG monthly precipitation products over Mainland China were evaluated based on monthly, seasonal, and annual comparisons with gauge measurements during the period from March 2014 to February 2015. Moreover, IMERG was also compared with TRMM 3B43. The main findings of this study are summarized as follows:
(1) IMERG products show more spatially detailed information at monthly, seasonal, and annual scales when compared with TRMM 3B43 products, which will extend the application of the satellite-derived precipitation data from global or national scale to regional scale. Note that IMERG eliminates the anomalous values of TRMM 3B43 in isolated grid boxes, and is more consistent with the actual situation. This occurs because the observation interval for GPM is 30 min instead of the 3 h interval for TRMM.
(2) Overall, IMERG products can capture the spatial patterns of precipitation over Mainland China at annual, seasonal, and monthly scales very well. For annual precipitation estimates, IMERG has a high r (0.96), and a small RB (7.37%). However, the performance of IMERG varies greatly spatially and temporally. IMERG performs better over CJ, SE, and YG and more poorly in the remaining regions. This is especially true in XJ and QZ, regions characterized by having an arid to semiarid climate and high elevation, respectively. Based on seasonal and monthly analysis, IMERG performs worse in winter (December, January, and February) than at other times.
(3) R-IMERG reaches the level of accuracy of TRMM 3B43. Both R-IMERG and TRMM 3B43 precipitation estimates have the same r (0.96) for annual precipitation. However, R-IMERG performs a little better than TRMM 3B43 for estimating seasonal and monthly precipitation. For seasonal precipitation in spring, summer, and winter, R-IMERG estimates have higher r values (0.9663, 0.9226, and 0.9386, respectively) and lower RMSEs (62.39 mm, 112.94 mm, and 23.69 mm, respectively) than TRMM 3B43 data. Regarding monthly precipitation, R-IMERG outperforms TRMM 3B43 in seven out of twelve months. However, R-IMERG always has a little more overestimation than TRMM 3B43.
(4) Compared with TRMM 3B43, IMERG performs better in XJ and QZ, and YG; this is especially true in XJ where IMERG increases r by 0.18 and decreases RMSE by 54.47 mm for annual precipitation estimates because the GMP sensors exhibited increased sensitivity to light precipitation when compared to other sensors. Nevertheless, unfortunately, most IMERG data over QZ and XJ proved to be unreliable; therefore, GPM algorithm developers should devote a considerable amount of effort to modifying the related retrieval algorithm.
(5) Although the GPM sensors have an improved ability to observe snowfall, the IMERG precipitation estimates in winter performed as poorly as the TRMM 3B43 data; therefore, most of the precipitation estimates over North China (e.g., NE, NN, and NW) are unreliable during this period. Future research is needed to discover the cause of this phenomenon and to enhance and improve the accuracy of the estimation of frozen precipitation.
The spatiotemporal error characteristics of IMERG monthly precipitation products have been identified and quantified in this study. The findings provide developers of the GPM algorithm with not only more confidence due to the good performance of IMERG data over Mainland China, but also useful feedback to assist them in further improvement, especially for regions with high latitudes and altitudes, as well as dry climates. In addition, the potentialities and limitations of precipitation estimates will give data consumers helpful guidance related to their use in China. Moreover, the accuracy of satellite-derived precipitation depends on not only the absolute value of precipitation but also the capability of identifying precipitation events. Therefore, it is necessary to continue and extend the validation work to these products at daily or hourly scales.

Acknowledgments

This study was supported by the Natural Science Foundation of China under Grant No. 41401503, Innovative Research Team in University of Henan Provinces under Grant No. 16IRTSTHN012, the Natural Science Foundation of Hubei Province (China) under Grant No. 2014CFB726, and National Natural Science Foundation of China under Grant No. 91538106. The authors would like to thank the reviewers of the manuscript for their helpful comments. We are also grateful to the many providers of operational satellite precipitation products and precipitation gauge measurements for their data available to us.

Author Contributions

All authors contributed extensively to the work presented in this paper. Fengrui Chen designed the framework of this study and performed most of the experiment. Xi Li conducted the data preprocessing. Fengrui Chen and Xi Li contributed together to the writing of this manuscript.

Conflicts of Interest

The authors declare no conflict of interest.

References

  1. Verdin, J.; Klaver, R. Grid-cell-based crop water accounting for the famine early warning system. Hydrol. Process. 2002, 16, 1617–1630. [Google Scholar] [CrossRef]
  2. Tobin, K.J.; Bennett, M.E. Adjusting satellite precipitation data to facilitate hydrologic modeling. J. Hydrometeorol. 2010, 11, 966–978. [Google Scholar] [CrossRef]
  3. Hou, A.Y.; Kakar, R.K.; Neeck, S.; Azarbarzin, A.A.; Kummerow, C.D.; Kojima, M.; Oki, R.; Nakamura, K.; Iguchi, T. The global precipitation measurement mission. Bull. Am. Meteorol. Soc. 2014, 95, 701–722. [Google Scholar] [CrossRef]
  4. Joyce, R.J.; Janowiak, J.E.; Arkin, P.A.; Xie, P. CMORPH: A method that produces global precipitation estimates from passive microwave and infrared data at high spatial and temporal resolution. J. Hydrometeorol. 2004, 5, 487–503. [Google Scholar] [CrossRef]
  5. Hsu, K.; Gao, X.; Sorooshian, S.; Gupta, H.V. Precipitation estimation from remotely sensed information using artificial neural networks. J. Appl. Meteorol. 1997, 36, 1176–1190. [Google Scholar] [CrossRef]
  6. Nair, S.; Srinivasan, G.; Nemani, R. Evaluation of multi-satellite TRMM derived rainfall estimates over a western state of India. J. Meteorol. Soc. Jpn. 2009, 87, 927–939. [Google Scholar] [CrossRef]
  7. Huffman, G.J.; Bolvin, D.T.; Nelkin, E.J.; Wolff, D.B.; Adler, R.F.; Gu, G.; Hong, Y.; Bowman, K.P.; Stocker, E.F. The TRMM multisatellite precipitation analysis (TMPA): Quasi-global, multiyear, combined-sensor precipitation estimates at fine scales. J. Hydrometeorol. 2007, 8, 38–55. [Google Scholar] [CrossRef]
  8. Sahoo, A.K.; Sheffield, J.; Pan, M.; Wood, E.F. Evaluation of the Tropical Rainfall Measuring Mission Multi-Satellite Precipitation Analysis (TMPA) for assessment of large-scale meteorological drought. Remote Sens. Environ. 2015, 159, 181–193. [Google Scholar] [CrossRef]
  9. Chen, F.; Liu, Y.; Liu, Q.; Li, X. Spatial downscaling of TRMM 3B43 precipitation considering spatial heterogeneity. Int J. Remote Sens. 2014, 35, 3074–3093. [Google Scholar] [CrossRef]
  10. Tarnavsky, E.; Mulligan, M.; Ouessar, M.; Faye, A.; Black, E. Dynamic hydrological modeling in drylands with TRMM based rainfall. Remote Sens. 2013, 5, 6691–6716. [Google Scholar] [CrossRef] [Green Version]
  11. Barnes, H.C.; Zuluaga, M.D.; Houze, R.A. Latent heating characteristics of the MJO computed from TRMM Observations. J. Geophys. Res. Atmos. 2015, 120, 1322–1334. [Google Scholar] [CrossRef]
  12. Naumann, G.; Barbosa, P.; Carrao, H.; Singleton, A.; Vogt, J. Monitoring drought conditions and their uncertainties in Africa using TRMM data. J. Appl. Meteorol. Climatol. 2012, 51, 1867–1874. [Google Scholar] [CrossRef]
  13. Meng, J.; Li, L.; Hao, Z.; Wang, J.; Shao, Q. Suitability of TRMM satellite rainfall in driving a distributed hydrological model in the source region of Yellow River. J. Hydrol. 2014, 509, 320–332. [Google Scholar] [CrossRef]
  14. Peng, B.; Shi, J.; Ni-Meister, W.; Zhao, T.; Ji, D. Evaluation of TRMM multisatellite precipitation analysis (TMPA) products and their potential hydrological application at an arid and semiarid basin in china. IEEE J. Sel. Top. Appl. Earth Observ. Remote Sens. 2014, 7, 3915–3930. [Google Scholar] [CrossRef]
  15. Sharma, V.K.; Rao, G.S.; Amminedu, E.; Nagamani, P.V.; Shukla, A.; Rao, K.R.M.; Bhanumurthy, V. Event-driven flood management: Design and computational modules. Geo-Spat. Inf. Sci. 2016, 19, 39–55. [Google Scholar] [CrossRef]
  16. Hong, Y.; Hsu, K.; Moradkhani, H.; Sorooshian, S. Uncertainty quantification of satellite precipitation estimation and Monte Carlo assessment of the error propagation into hydrologic response. Water Resour. Res. 2006, 42, 2643–2645. [Google Scholar] [CrossRef]
  17. Janowiak, J.E.; Joyce, R.J.; Yarosh, Y. A real-time global half-hourly pixel-resolution infrared dataset and its applications. Bull. Am. Meteorol. Soc. 2001, 82, 205–217. [Google Scholar] [CrossRef]
  18. Milewski, A.; Elkadiri, R.; Durham, M. Assessment and comparison of TMPA satellite precipitation products in varying climatic and topographic regimes in Morocco. Remote Sens. 2015, 7, 5697–5717. [Google Scholar] [CrossRef]
  19. Nastos, P.; Kapsomenakis, J.; Philandras, K. Evaluation of the TRMM 3B43 gridded precipitation estimates over Greece. Atmos. Res. 2016, 169, 497–514. [Google Scholar] [CrossRef]
  20. Scheel, M.; Rohrer, M.; Huggel, C.; Santos Villar, D.; Silvestre, E.; Huffman, G. Evaluation of TRMM Multi-satellite Precipitation Analysis (TMPA) performance in the Central Andes region and its dependency on spatial and temporal resolution. Hydrol. Earth Syst. Sci. 2011, 15, 2649–2663. [Google Scholar] [CrossRef] [Green Version]
  21. Sealy, A.; Jenkins, G.S.; Walford, S.C. Seasonal/regional comparisons of rain rates and rain characteristics in West Africa using TRMM observations. J. Geophys. Res. Atmos. 2003, 108, 1–21. [Google Scholar] [CrossRef]
  22. Gebere, S.B.; Alamirew, T.; Merkel, B.J.; Melesse, A.M. Performance of high resolution satellite rainfall products over data scarce parts of Eastern Ethiopia. Remote Sens. 2015, 7, 639–663. [Google Scholar] [CrossRef]
  23. Chen, S.; Hong, Y.; Gourley, J.J.; Huffman, G.J.; Tian, Y.; Cao, Q.; Yong, B.; Kirstetter, P.E.; Hu, J.; Hardy, J. Evaluation of the successive V6 and V7 TRMM multisatellite precipitation analysis over the Continental United States. Water Resour. Res. 2013, 49, 8174–8186. [Google Scholar] [CrossRef]
  24. Chen, S.; Hong, Y.; Cao, Q.; Gourley, J.J.; Kirstetter, P.E.; Yong, B.; Tian, Y.; Zhang, Z.; Shen, Y.; Hu, J. Similarity and difference of the two successive V6 and V7 TRMM multisatellite precipitation analysis performance over China. J. Geophys. Res. Atmos. 2013, 118, 13060–13074. [Google Scholar] [CrossRef]
  25. Qin, Y.; Chen, Z.; Shen, Y.; Zhang, S.; Shi, R. Evaluation of satellite rainfall estimates over the Chinese mainland. Remote Sens. 2014, 6, 11649–11672. [Google Scholar] [CrossRef]
  26. Zeng, H.; Li, L.; Hu, J.; Liang, L.; Li, J.; Li, B.; Zhang, K. Accuracy validation of TRMM Multisatellite Precipitation Analysis daily precipitation products in the Lancang River Basin of China. Theor. Appl. Climatol. 2013, 112, 389–401. [Google Scholar] [CrossRef]
  27. Zhao, T.; Yatagai, A. Evaluation of TRMM 3B42 product using a new gauge-based analysis of daily precipitation over China. Int. J. Climatol. 2014, 34, 2749–2762. [Google Scholar] [CrossRef]
  28. Zhou, T.; Yu, R.; Chen, H.; Dai, A.; Pan, Y. Summer precipitation frequency, intensity, and diurnal cycle over China: A comparison of satellite data with rain gauge observations. J. Clim. 2008, 21, 3997–4010. [Google Scholar] [CrossRef]
  29. Jiang, S.; Ren, L.; Yong, B.; Yang, X.; Shi, L. Evaluation of high-resolution satellite precipitation products with surface rain gauge observations from Laohahe Basin in northern China. Water Sci. Eng. 2010, 3, 405–417. [Google Scholar]
  30. Huffman, G.J.; Bolvin, D.T.; Nelkin, E.J. Integrated Multi-satellitE Retrievals for GPM (IMERG) Technical Documentation; NASA/GSFC: Greenbelt, MD, USA, 2014. [Google Scholar]
  31. Huffman, G.J.; Bolvin, D.T.; Nelkin, E.J. Day 1 IMERG Final Run Release Notes; NASA/GSFC: Greenbelt, MD, USA, 2015. [Google Scholar]
  32. Liu, Z. Comparison of Integrated Multi-satellitE Retrievals for GPM (IMERG) and TRMM Multi-satellite Precipitation Analysis (TMPA) monthly precipitation products: Initial results. J. Hydrometeorol. 2015, 17. [Google Scholar] [CrossRef]
  33. Domrös, M.; Peng, G. The Climate of China; Springer: Berlin, Germany, 2012. [Google Scholar]
  34. Chang, C.; Zhang, Y.; Li, T. Interannual and interdecadal variations of the East Asian summer monsoon and tropical Pacific SSTs. Part I: Roles of the subtropical ridge. J. Clim. 2000, 13, 4310–4325. [Google Scholar] [CrossRef]
  35. Wang, B.; Wu, R.; Lau, K. Interannual variability of the Asian summer monsoon: Contrasts between the Indian and the Western North Pacific-East Asian Monsoons. J. Clim. 2001, 14, 4073–4090. [Google Scholar] [CrossRef]
  36. Haddad, Z.S.; Smith, E.A.; Kummerow, C.D.; Iguchi, T.; Farrar, M.R.; Durden, S.L.; Alves, M.; Olson, W.S. The TRMM ‘Day-1’ Radar/Radiometer Combined Rain-Profiling Algorithm; NASA/GSFC: Greenbelt, MD, USA, 1997. [Google Scholar]
  37. Iguchi, T.; Kozu, T.; Meneghini, R.; Awaka, J.; Okamoto, K. Rain-profiling algorithm for the TRMM precipitation radar. J. Appl. Meteorol. 2000, 39, 2038–2052. [Google Scholar] [CrossRef]
  38. As-Syakur, A.; Tanaka, T.; Prasetia, R.; Swardika, I.; Kasa, I. Comparison of TRMM Multisatellite Precipitation Analysis (TMPA) products and daily-monthly gauge data over Bali. Int. J. Remote Sens. 2011, 32, 8969–8982. [Google Scholar] [CrossRef]
  39. The TRMM Webpage. Available online: http://pmm.nasa.gov/data-access/downloads/trmm/ (accessed on 10 April 2016).
  40. Huffman, G.J.; Bolvin, D.T.; Braithwaite, D.; Hsu, K.; Joyce, R.; Xie, P.; Yoo, S.H. Algorithm Theoretical Basis Document, Version 4.1: NASA Global Precipitation Measurement (GPM) Integrated Multi-satellitE Retrievals for GPM (IMERG); NASA/GSFC: Greenbelt, MD, USA, 2013. [Google Scholar]
  41. The GPM Webpage. Available online: http://pmm.nasa.gov/data-access/downloads/gpm/ (accessed on 10 April 2016).
  42. Yu, R.; Zhou, T.; Xiong, A.; Zhu, Y.; Li, J. Diurnal variations of summer precipitation over contiguous China. Geophys. Res. Lett. 2007, 1, 223–234. [Google Scholar] [CrossRef]
  43. Shen, Y.; Xiong, A.; Wang, Y.; Xie, P. Performance of high-resolution satellite precipitation products over China. J. Geophys. Res. Atmos. 2010, 115, 355–365. [Google Scholar] [CrossRef]
  44. The CMA Website. Available online: http://data.cma.cn (accessed on 10 April 2016).
  45. Mantas, V.; Liu, Z.; Caro, C.; Pereira, A. Validation of TRMM Multi-satellite Precipitation Analysis (TMPA) products in the Peruvian Andes. Atmos. Res. 2015, 163, 132–145. [Google Scholar] [CrossRef]
  46. Moazami, S.; Golian, S.; Kavianpour, M.R.; Hong, Y. Comparison of PERSIANN and V7 TRMM Multi-satellite Precipitation Analysis (TMPA) products with rain gauge data over Iran. Int. J. Remote Sens. 2013, 34, 8156–8171. [Google Scholar] [CrossRef]
  47. Karaseva, M.O.; Prakash, S.; Gairola, R. Validation of high-resolution TRMM-3B43 precipitation product using rain gauge measurements over Kyrgyzstan. Theor. Appl. Climatol. 2012, 108, 147–157. [Google Scholar] [CrossRef]
  48. Buarque, D.C.; de Paiva, R.C.D.; Clarke, R.T.; Mendes, C.A.B. A comparison of Amazon rainfall characteristics derived from TRMM, CMORPH and the Brazilian national rain gauge network. J. Geophys. Res. Atmos. 2011, 116, 1–12. [Google Scholar] [CrossRef]
  49. Franchito, S.H.; Rao, V.B.; Vasques, A.C.; Santo, C.M.; Conforte, J.C. Validation of TRMM precipitation radar monthly rainfall estimates over Brazil. J. Geophys. Res. Atmos. 2009, 114, 1–9. [Google Scholar] [CrossRef]
  50. Adeyewa, Z.D.; Nakamura, K. Validation of TRMM radar rainfall data over major climatic regions in Africa. J. Appl. Meteorol. 2003, 42, 331–347. [Google Scholar] [CrossRef]
  51. Story, G.J.; Forecaster, H.; Center, W.G. Determining WSR-88D Precipitation Algorithm Performance Using the Stage III Precipitation Processing System; West Gulf River Forecast Center: Fort Worth, TX, USA, 2001. [Google Scholar]
  52. Surussavadee, C.; Staelin, D.H. Correcting microwave precipitation retrievals for near-surface evaporation. In Proceedings of the IEEE International Geoscience and Remote Sensing Symposium (IGARSS), Honolulu, HI, USA, 25–30 July 2010.
  53. Dinku, T.; Connor, S.J.; Ceccato, P. Comparison of CMORPH and TRMM-3B42 over mountainous regions of Africa and South America. In Satellite Rainfall Applications for Surface Hydrology; Gebremichael, M., Hossain, F., Eds.; Springer Netherlands: Houten, The Netherlands, 2010; pp. 193–204. [Google Scholar]
  54. Castro, L.M.; Miranda, M.; Fernández, B. Evaluation of TRMM Multi-satellite Precipitation Analysis (TMPA) in a mountainous region of the central Andes range with a Mediterranean climate. Hydrol. Res. 2015, 46, 89–105. [Google Scholar] [CrossRef]
  55. Huffman, G.J.; Adler, R.F.; Arkin, P.; Chang, A.; Ferraro, R.; Gruber, A.; Schneider, U. The global precipitation climatology project (GPCP) combined precipitation dataset. Bull. Am. Meteorol. Soc. 1997, 1, 5–20. [Google Scholar] [CrossRef]
  56. Huffman, G.J.; Bolvin, D.T. TRMM and Other Data Precipitation Data Set Documentation; NASA/GSFC: Greenbelt, MD, USA, 2013. [Google Scholar]
  57. Legates, D.R.; Willmott, C.J. Mean seasonal and spatial variability in gauge-corrected, global precipitation. Int. J. Climatol. 1990, 10, 111–127. [Google Scholar] [CrossRef]
  58. Junyue, Y. Climatological characteristics on the onset of the South China Sea southwest monsoon. Acta Meteorol. Sin. 1997, 2, 77–88. [Google Scholar]
  59. Yin, Z.Y.; Zhang, X.; Liu, X.; Colella, M.; Chen, X. An assessment of the biases of satellite rainfall estimates over the Tibetan Plateau and correction methods based on topographic analysis. J. Hydrometeorol. 2008, 9, 301–326. [Google Scholar] [CrossRef]
  60. Schneider, U.; Becker, A.; Meyer-Christoffer, A.; Ziese, M.; Rudolf, B. Global Precipitation Analysis Products of the GPCC; NOAA/ESRL: Boulder, MD, USA, 2014. [Google Scholar]
Figure 1. Study area, the spatial distribution of meteorological stations, and the eight sub-regions: the Xinjiang region (XJ), the Qinghai-Tibetan Plateau (QZ), Northwestern China (NW), Northeastern China (NE), Northern China (NN), the southwest Yungui Plateau (YG), the plain region of Changjiang (Yangtze) River (CJ), and Southeastern China (SE).
Remotesensing 08 00472 g001
Figure 2. Annual precipitation estimates derived from IMERG and TRMM 3B43 products over Mainland China.
Remotesensing 08 00472 g002
Figure 3. Scatter plots of gauge measurements versus annual precipitation estimates derived from IMERG, R-IMERG, and TRMM 3B43 products over Mainland China.
Remotesensing 08 00472 g003
Figure 4. RRMSE values of annual precipitation estimates derived from IMERG, R-IMERG, and TRMM 3B43 products over the eight sub-regions.
Remotesensing 08 00472 g004
Figure 5. Seasonal precipitation estimates derived from IMERG and TRMM 3B43 products over Mainland China.
Remotesensing 08 00472 g005
Figure 6. Scatter plots of gauge measurements versus seasonal precipitation estimates derived from IMERG, R-IMERG, and TRMM 3B43 products over Mainland China.
Remotesensing 08 00472 g006
Figure 7. RRMSE values of seasonal precipitation estimates derived from IMERG, R-IMERG, and TRMM 3B43 products over the eight sub-regions.
Remotesensing 08 00472 g007
Figure 8. r, RMSE and RB values of monthly precipitation estimates derived from IMERG, R-IMERG, and TRMM 3B43 products over Mainland China and its eight sub-regions.
Remotesensing 08 00472 g008
Figure 9. RRMSE values of monthly precipitation estimates derived from IMERG, R-IMERG, and TRMM 3B43 products over Mainland China and its eight sub-regions.
Remotesensing 08 00472 g009
Table 1. r, RMSE, and RB values of annual and seasonal precipitation estimates derived from IMERG, R-IMERG, and TRMM 3B43 products over the eight sub-regions.
IndexesTimeDataXJQZNWNENNCJYGSE
rAnnualIMERG0.740.720.920.790.920.870.820.79
R-IMERG0.780.750.920.790.920.870.820.79
3B430.600.740.930.800.910.880.770.82
SpringIMERG0.700.630.920.680.890.940.920.90
R-IMERG0.780.760.930.660.890.940.930.90
3B430.650.740.900.600.860.930.890.91
SummerIMERG0.640.760.840.700.880.810.710.85
R-IMERG0.610.760.820.680.870.830.720.84
3B430.360.720.860.790.870.840.680.85
AutumnIMERG0.650.670.920.750.900.760.850.89
R-IMERG0.730.660.940.770.910.780.860.90
3B430.640.750.930.700.900.810.790.93
WinterIMERG0.610.810.790.710.920.890.910.72
R-IMERG0.650.730.740.680.920.890.900.71
3B430.760.720.770.720.920.900.910.66
RMSEAnnualIMERG75.12206.4978.58113.93130.15220.03200.07266.94
R-IMERG69.90196.3380.01115.85132.05212.91197.82266.93
3B43124.37209.2475.43101.30124.04204.13218.96246.69
SpringIMERG21.6655.3118.1627.5253.9984.9448.70116.72
R-IMERG19.0843.8517.6427.5253.2981.9647.29117.67
3B4327.4149.7121.0930.9751.6980.7055.05115.39
SummerIMERG37.46124.0355.2784.0169.92138.86156.44151.39
R-IMERG37.87125.0856.7086.9672.32133.08155.00152.24
3B4374.18137.3648.3868.7973.08128.36156.69151.68
AutumnIMERG32.5653.4427.9330.7551.6762.9267.7692.67
R-IMERG28.8253.2725.0830.1750.4861.0866.4088.85
3B4335.1044.1029.1428.7646.4257.4281.2083.04
WinterIMERG19.8718.554.8620.0218.8038.4622.4428.48
R-IMERG18.5420.765.5221.0418.7137.3323.5429.12
3B4317.8020.984.4922.5814.3037.7620.9834.54
RBAnnualIMERG25.7219.7710.1714.7810.913.484.534.24
R-IMERG24.7919.3110.4114.9310.493.254.533.93
3B4338.9722.4810.0110.486.153.043.482.69
SpringIMERG19.7327.2512.1013.0322.449.522.393.52
R-IMERG24.5425.2512.7811.8121.808.813.252.90
3B4339.4436.6813.5910.7414.915.622.562.36
SummerIMERG12.8917.088.749.901.28−1.447.166.02
R-IMERG9.6117.389.8810.100.87−1.386.935.74
3B4324.9919.426.975.71−0.83−0.235.784.57
AutumnIMERG32.2223.6910.7916.8314.840.372.822.22
R-IMERG31.7722.379.0717.3514.680.182.712.20
3B4343.4219.7213.217.268.500.714.632.43
WinterIMERG75.5016.9032.9748.3233.3114.777.441.24
R-IMERG73.0012.3835.5850.3631.9613.538.141.48
3B4386.9440.8730.9255.2723.9714.214.633.99

