
GRACE-Derived Terrestrial Water Storage Changes in the Inter-Basin Region and Its Possible Influencing Factors: A Case Study of the Sichuan Basin, China


Abstract
:
1. Introduction
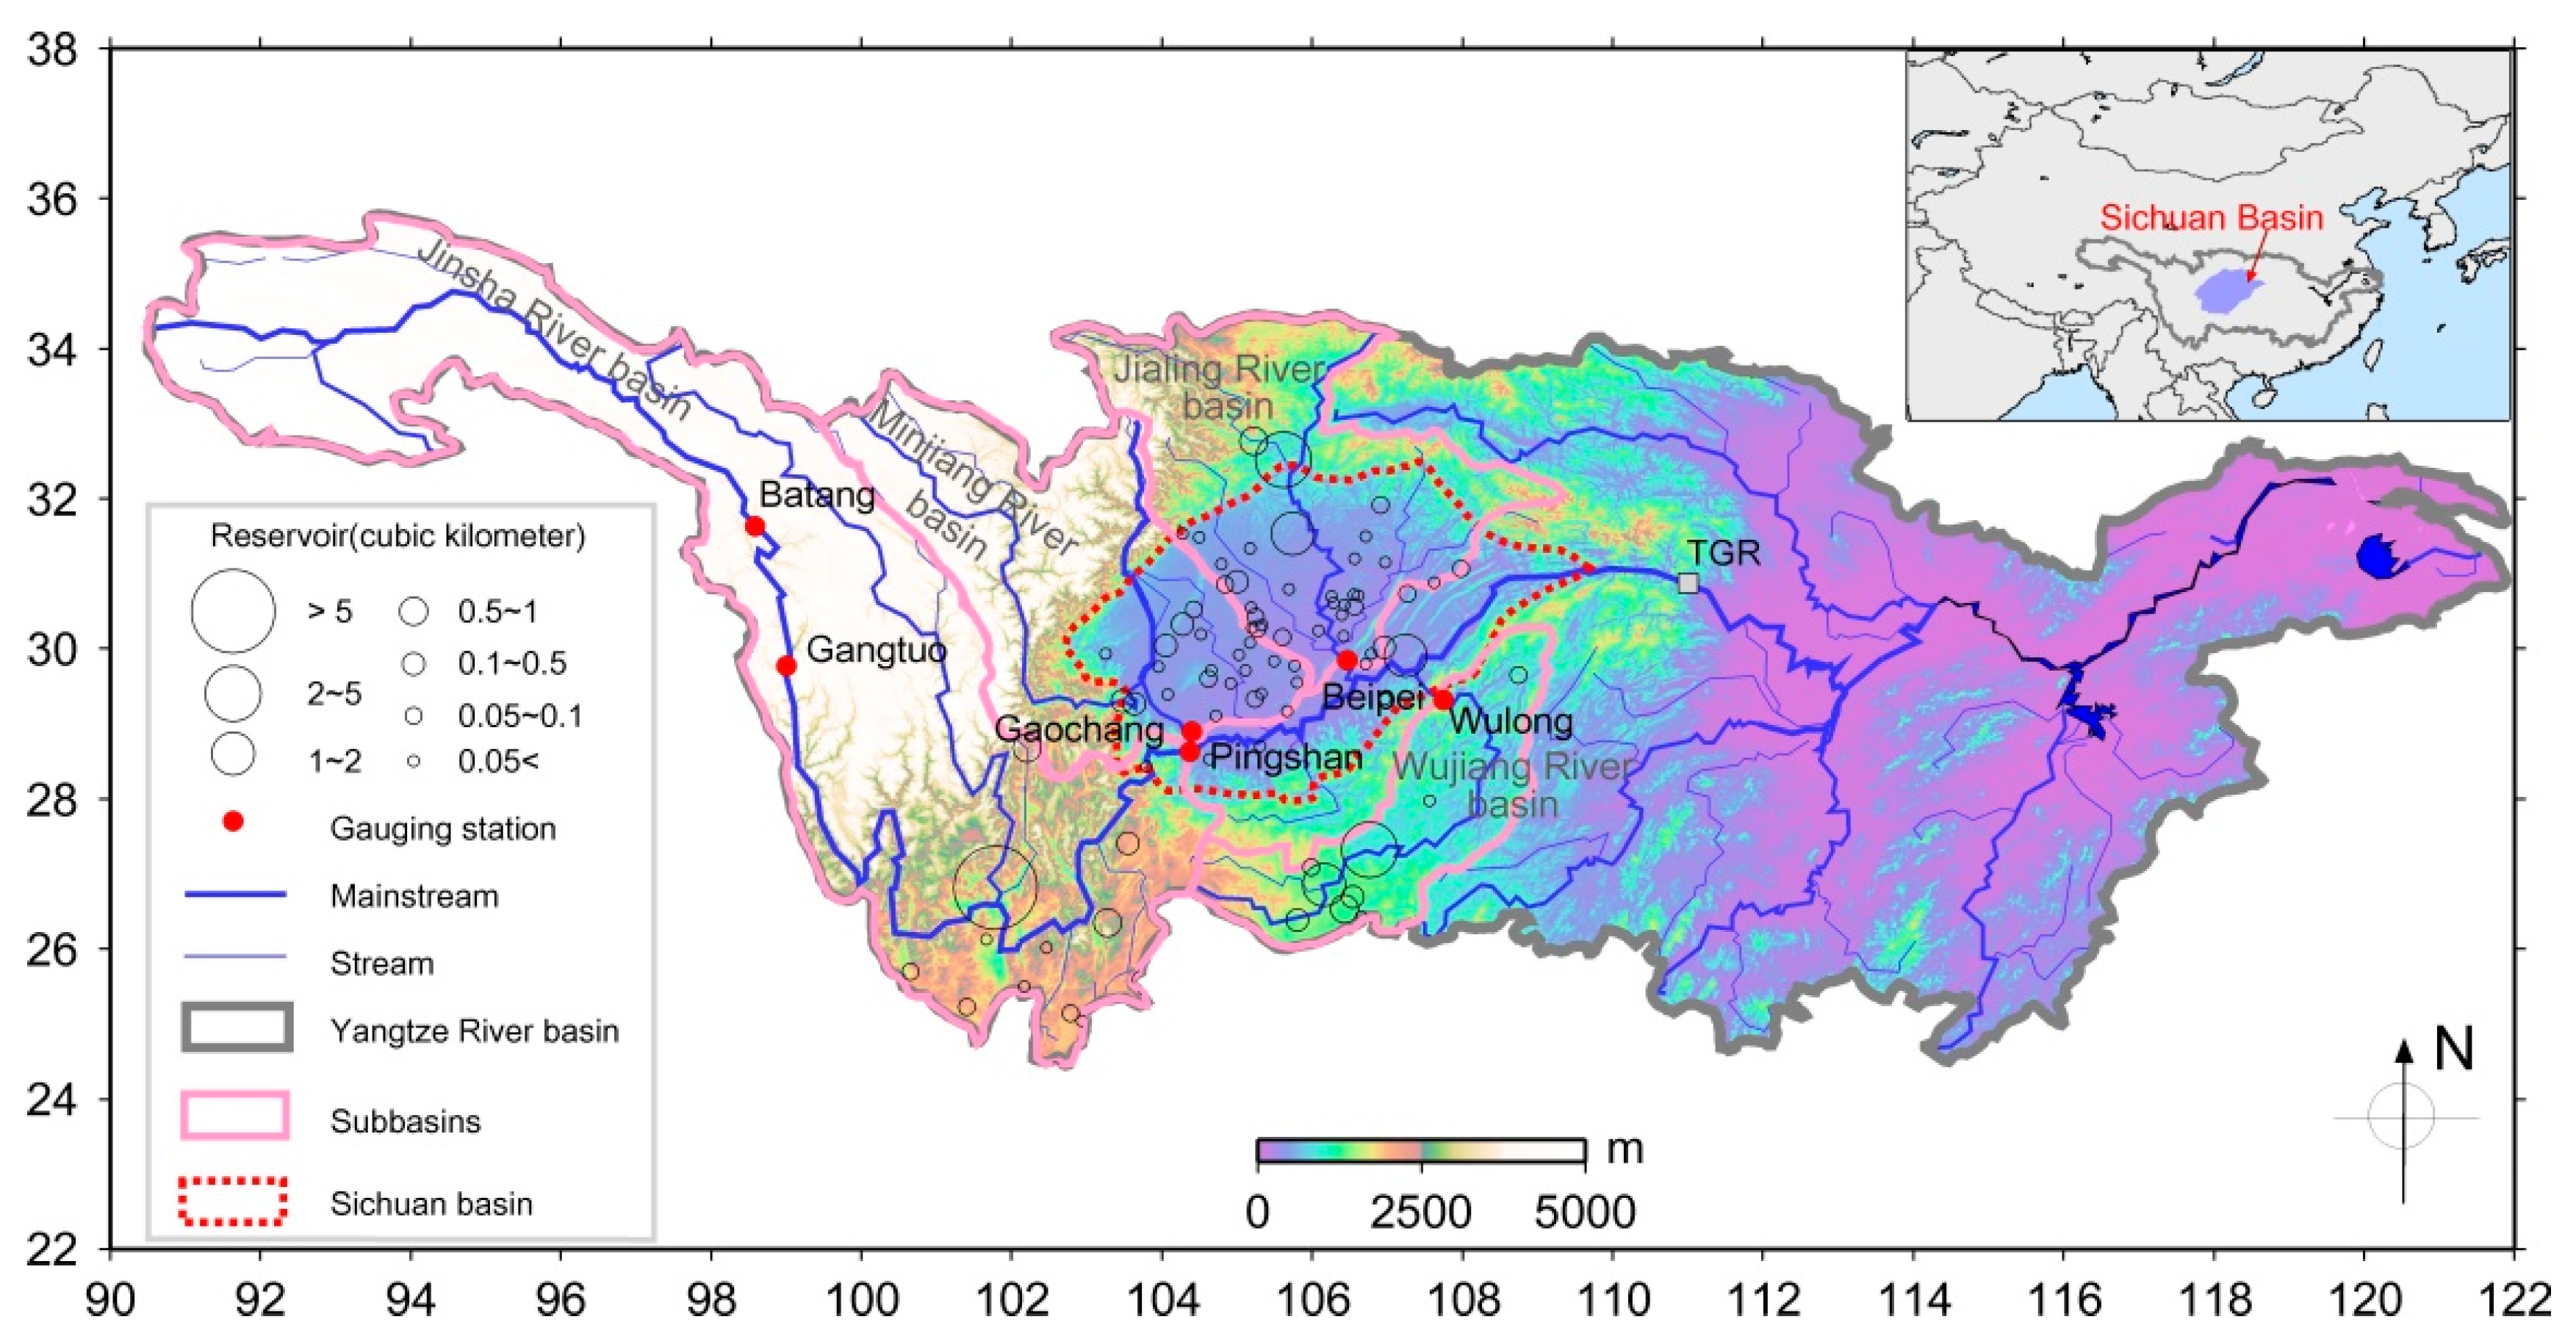
2. Study Region
3. Data and Methods
3.1. GRACE Data
3.2. Water Level, Precipitation and Temperature Data
3.3. ENSO, IOD and PDO
4. Results
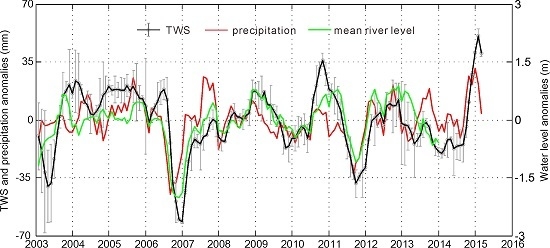
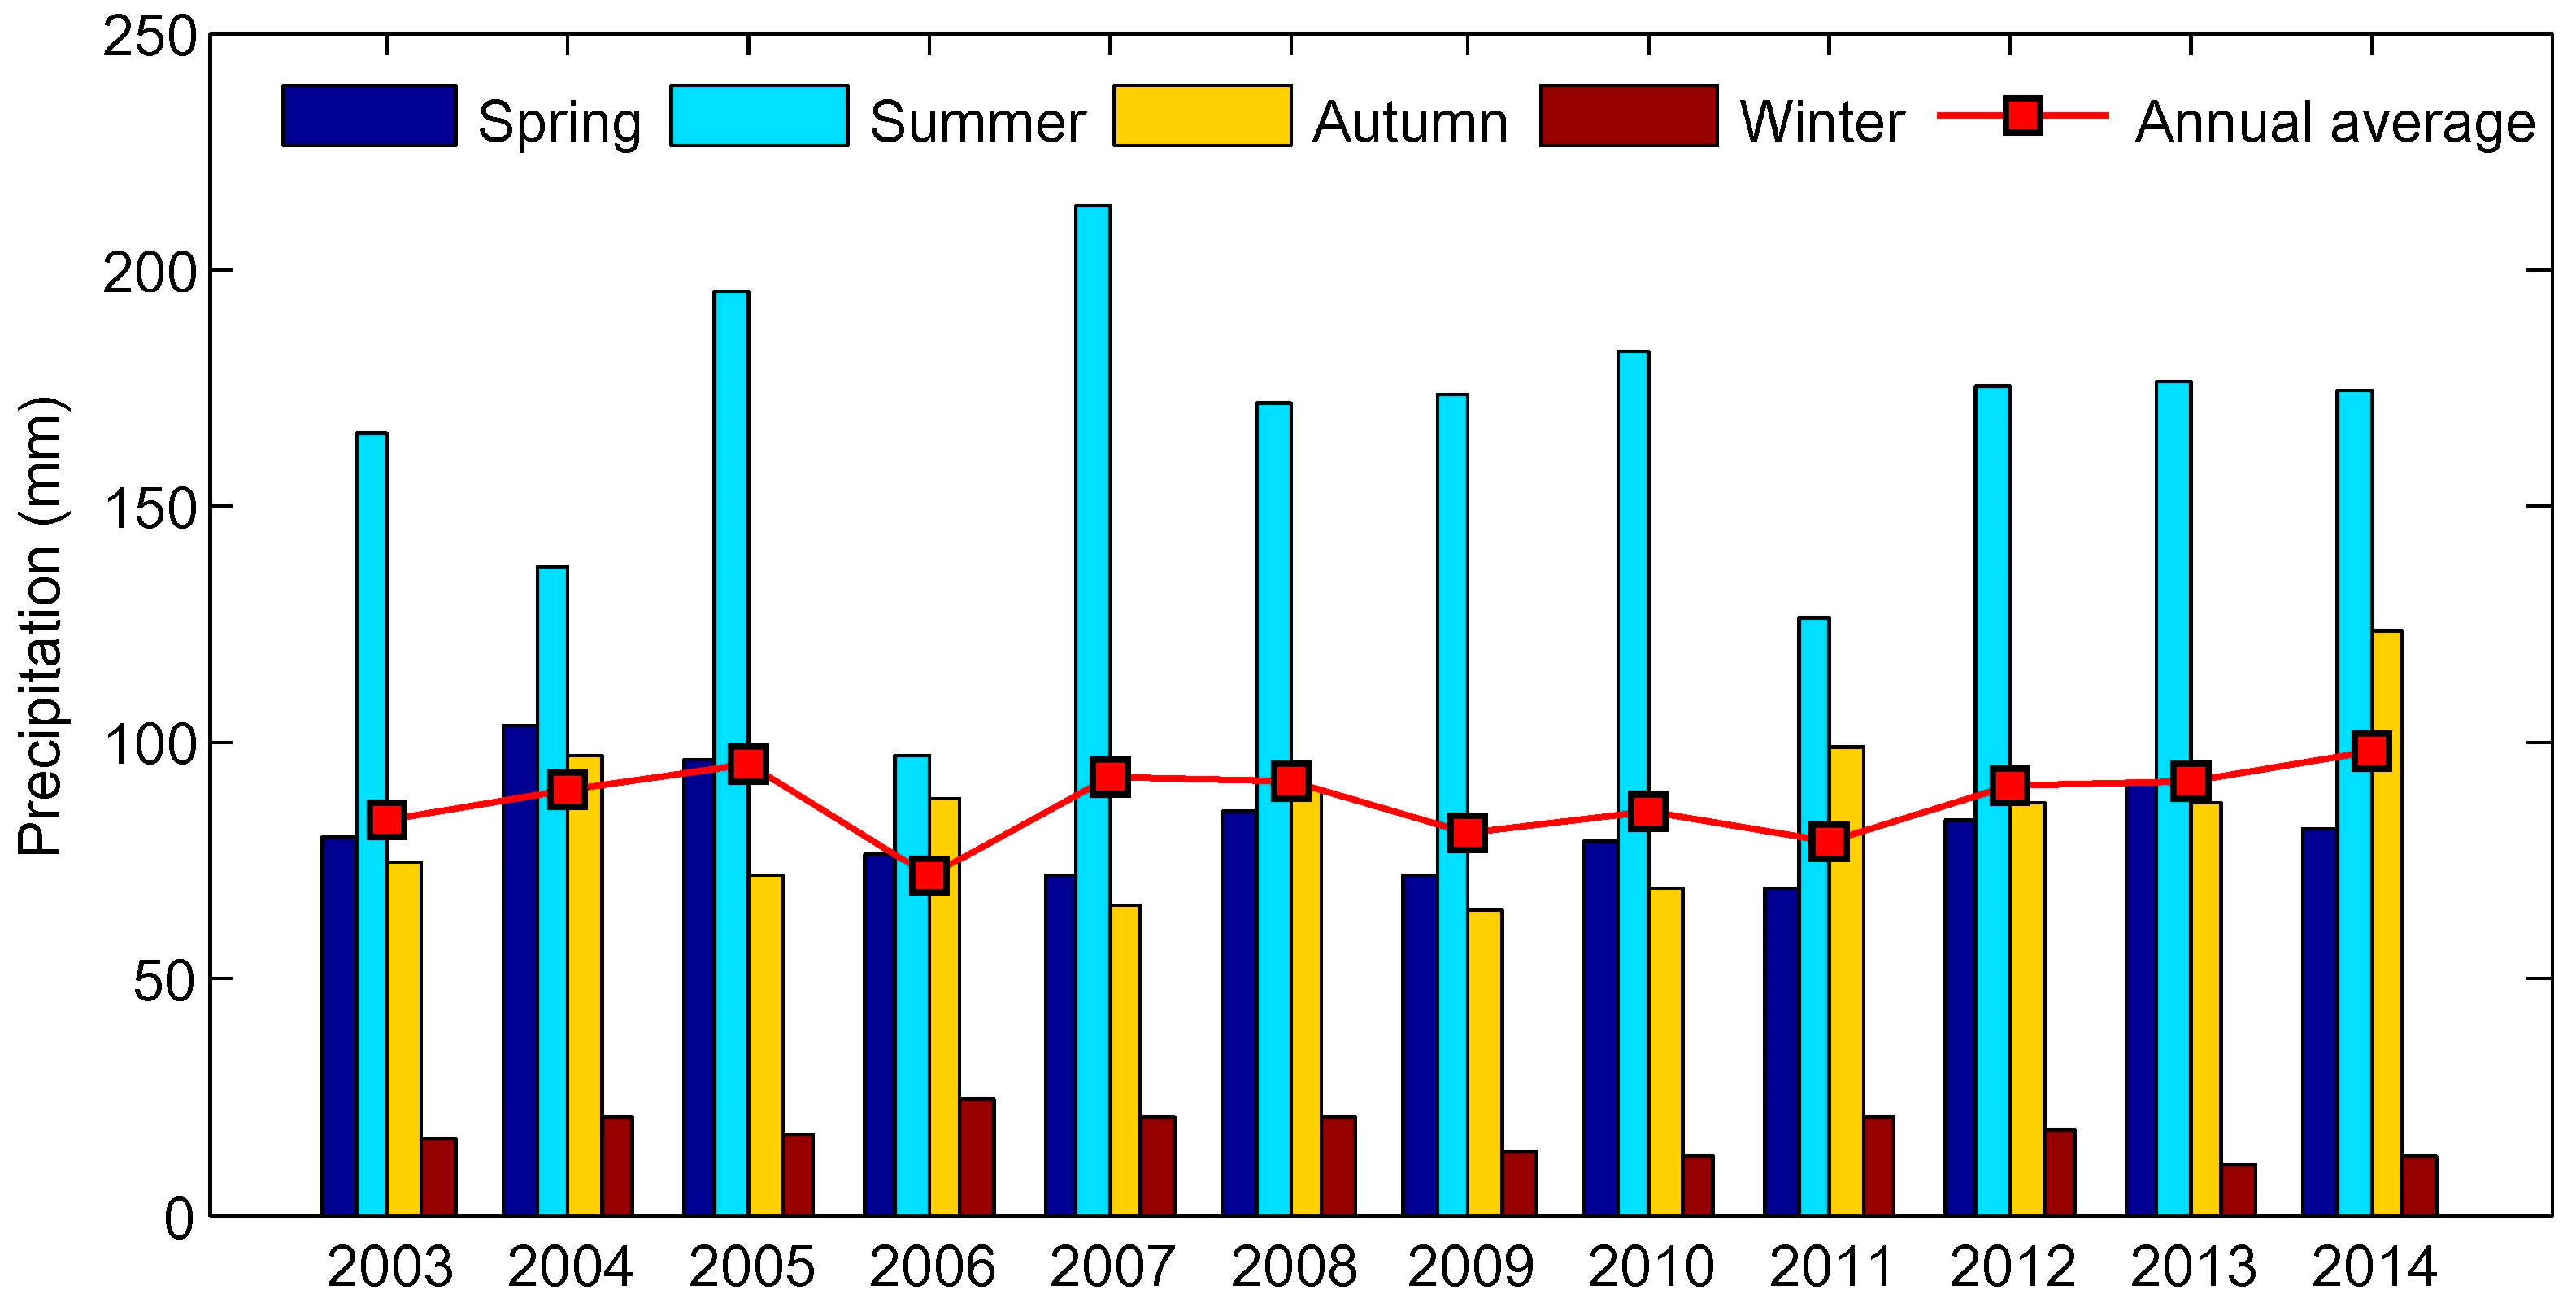
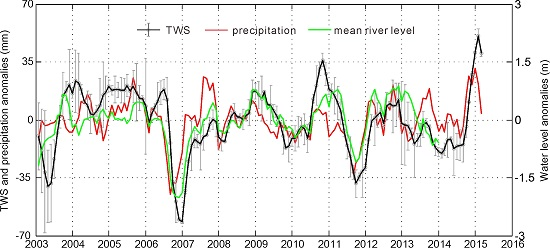
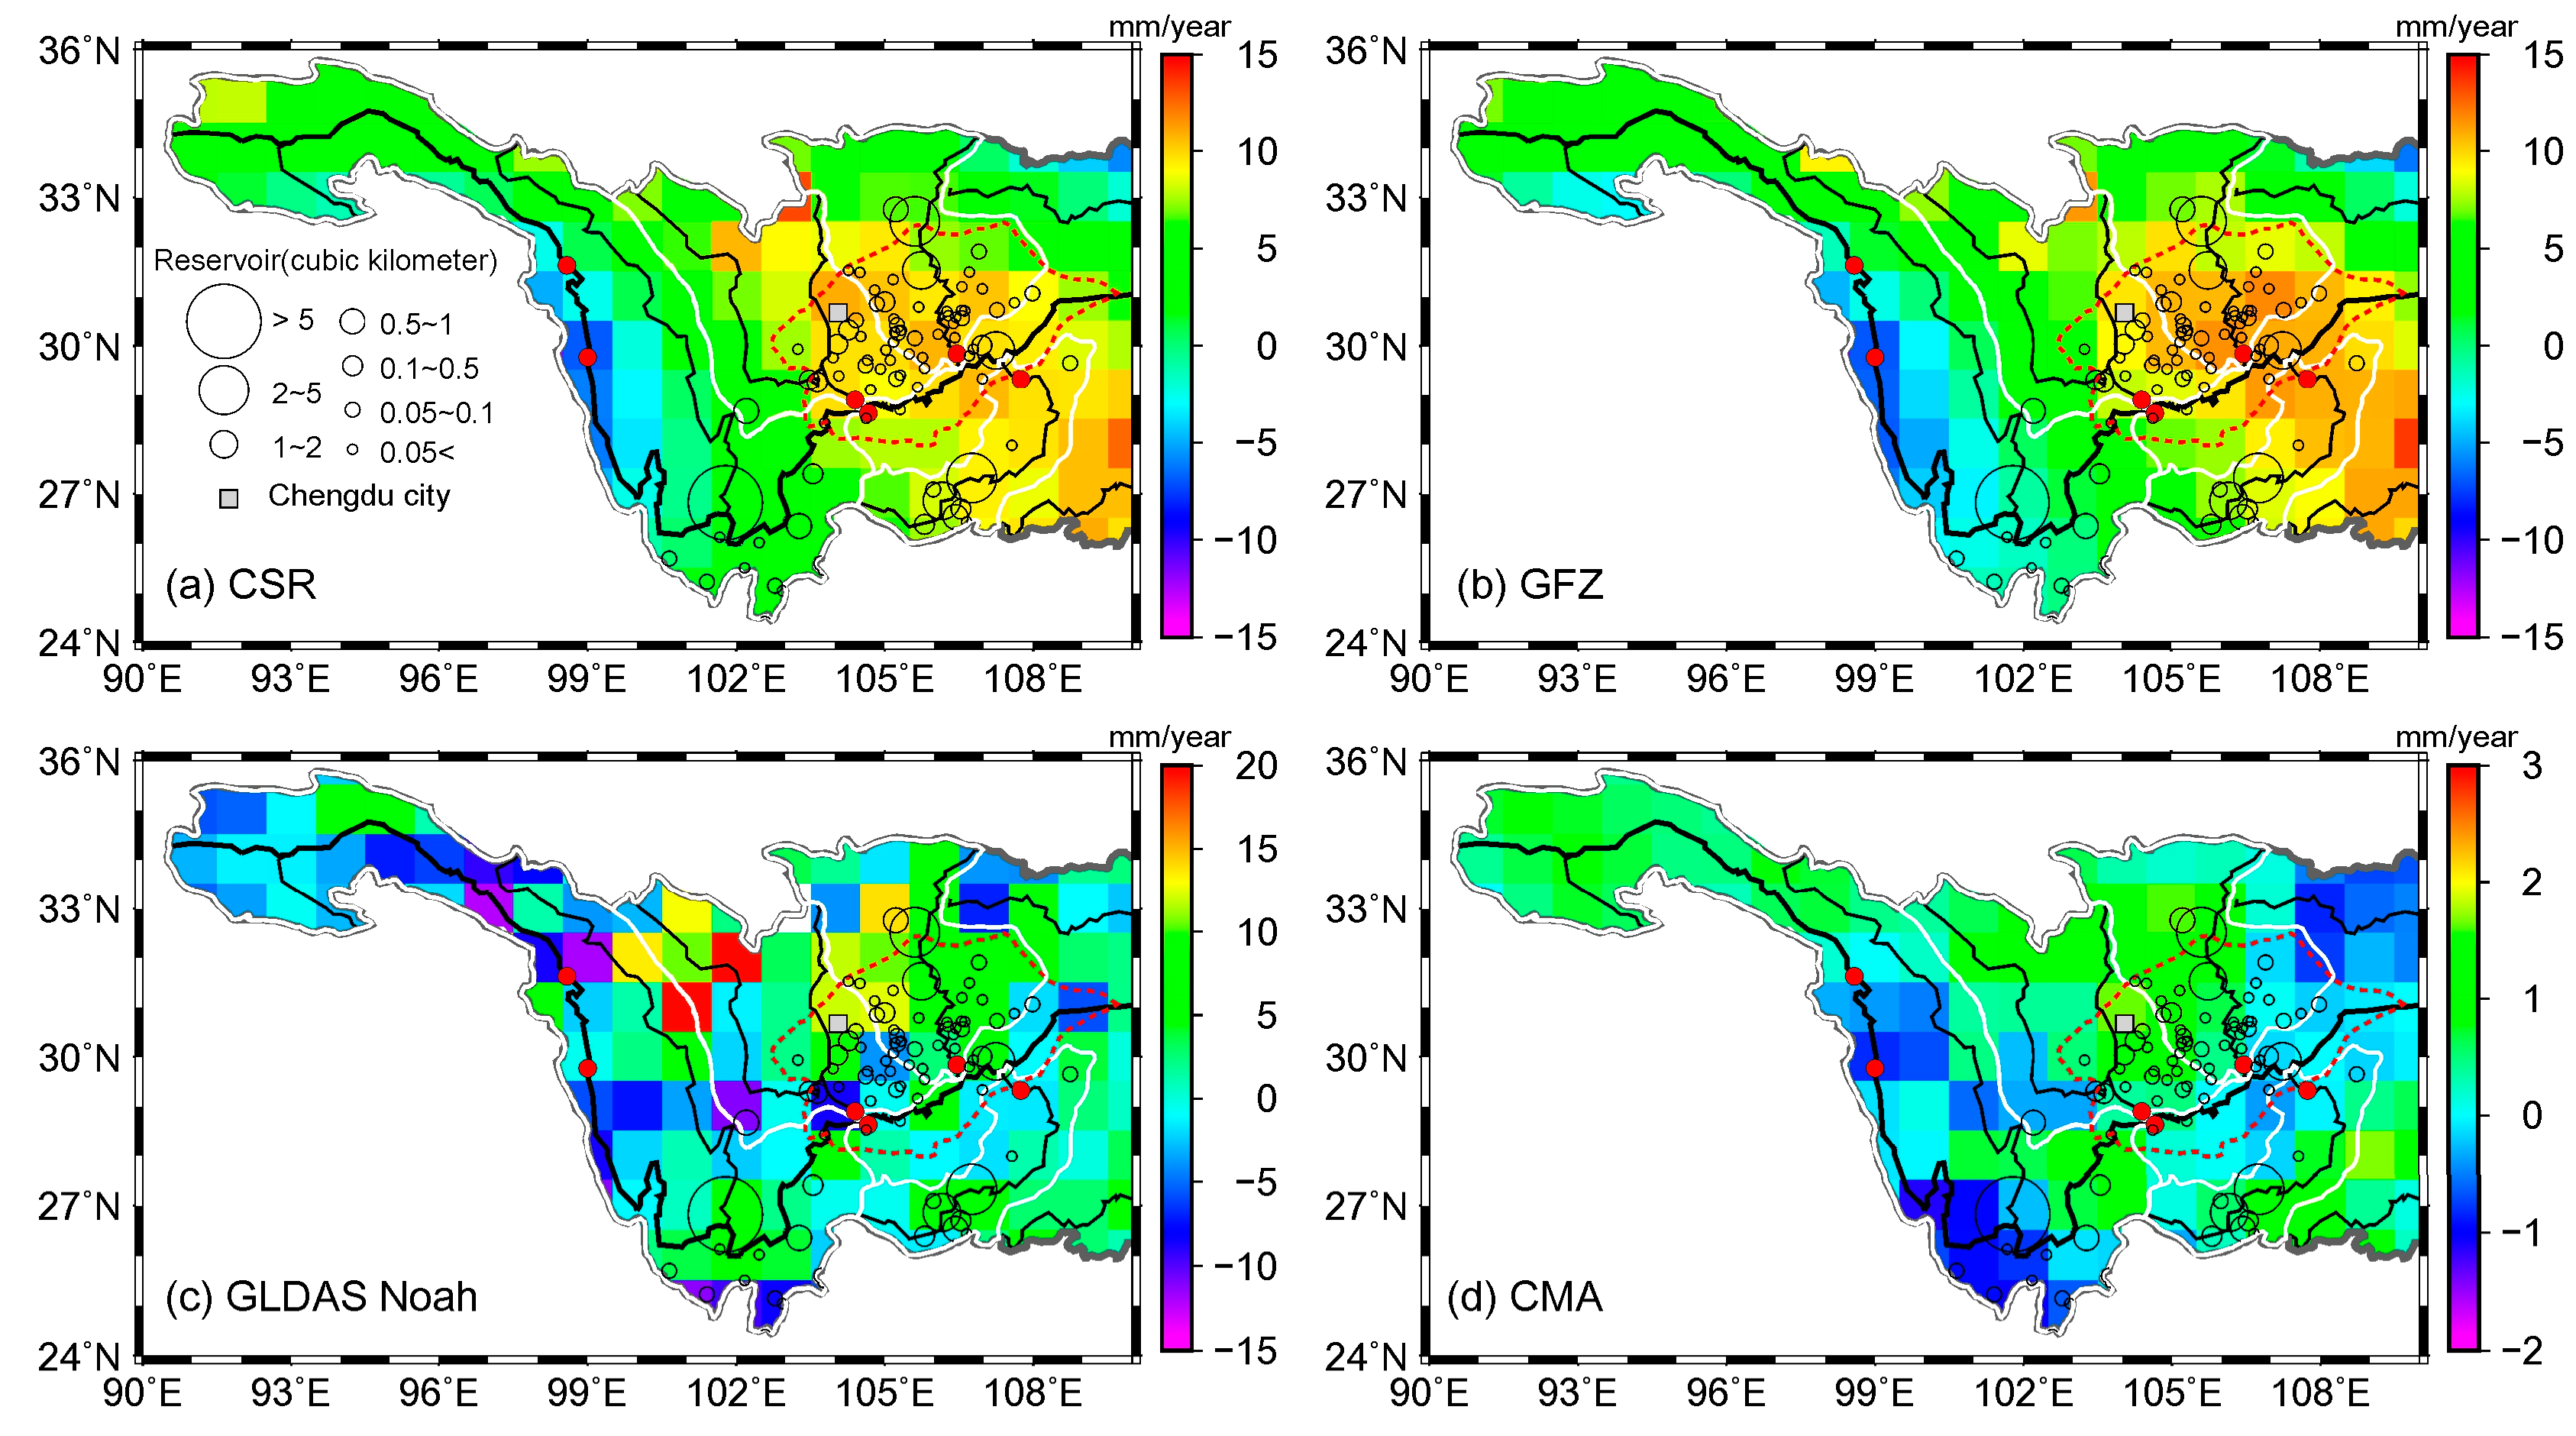
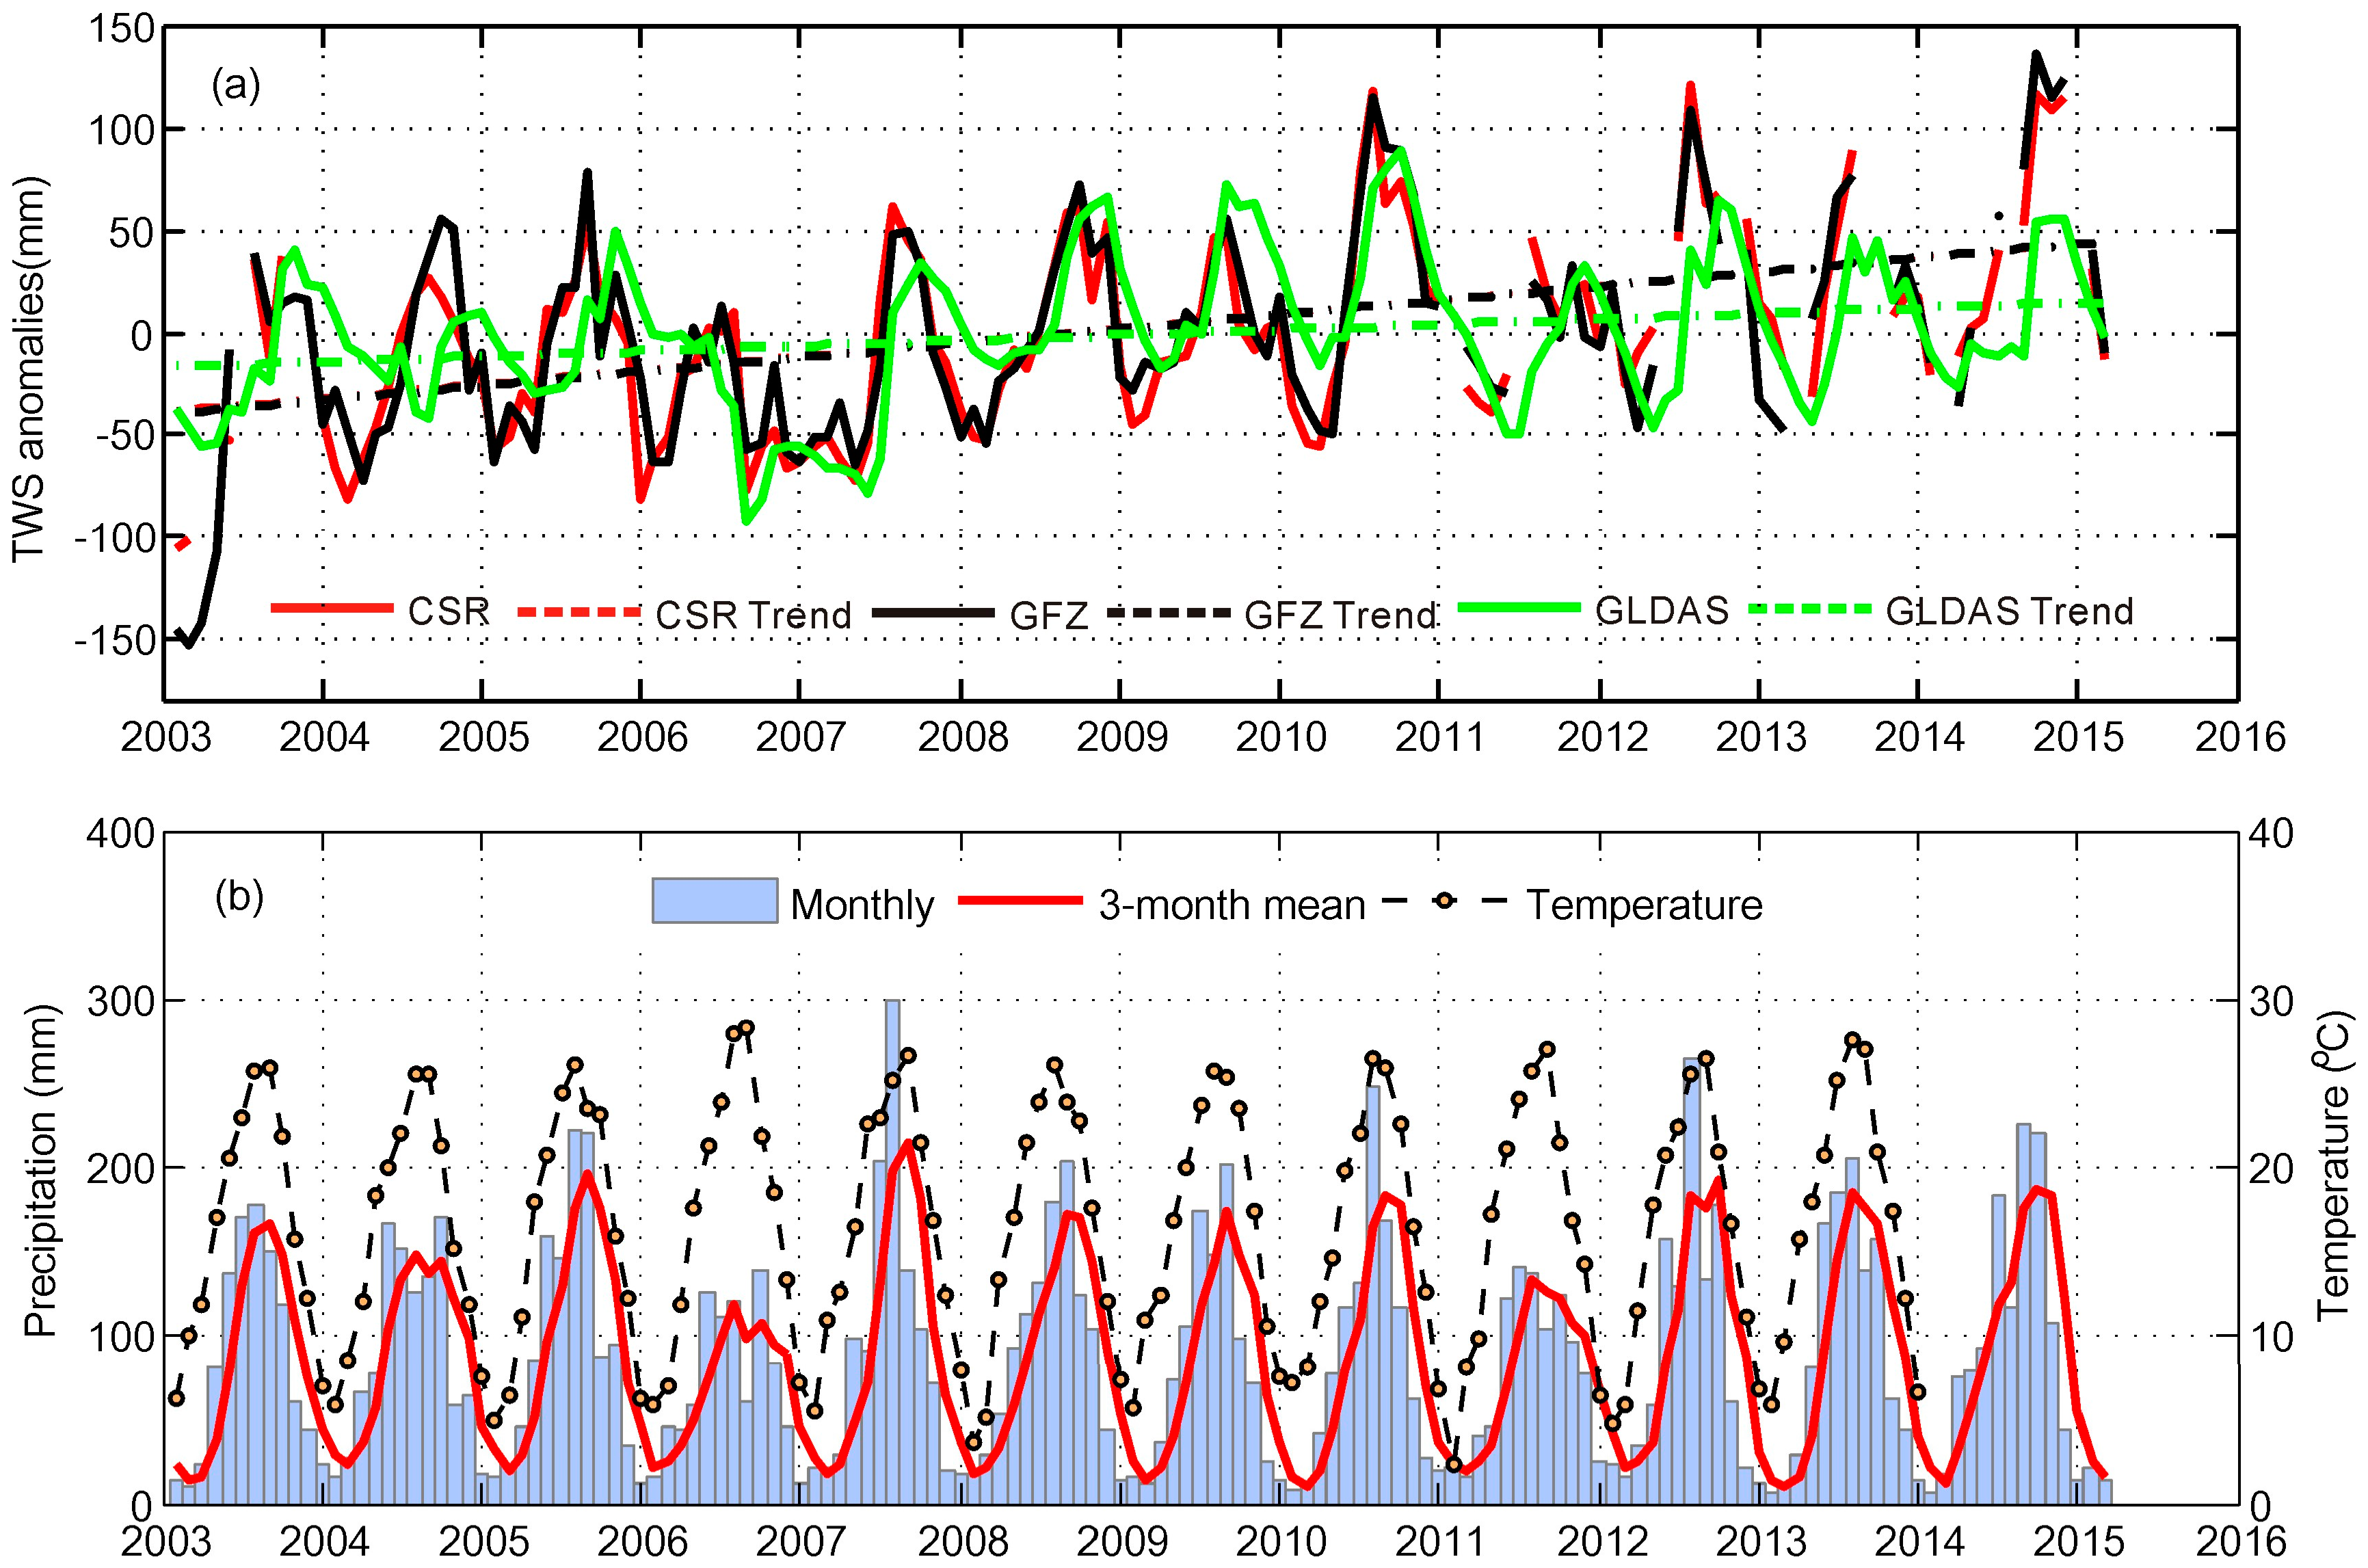
4.1. Comparisons of TWS, SM and Precipitation Changes
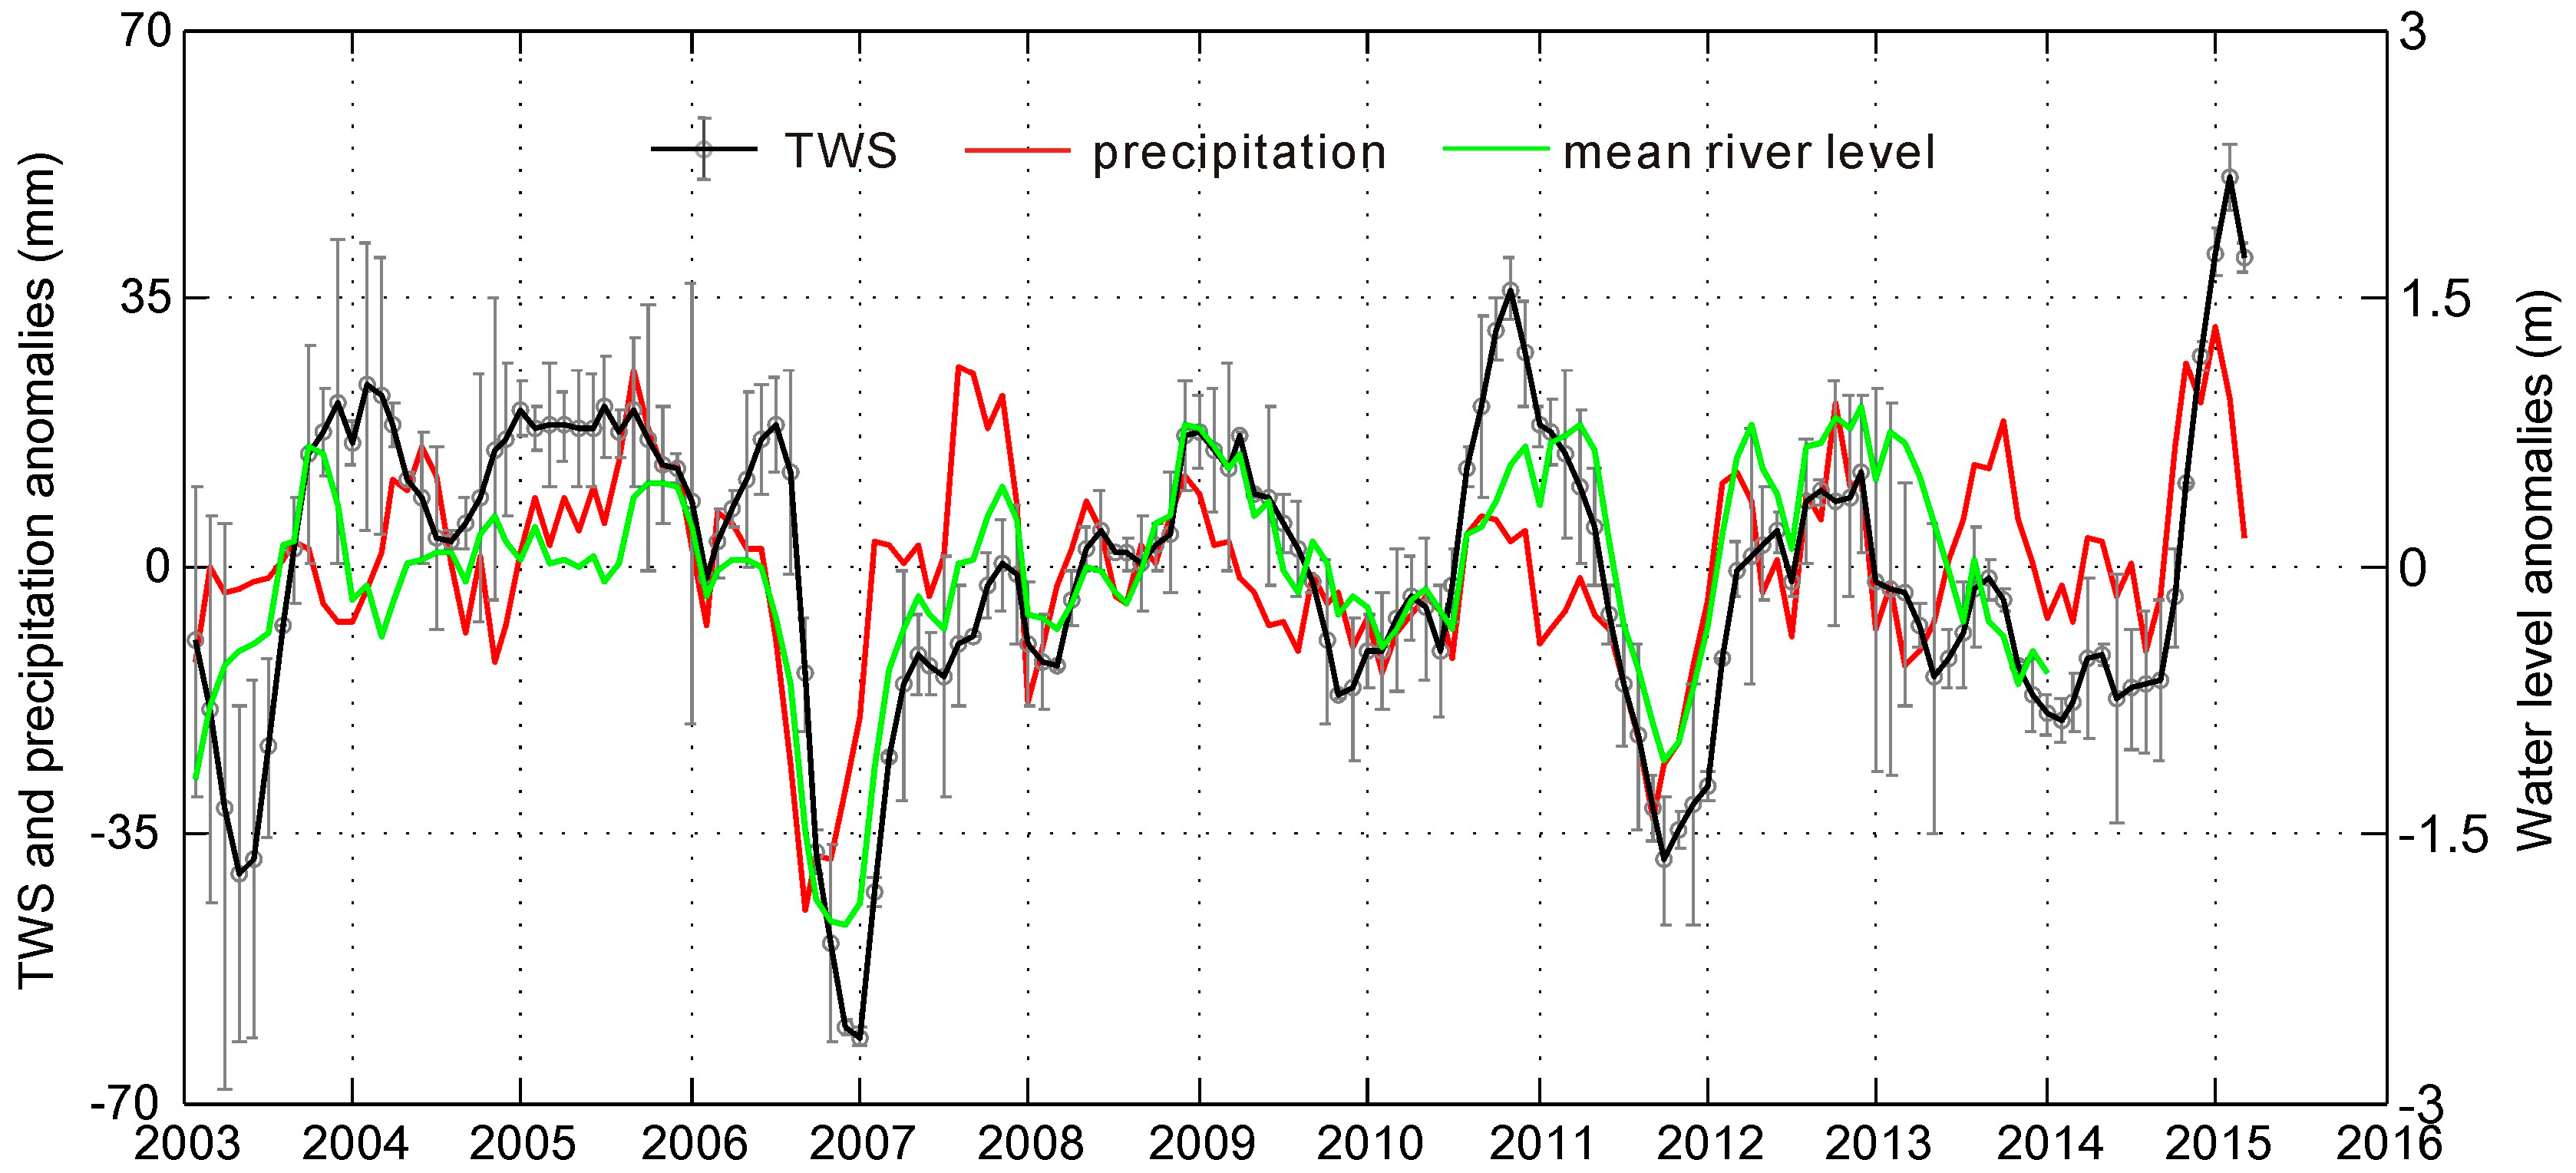
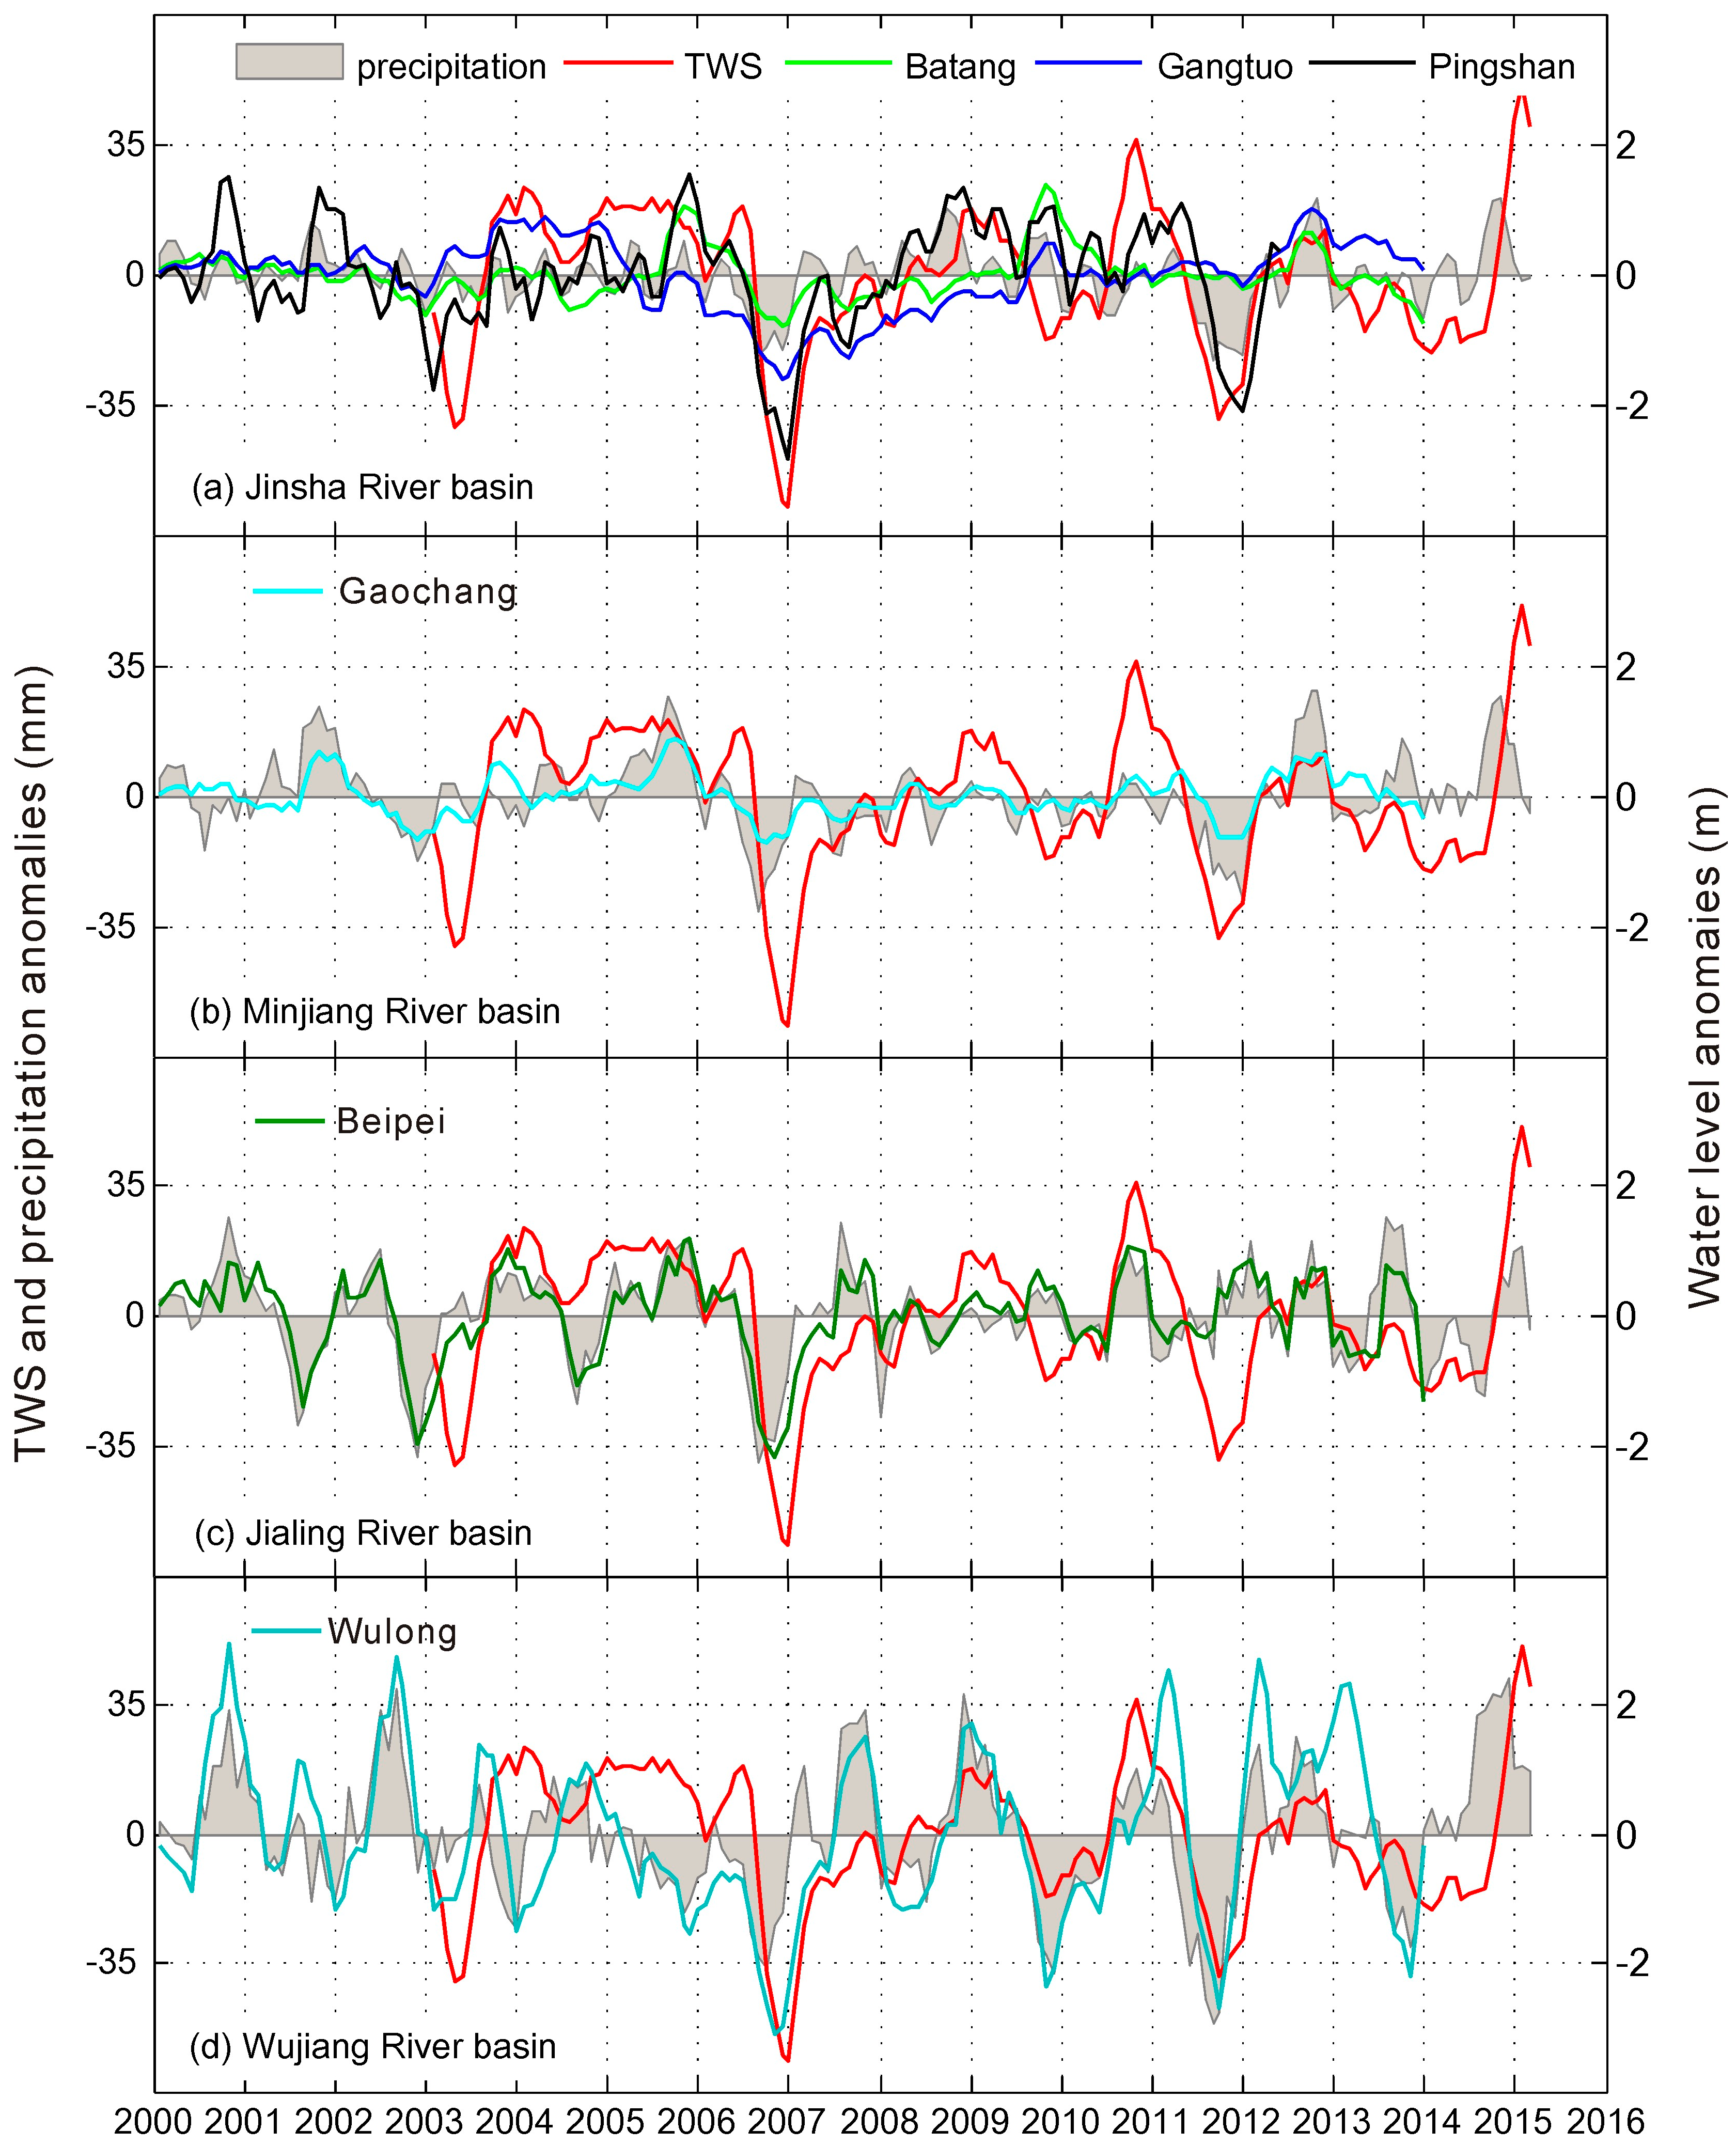
4.2. Correlation between the Sichuan Basin TWS and River Level
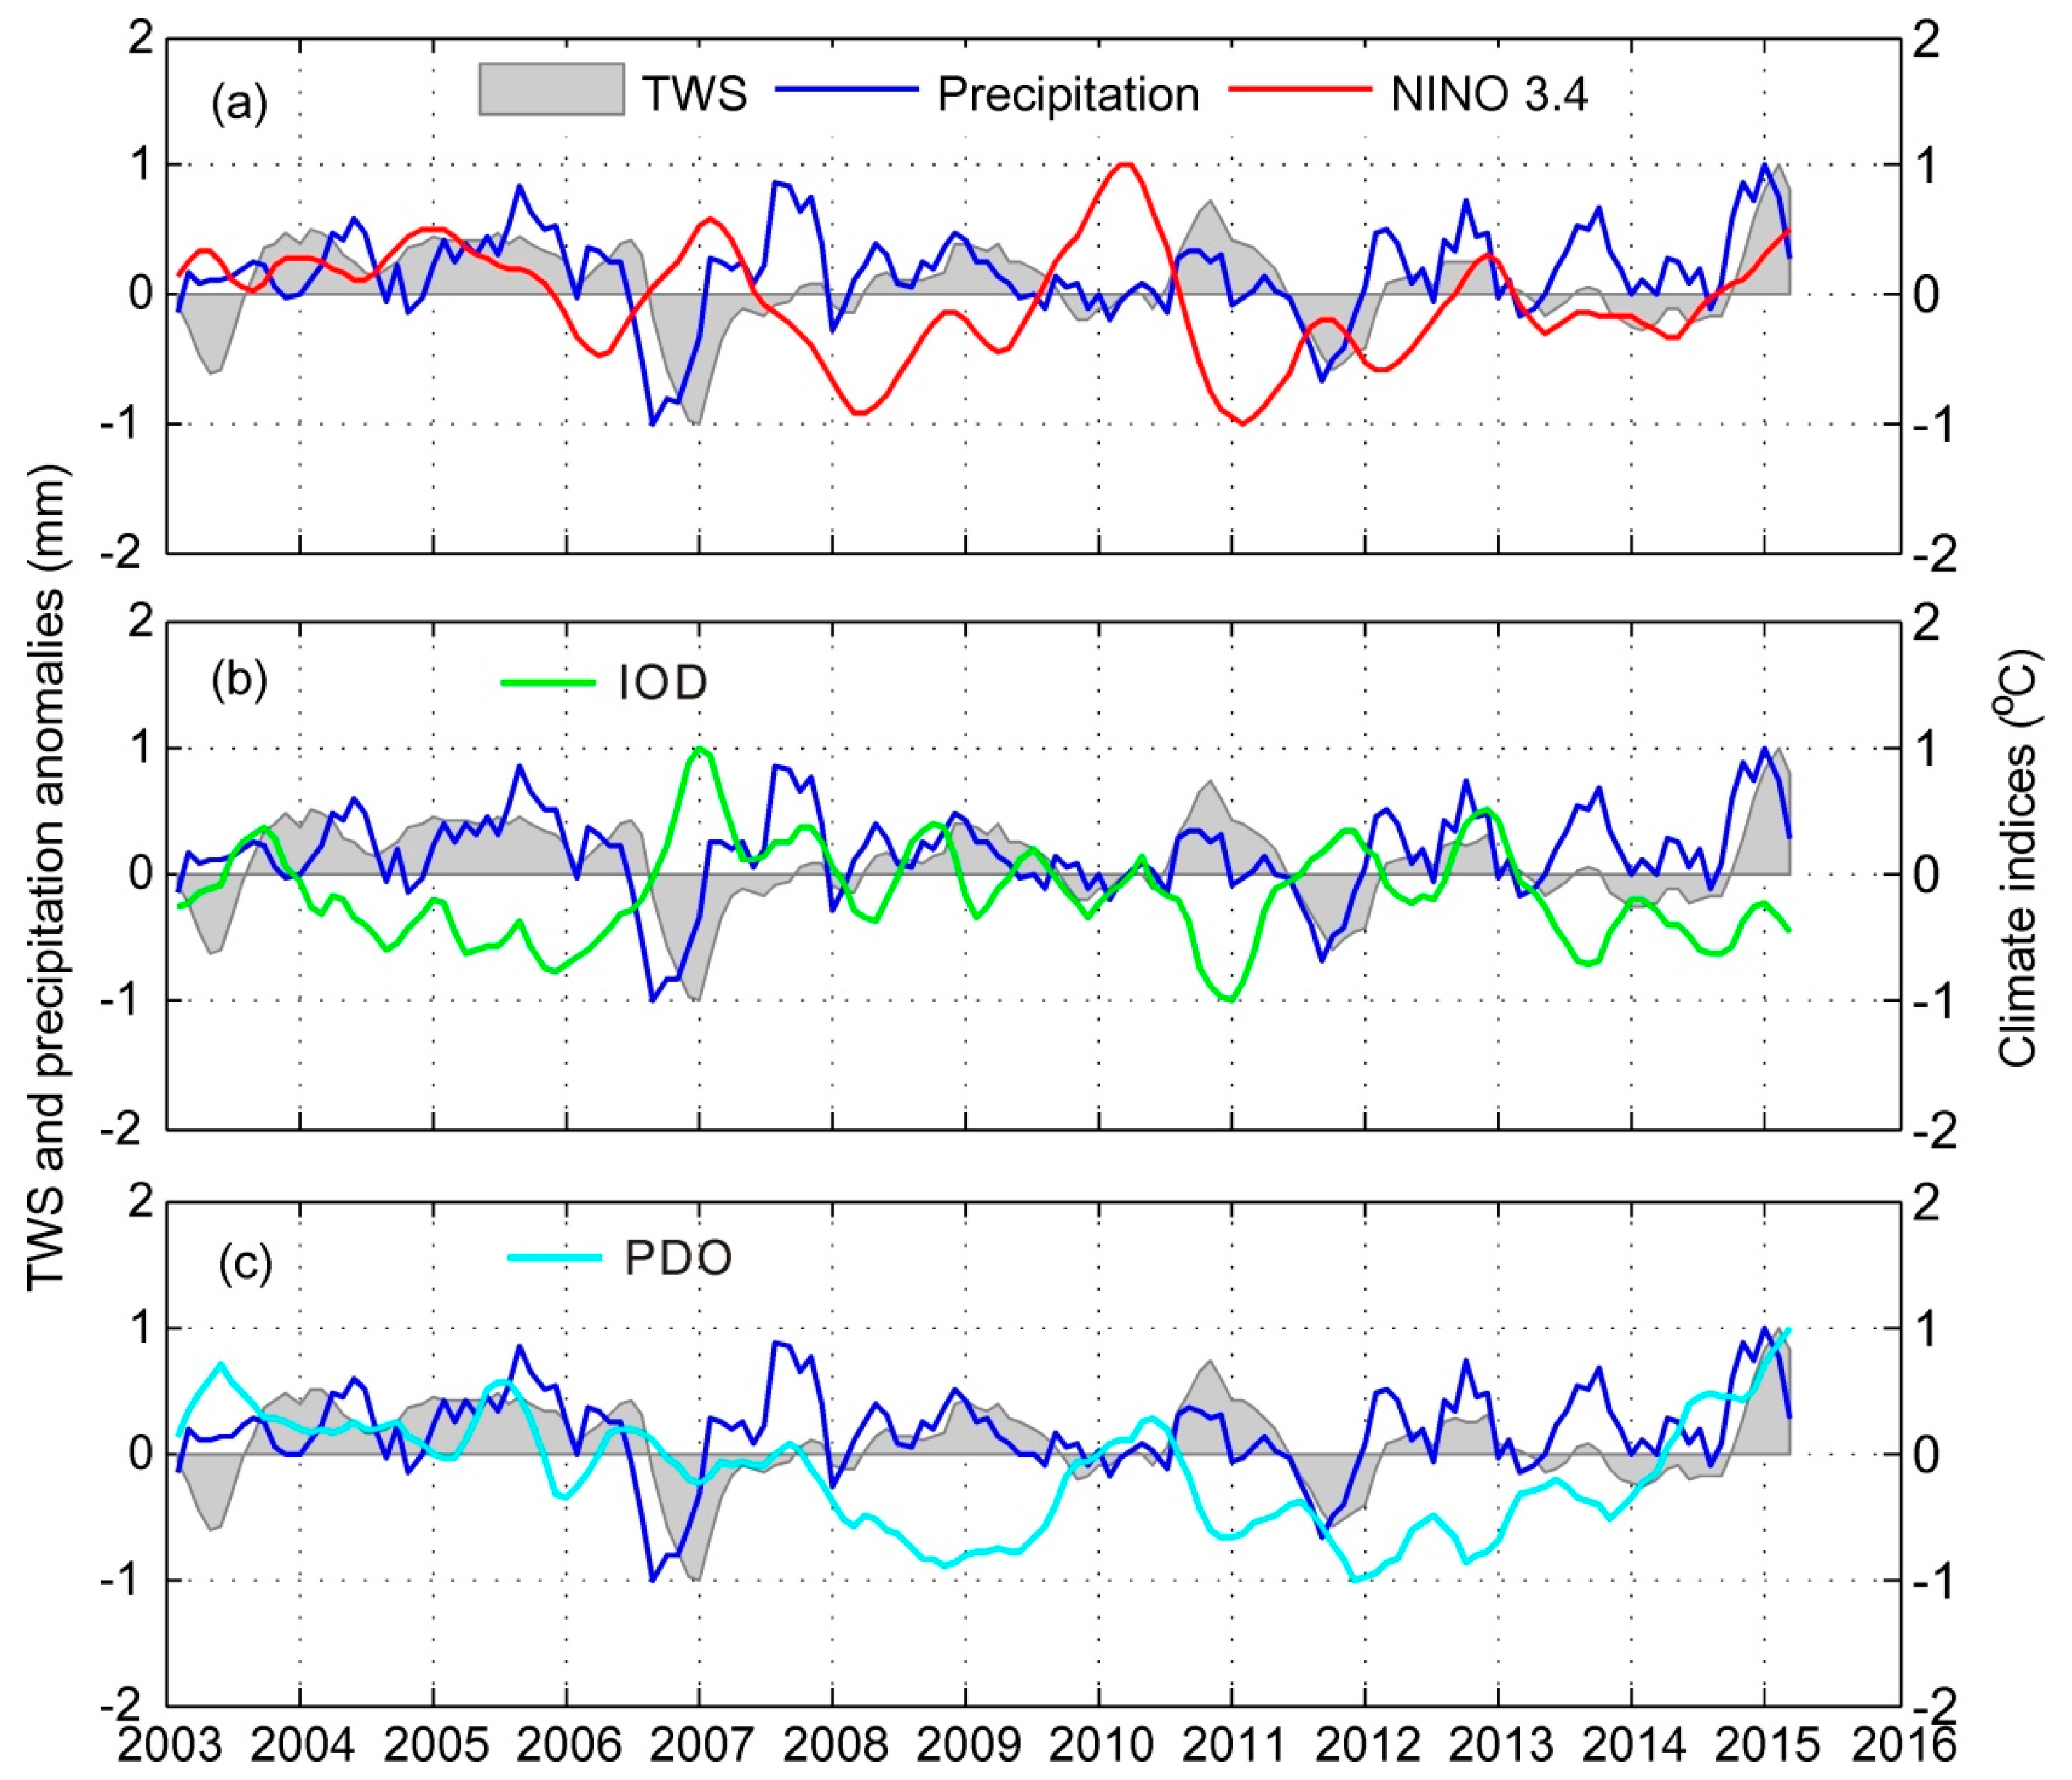
4.3. The Sichuan Basin TWS and Climate Variability
5. Conclusions
Acknowledgments
Author Contributions
Conflicts of Interest
References
- Duan, A.; Wu, G. Weakening trend in the atmospheric heat source over the Tibetan Plateau during recent decades. Part I: Observations. J. Clim. 2008, 21, 3149–3164. [Google Scholar] [CrossRef]
- Song, M.-B.; Li, T.-X.; Chen, J.Q. Preliminary analysis of precipitation-runoff features in the Jinsha River Basin. Procedia Eng. 2012, 28, 688–695. [Google Scholar]
- Tao, S.-Y.; Ding, Y.-H. Observational evidence of the influence of the Qinghai-Xizang (Tibet) Plateau on the occurrence of heavy rain and severe convective storms in China. Bull. Am. Meteorol. Soc. 1981, 62, 23–30. [Google Scholar] [CrossRef]
- Long, D.; Yang, Y.; Wada, Y.; Hong, Y.; Liang, W.; Chen, Y.; Yong, B.; Hou, A.; Wei, J.; Chen, L. Deriving scaling factors using a global hydrological model to restore GRACE total water storage changes for China’s Yangtze River Basin. Remote Sens. Environ. 2015, 168, 177–193. [Google Scholar] [CrossRef]
- Huang, Y.; Salama, M.; Krol, M.S.; Su, Z.; Hoekstra, A.Y.; Zeng, Y.; Zhou, Y. Estimation of human-induced changes in terrestrial water storage through integration of GRACE satellite detection and hydrological modeling: A case study of the Yangtze River basin. Water Resour. Res. 2015, 51, 8494–8516. [Google Scholar] [CrossRef]
- Chen, X.; Zong, Y.; Zhang, E.; Xu, J.; Li, S. Human impacts on the Changjiang (Yangtze) River basin, China, with special reference to the impacts on the dry season water discharges into the sea. Geomorphology 2001, 41, 111–123. [Google Scholar] [CrossRef]
- Xu, J.; Yang, D.; Yi, Y.; Lei, Z.; Chen, J.; Yang, W. Spatial and temporal variation of runoff in the Yangtze River basin during the past 40 years. Quat. Int. 2008, 186, 32–42. [Google Scholar] [CrossRef]
- Xu, K.; Yang, D.; Yang, H.; Li, Z.; Qin, Y.; Shen, Y. Spatio-temporal variation of drought in China during 1961–2012: A climatic perspective. J. Hydrol. 2015, 526, 253–264. [Google Scholar] [CrossRef]
- Zhang, W.; Lu, Q.; Gao, Z.; Peng, J. Response of remotely sensed normalized difference water deviation index to the 2006 drought of eastern Sichuan Basin. Sci. China Earth Sci. 2008, 51, 748–758. [Google Scholar] [CrossRef]
- Zhang, Z.; Chao, B.; Chen, J.; Wilson, C. Terrestrial water storage anomalies of Yangtze River Basin droughts observed by GRACE and connections with ENSO. Glob. Planet. Chang. 2015, 126, 35–45. [Google Scholar] [CrossRef]
- Zhai, P.; Zhang, X.; Wan, H.; Pan, X. Trends in total precipitation and frequency of daily precipitation extremes over China. J. Clim. 2005, 18, 1096–1108. [Google Scholar] [CrossRef]
- Wang, A.; Lettenmaier, D.P.; Sheffield, J. Soil moisture drought in China, 1950–2006. J. Clim. 2011, 24, 3257–3271. [Google Scholar] [CrossRef]
- Groisman, P.Y.; Knight, R.W.; Karl, T.R. Heavy precipitation and high streamflow in the contiguous United States: Trends in the twentieth century. Bull. Am. Meteorol. Soc. 2001, 82, 219–246. [Google Scholar] [CrossRef]
- Alexander, L.; Zhang, X.; Peterson, T.; Caesar, J.; Gleason, B.; Klein Tank, A.; Haylock, M.; Collins, D.; Trewin, B.; Rahimzadeh, F. Global observed changes in daily climate extremes of temperature and precipitation. J. Geophys. Res. 2006, 111. [Google Scholar] [CrossRef]
- Koster, R.D.; Dirmeyer, P.A.; Guo, Z.; Bonan, G.; Chan, E.; Cox, P.; Gordon, C.; Kanae, S.; Kowalczyk, E.; Lawrence, D. Regions of strong coupling between soil moisture and precipitation. Science 2004, 305, 1138–1140. [Google Scholar] [CrossRef] [PubMed]
- Dai, A.; Trenberth, K.E.; Qian, T. A global dataset of Palmer Drought Severity Index for 1870–2002: Relationship with soil moisture and effects of surface warming. J. Hydrometeorol. 2004, 5, 1117–1130. [Google Scholar] [CrossRef]
- McKee, T.B.; Doesken, N.J.; Kleist, J. Drought monitoring with multiple time scales. In Proceedings of the Ninth Conference on Applied Climatology, Dallas, TX, USA, 15–20 January 1995; pp. 233–236.
- Nalbantis, I.; Tsakiris, G. Assessment of hydrological drought revisited. Water Resour. Manag. 2009, 23, 881–897. [Google Scholar] [CrossRef]
- Shafer, B.; Dezman, L. Development of a surface water supply index (SWSI) to assess the severity of drought conditions in snowpack runoff areas. In Proceedings of the Western Snow Conference, Reno, NV, USA, 19–23 April 1982; pp. 164–175.
- Zeng, X.; Zhao, N.; Sun, H.; Ye, L.; Zhai, J. Changes and relationships of climatic and hydrological droughts in the Jialing River Basin, China. PLoS ONE 2015, 10, e0141648. [Google Scholar] [CrossRef] [PubMed]
- Xavier, L.; Becker, M.; Cazenave, A.; Longuevergne, L.; Llovel, W.; Rotunno Filho, O.C. Interannual variability in water storage over 2003–2008 in the Amazon basin from GRACE space gravimetry, in situ river level and precipitation data. Remote Sens. Environ. 2010, 114, 1629–1637. [Google Scholar] [CrossRef] [Green Version]
- Dai, A.; Qian, T.; Trenberth, K.E.; Milliman, J.D. Changes in continental freshwater discharge from 1948 to 2004. J. Clim. 2009, 22, 2773–2792. [Google Scholar] [CrossRef]
- AghaKouchak, A.; Farahmand, A.; Melton, F.; Teixeira, J.; Anderson, M.; Wardlow, B.; Hain, C. Remote sensing of drought: Progress, challenges and opportunities. Rev. Geophys. 2015, 53, 452–480. [Google Scholar] [CrossRef]
- Van Loon, A.F. Hydrological drought explained. Wiley Interdiscip. Rev. Water 2015, 2, 359–392. [Google Scholar] [CrossRef]
- Ramillien, G.; Famiglietti, J.S.; Wahr, J. Detection of continental hydrology and glaciology signals from GRACE: A review. Surv. Geophys. 2008, 29, 361–374. [Google Scholar] [CrossRef]
- Wouters, B.; Bonin, J.; Chambers, D.; Riva, R.; Sasgen, I.; Wahr, J. GRACE, time-varying gravity, Earth system dynamics and climate change. Rep. Prog. Phys. 2014, 77, 116801. [Google Scholar] [CrossRef] [PubMed]
- Famiglietti, J.S.; Rodell, M. Water in the balance. Science 2013, 340, 1300–1301. [Google Scholar] [CrossRef] [PubMed]
- Awange, J.; Forootan, E.; Kuhn, M.; Kusche, J.; Heck, B. Water storage changes and climate variability within the Nile Basin between 2002 and 2011. Adv. Water Resour. 2014, 73, 1–15. [Google Scholar] [CrossRef]
- Becker, M.; LLovel, W.; Cazenave, A.; Güntner, A.; Crétaux, J.-F. Recent hydrological behavior of the East African Great Lakes region inferred from GRACE, satellite altimetry and rainfall observations. C. R. Geosci. 2010, 342, 223–233. [Google Scholar] [CrossRef]
- Cao, Y.; Nan, Z.; Cheng, G. GRACE gravity satellite observations of terrestrial water storage changes for drought characterization in the arid land of Northwestern China. Remote Sens. 2015, 7, 1021–1047. [Google Scholar] [CrossRef]
- Thomas, A.C.; Reager, J.T.; Famiglietti, J.S.; Rodell, M. A GRACE-based water storage deficit approach for hydrological drought characterization. Geophys. Res. Lett. 2014, 41, 1537–1545. [Google Scholar] [CrossRef]
- Long, D.; Scanlon, B.R.; Longuevergne, L.; Sun, A.Y.; Fernando, D.N.; Save, H. GRACE satellite monitoring of large depletion in water storage in response to the 2011 drought in Texas. Geophys. Res. Lett. 2013, 40, 3395–3401. [Google Scholar] [CrossRef] [Green Version]
- Food and Agriculture Organization of the United Nations, Dams. Available online: http://www.fao.org/nr/water/aquastat/dams/index.stm (accessed on 9 January 2016).
- Han, G.; Liu, C. Hydrogeochemistry of Wujiang river water in Guizhou province, China. Chin. J. Geochem. 2001, 20, 240–248. [Google Scholar] [CrossRef]
- Zhang, M.; Wei, X.; Sun, P.; Liu, S. The effect of forest harvesting and climatic variability on runoff in a large watershed: The case study in the upper Minjiang River of Yangtze River basin. J. Hydrol. 2012, 464, 1–11. [Google Scholar] [CrossRef]
- Chen, J.; Wilson, C.R.; Tapley, B.D. The 2009 exceptional Amazon flood and interannual terrestrial water storage change observed by GRACE. Water Resour. Res. 2010, 46. [Google Scholar] [CrossRef]
- Wahr, J.; Molenaar, M.; Bryan, F. Time variability of the Earth’s gravity field: Hydrological and oceanic effects and their possible detection using GRACE. J. Geophys. Res. 1998, 103, 30205–30229. [Google Scholar] [CrossRef]
- Luo, Z.; Li, Q.; Zhang, K.; Wang, H. Trend of mass change in the Antarctic ice sheet recovered from the GRACE temporal gravity field. Sci. China Earth Sci. 2012, 55, 76–82. [Google Scholar] [CrossRef]
- Cheng, M.; Tapley, B.D. Variations in the Earth’s oblateness during the past 28 years. J. Geophys. Res. 2004, 109. [Google Scholar] [CrossRef]
- Swenson, S.; Wahr, J. Post-processing removal of correlated errors in GRACE data. Geophys. Res. Lett. 2006, 33. [Google Scholar] [CrossRef]
- Zhang, Z.Z.; Chao, B.F.; Lu, Y.; Hsu, H.T. An effective filtering for GRACE time-variable gravity: Fan filter. Geophys. Res. Lett. 2009, 36. [Google Scholar] [CrossRef]
- Rodell, M.; Houser, P.; Jambor, U.E.A.; Gottschalck, J.; Mitchell, K.; Meng, C.; Arsenault, K.; Cosgrove, B.; Radakovich, J.; Bosilovich, M. The global land data assimilation system. Bull. Am. Meteorol. Soc. 2004, 85, 381–394. [Google Scholar] [CrossRef]
- GRACE Tellus. Available online: http://GRACEtellus.jpl.nasa.gov/ (accessed on 2 July 2015).
- China Meteorological Administration. China Meteorological Data Sharing Service System. Available online: http://cdc.nmic.cn/home.do (accessed on 2 July 2015).
- Morishita, Y.; Heki, K. Characteristic precipitation patterns of El Niño/La Niña in time-variable gravity fields by GRACE. Earth Planet. Sci. Lett. 2008, 272, 677–682. [Google Scholar] [CrossRef]
- Linage, C.; Kim, H.; Famiglietti, J.S.; Yu, J.Y. Impact of Pacific and Atlantic sea surface temperatures on interannual and decadal variations of GRACE land water storage in tropical South America. J. Geophys. Res. 2013, 118, 10811–10829. [Google Scholar] [CrossRef]
- Guo, Y.; Wang, J.; Zhao, Y. Numerical simulation of the 1999 Yangtze River valley heavy rainfall including sensitivity experiments with different SSTA. Adv. Atmos. Sci. 2004, 21, 23–33. [Google Scholar] [CrossRef]
- Wang, Y.; Yan, Z. Changes of frequency of summer precipitation extremes over the Yangtze River in association with large-scale oceanic-atmospheric conditions. Adv. Atmos. Sci. 2011, 28, 1118–1128. [Google Scholar] [CrossRef]
- Hu, K.; Huang, G.; Wu, R. A strengthened influence of ENSO on August high temperature extremes over the Southern Yangtze River Valley since the late 1980s. J. Clim. 2013, 26, 2205–2221. [Google Scholar] [CrossRef]
- Tang, J.; Cheng, H.; Liu, L. Assessing the recent droughts in Southwestern China using satellite gravimetry. Water Resour. Res. 2014, 50, 3030–3038. [Google Scholar] [CrossRef]
- Wang, B.; Zhang, Q. Pacific-East Asian teleconnection. Part II: How the Philippine Sea anomalous anticyclone is established during El Niño development. J. Clim. 2002, 15, 3252–3265. [Google Scholar] [CrossRef]
- Saji, N.; Goswami, B.N.; Vinayachandran, P.; Yamagata, T. A dipole mode in the tropical Indian Ocean. Nature 1999, 401, 360–363. [Google Scholar] [CrossRef] [PubMed]
- Ashok, K.; Guan, Z.; Saji, N.; Yamagata, T. Individual and combined influences of ENSO and the Indian Ocean dipole on the Indian summer monsoon. J. Clim. 2004, 17, 3141–3155. [Google Scholar] [CrossRef]
- Meyers, G.; McIntosh, P.; Pigot, L.; Pook, M. The years of El Niño, La Niña, and interactions with the tropical Indian Ocean. J. Clim. 2007, 20, 2872–2880. [Google Scholar] [CrossRef]
- Risbey, J.S.; Pook, M.J.; McIntosh, P.C.; Wheeler, M.C.; Hendon, H.H. On the remote drivers of rainfall variability in Australia. Mon. Weather Rev. 2009, 137, 3233–3253. [Google Scholar] [CrossRef]
- Becker, R.; Sultan, M.; Becker, D. Effects of the Indian Ocean Temperature on Nile River Flow Volumes. In Proceedings of the American Geophysical Union Fall Meeting, Washington, DC, USA, 2009; Volume 1, p. 0262.
- Sahu, N.; Behera, S.K.; Yamashiki, Y.; Takara, K.; Yamagata, T. IOD and ENSO impacts on the extreme stream-flows of Citarum river in Indonesia. Clim. Dyn. 2012, 39, 1673–1680. [Google Scholar] [CrossRef]
- Ouyang, R.; Liu, W.; Fu, G.; Liu, C.; Hu, L.; Wang, H. Linkages between ENSO/PDO signals and precipitation, streamflow in China during the last 100 years. Hydrol. Earth Syst. Sci. 2014, 18, 3651–3661. [Google Scholar] [CrossRef]
- Verdon, D.C.; Wyatt, A.M.; Kiem, A.S.; Franks, S.W. Multidecadal variability of rainfall and streamflow: Eastern Australia. Water Resour. Res. 2004, 40. [Google Scholar] [CrossRef]
- Da Silva, G.A.M.; Drumond, A.; Ambrizzi, T. The impact of El Niño on South American summer climate during different phases of the Pacific Decadal Oscillation. Theor. Appl. Clim. 2011, 106, 307–319. [Google Scholar] [CrossRef]
- Zhao, Q.; Wu, W.; Wu, Y. Variations in China’s terrestrial water storage over the past decade using GRACE data. Geod. Geodyn. 2015, 6, 187–193. [Google Scholar] [CrossRef]
- Landerer, F.; Swenson, S. Accuracy of scaled GRACE terrestrial water storage estimates. Water Resour. Res. 2012, 48. [Google Scholar] [CrossRef]
- Ministry of Water Resources, the People’s Republic of China. Available online: http://www.mwr.gov.cn/slzx/sjzsdwdt/201309/t20130910_512085.html (accessed on 21 April 2016).
- Korecha, D.; Barnston, A.G. Predictability of June-September rainfall in Ethiopia. Mon. Weather Rev. 2007, 135, 628–650. [Google Scholar] [CrossRef]
- Chakravorty, S.; Gnanaseelan, C.; Chowdary, J.; Luo, J.J. Relative role of El Niño and IOD forcing on the southern tropical Indian Ocean Rossby waves. J. Geophys. Res. 2014, 119, 5105–5122. [Google Scholar] [CrossRef]
- Peterson, T.C.; Stott, P.A.; Herring, S. Explaining extreme events of 2011 from a climate perspective. Bull. Am. Meteorol. Soc. 2012, 93, 1041–1067. [Google Scholar] [CrossRef]
- Chen, J.; Wen, Z.; Wu, R.; Chen, Z.; Zhao, P. Interdecadal changes in the relationship between Southern China winter-spring precipitation and ENSO. Clim. Dyn. 2014, 43, 1327–1338. [Google Scholar] [CrossRef]
- Wu, R.; Yang, S.; Wen, Z.; Huang, G.; Hu, K. Interdecadal change in the relationship of southern China summer rainfall with tropical Indo-Pacific SST. Theor. Appl. Clim. 2012, 108, 119–133. [Google Scholar] [CrossRef]
- Wu, G.; Zhang, Y. Tibetan Plateau forcing and the timing of South Asia monsoon and South China Sea monsoon. Mon. Weaather Rev. 1998, 126, 913–927. [Google Scholar] [CrossRef]
- Xu, M.; Chang, C.P.; Fu, C.; Qi, Y.; Robock, A.; Robinson, D.; Zhang, H.M. Steady decline of east Asian monsoon winds, 1969–2000: Evidence from direct ground measurements of wind speed. J. Geophys. Res. 2006, 111. [Google Scholar] [CrossRef] [Green Version]
- Zhang, Q.; Xu, C.-Y.; Jiang, T.; Wu, Y. Possible influence of ENSO on annual maximum streamflow of the Yangtze River, China. J. Hydrol. 2007, 333, 265–274. [Google Scholar] [CrossRef]
- Wang, L.; Chen, W.; Zhou, W.; Huang, G. Drought in southwest China: A review. Atmos. Ocean. Sci. Lett. 2015, 10. [Google Scholar] [CrossRef]
- Lu, E.; Liu, S.; Luo, Y.; Zhao, W.; Li, H.; Chen, H.; Zeng, Y.; Liu, P.; Wang, X.; Higgins, R.W. The atmospheric anomalies associated with the drought over the Yangtze River basin during spring 2011. J. Geophys. Res. 2014, 119, 5881–5894. [Google Scholar] [CrossRef]


| Gauges | Location | Catchment Area (km2) | Time Period |
|---|---|---|---|
| Batang | Mainstream | 149,072 | 2000–2013 |
| Gangtuo | Mainstream | 180,055 | 2000–2013 |
| Pingshan | Mainstream | 458,592 | 2000–2012 |
| Gaochang | Outlet of the Minjiang River | 135,378 | 2000–2013 |
| Beipei | Outlet of the Jialing River | 156,736 | 2000–2013 |
| Wulong | Outlet of the Wujiang River | 83,035 | 2000–2013 |
| IOD/ENSO | |||
|---|---|---|---|
| January 2003–February 2015 | January 2003–July 2012 | August 2012–February 2015 | |
| TWS | −0.48/−0.08 | −0.66/−0.20 | 0.20/0.84 |
| precipitation | −0.24/−0.02 | −0.25/−0.09 | 0.03/0.47 |
© 2016 by the authors; licensee MDPI, Basel, Switzerland. This article is an open access article distributed under the terms and conditions of the Creative Commons Attribution (CC-BY) license (http://creativecommons.org/licenses/by/4.0/).
Share and Cite
Yao, C.; Luo, Z.; Wang, H.; Li, Q.; Zhou, H. GRACE-Derived Terrestrial Water Storage Changes in the Inter-Basin Region and Its Possible Influencing Factors: A Case Study of the Sichuan Basin, China. Remote Sens. 2016, 8, 444. https://doi.org/10.3390/rs8060444
Yao C, Luo Z, Wang H, Li Q, Zhou H. GRACE-Derived Terrestrial Water Storage Changes in the Inter-Basin Region and Its Possible Influencing Factors: A Case Study of the Sichuan Basin, China. Remote Sensing. 2016; 8(6):444. https://doi.org/10.3390/rs8060444
Chicago/Turabian StyleYao, Chaolong, Zhicai Luo, Haihong Wang, Qiong Li, and Hao Zhou. 2016. "GRACE-Derived Terrestrial Water Storage Changes in the Inter-Basin Region and Its Possible Influencing Factors: A Case Study of the Sichuan Basin, China" Remote Sensing 8, no. 6: 444. https://doi.org/10.3390/rs8060444