
Advanced SAR Interferometric Analysis to Support Geomorphological Interpretation of Slow-Moving Coastal Landslides (Malta, Mediterranean Sea)


 , ,
, , 
 and
and
Abstract
:
1. Introduction
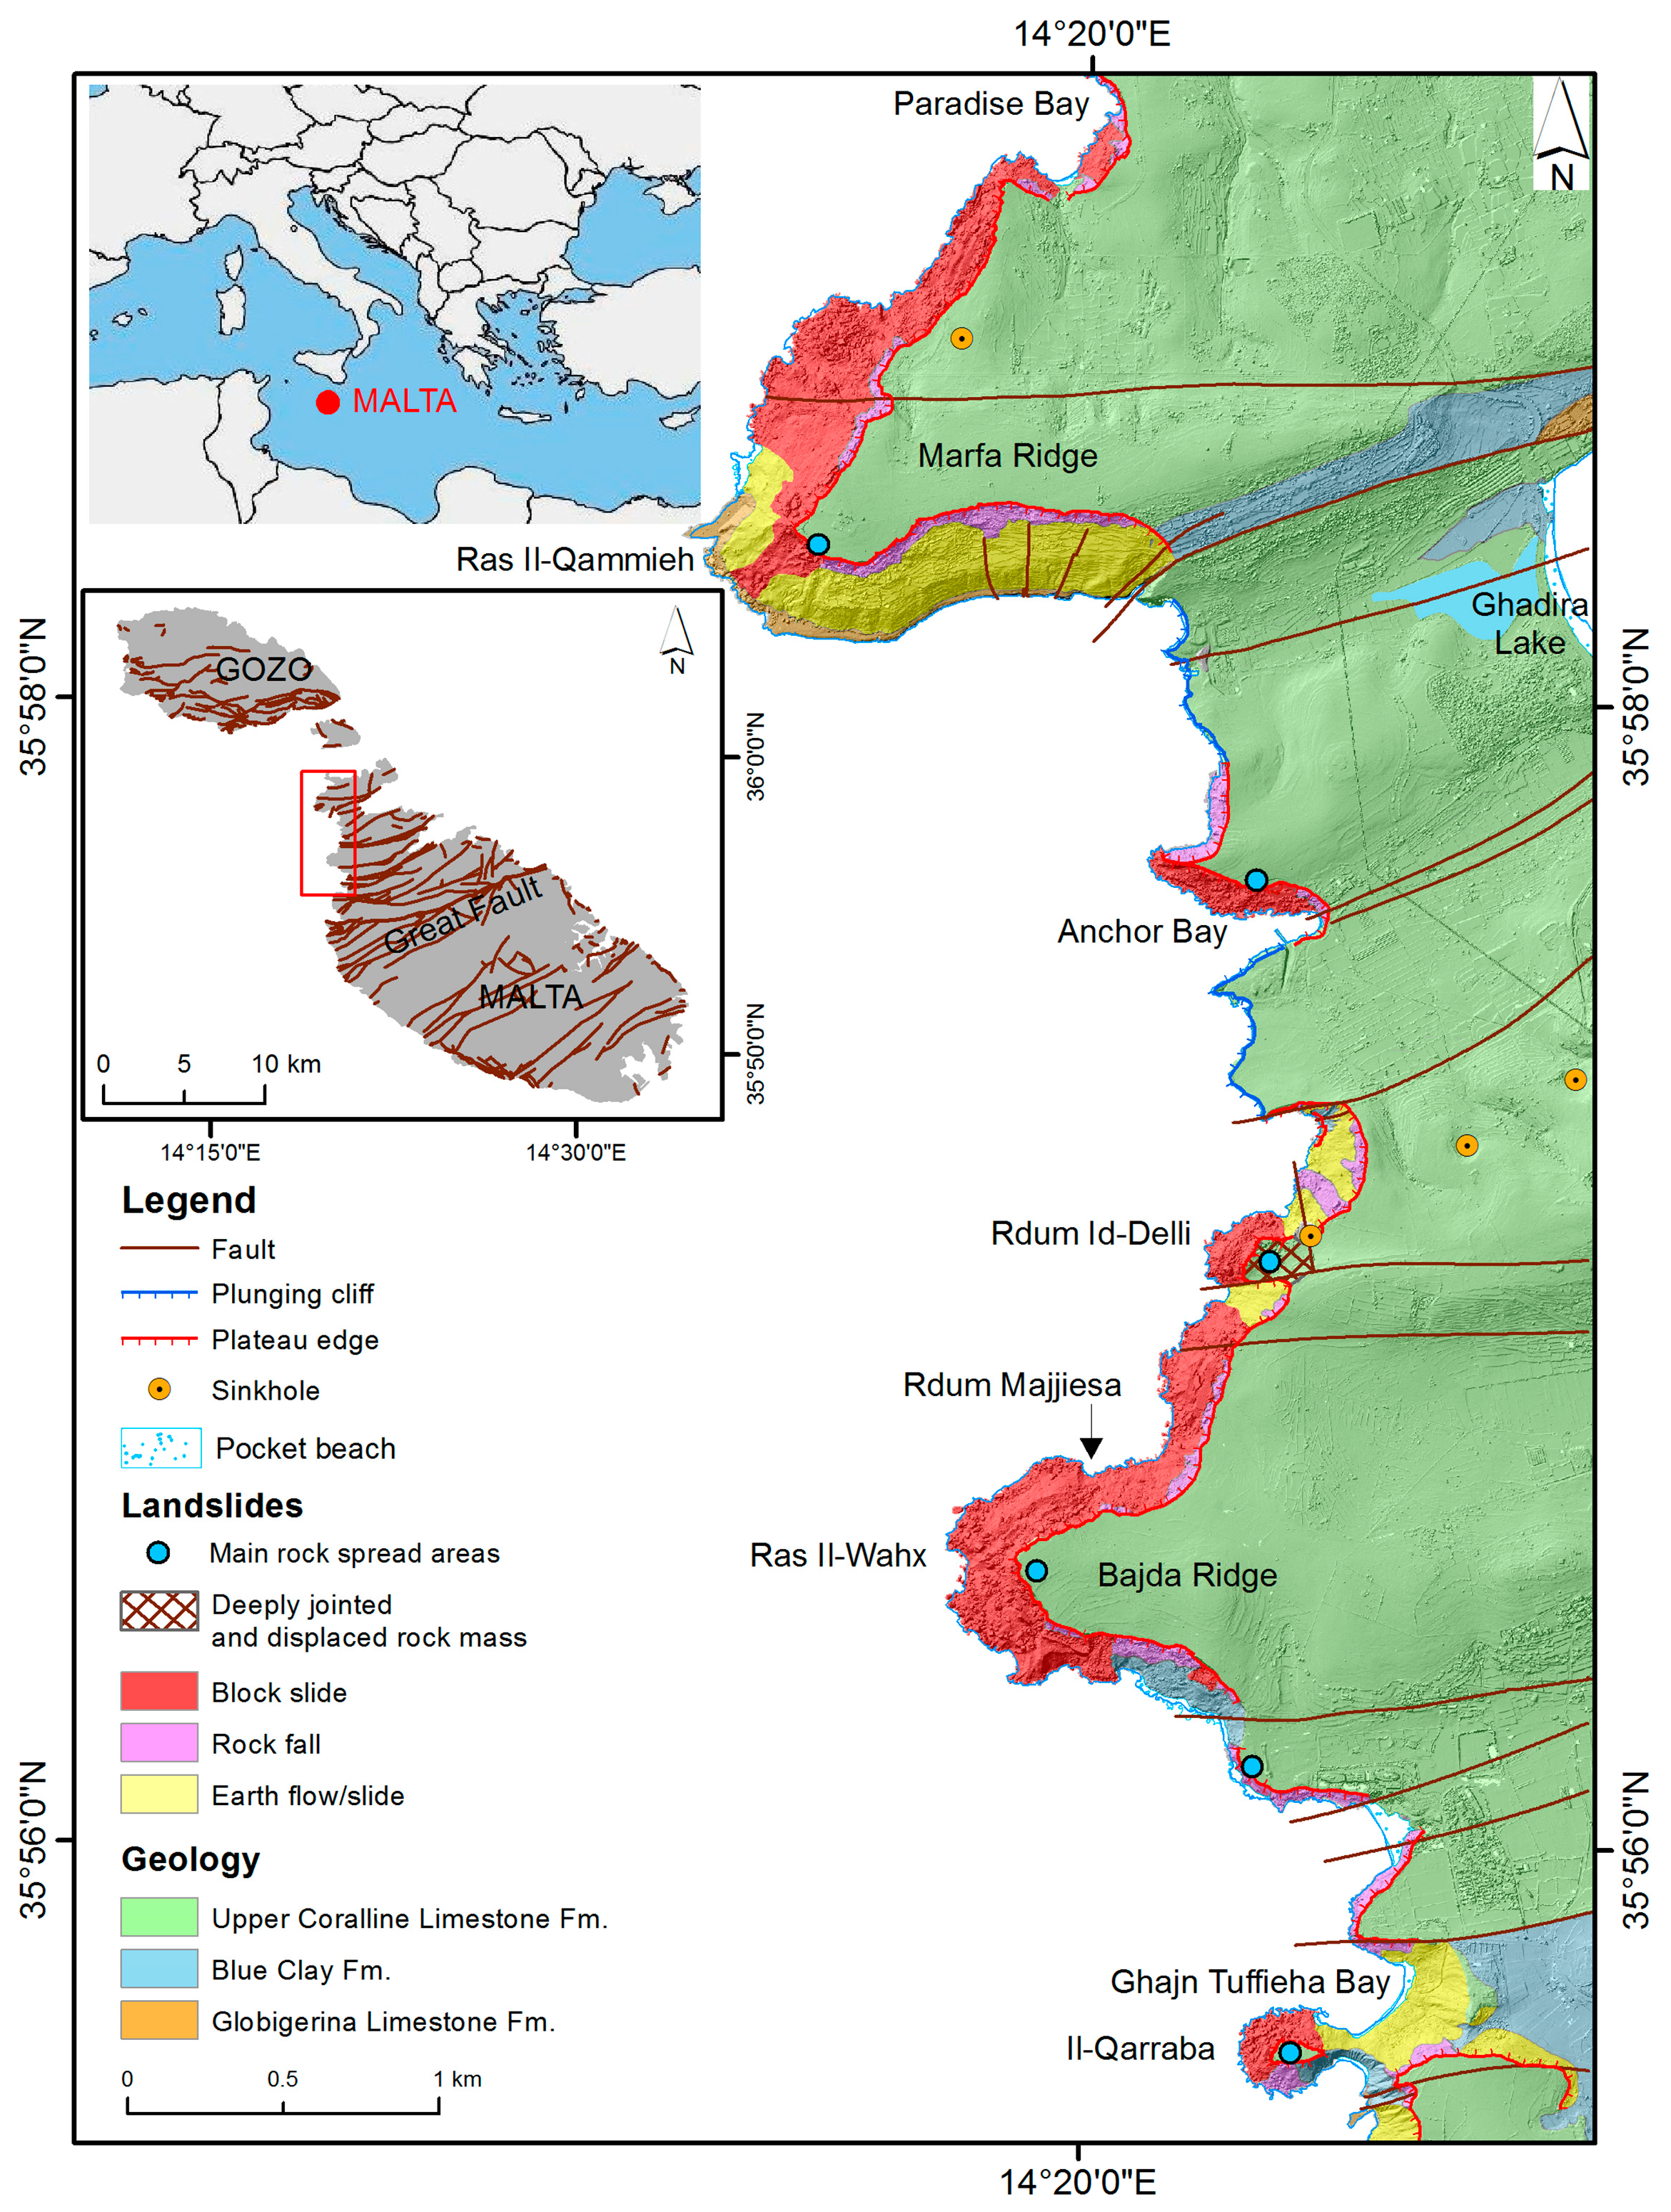
2. Study Area
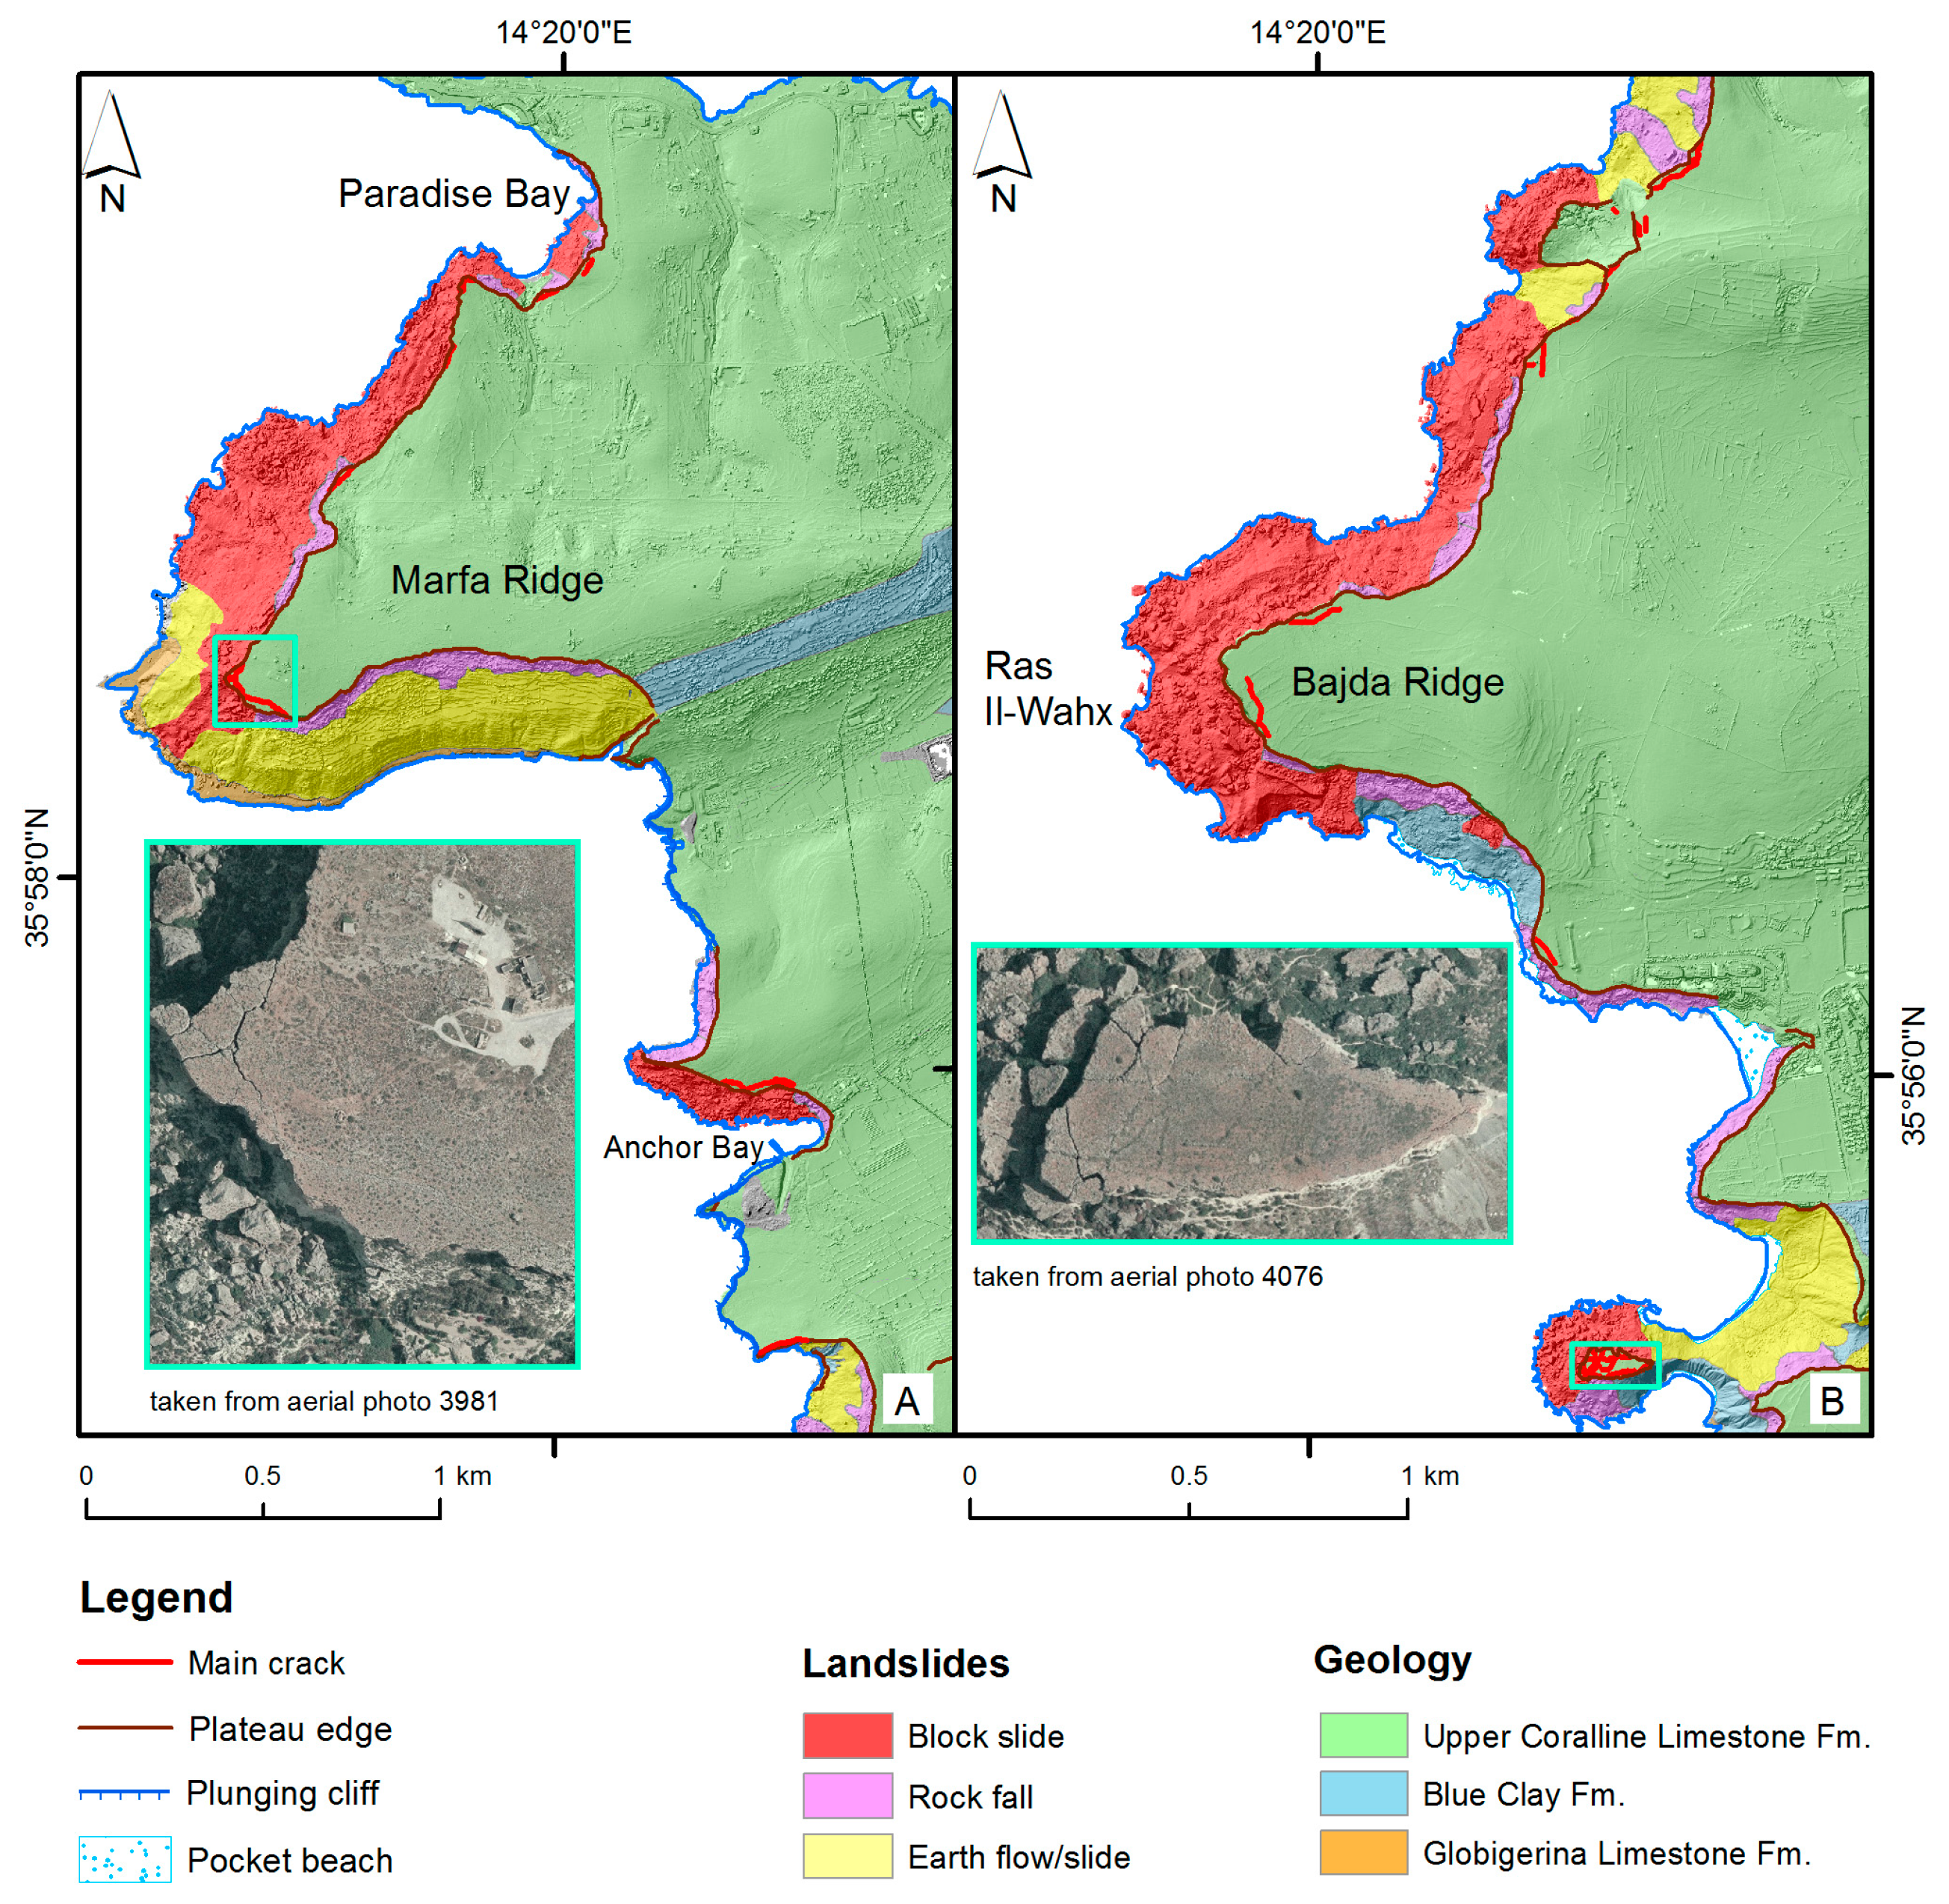
2.1. Geological and Geomorphological Setting
2.2. Type and Distribution of Coastal Landslides
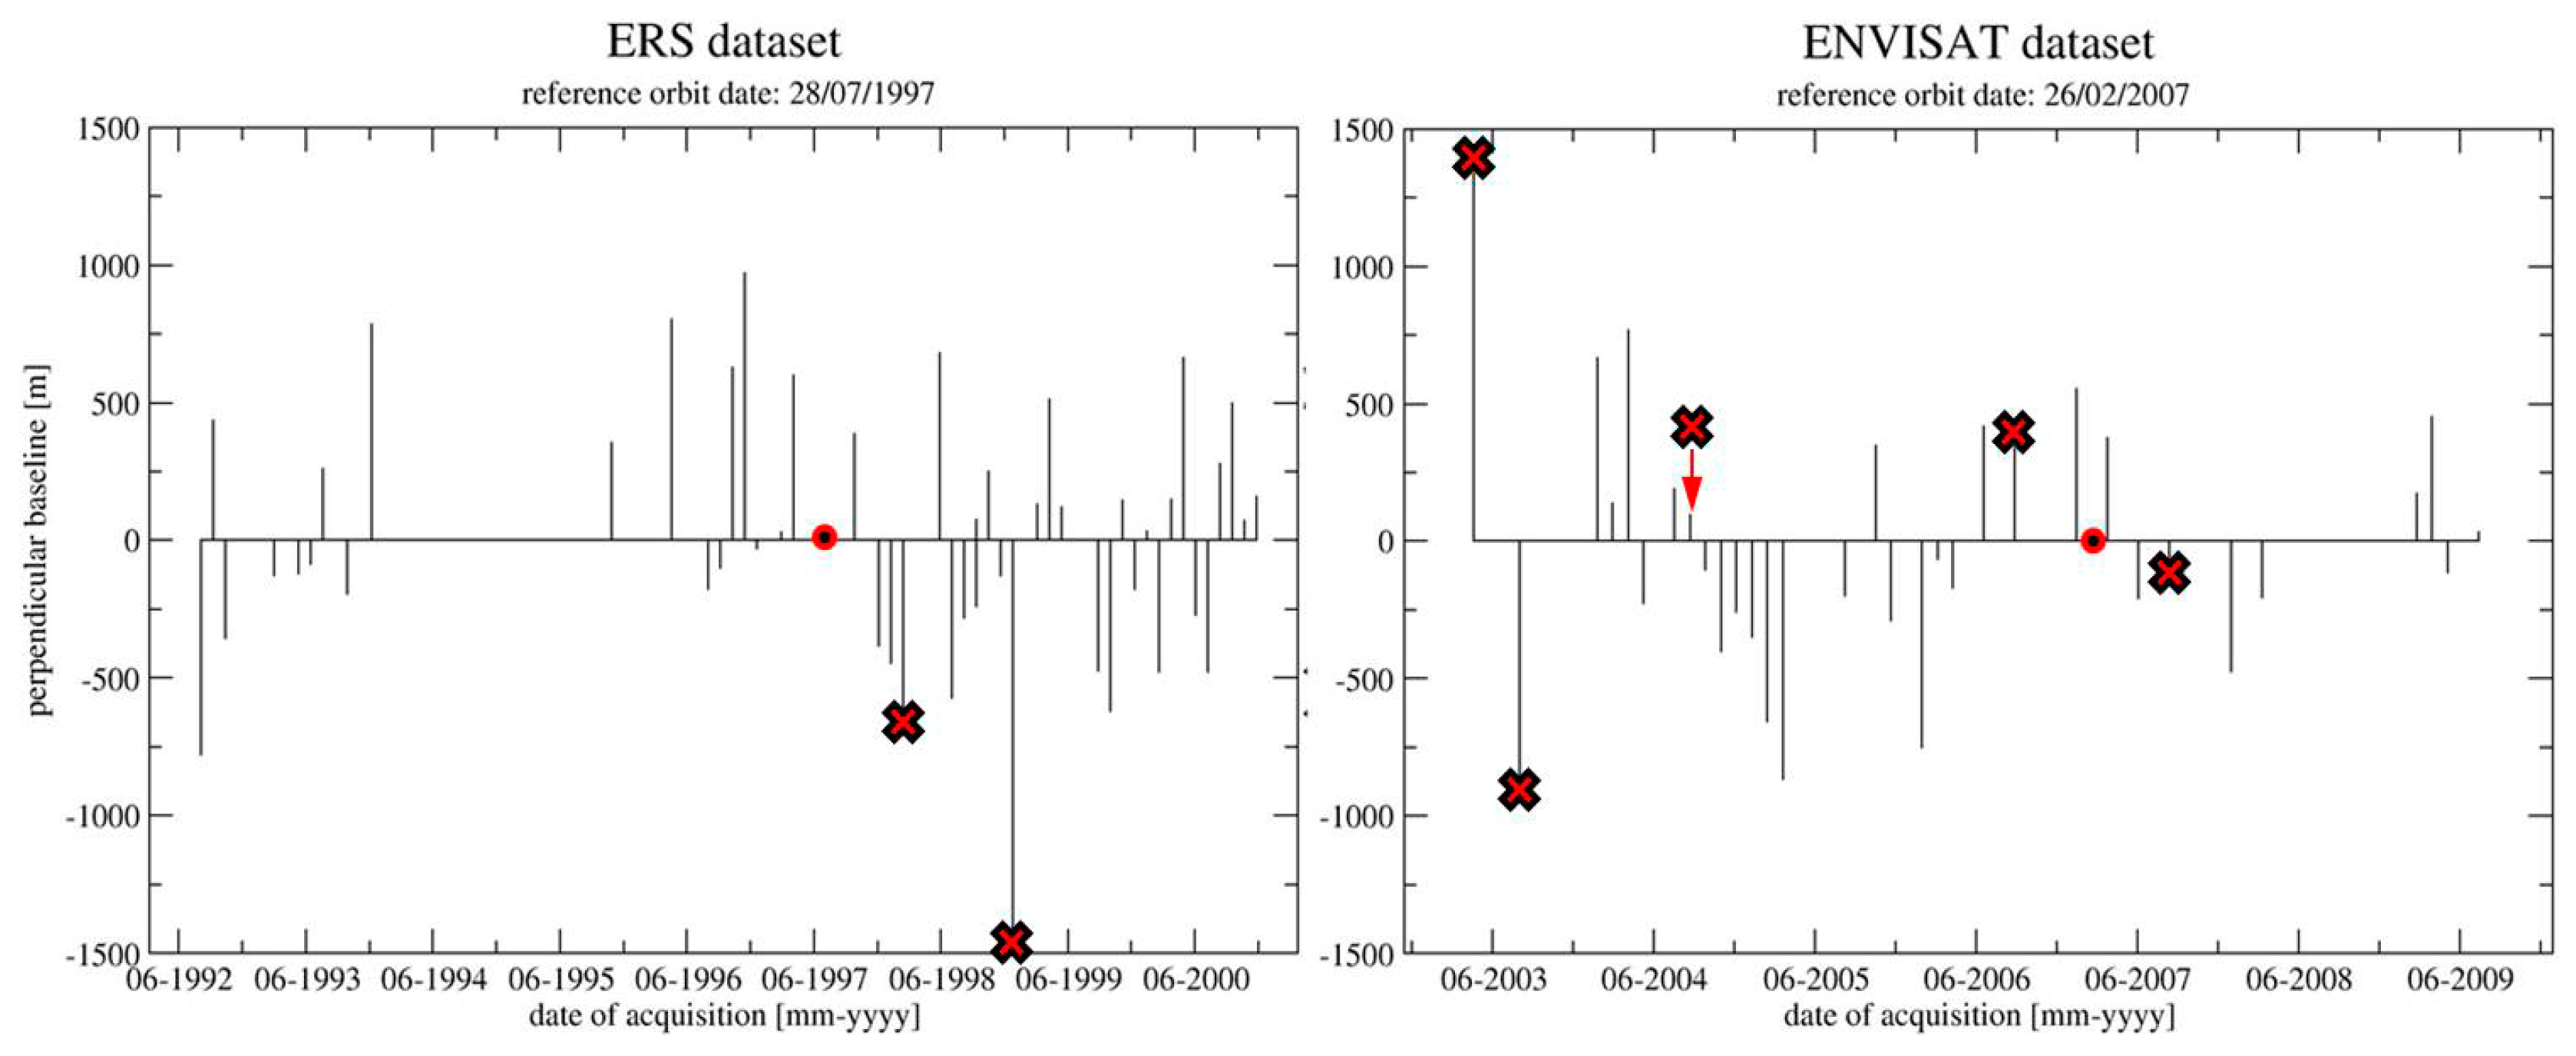
3. Materials and Methods
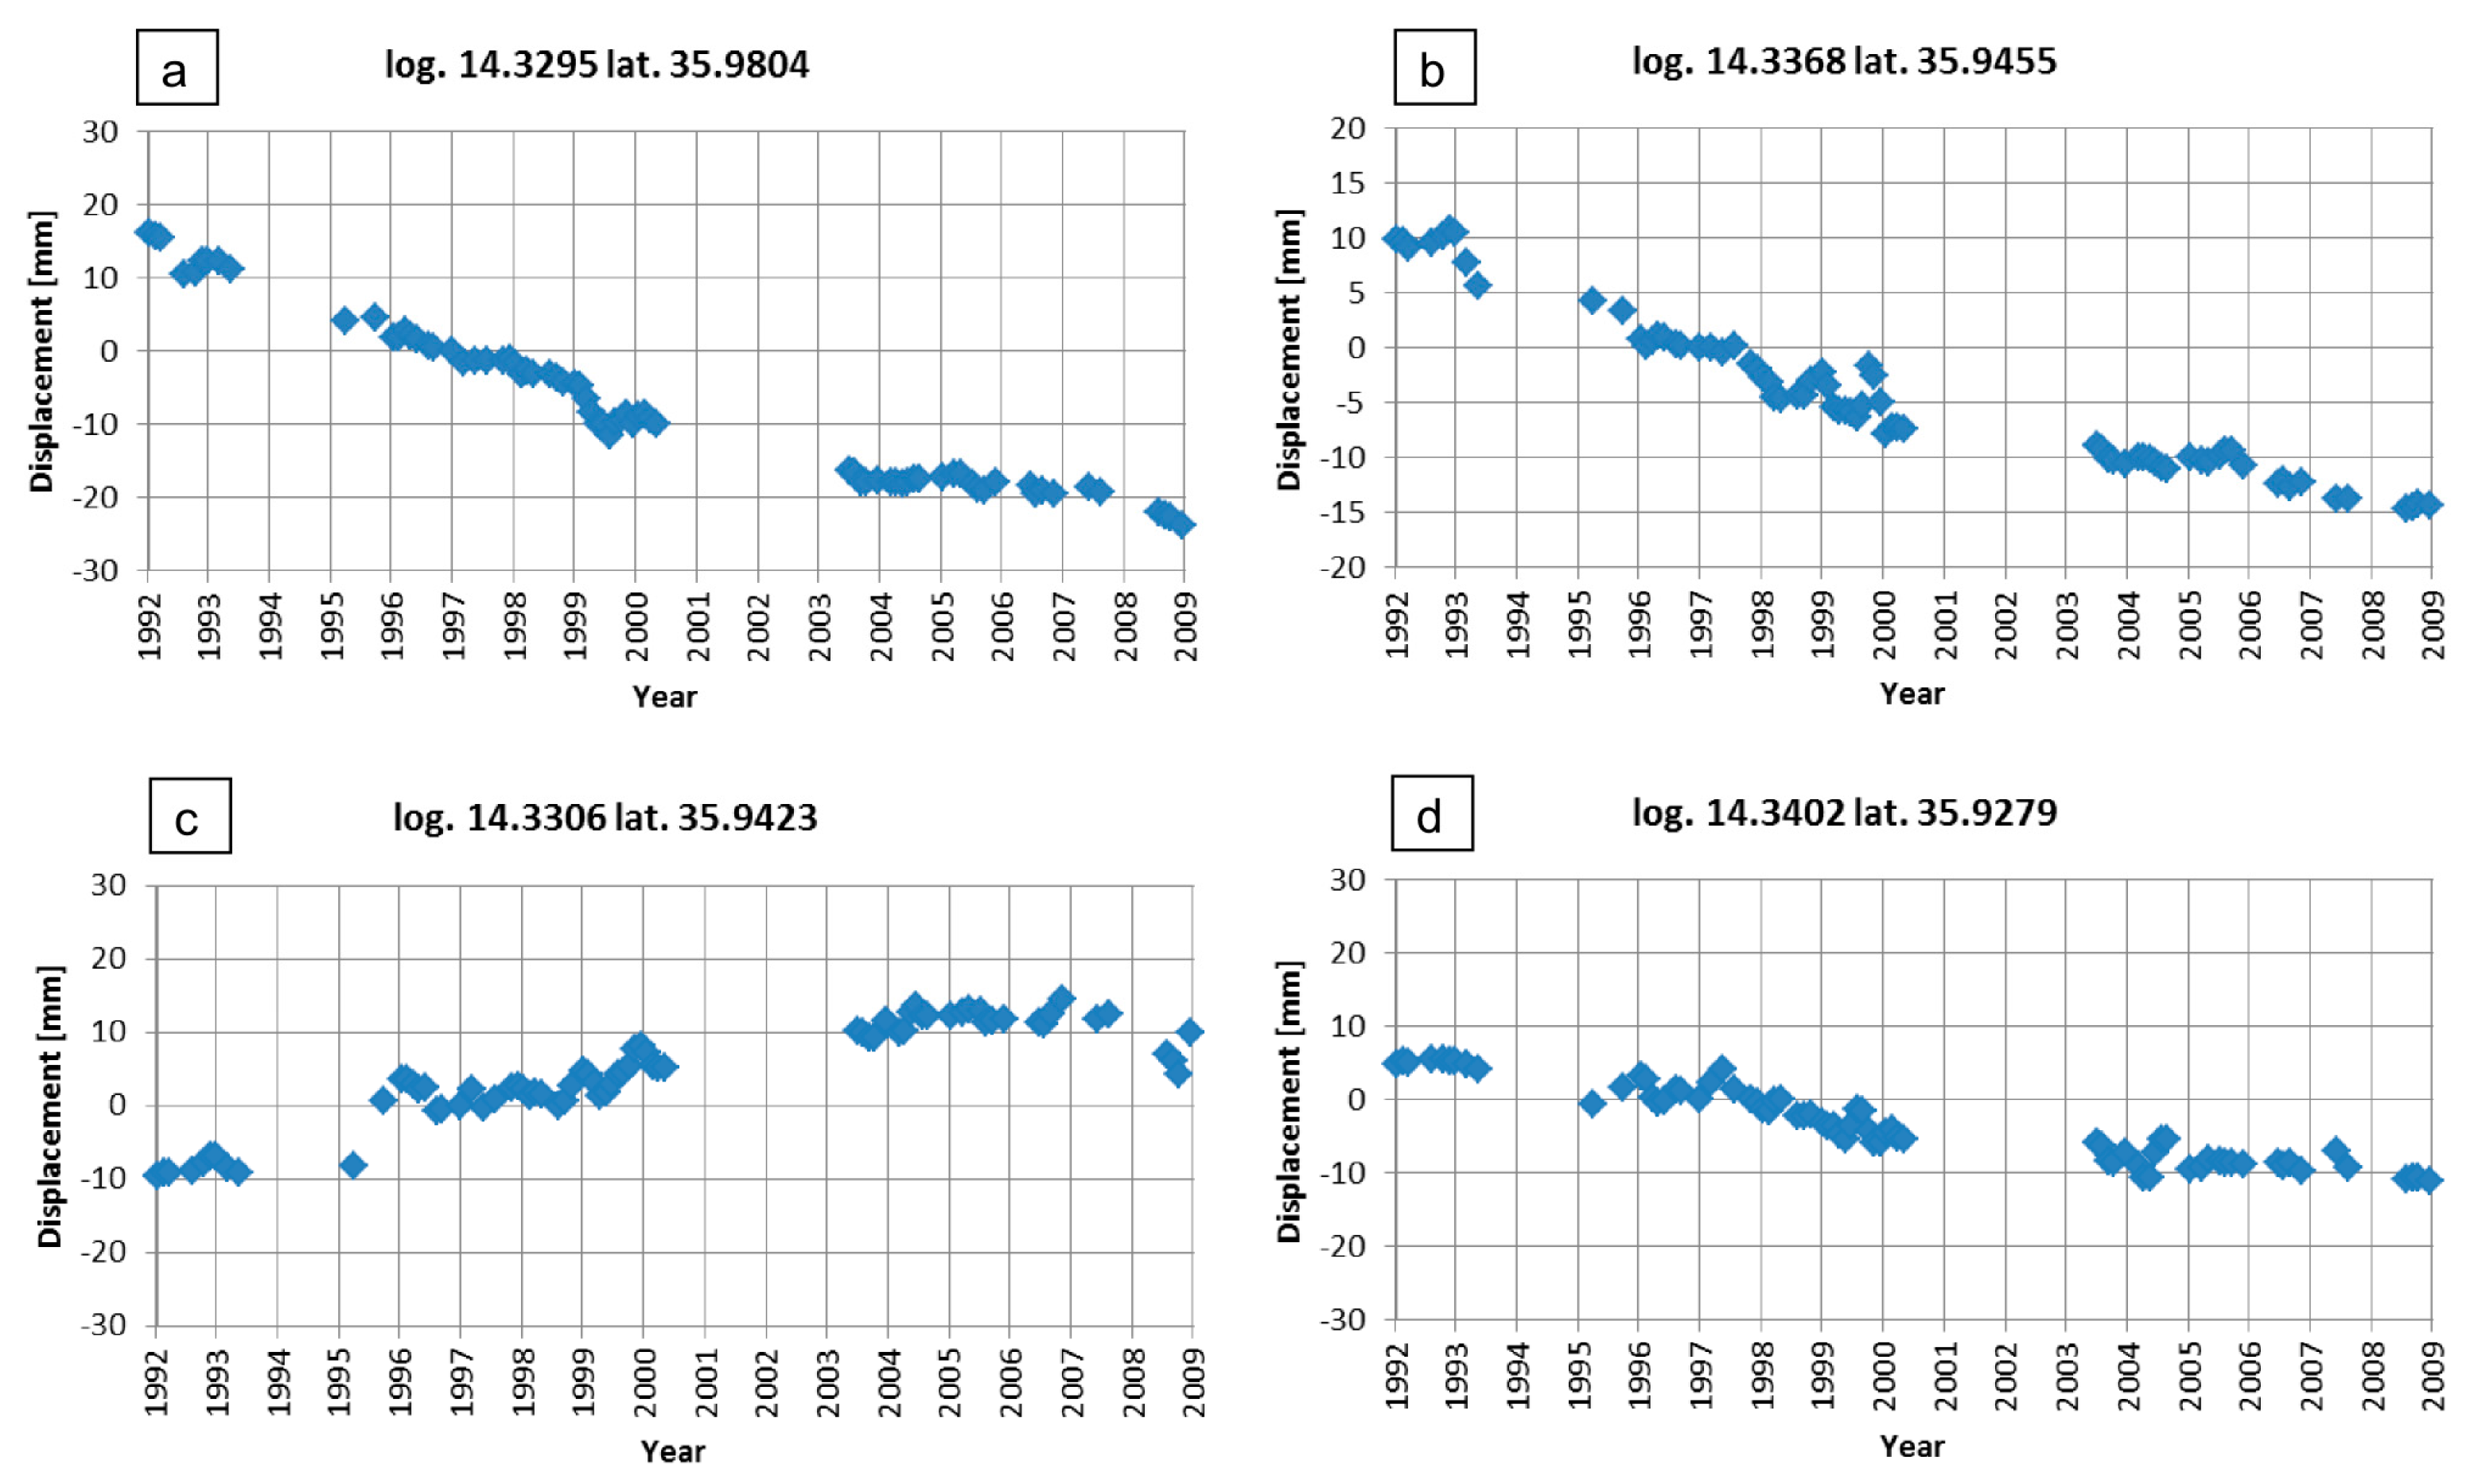
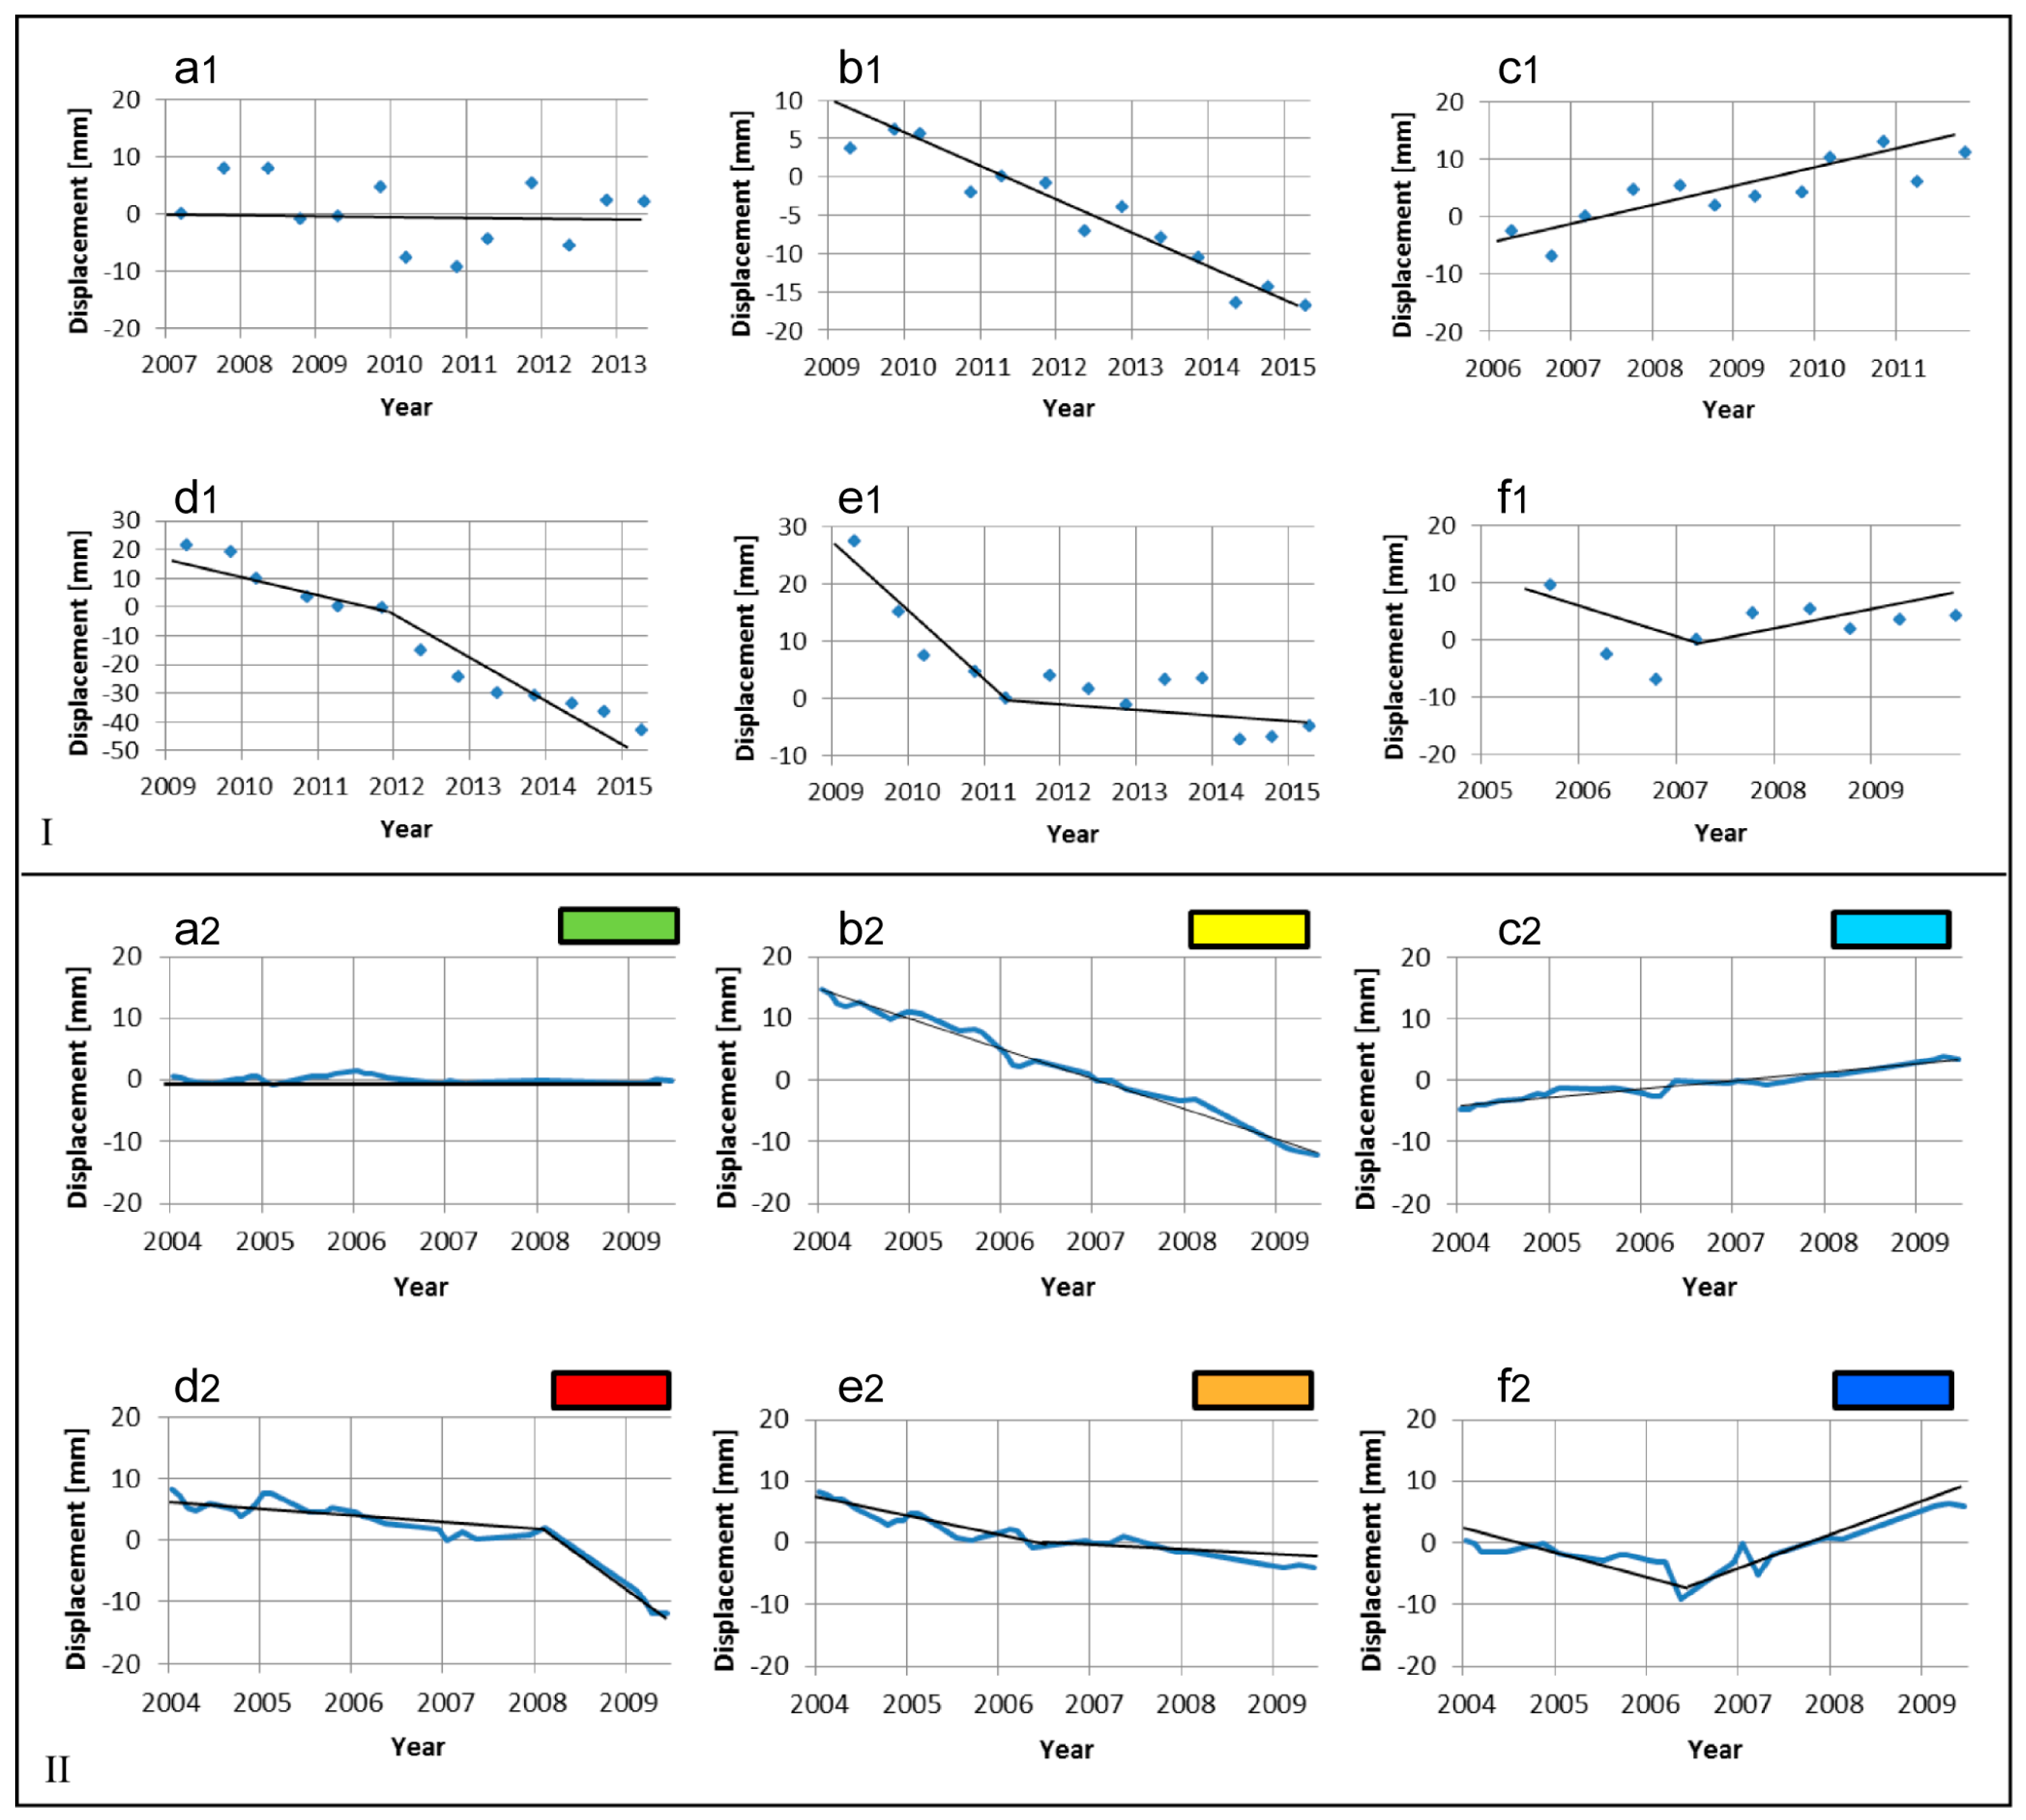
- Stable
- Deforming linearly downhill
- Deforming linearly uphill
- Accelerating downhill
- Decelerating downhill
- With discontinuous rate and trend
4. Data Analysis and Results Interpretation
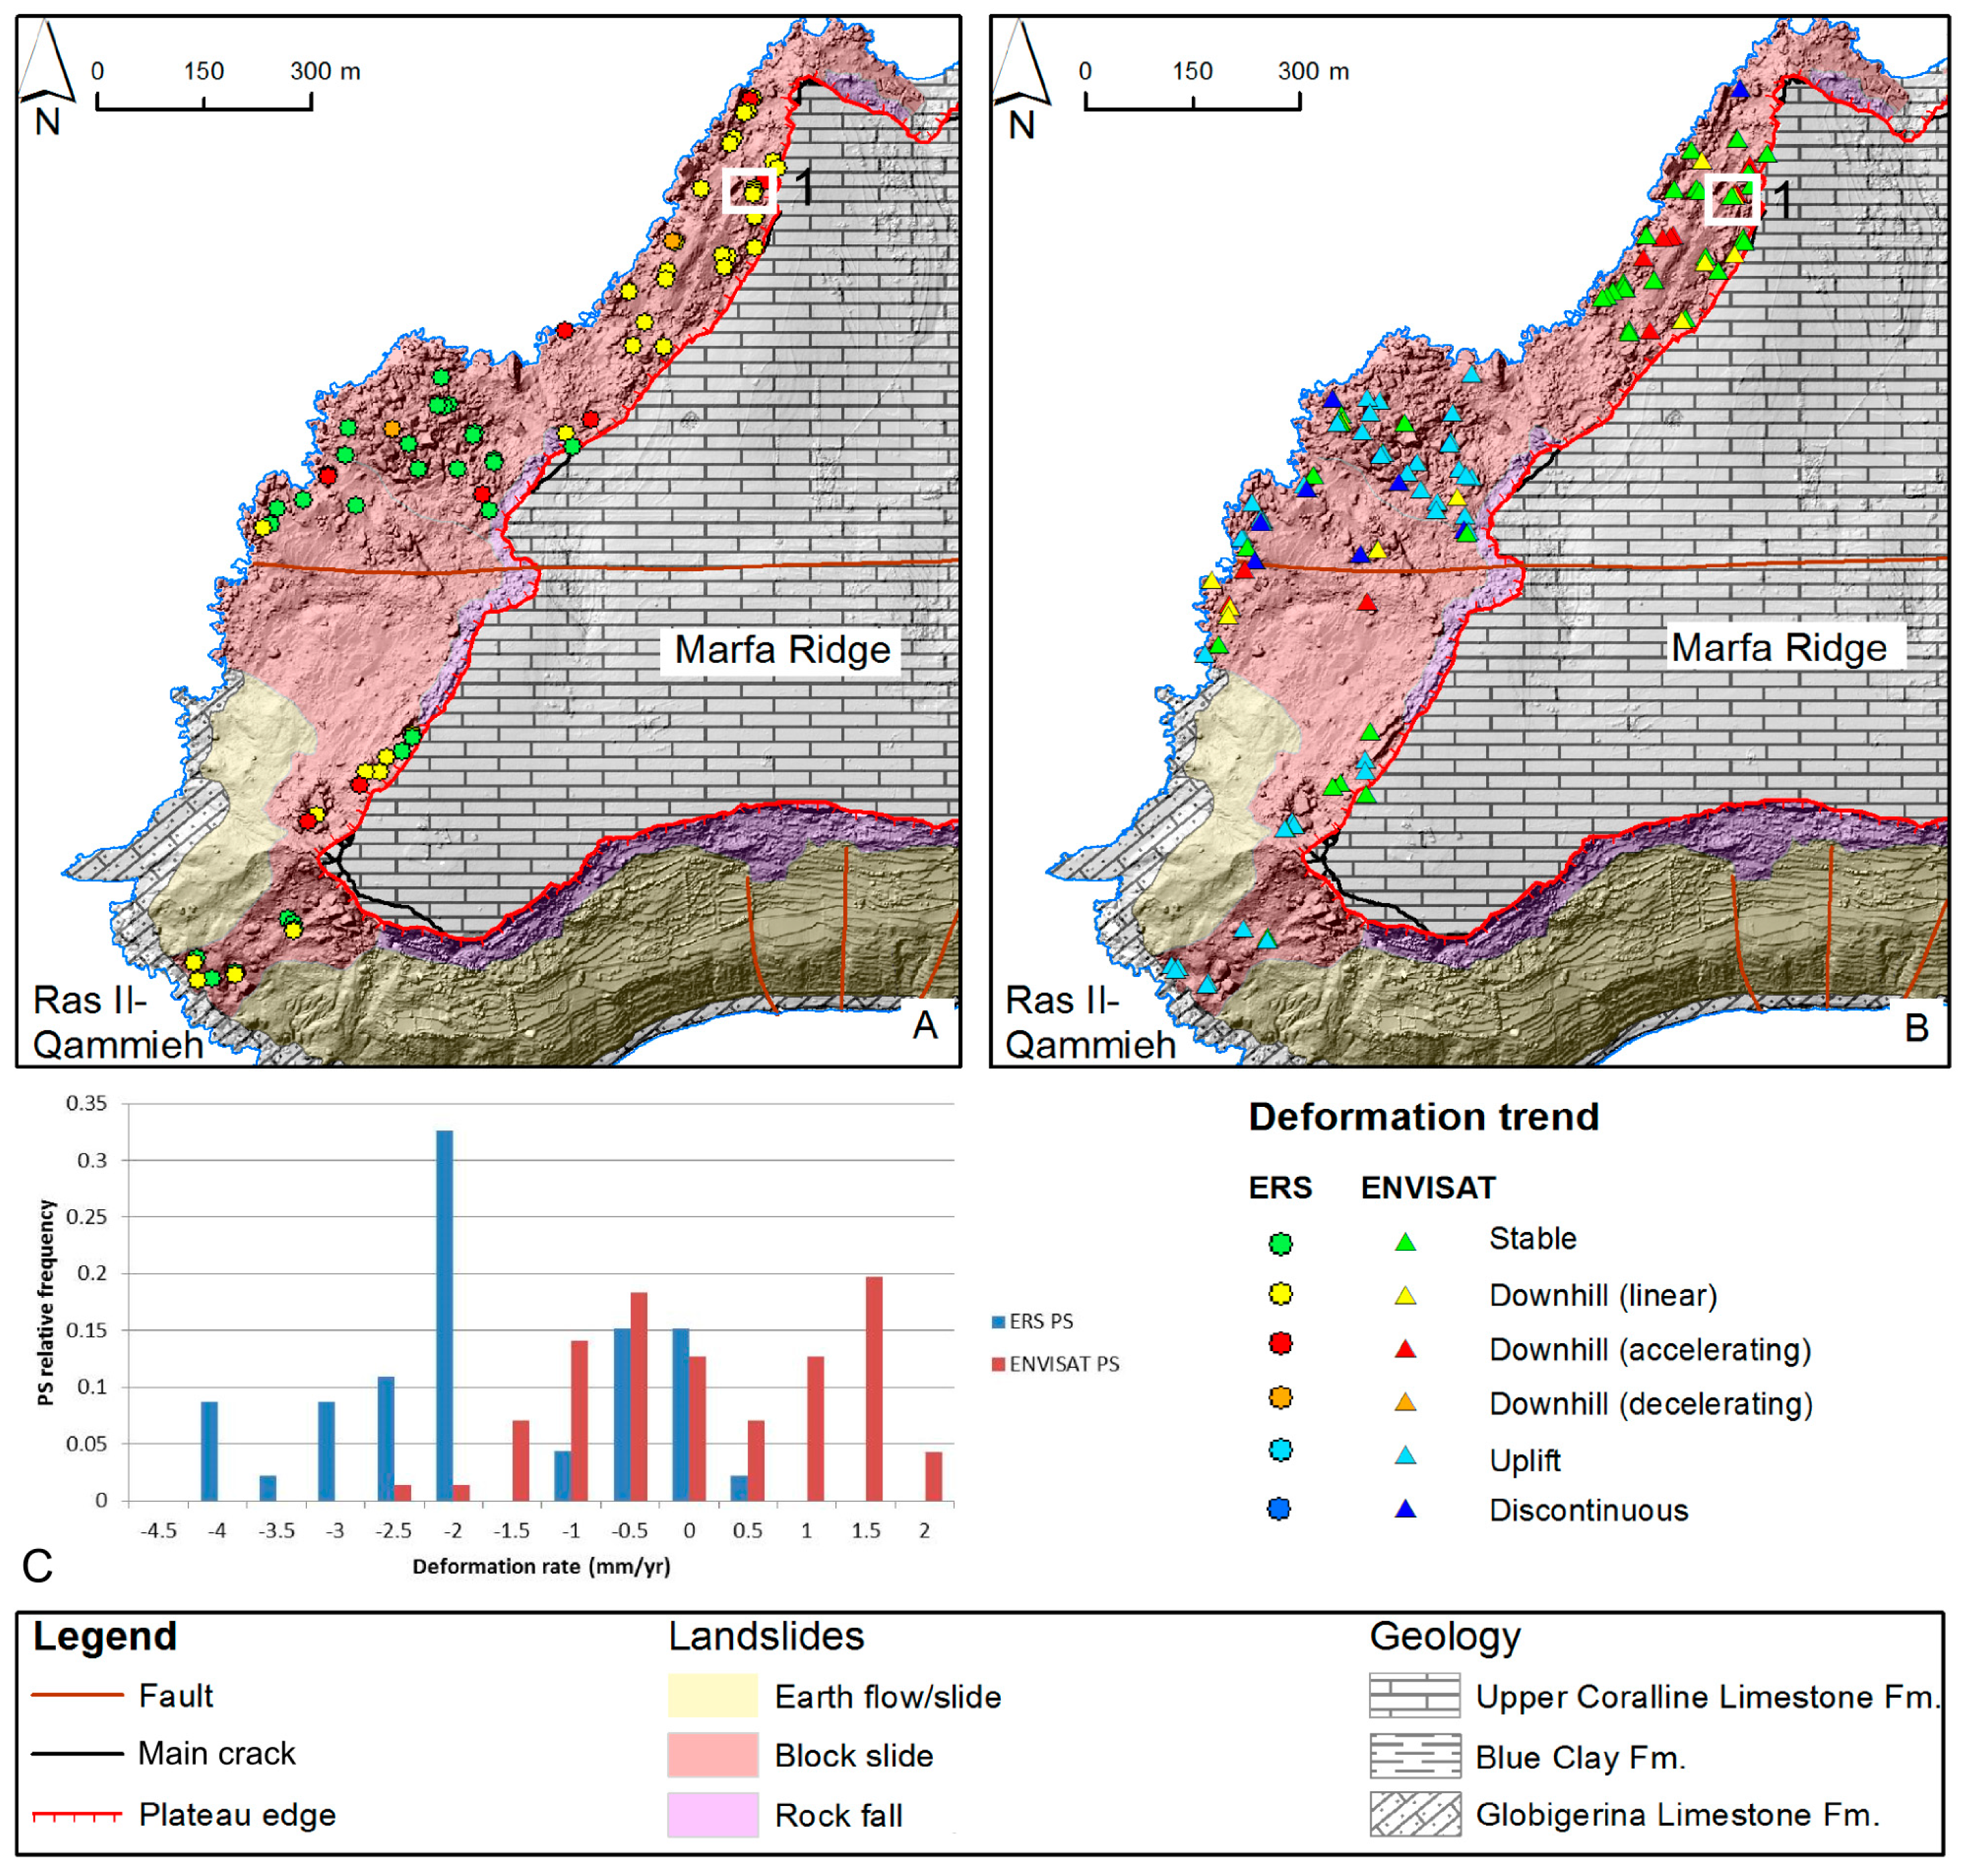
4.1. Marfa Ridge Landslides
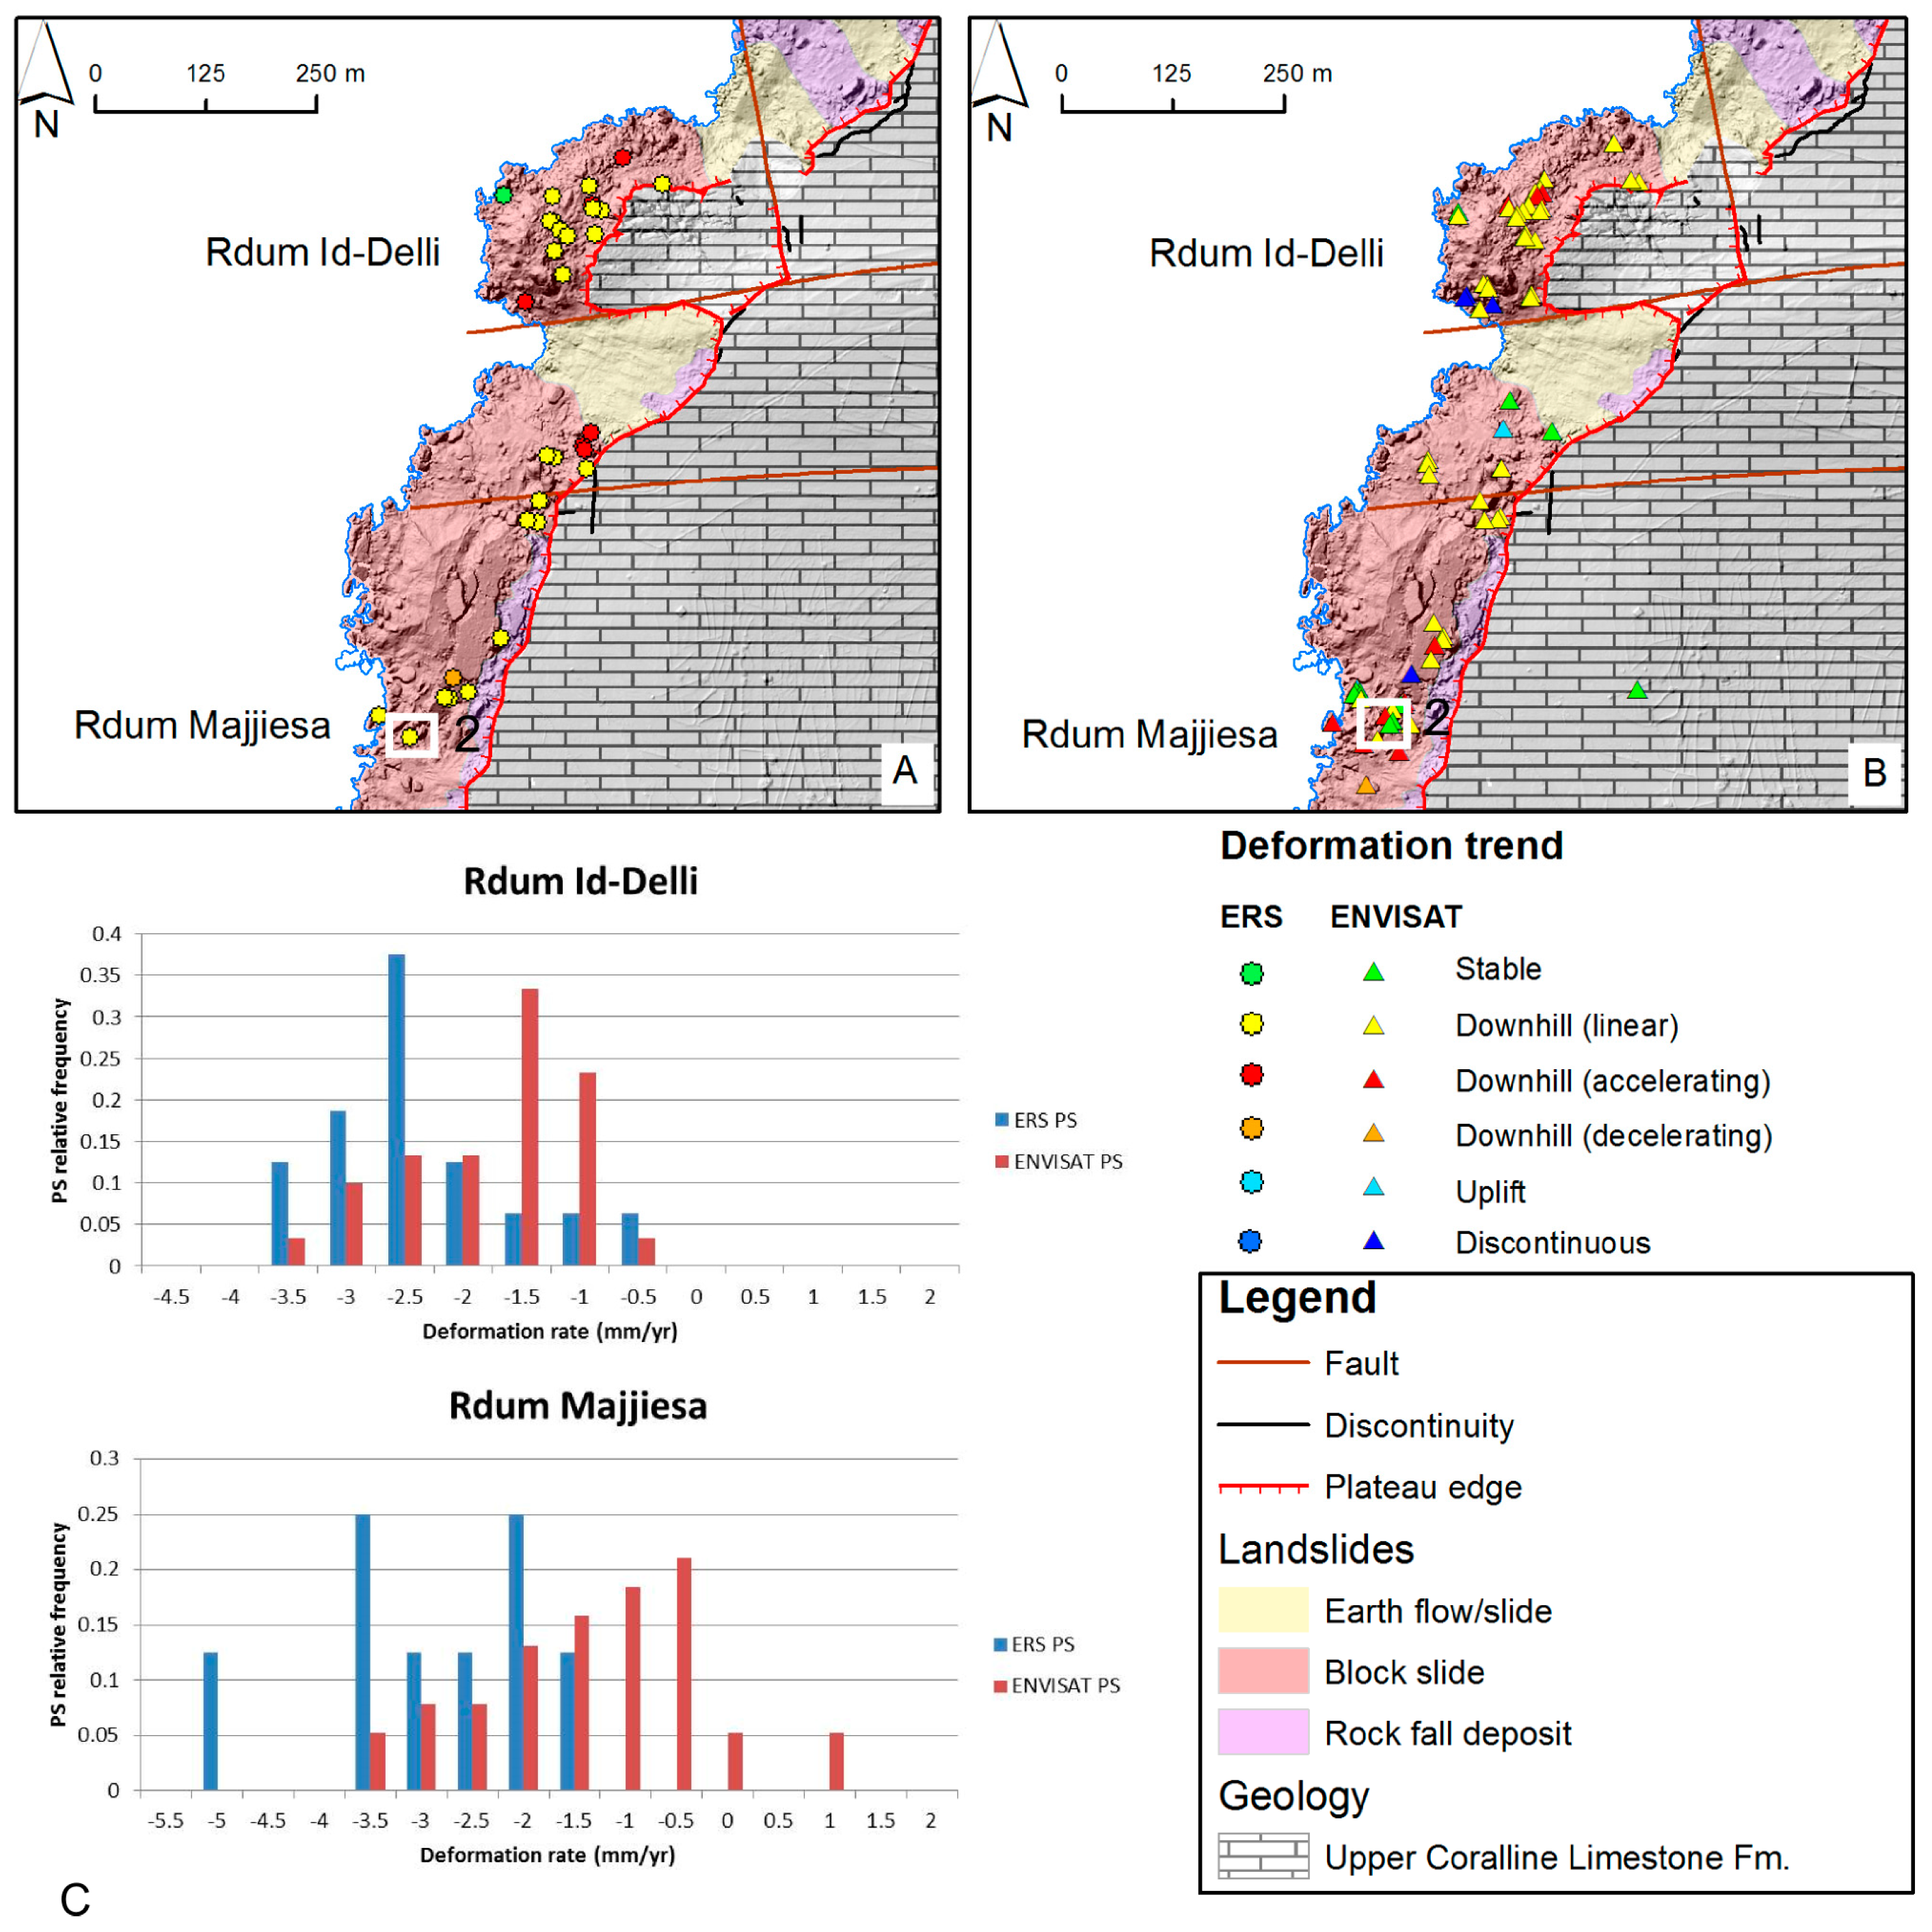
4.2. Rudm Id-Delli—Rdum Majjiesa Landslides
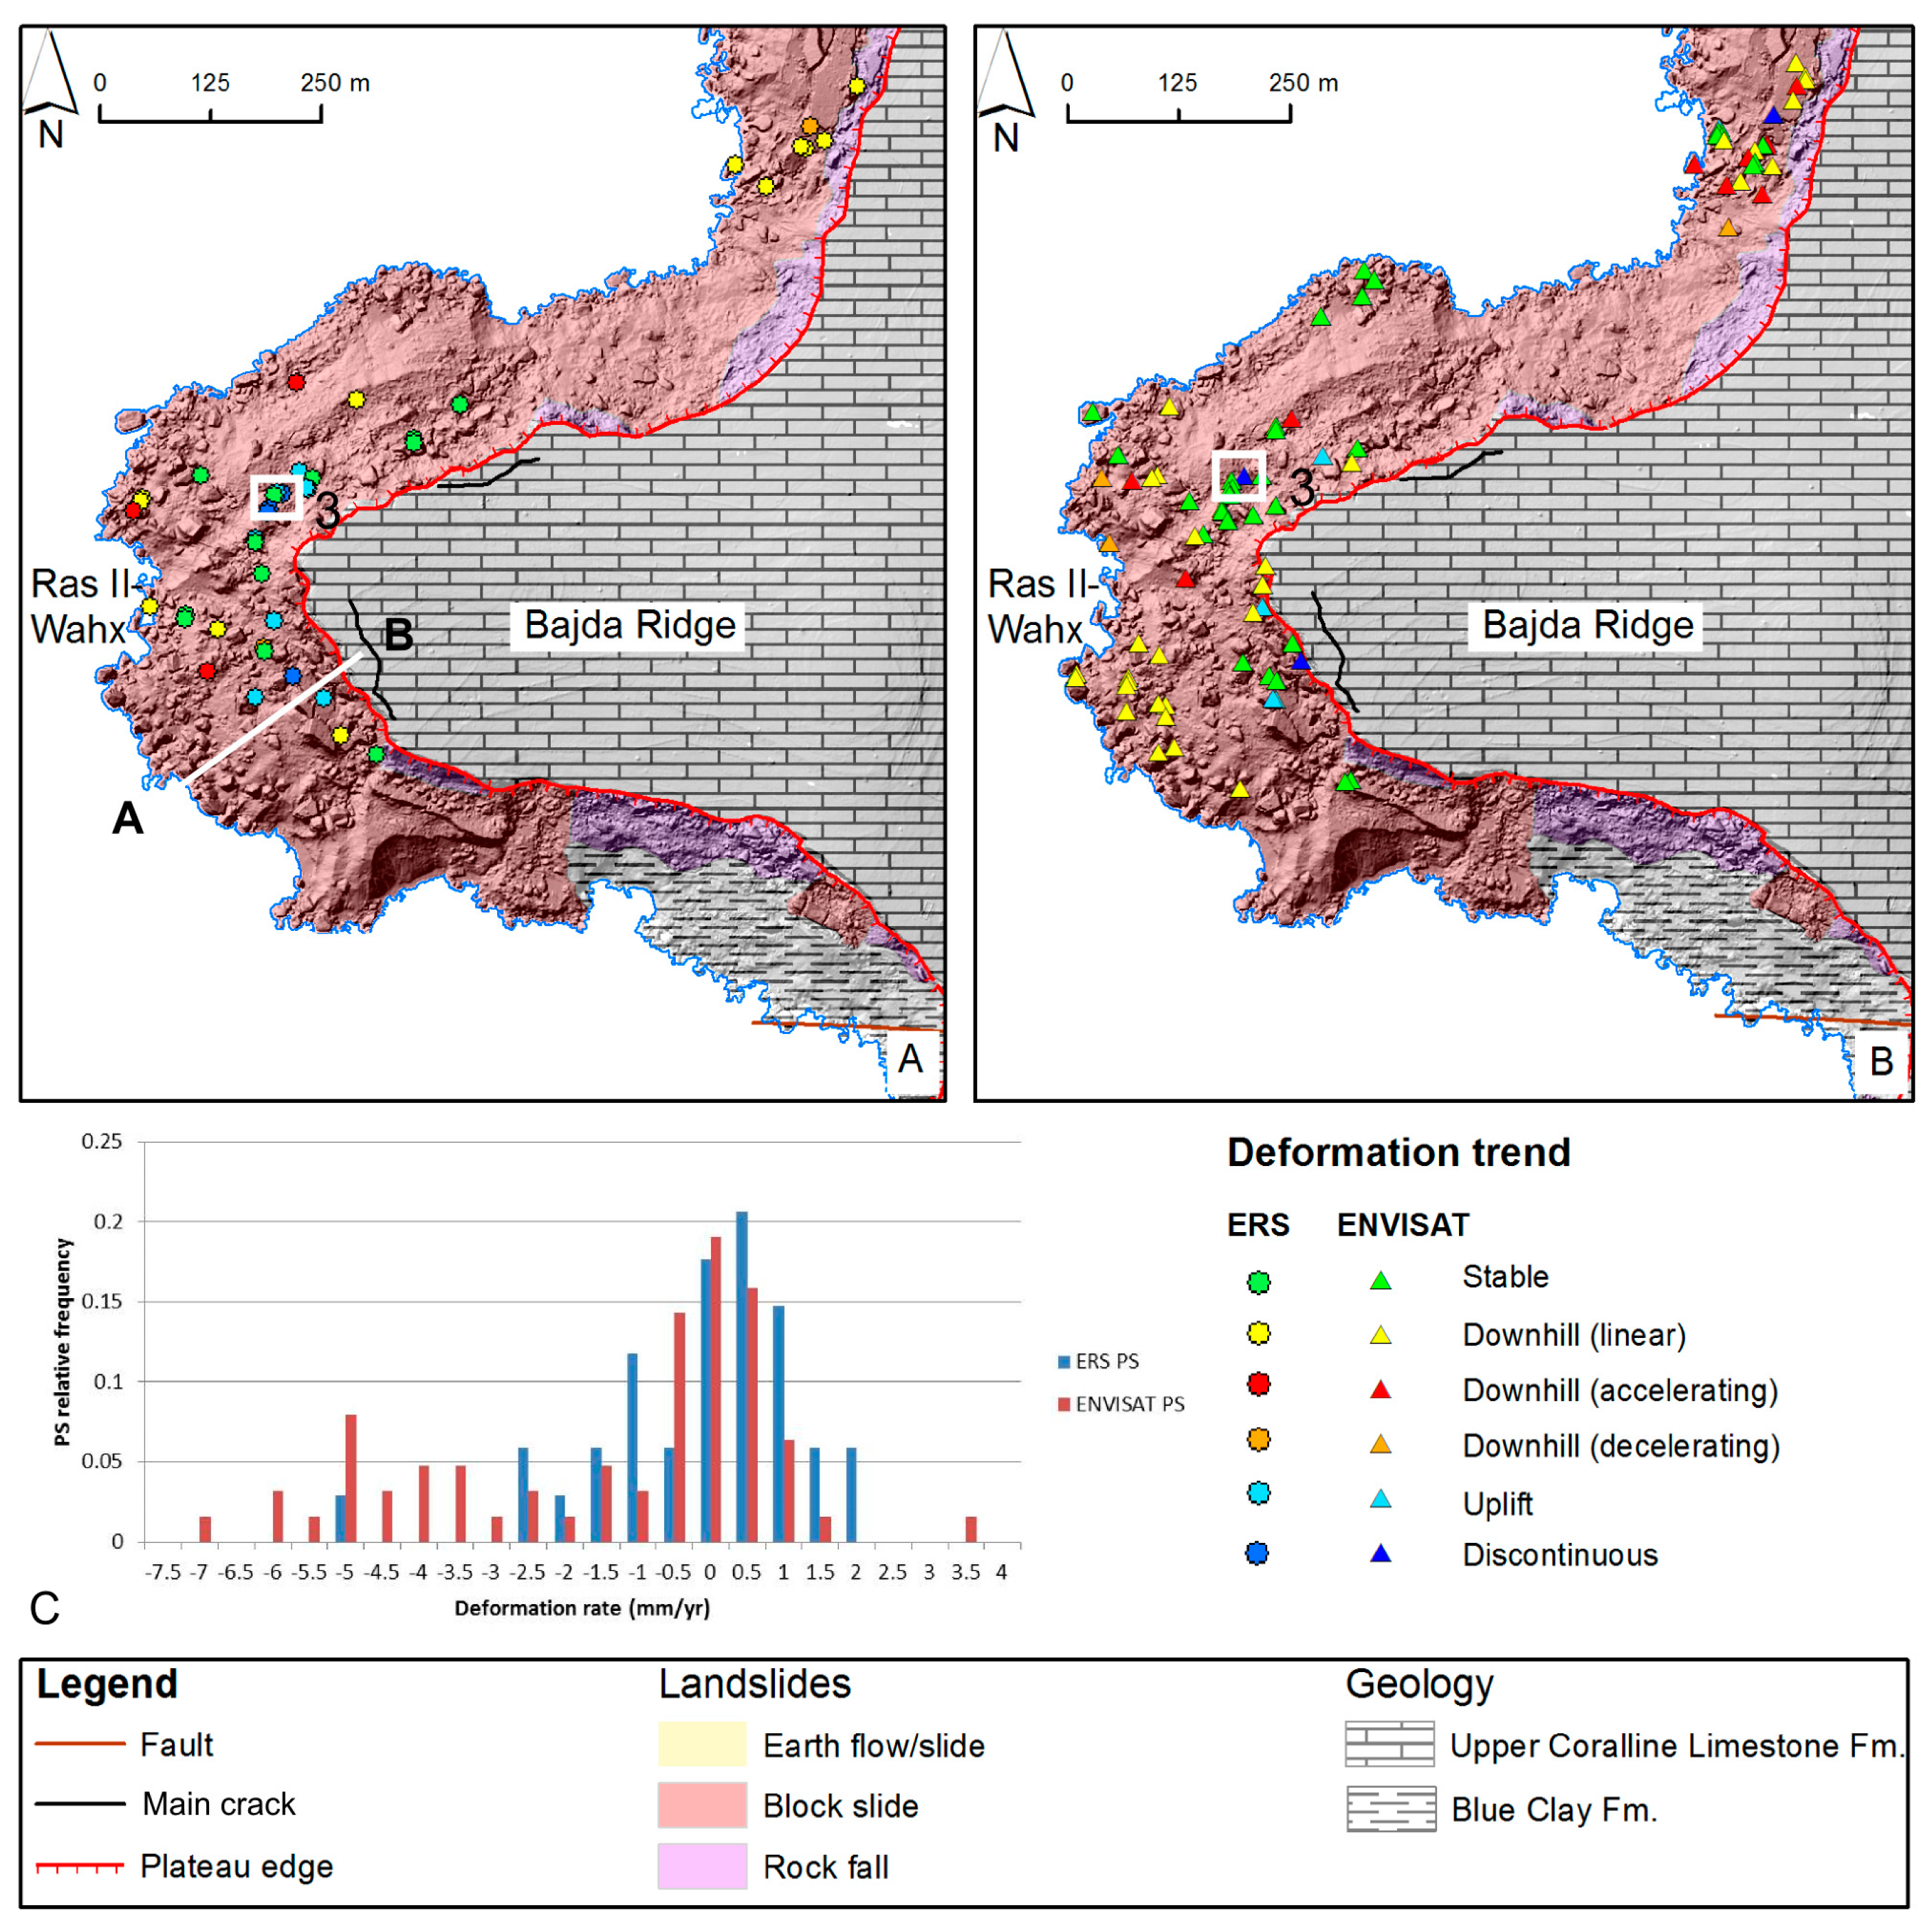
4.3. Ras Il-Wahx Landslides
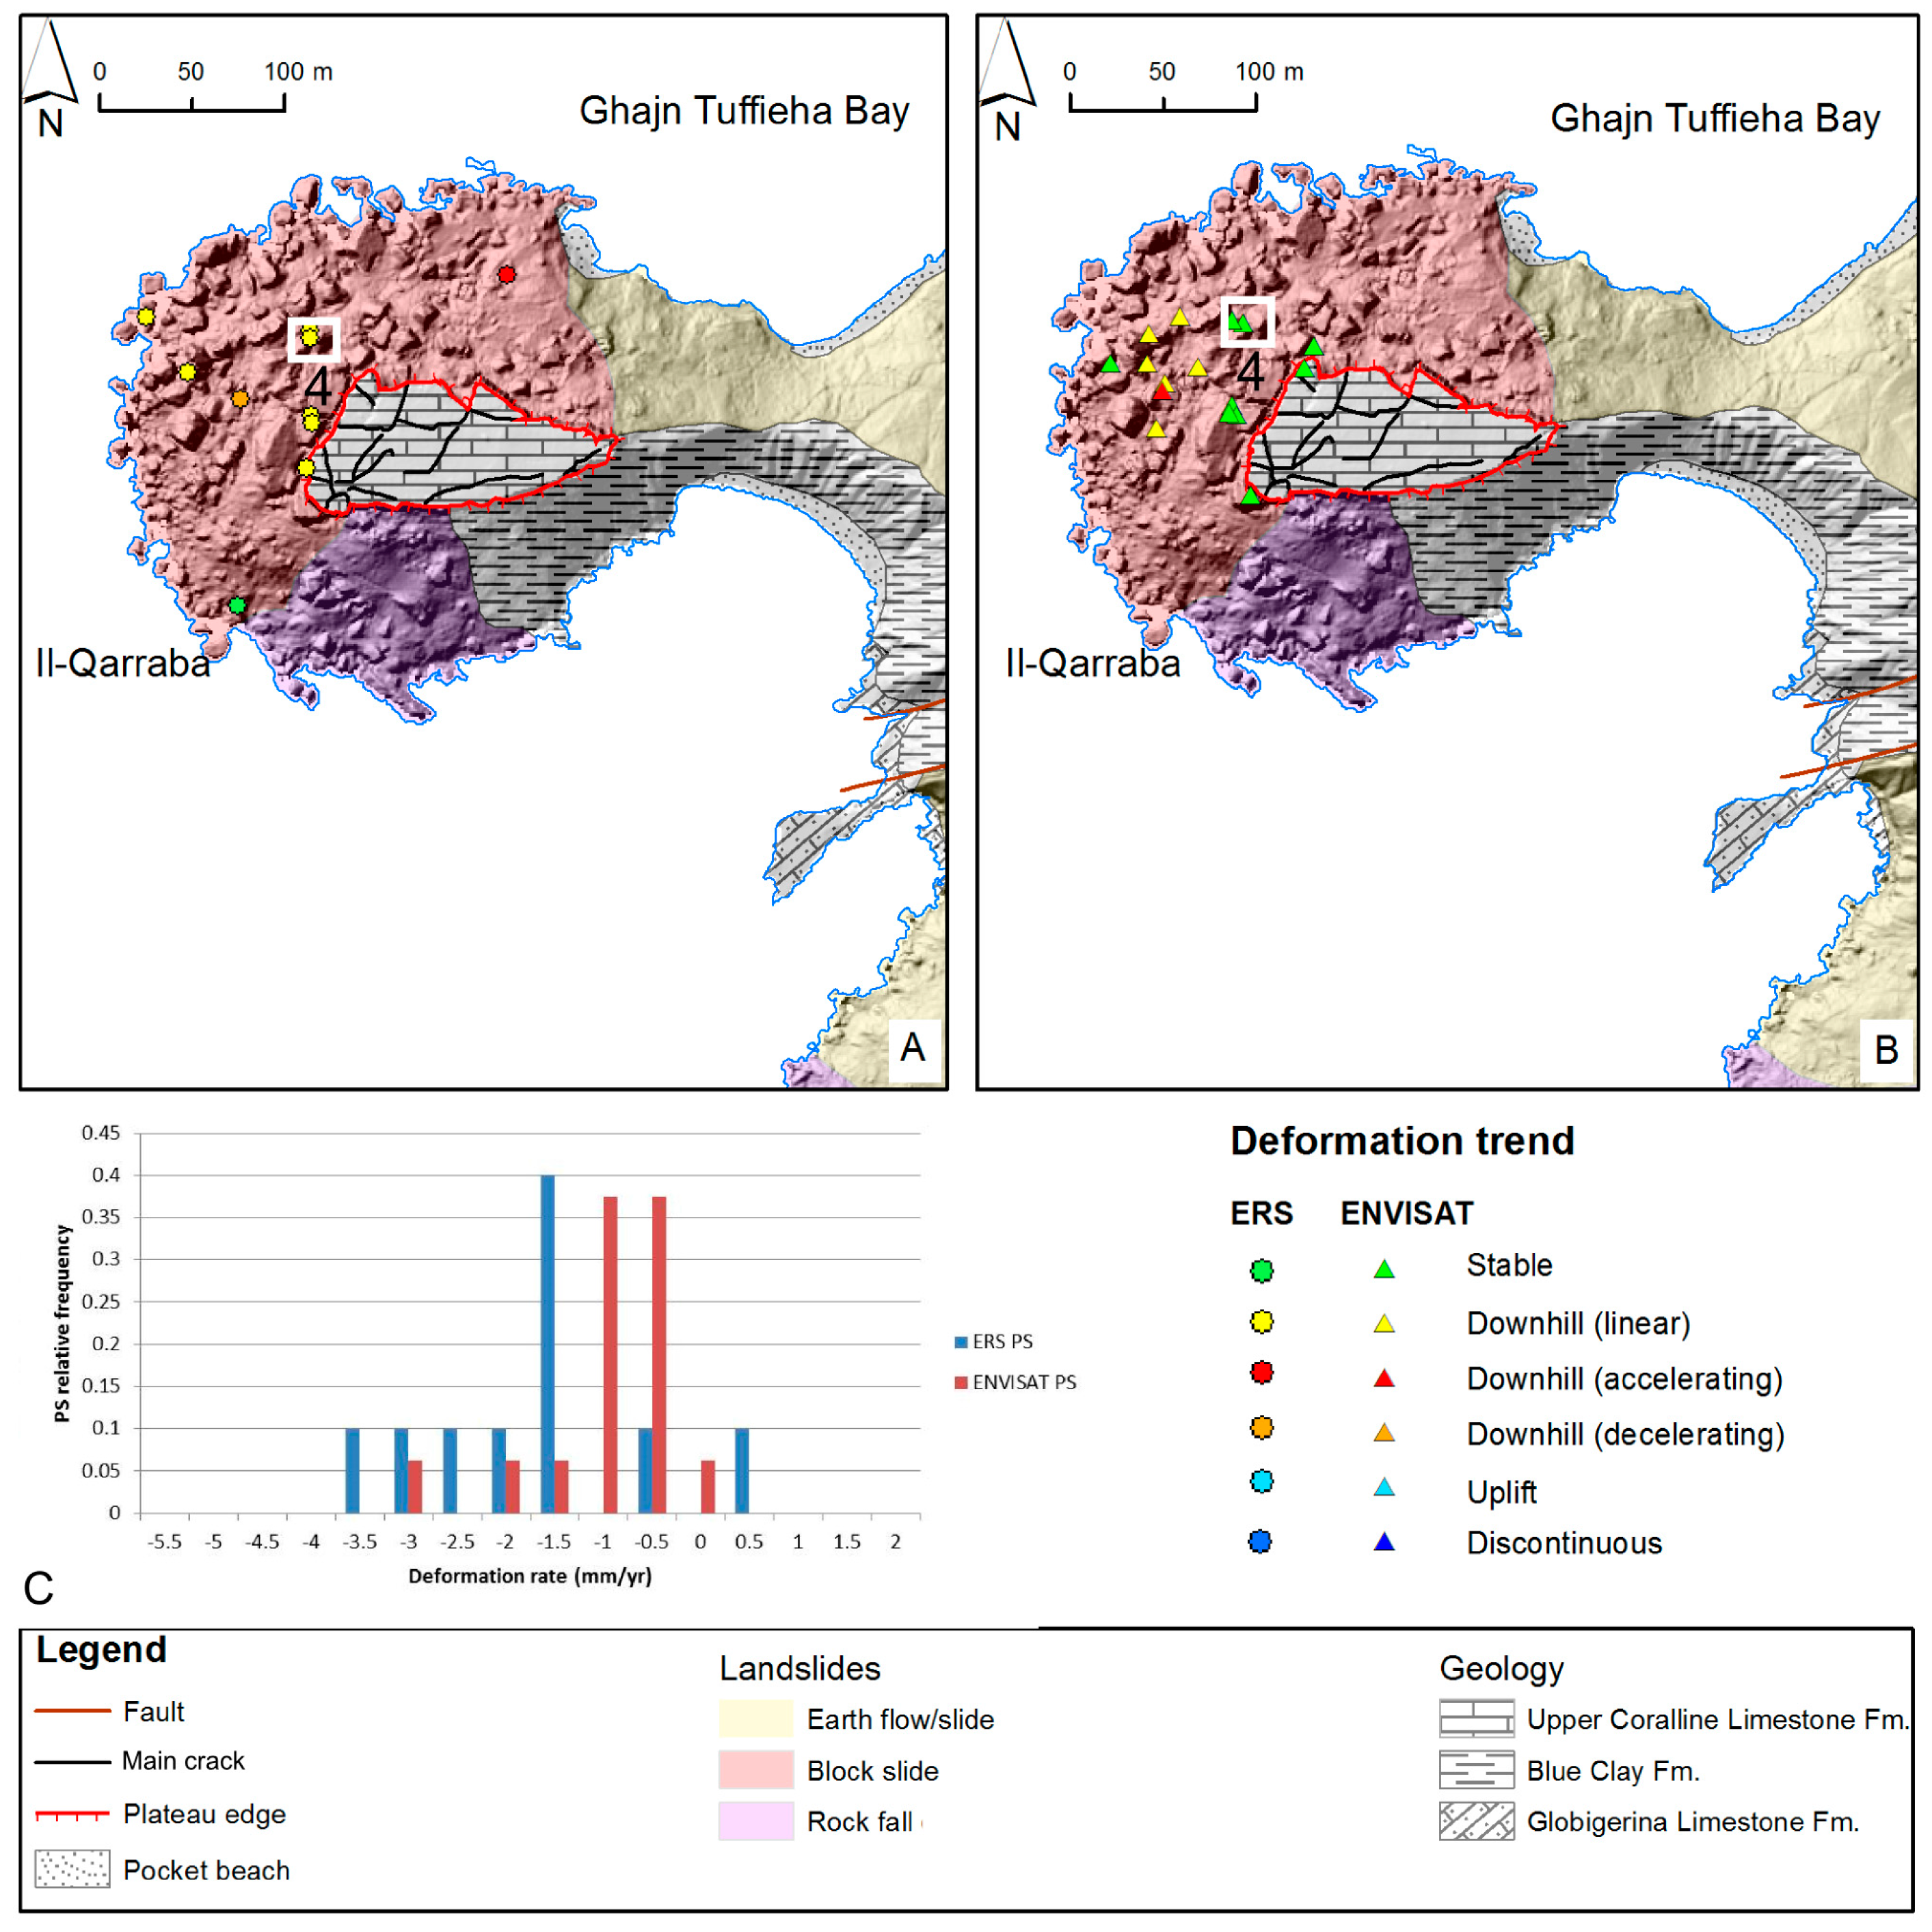
4.4. Il-Qarraba Landslides
5. Discussion
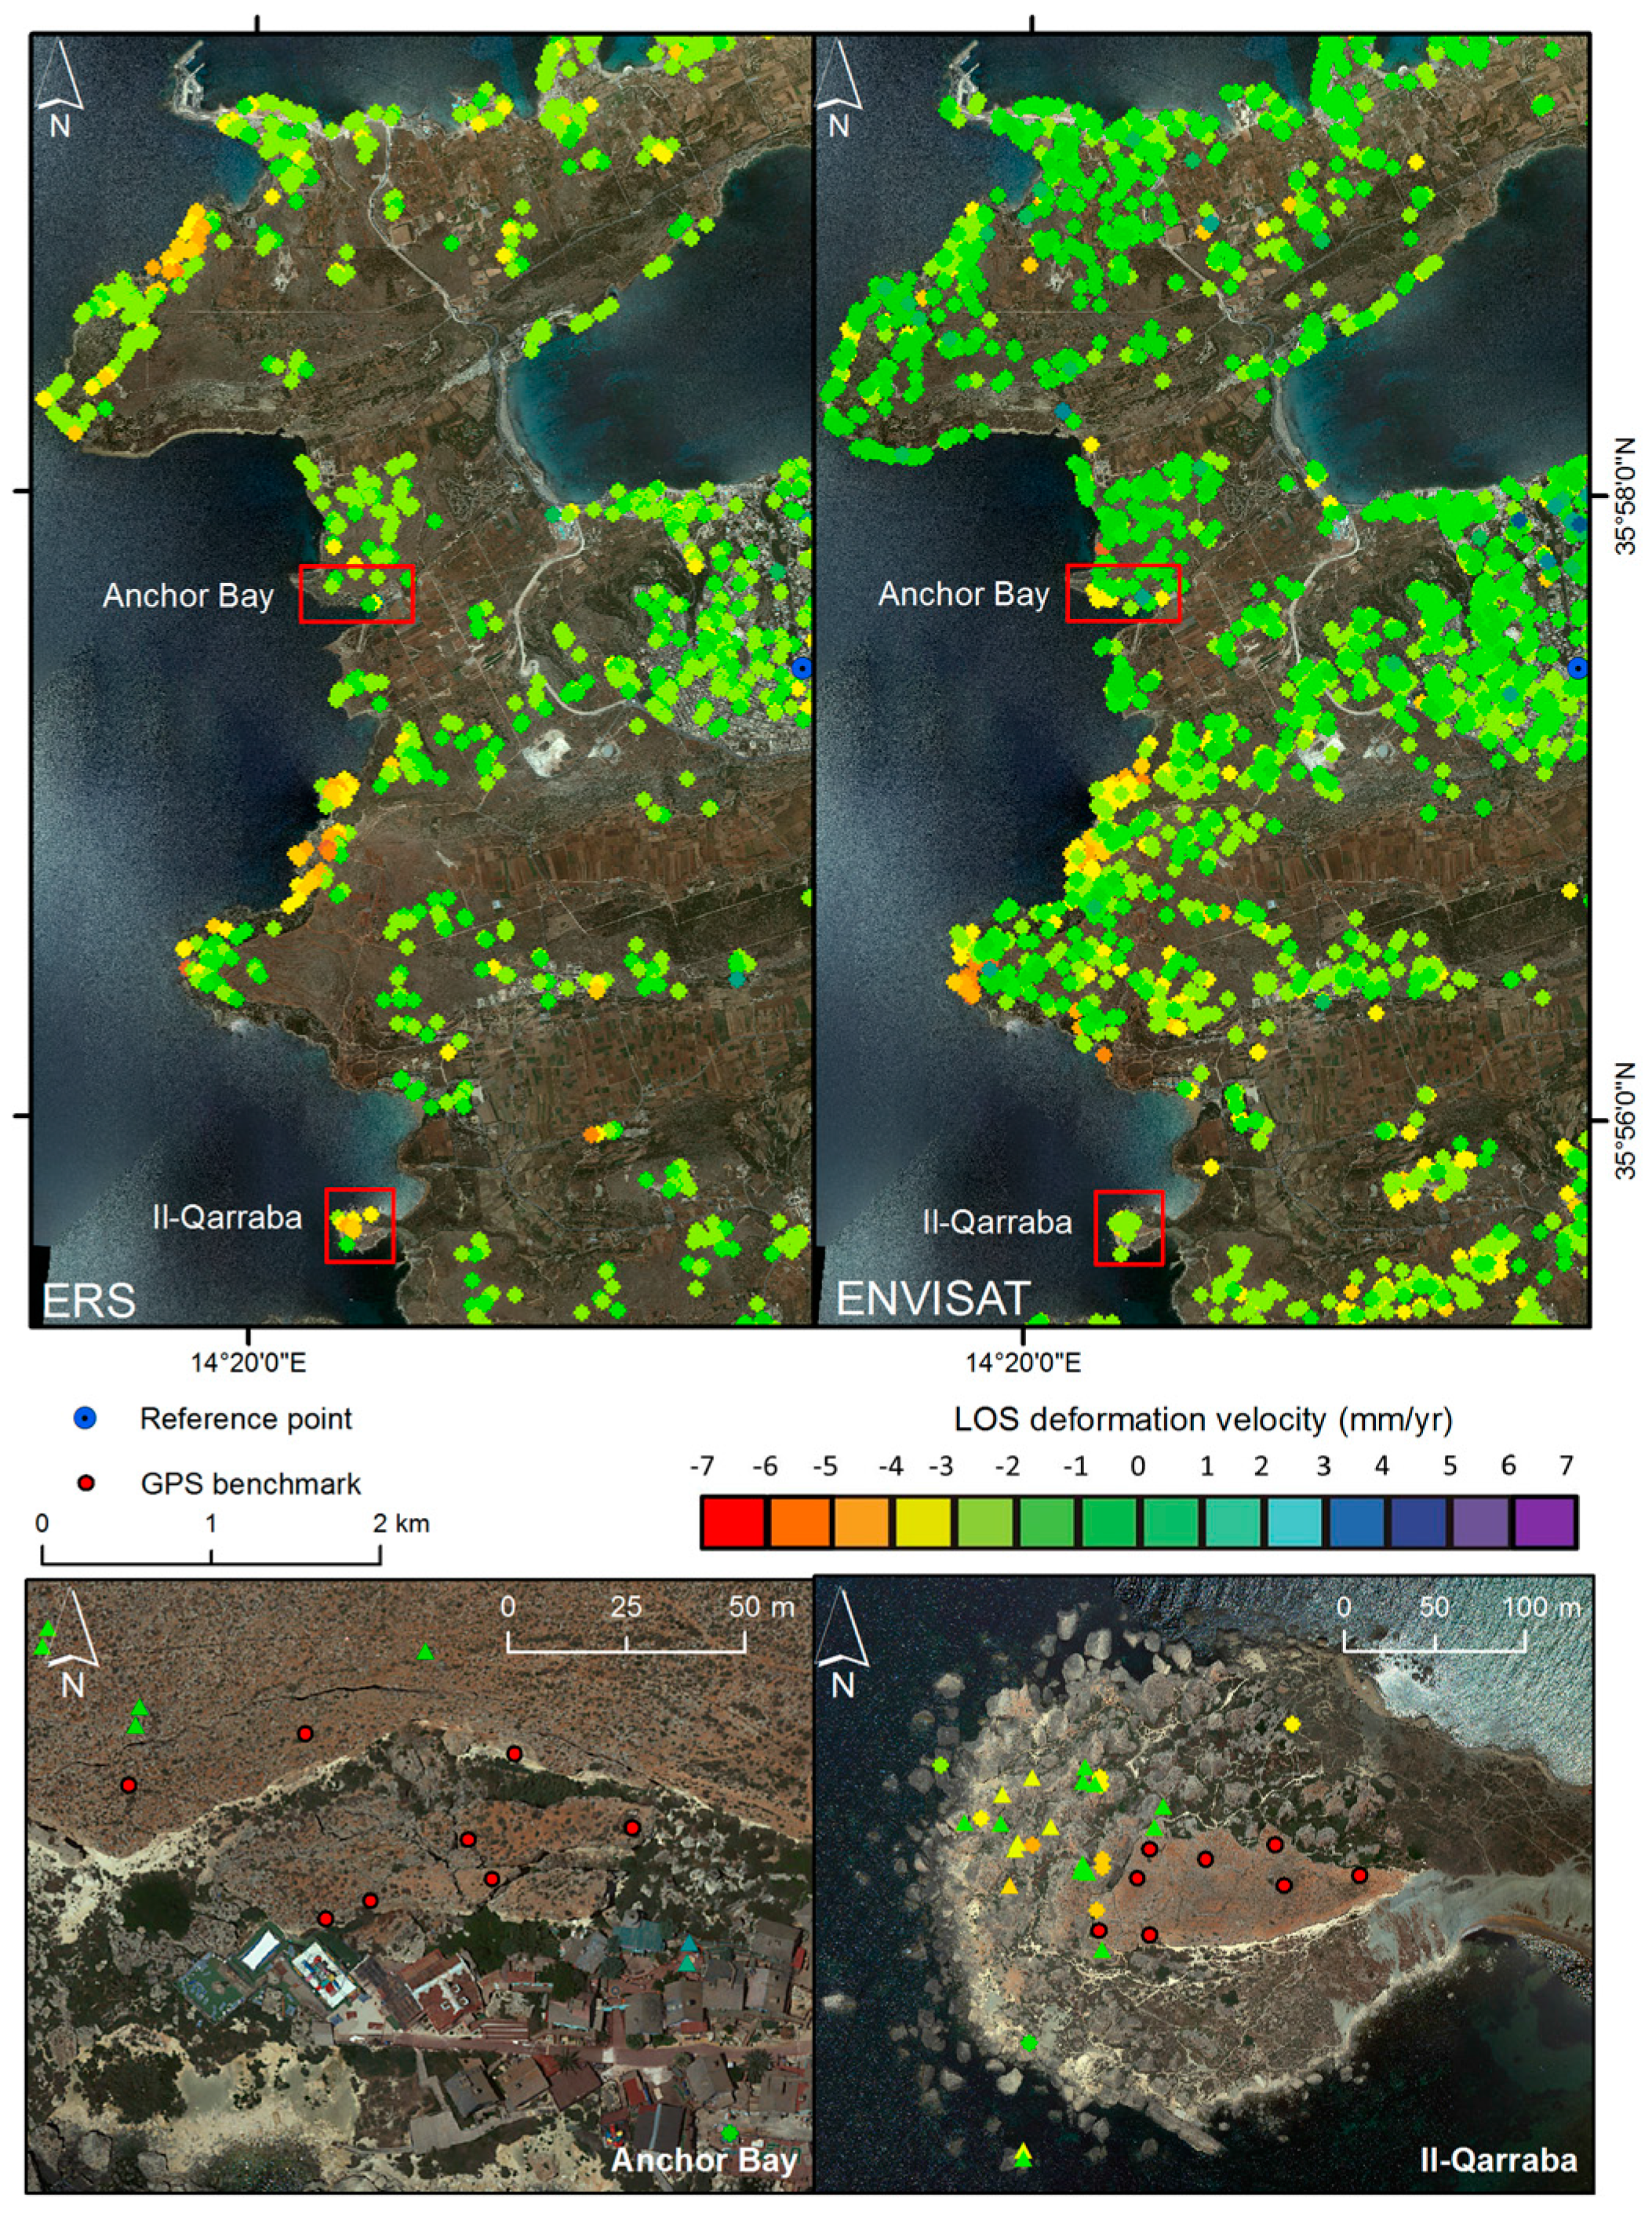
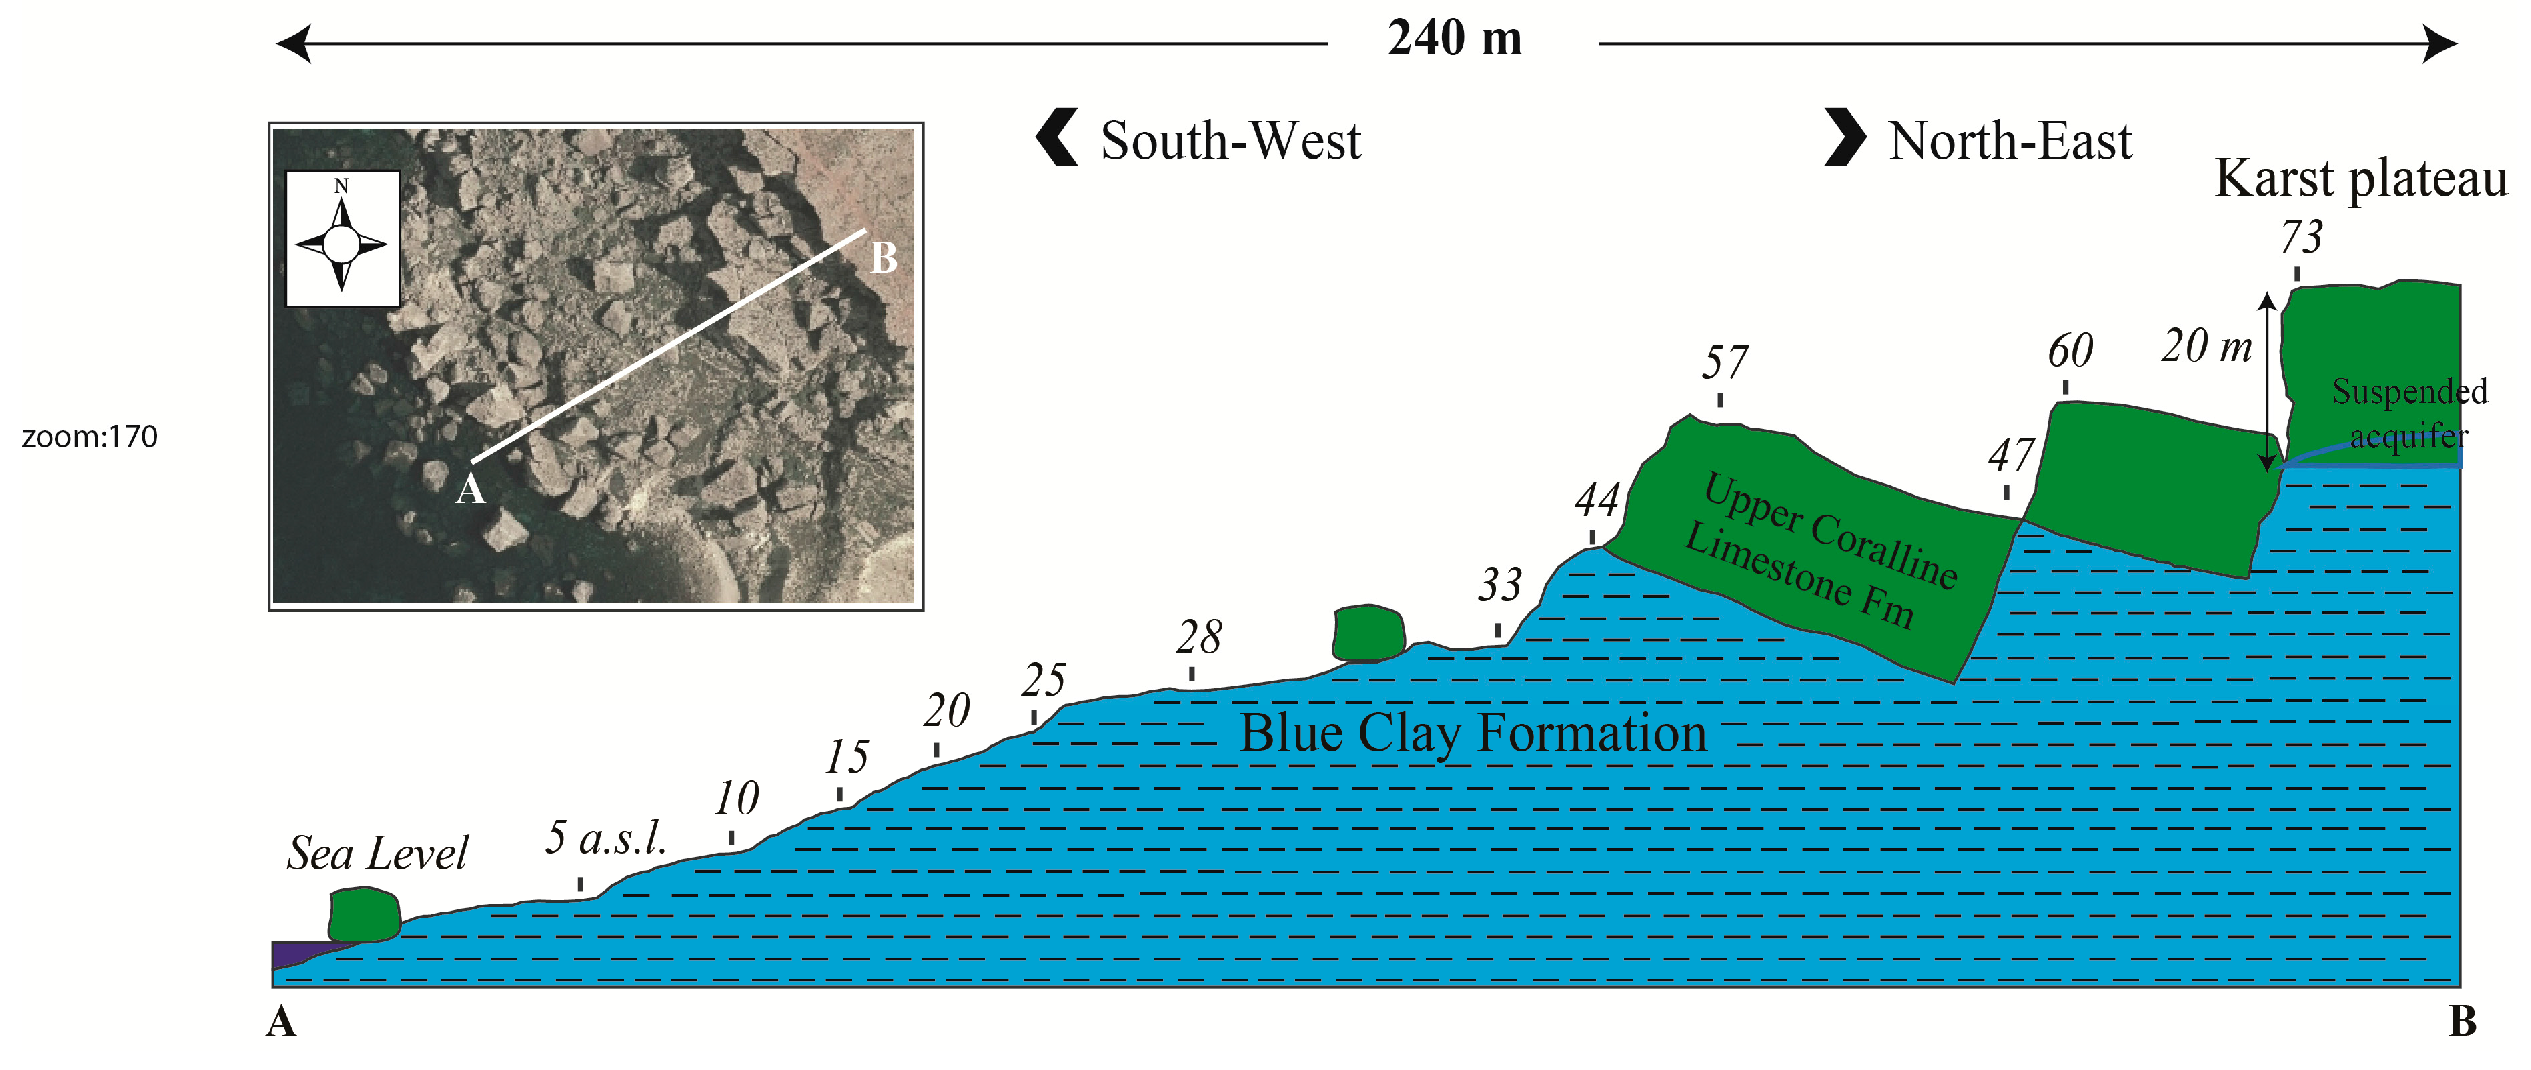
- Stable area. No significant deformation trend can be detected by the interferometric analysis. The majority of stable PS can be found in correspondence of wide block slide deposits or over the less jointed portions of plateaus. It is likely that the stability of the latter can be related to the limited thickness of the limestone slabs or to the presence of extensive network of joints that do not favor the presence of a karst aquifer. These types of settings occur at Il-Qarraba for which the interferometric results confirm the above mentioned hypothesis.
- Downhill-moving area. A significant increment in LOS distance between the target and the sensor can be detected. The associated deformation trend can be interpolated linearly and can be constant through time or discontinuous (i.e., accelerating or decelerating). The PS showing this behavior were interpreted as blocks detached from the plateau that began to move downward towards the sea. The deformation process may be ascribable to the presence of a slip surface. This kind of movement is more common in the upper part of steep slopes as in the area of Rdum id-Delli and Rdum Majjiesa. Again the interferometric results appear consistent with this geomorphological interpretation.
- Discontinuous-moving area. The seaward translation of the blocks on the surface is irregular. When the steepness of the slope decreases or the slip surface progressively becomes sub-horizontal, the blocks might come to a temporary rest. The consequent uplift measured in terms of reduction of the LOS is likely to be associated to a backward tilting of the blocks towards the plateau favored by the bulging and expansion of the underlying clay. This style of deformation is evident at Marfa Ridge where blocks that slide towards the sea, according to the ERS dataset, subsequently showed a back-tilting in the interferometric analysis performed using ENVISAT images. On the other hand, according to PS measurements on ERS dataset, at Ras Il-Whax blocks first show a discontinuous deformation trend and then appear to be stable or to re-start their descent along the slope.
- Uplift-moving area. It is the natural evolution of the discontinuous trend, as a matter of fact it is frequently observed around cluster of blocks characterized by this type of deformation as can be clearly noted in Figure 7 and Figure 11. This behavior is also favored by the bulging and the expansion of the underlying clay.
6. Conclusions
Acknowledgments
Author Contributions
Conflicts of Interest
Abbreviations
| SBAS | Short Baseline Subsets |
| PSI | Persistent Scatterer Interferometry |
| IPTA | Interferometric Point Target Analysis |
| ESA | European Space Agency |
| SRTM | Second Shuttle Radar Topography Mission |
| DEM | Digital Elevation Model |
| PS | Persistent Scatterer |
| SLC | Single Look Complex |
| LOS | Line of Sight |
| GNSS | Global Navigation Satellite System |
References
- Bamler, R.; Hartl, P. Synthetic aperture radar interferometry. Inverse Probl. 1998, 14. [Google Scholar] [CrossRef]
- Hooper, A.; Zebker, H.; Segall, P.; Kampes, B. A new method for measuring deformation on volcanoes and other natural terrains using InSAR persistent scatterers. Geophys. Res. Lett. 2004, 31. [Google Scholar] [CrossRef]
- Carnec, C.; Delacourt, C. Three years of mining subsidence monitored by SAR interferometry, near Gardanne, France. J. Appl. Geophys. 2000, 43, 43–54. [Google Scholar] [CrossRef]
- Tomás, R.; Márquez, Y.; Lopez-Sanchez, J.M.; Delgado, J.; Blanco, P.; Mallorquí, J.J.; Martinez, M.; Herrera, G.; Mulas, J. Mapping ground subsidence induced by aquifer overexploitation using advanced Differential SAR Interferometry: Vega Media of the Segura River (SE Spain) case study. Remote Sens. Environ. 2005, 98, 269–283. [Google Scholar] [CrossRef]
- Berardino, P.; Costantini, M.; Franceschetti, G.; Iodice, A.; Pietranera, L.; Rizzo, V. Use of differential SAR interferometry in monitoring and modelling large slope instability at Maratea (Basilicata, Italy). Eng. Geol. 2003, 68, 31–51. [Google Scholar] [CrossRef]
- Calo, F.; Ardizzone, F.; Castaldo, R.; Lollino, P.; Tizzani, P.; Guzzetti, F.; Manunta, M. Enhanced landslide investigations through advanced DInSAR techniques: The Ivancich case study, Assisi, Italy. Remote Sens. Environ. 2014, 142, 69–82. [Google Scholar] [CrossRef]
- Gigli, G.; Frodella, W.; Mugnai, F.; Tapete, D.; Cigna, F.; Fanti, R.; Intrieri, E.; Lombardi, L. Instability mechanisms affecting cultural heritage sites in the Maltese Archipelago. Nat. Hazards Earth Syst. Sci. 2012, 12, 1883–1903. [Google Scholar] [CrossRef] [Green Version]
- Berardino, P.; Fornaro, G.; Lanari, R.; Sansosti, E. A new algorithm for surface deformation monitoring based on small baseline differential SAR interferograms. IEEE Trans. Geosci. Remote Sens. 2002, 40, 2375–2383. [Google Scholar] [CrossRef]
- Ferretti, A.; Prati, C.; Rocca, F. Permanent scatterers in SAR interferometry. IEEE Trans. Geosci. Remote Sens. 2001, 39, 8–20. [Google Scholar] [CrossRef]
- Werner, C.; Wegmuller, U.; Strozzi, T.; Wiesmann, A. Interferometric point target analysis for deformation mapping. In Proceedings of the IEEE International 2003 Geoscience and Remote Sensing Symposium, Toulouse, France, 21–25 July 2003; pp. 4362–4364.
- Berti, M.; Corsini, A.; Franceschini, S.; Iannacone, J.P. Automated classification of Persistent Scatterers Interferometry time series. Nat. Hazards Earth Syst. Sci. 2013, 13, 1945–1958. [Google Scholar] [CrossRef]
- Magri, O.; Mantovani, M.; Pasuto, A.; Soldati, M. Geomorphological investigation and monitoring of lateral spreading along the north-west coast of Malta. Geogr. Fisica Din. Quat. 2008, 31, 171–180. [Google Scholar]
- Devoto, S.; Biolchi, S.; Bruschi, V.M.; Díez, A.G.; Mantovani, M.; Pasuto, A.; Piacentini, D.; Schembri, J.A.; Soldati, M. Landslides along the north-west coast of the Island of Malta. In Landslide Science and Practice; Margottini, C., Canuti, P., Sassa, K., Eds.; Springer: Berlin, Germany; Heidelberg, Germany, 2013; Volume 1, pp. 57–63. [Google Scholar]
- Casu, F.; Manzo, M.; Lanari, R. A quantitative assessment of the SBAS algorithm performance for the surface deformation retrieval from DInSAR data. Remote Sens. Environ. 2006, 102, 195–210. [Google Scholar] [CrossRef]
- Biolchi, S.; Furlani, S.; Devoto, S.; Gauci, R.; Castaldini, D.; Soldati, M. Geomorphological identification, classification and spatial distribution of coastal landforms of Malta (Mediterranean Sea). J. Maps 2016, 12, 87–99. [Google Scholar] [CrossRef]
- Alexander, D. A review of the physical geography of Malta and its significance for tectonic geomorphology. Quat. Sci. Rev. 1988, 7, 41–53. [Google Scholar] [CrossRef]
- Dykes, A.P. Mass movements and conservation management in Malta. J. Environ. Manag. 2002, 66, 77–89. [Google Scholar] [CrossRef]
- Pedley, M.; Clarke, M.H. Limestone Isles in a Crystal Sea: The Geology of the Maltese Islands; Publishers Enterprises Group: San Gwann, Malta, 2002. [Google Scholar]
- Devoto, S.; Biolchi, S.; Bruschi, V.M.; Furlani, S.; Mantovani, M.; Piacentini, D.; Pasuto, A.; Soldati, M. Geomorphological map of the NW Coast of the Island of Malta (Mediterranean Sea). J. Maps 2012, 8, 33–40. [Google Scholar] [CrossRef]
- Coratza, P.; Bruschi, V.M.; Piacentini, D.; Saliba, D.; Soldati, M. Recognition and assessment of geomorphosites in Malta at the Il-Majjistral Nature and History Park. Geoheritage 2011, 3, 175–185. [Google Scholar] [CrossRef] [Green Version]
- Mantovani, M.; Devoto, S.; Forte, E.; Mocnik, A.; Pasuto, A.; Piacentini, D.; Soldati, M. A multidisciplinary approach for rock spreading and block sliding investigation in the north-western coast of Malta. Landslides 2013, 10, 611–622. [Google Scholar] [CrossRef]
- Pasuto, A.; Soldati, M. Lateral Spreading. In Treatise on Geomorphology; Shroder, J.F., Ed.; Academic Press: San Diego, CA, USA, 2013; Volume 7, pp. 239–248. [Google Scholar]
- Colesanti, C.; Wasowski, J. Investigating landslides with space-borne Synthetic Aperture Radar (SAR) interferometry. Eng. Geol. 2006, 88, 173–199. [Google Scholar] [CrossRef]
- Conti, S.; Tosatti, G. Tectonic vs. gravitational processes affecting Ligurian and Epiligurian units in the Marecchia valley (northern Apennines). Mem. Sci. Geol. 1996, 48, 107–142. [Google Scholar]
- Brunsden, D. The case of the missing ductile layer. J. Geol. Soc. China 1996, 39, 535–556. [Google Scholar]
- Piacentini, D.; Devoto, S.; Mantovani, M.; Pasuto, A.; Prampolini, M.; Soldati, M. Landslide susceptibility modeling assisted by Persistent Scatterers Interferometry (PSI): An example from the northwestern coast of Malta. Nat. Hazards 2015, 78, 681–697. [Google Scholar] [CrossRef] [Green Version]


| No. | Sensor | Date of Acquisition (yyyy-mm-dd) | Orbit Number | Julian Day | Temporal Baseline (days) | Perpen—Dicular Baseline (m) | Notes |
|---|---|---|---|---|---|---|---|
| 1 | ERS-1 | 1992-08-14 | 5649 | 2,448,849 | −1809 | −777 | |
| 2 | ERS-1 | 1992-09-18 | 6150 | 2,448,884 | −1774 | 436 | |
| 3 | ERS-1 | 1992-10-23 | 6651 | 2,448,919 | −1739 | −355 | |
| 4 | ERS-1 | 1993-03-12 | 8655 | 2,449,059 | −1599 | −126 | |
| 5 | ERS-1 | 1993-05-21 | 9657 | 2,449,129 | −1529 | −121 | |
| 6 | ERS-1 | 1993-06-25 | 10,158 | 2,449,164 | −1494 | −86 | |
| 7 | ERS-1 | 1993-07-30 | 10,659 | 2,449,199 | −1459 | 261 | |
| 8 | ERS-1 | 1993-08-10 | 11,661 | 2,449,269 | −1389 | −193 | |
| 9 | ERS-1 | 1993-12-17 | 12,663 | 2,449,339 | −1319 | 787 | |
| 10 | ERS-2 | 1995-11-06 | 2835 | 2,450,028 | −630 | 355 | |
| 11 | ERS-2 | 1996-04-29 | 5358 | 2,450,202 | −456 | 802 | |
| 12 | ERS-2 | 1996-08-12 | 6861 | 2,450,308 | −350 | −178 | |
| 13 | ERS-2 | 1996-09-16 | 7362 | 2450,343 | −315 | −98 | |
| 14 | ERS-2 | 1996-10-21 | 7863 | 2,450,378 | −280 | 626 | |
| 15 | ERS-2 | 1996-11-25 | 8364 | 2,450,413 | −245 | 971 | |
| 16 | ERS-2 | 1996-12-30 | 8865 | 2,450,448 | −210 | −30 | |
| 17 | ERS-2 | 1997-03-10 | 9867 | 2,450,518 | −140 | 28 | |
| 18 | ERS-2 | 1997-04-14 | 10,368 | 2,450,553 | −105 | 600 | |
| 19 | ERS-2 | 1997-07-28 | 11,871 | 2,450,658 | 0 | 0 | Master |
| 20 | ERS-2 | 1997-10-06 | 12,837 | 2,450,728 | 70 | 386 | |
| 21 | ERS-2 | 1997-11-10 | 13,374 | 2,450,763 | 105 | −382 | |
| 22 | ERS-2 | 1997-12-15 | 13,875 | 2,450,798 | 140 | −382 | |
| 23 | ERS-2 | 1998-01-19 | 14,376 | 2,450,833 | 175 | −447 | Noisy |
| 24 | ERS-2 | 1998-02-23 | 14,877 | 2,450,868 | 210 | −612 | |
| 25 | ERS-2 | 1998-06-08 | 16,380 | 2,450,973 | 315 | 679 | |
| 26 | ERS-2 | 1998-07-13 | 16,881 | 2,451,008 | 350 | −574 | |
| 27 | ERS-2 | 1998-08-17 | 17,382 | 2,451,043 | 385 | −281 | |
| 28 | ERS-1 | 1998-09-20 | 37,556 | 2,451,077 | 419 | 75 | |
| 29 | ERS-2 | 1998-09-21 | 17,883 | 2,451,078 | 420 | −240 | |
| 30 | ERS-2 | 1998-10-26 | 18,384 | 2,451,113 | 455 | 251 | |
| 31 | ERS-2 | 1998-11-30 | 18,885 | 2,451,148 | 490 | −127 | |
| 32 | ERS-2 | 1999-01-04 | 19,386 | 2,451,183 | 525 | −1427 | Noisy |
| 33 | ERS-2 | 1999-03-15 | 20,388 | 2,451,252 | 594 | 130 | |
| 34 | ERS-2 | 1999-04-19 | 20,889 | 2,451,288 | 630 | 513 | |
| 35 | ERS-2 | 1999-05-24 | 21,390 | 2,451,323 | 665 | 121 | |
| 36 | ERS-2 | 1999-08-02 | 22,392 | 2,451,393 | 735 | 2 | |
| 37 | ERS-2 | 1999-09-06 | 22,893 | 2,451,428 | 770 | −475 | |
| 38 | ERS-2 | 1999-10-11 | 23,394 | 2,451,463 | 805 | −623 | |
| 39 | ERS-2 | 1999-11-15 | 23,895 | 2,451,498 | 840 | 147 | |
| 40 | ERS-2 | 1999-12-20 | 24,396 | 2,451,532 | 874 | −178 | |
| 41 | ERS-2 | 2000-01-24 | 24,897 | 2,451,568 | 910 | 33 | |
| 42 | ERS-2 | 2000-02-28 | 25,398 | 2,451,603 | 945 | −476 | |
| 43 | ERS-2 | 2000-04-03 | 25,899 | 2,451,638 | 980 | 149 | |
| 44 | ERS-2 | 2000-05-08 | 26,400 | 2,451,673 | 1015 | 663 | |
| 45 | ERS-2 | 2000-06-12 | 26,901 | 2,451,708 | 1050 | −270 | |
| 46 | ERS-2 | 2000-07-17 | 27,402 | 2,451,743 | 1085 | −478 | |
| 47 | ERS-2 | 2000-08-21 | 27,903 | 2,451,778 | 1120 | 278 | |
| 48 | ERS-2 | 2000-09-25 | 28,404 | 2,451,813 | 1155 | 500 | |
| 49 | ERS-2 | 2000-10-30 | 28,905 | 2,451,848 | 1190 | 73 | |
| 50 | ERS-2 | 2000-12-04 | 29,406 | 2,451,883 | 1225 | 160 |
| No. | Sensor | Date of Acquisition (yyyy-mm-dd) | Orbit Number | Julian Day | Temporal Baseline (days) | Perpen—DICULAR Baseline (m) | Notes |
|---|---|---|---|---|---|---|---|
| 1 | ASAR | 2003-04-28 | 6059 | 2,452,758 | −1400 | 1339 | Noisy |
| 2 | ASAR | 2003-08-11 | 7562 | 2,452,863 | −1295 | −860 | Noisy |
| 3 | ASAR | 2004-02-02 | 10,067 | 2,453,038 | −1120 | 665 | |
| 4 | ASAR | 2004-03-08 | 10,568 | 2,453,073 | −1085 | 139 | |
| 5 | ASAR | 2004-04-12 | 11,069 | 2,453,108 | −1050 | 766 | |
| 6 | ASAR | 2004-05-17 | 11,570 | 2,453,143 | −1015 | −227 | |
| 7 | ASAR | 2004-07-26 | 12,572 | 2,453,213 | −945 | 191 | |
| 8 | ASAR | 2004-08-30 | 13,073 | 2,453,248 | −910 | 97 | Noisy |
| 9 | ASAR | 2004-10-04 | 13,574 | 2,453,283 | −875 | −103 | |
| 10 | ASAR | 2004-11-08 | 14,075 | 2,453,318 | −840 | −401 | |
| 11 | ASAR | 2004-12-13 | 14,576 | 2,453,353 | −805 | −259 | |
| 12 | ASAR | 2005-01-17 | 15,077 | 2,453,388 | −770 | −349 | |
| 13 | ASAR | 2005-02-21 | 15,578 | 2,453,423 | −735 | −655 | |
| 14 | ASAR | 2005-03-28 | 16,079 | 2,453,458 | −700 | −864 | |
| 15 | ASAR | 2005-08-15 | 18,083 | 2,453,598 | −560 | −198 | |
| 16 | ASAR | 2005-10-24 | 19,085 | 2,453,668 | −490 | 349 | |
| 17 | ASAR | 2005-11-28 | 19,586 | 2,453,703 | −455 | −288 | |
| 18 | ASAR | 2006-02-06 | 20,588 | 2,453,773 | −385 | −750 | |
| 19 | ASAR | 2006-03-13 | 21,089 | 2,453,808 | −350 | −66 | |
| 20 | ASAR | 2006-04-17 | 21,590 | 2,453,843 | −315 | −170 | |
| 21 | ASAR | 2006-06-26 | 22,592 | 2,453,913 | −245 | 418 | |
| 22 | ASAR | 2006-09-04 | 23,594 | 2,453,983 | −175 | 336 | Noisy |
| 23 | ASAR | 2007-01-22 | 25,598 | 2,454,123 | −35 | 556 | |
| 24 | ASAR | 2007-02-26 | 26,099 | 2,454,158 | 0 | 0 | Master |
| 25 | ASAR | 2007-04-02 | 26,600 | 2,454,193 | 35 | 375 | |
| 26 | ASAR | 2007-06-11 | 27,602 | 2,454,263 | 105 | −207 | |
| 27 | ASAR | 2007-08-20 | 28,604 | 2,454,333 | 175 | −63 | Noisy |
| 28 | ASAR | 2008-01-07 | 30,608 | 2,454,473 | 315 | −474 | |
| 29 | ASAR | 2008-03-17 | 31,610 | 2,454,543 | 385 | −205 | |
| 30 | ASAR | 2009-03-02 | 36,620 | 2,454,893 | 735 | 174 | |
| 31 | ASAR | 2009-04-06 | 37,121 | 2,454,928 | 770 | 453 | |
| 32 | ASAR | 2009-05-11 | 37,622 | 2,454,963 | 805 | −113 | |
| 33 | ASAR | 2009-07-20 | 38,624 | 2,455,033 | 875 | 33 |
| Dataset | Standard Deviation Residual Phase (rad) | Estimated Height Uncertainty (m) | Estimated Deformation Rate Uncertainty (mm/yr) | Stable PS (%) | Deforming PS (%) |
|---|---|---|---|---|---|
| ERS | 0.616 | 0.300 | 0.159 | 84.80 | 15.20 |
| ENVISAT | 0.627 | 0.405 | 0.319 | 69.95 | 30.05 |
© 2016 by the authors; licensee MDPI, Basel, Switzerland. This article is an open access article distributed under the terms and conditions of the Creative Commons Attribution (CC-BY) license (http://creativecommons.org/licenses/by/4.0/).
Share and Cite
Mantovani, M.; Devoto, S.; Piacentini, D.; Prampolini, M.; Soldati, M.; Pasuto, A. Advanced SAR Interferometric Analysis to Support Geomorphological Interpretation of Slow-Moving Coastal Landslides (Malta, Mediterranean Sea). Remote Sens. 2016, 8, 443. https://doi.org/10.3390/rs8060443
Mantovani M, Devoto S, Piacentini D, Prampolini M, Soldati M, Pasuto A. Advanced SAR Interferometric Analysis to Support Geomorphological Interpretation of Slow-Moving Coastal Landslides (Malta, Mediterranean Sea). Remote Sensing. 2016; 8(6):443. https://doi.org/10.3390/rs8060443
Chicago/Turabian StyleMantovani, Matteo, Stefano Devoto, Daniela Piacentini, Mariacristina Prampolini, Mauro Soldati, and Alessandro Pasuto. 2016. "Advanced SAR Interferometric Analysis to Support Geomorphological Interpretation of Slow-Moving Coastal Landslides (Malta, Mediterranean Sea)" Remote Sensing 8, no. 6: 443. https://doi.org/10.3390/rs8060443