Article

Retrieval of Aerosol Fine-Mode Fraction from Intensity and Polarization Measurements by PARASOL over East Asia

1
Environment Protection Key Laboratory of Satellite Remote Sensing, Institute of Remote Sensing and Digital Earth, Chinese Academy of Sciences, Beijing 100101, China
2
University of Chinese Academy of Sciences, Beijing 100049, China
3
College of Resources and Environment, Chengdu University of Information Technology, Chengdu 610225, China
*
Author to whom correspondence should be addressed.
Remote Sens. 2016, 8(5), 417; https://doi.org/10.3390/rs8050417
Submission received: 9 March 2016 / Revised: 25 April 2016 / Accepted: 10 May 2016 / Published: 16 May 2016

Abstract

:
The fine-mode fraction (FMF) of aerosol optical depth (AOD) is a key optical parameter that represents the proportion of fine particles relative to total aerosols in the atmosphere. However, in comparison to ground-based measurements, the FMF is still difficult to retrieve from satellite observations, as attempted by a Moderate-resolution Imaging Spectroradiometer (MODIS) algorithm. In this paper, we introduce the retrieval of FMF based on Polarization and Anisotropy of Reflectances for Atmospheric Science coupled with Observations from a Lidar (PARASOL) data. This method takes advantage of the coincident multi-angle intensity and polarization measurements from a single satellite platform. In our method, we use intensity measurements to retrieve the total AOD and polarization measurements to retrieve the fine-mode AOD. The FMF is then calculated as the ratio of the retrieved fine-mode AOD to the total AOD. The important processes in our method include the estimation of the surface intensity and polarized reflectance by using two semi-empirical models, and the building of two sets of aerosol retrieval lookup tables for the intensity and polarized measurements via the 6SV radiative transfer code. We apply this method to East Asia, and comparisons of the retrieved FMFs for the Beijing, Xianghe and Seoul_SNU sites with those of the Aerosol Robotic Network (AERONET) ground-based observations produce correlation coefficients (R2) of 0.838, 0.818, and 0.877, respectively. However, the comparison results are relatively poor (R2 = 0.537) in low-AOD areas, such as the Osaka site, due to the low signal-to-noise ratio of the satellite observations.

Graphical Abstract

1. Introduction

Atmospheric aerosols play an important role in the global climate and environmental changes. They alter the radiation balance of the atmosphere, resulting in circulatory changes [1,2], and cause atmospheric pollution, which has an important influence on the biosphere. Atmospheric aerosols have become a prevalent research topic in numerous science fields.
In recent years, with the development of satellite-based remote sensing technologies, the method of retrieving the first parameter to reflect the optical properties of aerosols—aerosol optical depth (AOD)—has become more and more mature, and the retrieval algorithms of AOD have been developed based on many satellite platforms. For example, the AOD product that is retrieved by the dense dark vegetation (DDV) method of the Moderate-resolution Imaging Spectroradiometer (MODIS) platform [3,4] has been widely used in atmospheric and environmental studies. However, the use of this single parameter is insufficient to estimate the anthropogenic aerosol content and to understand the influence of human effects on climate change and air pollution.
The aerosol fine-mode fraction (FMF) is defined as [5]
F M F = τ f τ f + τ c
where τ f is the aerosol fine-mode optical depth and τ c is the aerosol coarse-mode optical depth. Since most anthropogenic aerosols are fine-mode aerosols [6], the FMF effectively reflects the anthropogenic aerosol content. Additionally, it has a significant impact on the study of climate change and regional atmospheric pollution, and can further provide a way to estimate the human contributions to aerosol emissions. Consequently, this aerosol parameter is very important. According to its definition, to retrieve FMF, one needs to know the fine-mode AOD and the total AOD. Traditional radiometric intensity measurements can be used to retrieve total AOD by assuming a spectral aerosol model and removing the contribution of surface reflectance from the reflectance at the top of atmosphere (TOA). However, because the aerosol radiation contribution to the intensity signal is a mixture of fine- and coarse-mode aerosols, it is hard to distinguish the radiation contribution of the fine-mode aerosols from the coarse-mode aerosols when the actual aerosol size distribution is unknown. Moreover, the aerosol retrieval solution over land is strongly influenced by assumptions about spectral reflectance of the surface, which differs considerably from aerosol retrievals over the ocean. Thus, fine-mode aerosols over land are hard to quantify using a single intensity measurement, which has led to the low accuracy of FMF retrievals from instruments such as MODIS [7,8].
With the launch of sensors that have the ability to detect polarized light, such as the Polarization and Directionality of Earth’s Reflectance (POLDER) and Polarization and Anisotropy of Reflectances for Atmospheric Science coupled with Observations from a Lidar (PARASOL) instruments, polarized passive radiometric remote sensing provides a new research dimension in the field of aerosol retrieval. Because the polarization signal received by the sensor mainly comes from the radiation contribution of fine-mode aerosols, and the coarse-mode aerosols provide a negligible contribution, PARASOL data can be directly used in a fine-mode AOD operational algorithm over land [9,10]. Relevant validation work has shown that the retrieved fine-mode AODs are comparable to ground-based measurement data [11,12], which illustrates the validity of the PARASOL fine-mode AOD operational algorithm.
Therefore, if we could retrieve the total AOD and fine-mode AOD precisely, we could easily calculate FMF in theory. However, if we want to use MODIS and POLDER/PARASOL data to retrieve the two parameters individually, a series of problems may occur, such as the spatial location matching of the data from the two different platforms, the spatial resolution matching of the two different AOD products, the conversion of AOD at the different wavelengths, and the matching of data obtained at different observation times. Any approximate treatment of these problems could generate errors that would affect the accuracy of the retrieved FMF. On the other hand, we can avoid these problems by using the PARASOL platform because it inherently measures the intensity and polarized signal synchronously.
In this paper, we present a new method to retrieve FMF based on PARASOL. Our study considers East Asia, and especially China, as the study area because this region has a serious air pollution problem. The AOD retrieval, the estimation method of surface intensity and polarized reflectance, the determination of the aerosol model parameters, and the data processing flow are presented in Section 2. The study of dust and haze cases using our retrieval method and a comparison with the FMF derived from MODIS are presented in Section 3. Based on ground-based data from four Aerosol Robotic Network (AERONET) sites in East Asia, validation of the retrieval results produced by our method are also presented in that section. Some discussion of our retrieval method is presented in Section 4. A summary of the full text is given in Section 5.

2. Methodology

The PARASOL instrument was developed by the Centre National d’Etudes Spatiales (CNES) in partnership with industrial contractors. PARASOL was launched in December 2004 as part of the A-Train. It has the ability to detect intensity and polarized radiation from multi-angular observations. Table 1 provides the sensor parameters of PARASOL [13].
The flow chart of this study is presented in Figure 1. We employ the Second Simulation of a Satellite Signal in the Solar Spectrum, Vector version (6SV, version 2.1) radiative transfer code [14,15], which is the vector version of 6S, to construct a lookup table (LUT) for aerosol retrieval [16]. The aerosol model, geometry, and band parameters are the inputs of 6SV. The intensity measurement, polarized measurement, and cloud mask data are extracted from the PARASOL Level 1 data by Interactive Data Language (IDL). Pixels marked as clouds are not processed. The intensity data and polarized data are used to retrieve total AOD and fine-mode AOD, respectively. Two semi-empirical reflectance estimation models with normalized differential vegetation index (NDVI) values as the function and the LUT are applied to the AOD retrieval. Finally, the FMF can be calculated as the ratio of the retrieved fine-mode AOD to the total AOD.

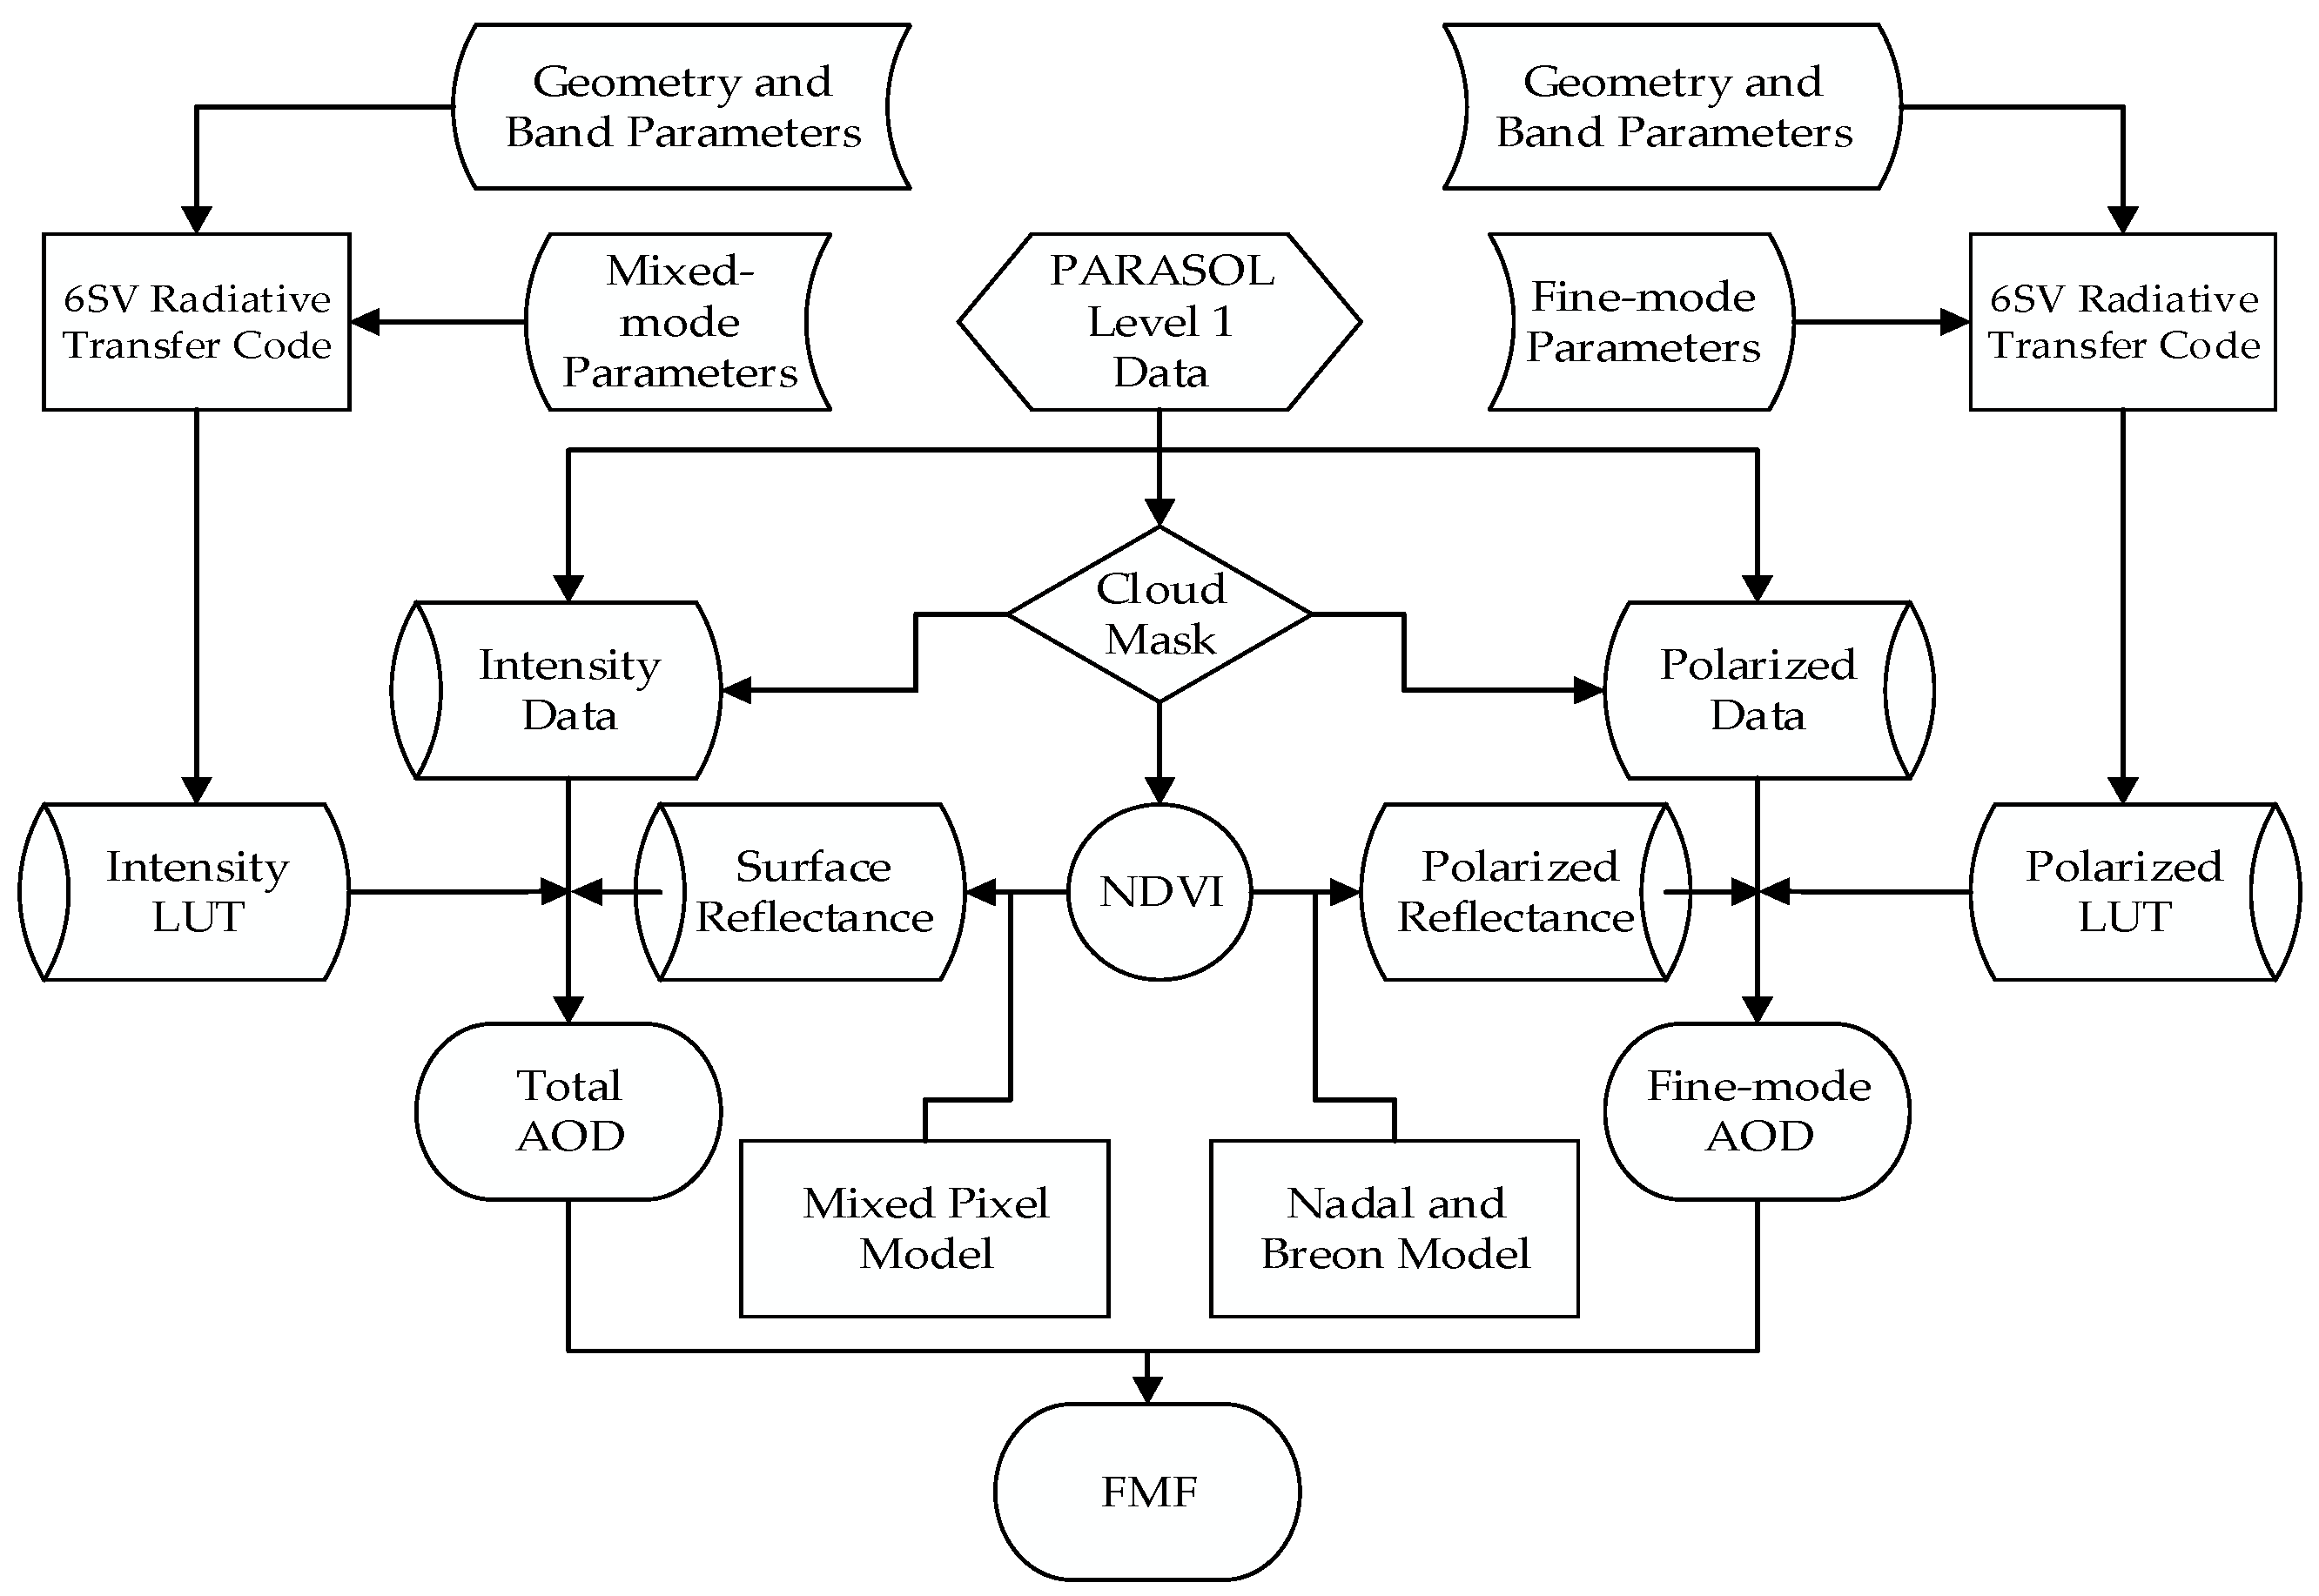
2.1. Retrieval Method

The key function of our method is the retrieval of the total AOD and fine-mode AOD based on intensity and polarization measurements, respectively, in order to calculate the FMF. Our method is divided into two parts, thereby differentiating our work from the study of Cheng et al. [17]. Cheng et al. assume that the TOA reflectance is composed of the contributions of the atmosphere and surface radiation and that the atmosphere reflectance is the weighted average of a pure fine- and coarse-mode with the same optical depth, such that the FMF can be determined by the minimum residual error between the calculated and the observed TOA reflectance.
In our study, for the intensity measurement, the TOA reflectance can be expressed as [18]
ρ T O A ( μ s μ v φ ) = ρ 0 ( μ s μ v φ ) + ρ s ( μ s μ v φ ) T ( μ s ) · T ( μ v ) [ 1 ρ s ( μ s μ v φ ) S ]
where the ρ T O A ( μ s ,   μ v ,   φ ) is the TOA reflectance; μ s  and  μ v are the cosine of the solar zenith angle and the view zenith angle, respectively; φ is the relative azimuth angle; ρ 0 ( μ s ,   μ v ,   φ ) is the equivalent reflectance of atmospheric path radiation; ρ s ( μ s ,   μ v ,   φ ) is the surface intensity reflectance; T ( μ s )  and  T ( μ v ) are the total transmittance parameters; and S is the atmospheric backscatter ratio. The terms ρ 0 ( μ s μ v φ ) , T ( μ s ) ,   T ( μ v ) and S are functions of the total AOD, which can be extracted from the radiative transfer code. This model can also be applied to many other satellite platforms besides MODIS, such as PARASOL and HJ-1 [19,20].
For the polarization measurement, the partially-polarized light is assumed to be linearly polarized, and the polarized radiance can be expressed as
L p o l = Q 2 + U 2
where L p o l is the polarized radiance, Q and U are the second and third Stokes parameter, respectively. The polarized radiance can be converted to polarized reflectance by
R p o l = π L p o l F 0 μ s
where R p o l is the polarized reflectance, F 0 is the mean value of solar-apparent emissivity. The TOA polarized reflectance can then be expressed as [9]
R p o l T O A = R p o l a t m + R p o l s u r f · e ( M τ m M c τ a )
where R p o l T O A is the TOA polarized reflectance, R p o l a t m is the atmospheric contribution, which consists of two parts, the aerosols and the atmospheric molecules, and can be calculated by the radiative transfer code. R p o l s u r f is the surface polarized reflectance, M is the air mass, τ m is the molecular optical depth, τ a is the fine-mode AOD, and c accounts for the large forward scattering of the aerosol. We set c = 0.5 in our study according to the study of Deuze et al. [9].
The TOA radiation signal can be regarded as the combined contribution of the atmosphere and surface, regardless of the intensity or polarized measurements. Thus, we use Equations (2) and (5) to retrieve the total AOD and fine-mode AOD, respectively, and the main method used for the aerosol retrieval from the satellite data involves estimating the surface reflectance and constructing a lookup table, which is mainly determined by the aerosol model to ascertain the AOD that corresponds with the atmospheric contribution. The estimation method of the surface intensity and polarized reflectance is stated in Section 2.2, and detailed aerosol model parameters are presented in Section 2.3.
Unlike single-angle observations, the greatest advantage of multi-angular remote sensing is the ability to select an optimal aerosol model according to the variations in the aerosol scattering characteristics of different angles. This is a process that accumulates residual error between the calculated and observed radiation signal of the multi-angular data. According Deuzé et al., the method of determining the optimal aerosol model for polarized measurement can be expressed as [9]
η p o l = 1 2 N λ 0 λ 1 j [ R p c a l ( λ , Θ j ) R p m e a s ( λ , Θ j ) ] 2
where η p o l is the residual error of the polarized measurement; N is the number of observation angles; R p c a l is the calculated polarized reflectance, which corresponds to the aerosol model and the observation angle; R p m e a s is the polarized reflectance of corresponding observation angle received by the satellite; and λ 0  and  λ 1 are the 670 nm and 865 nm bands, respectively, on PARASOL. Equation (6) is related to Equation (5). Therefore, there are several sets of aerosol models and AODs pending determination at the end of the fine-mode AOD retrieval process, and the lowest η p o l distinguishes the optimal aerosol model and AOD.
For the intensity measurement, the method to determine the optimal aerosol model in our study is similar to the polarized measurement. The only modification involves changing the polarized reflectance into intensity reflectance, ρ T O A ( λ , Θ j ) , as follows:
η i n t = 1 2 N λ 0 λ 1 j [ ρ T O A c a l ( λ , Θ j ) ρ T O A m e a s ( λ , Θ j ) ] 2
This equation is related to Equation (2). Finally, the FMF can be calculated as the ratio of the retrieved fine-mode AOD to the total AOD for the corresponding optimal aerosol model.

2.2. The Estimation of Surface Intensity and Polarized Reflectance

According to Equations (2) and (5), underestimation of the surface intensity and polarized reflectance will lead to overestimation of the AOD and vice versa. Thus, the estimation of the surface intensity and polarized reflectance is one of the key steps in the AOD retrieval. The DDV method is a classic algorithm for estimating the surface reflectance. The main idea of the DDV method is that the surface reflectance in band 1 (0.62–0.67 μm) and band 3 (0.46–0.48 μm) of MODIS are linearly correlated with the TOA reflectance in band 7 (2.10–2.15 μm) for dense vegetation areas and dark soil areas ( ρ 2.1 μ m T O A < 0.25 ) and that band 7 is less susceptible to the effects of atmospheric aerosols [3,4]. However, there is no 2.1 μm band for PARASOL. Therefore, one cannot use this classic method to estimate surface reflectance.
In our study, the surface intensity reflectance is estimated for PARASOL by using the semi-empirical surface reflectance model [21]. This model assumes that the reflectance of a mixed pixel is made up of green vegetation and bare soil and uses the NDVI in the estimation as follows:
N D V I = ρ n i r ρ r e d ρ n i r + ρ r e d
ρ S u r f M i x i n g ( λ ) = ω · ( N D V I · ρ V e g ( λ ) + ( 1 N D V I ) · ρ S o i l ( λ ) )
where ρ n i r is the reflectance of the near-infrared band; ρ r e d is the reflectance of the red band; ρ S u r f M i x i n g ( λ ) is the surface reflectance of the mixed pixel, which corresponds to the wavelength; ρ V e g ( λ ) and ρ S o i l ( λ ) are the spectral reflectances of the green vegetation and bare soil, which can be obtained from the spectrum library; and ω is the empirical weighting factor. The two equations correspond to the term ρ s ( μ s ,   μ v ,   φ ) in Equation (2).
The surface polarized reflectance can be estimated by using the semi-empirical model introduced by Nadal and Breon, assuming that it does not vary with wavelength [22]:
R p o l s u r f = ρ · [ 1 e ( β F p ( α ) μ s + μ v ) ]
where R p o l s u r f is the surface polarized reflectance, F p ( α ) is the Fresnel scattering coefficient, and ρ and β are empirical weighting factors that can be determined by the surface type and NDVI (Table 2). This equation defines the term R p o l s u r f in Equation (5). The surface type can be obtained from the MODIS land cover type products.

2.3. Aerosol Model

Because atmospheric radiation in the intensity signal comprises the contributions of fine and coarse particles, the fine- and coarse-mode parameters should be included in the aerosol model when building the lookup table for intensity measurements. The polarized measurements are used for the fine-mode AOD retrieval in this study. Because we now suppose that the polarized radiation signal received by the satellite only includes the contribution of fine particles [9,10], the aerosol polarized reflectance in the lookup table should be determined completely by the fine-mode parameters. This is the part as the process in which the polarized measurement is different from the intensity measurement.
By measuring the light of the sun and sky, a series of aerosol optical properties, such as the particle size distribution and complex refractive index, can be obtained through ground-based observations [23,24,25]. These parameters are important for determining the aerosol model and building the lookup table. Therefore, numerous studies use ground-based data in their work.
In our study, we use previous synthetic research results for the settings of the aerosol models for the intensity measurements [26,27]. The aerosol models used in the study of Li et al. [27] have shown good application results in Northern China, which is an area of concern. The models in the study of Lee and Kim [26] also show good application results over East Asia. Thus, we incorporate their results into our study. Their work also shows that the aerosol models exhibit a bimodal log-normal size distribution, as follows [28]:
d N d r = N 0 , C o a r s e 2 π σ n , C o a r s e e x p [ ( l n r l n r n , C o a r s e ) 2 2 ( σ n , C o a r s e ) 2 ] + N 0 , F i n e 2 π σ n , F i n e e x p [ ( l n r l n r n , F i n e ) 2 2 ( σ n , F i n e ) 2 ]
where N 0 is the number of particles per cross section of the atmospheric column, r n is the modal radius, σ n is the standard deviation of l n r n , and Coarse and Fine refer to the coarse- and fine-mode, respectively.
In the study by Lee and Kim, the aerosol models are volume particle size distribution. However, in the study of Li et al., the aerosol models are number particle size distributions. In our study, we unify them into a number particle size distribution using [29]
r n = r v exp ( 3 σ 2 )
V 0 = 4 N 0 π 3 r n 3 exp ( 9 σ 2 2 )
where r n is the modal radius of the number distribution, r v is the volume modal radius, σ is the standard deviation of the natural logarithm of the radius for the volume distribution, and V 0 is the column volume of the particles per cross section of atmospheric column.
The aerosol model parameters used for the intensity measurements are presented in Table 3.
For polarized measurements, because the official fine-mode AOD retrieval algorithm over land of PARASOL exhibits the necessary application results [11,12], we use the fine-mode parameters directly [10].

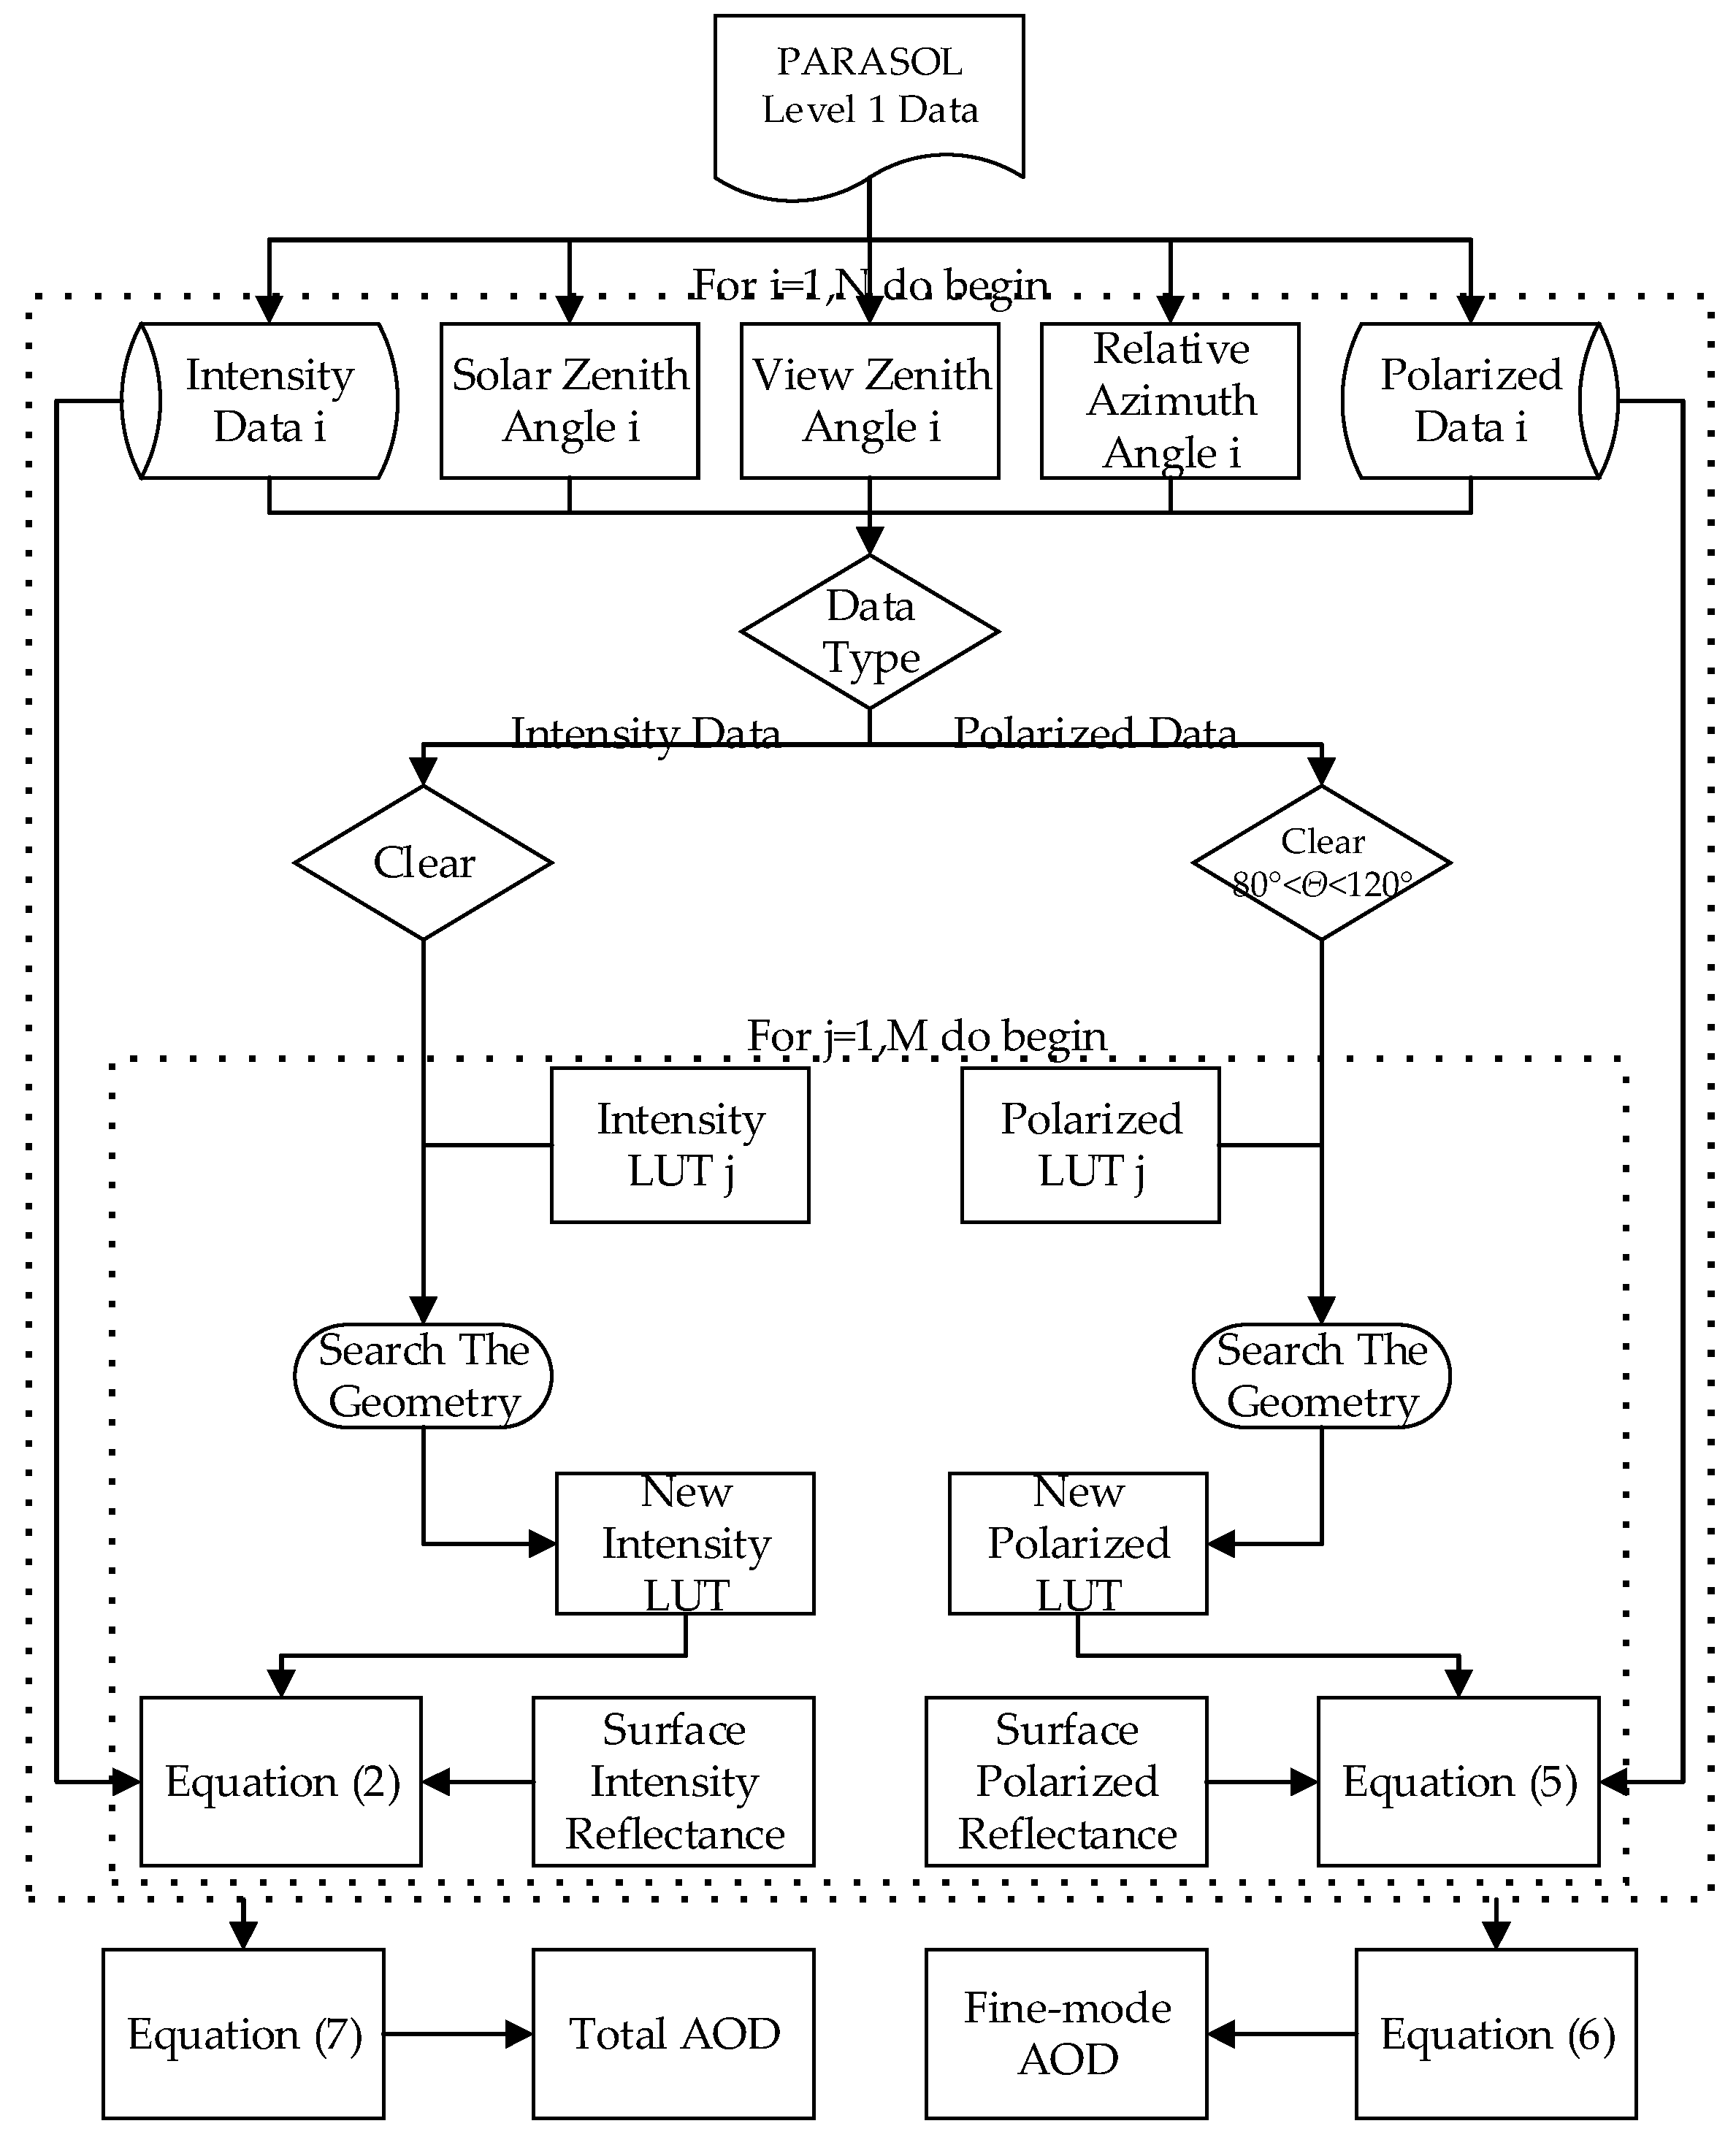
2.4. Data Processing

To run the 6SV code, in addition to the aerosol model parameters, other lookup table parameters, such as observation geometry and wavelength parameters, are also needed, and these parameters are presented in Table 4.
The total and fine-mode AOD retrieval flow chart is presented in Figure 2.
For the retrieval of total AOD, according to the established lookup table of the AOD retrieval, we obtain the observation geometry parameters of the pixels from the satellite data files and then obtain the corresponding values that were close to (or equal to) the values in the lookup table. We then input the atmospheric parameters that correspond to the geometry parameters into Equation (2) to obtain the two closest sets of the atmospheric parameters and AOD values. Then, we perform a linear interpolation of the atmospheric parameters according to the AOD and put these new parameters into Equation (2) again to perform a comparison with the TOA reflectance. We derive the AOD whose calculated TOA reflectance is closest to the observed TOA reflectance and define it as the AOD that corresponds to the observation angle of the pixel. By repeating the above process, we invert the AOD of all the clear pixels of the multi-angle and multi-aerosol models. Finally, we use Equation (7) to determine the optimal aerosol model of each pixel and average the AOD for the multiple angles that correspond to the optimal aerosol model. Consequently, the averaged AOD of all the available angles is the final retrieval result.
For the retrieval of fine-mode AOD, in the range 80° < Θ < 120° (where Θ is the scattering angle), the polarized signals given by the coarse-mode aerosols are negligible [9]. We thus assume that these signals only come from fine particles. We only employ the data with scattering angles that are in that range. The other retrieval workflows are similar to the total AOD retrieval processes.
Finally, after the fine-mode AOD and total AOD have been retrieved, the ratio of the two is the required FMF. The spatial resolution of the retrieval results is the same as the original PARASOL data (6 km at nadir).
For the validation portion of the retrieval result, because the AERONET-measured AOD has a high accuracy of 0.01 in the visible and near-infrared bands [30], we employ the AERONET ground-based data, which includes the Beijing (39.977°N, 116.381°E), Xianghe (39.754°N, 116.962°E), Seoul_SNU (37.458°N, 126.951°E), and Osaka sites (34.651°N, 135.591°E) for comparison with the retrieval results of East Asia over the entire annual cycle of 2012. These ground-based sites have a long time series of observation data and are run stably, thereby guaranteeing the quality of the validation data. The number of the validations is only 30–40 per site because some of the PARASOL data were affected by the cloud cover (especially the Osaka and Seoul_SNU sites), some time periods are missing from the AERONET data (especially Beijing and Xianghe sites) in 2012, and the revisit cycle of PARASOL is two days. The temporal and spatial threshold of the validation is ±30 min and 25 km, respectively [11], and we use the equation below to convert the ground-based AOD to the data at the corresponding wavelength [31]:
τ ( λ ) = τ ( λ 0 ) · ( λ 0 λ ) α
where λ is the wavelength, τ ( λ ) is the AOD of the corresponding wavelength, and α is the Angstrom exponent.
The FMF validation data are the result of the Spectral Deconvolution Algorithm (SDA) method [32,33], which is consistent with the results from Dubovik and King [23,34]. However, this method may have some retrieval bias that is caused by the cirrus clouds [35].

3. Results and Validation

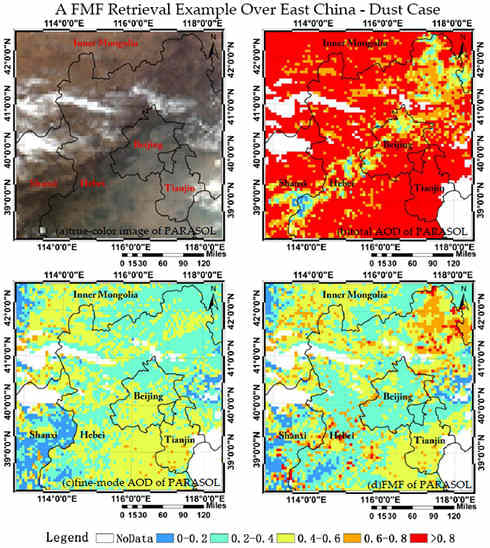
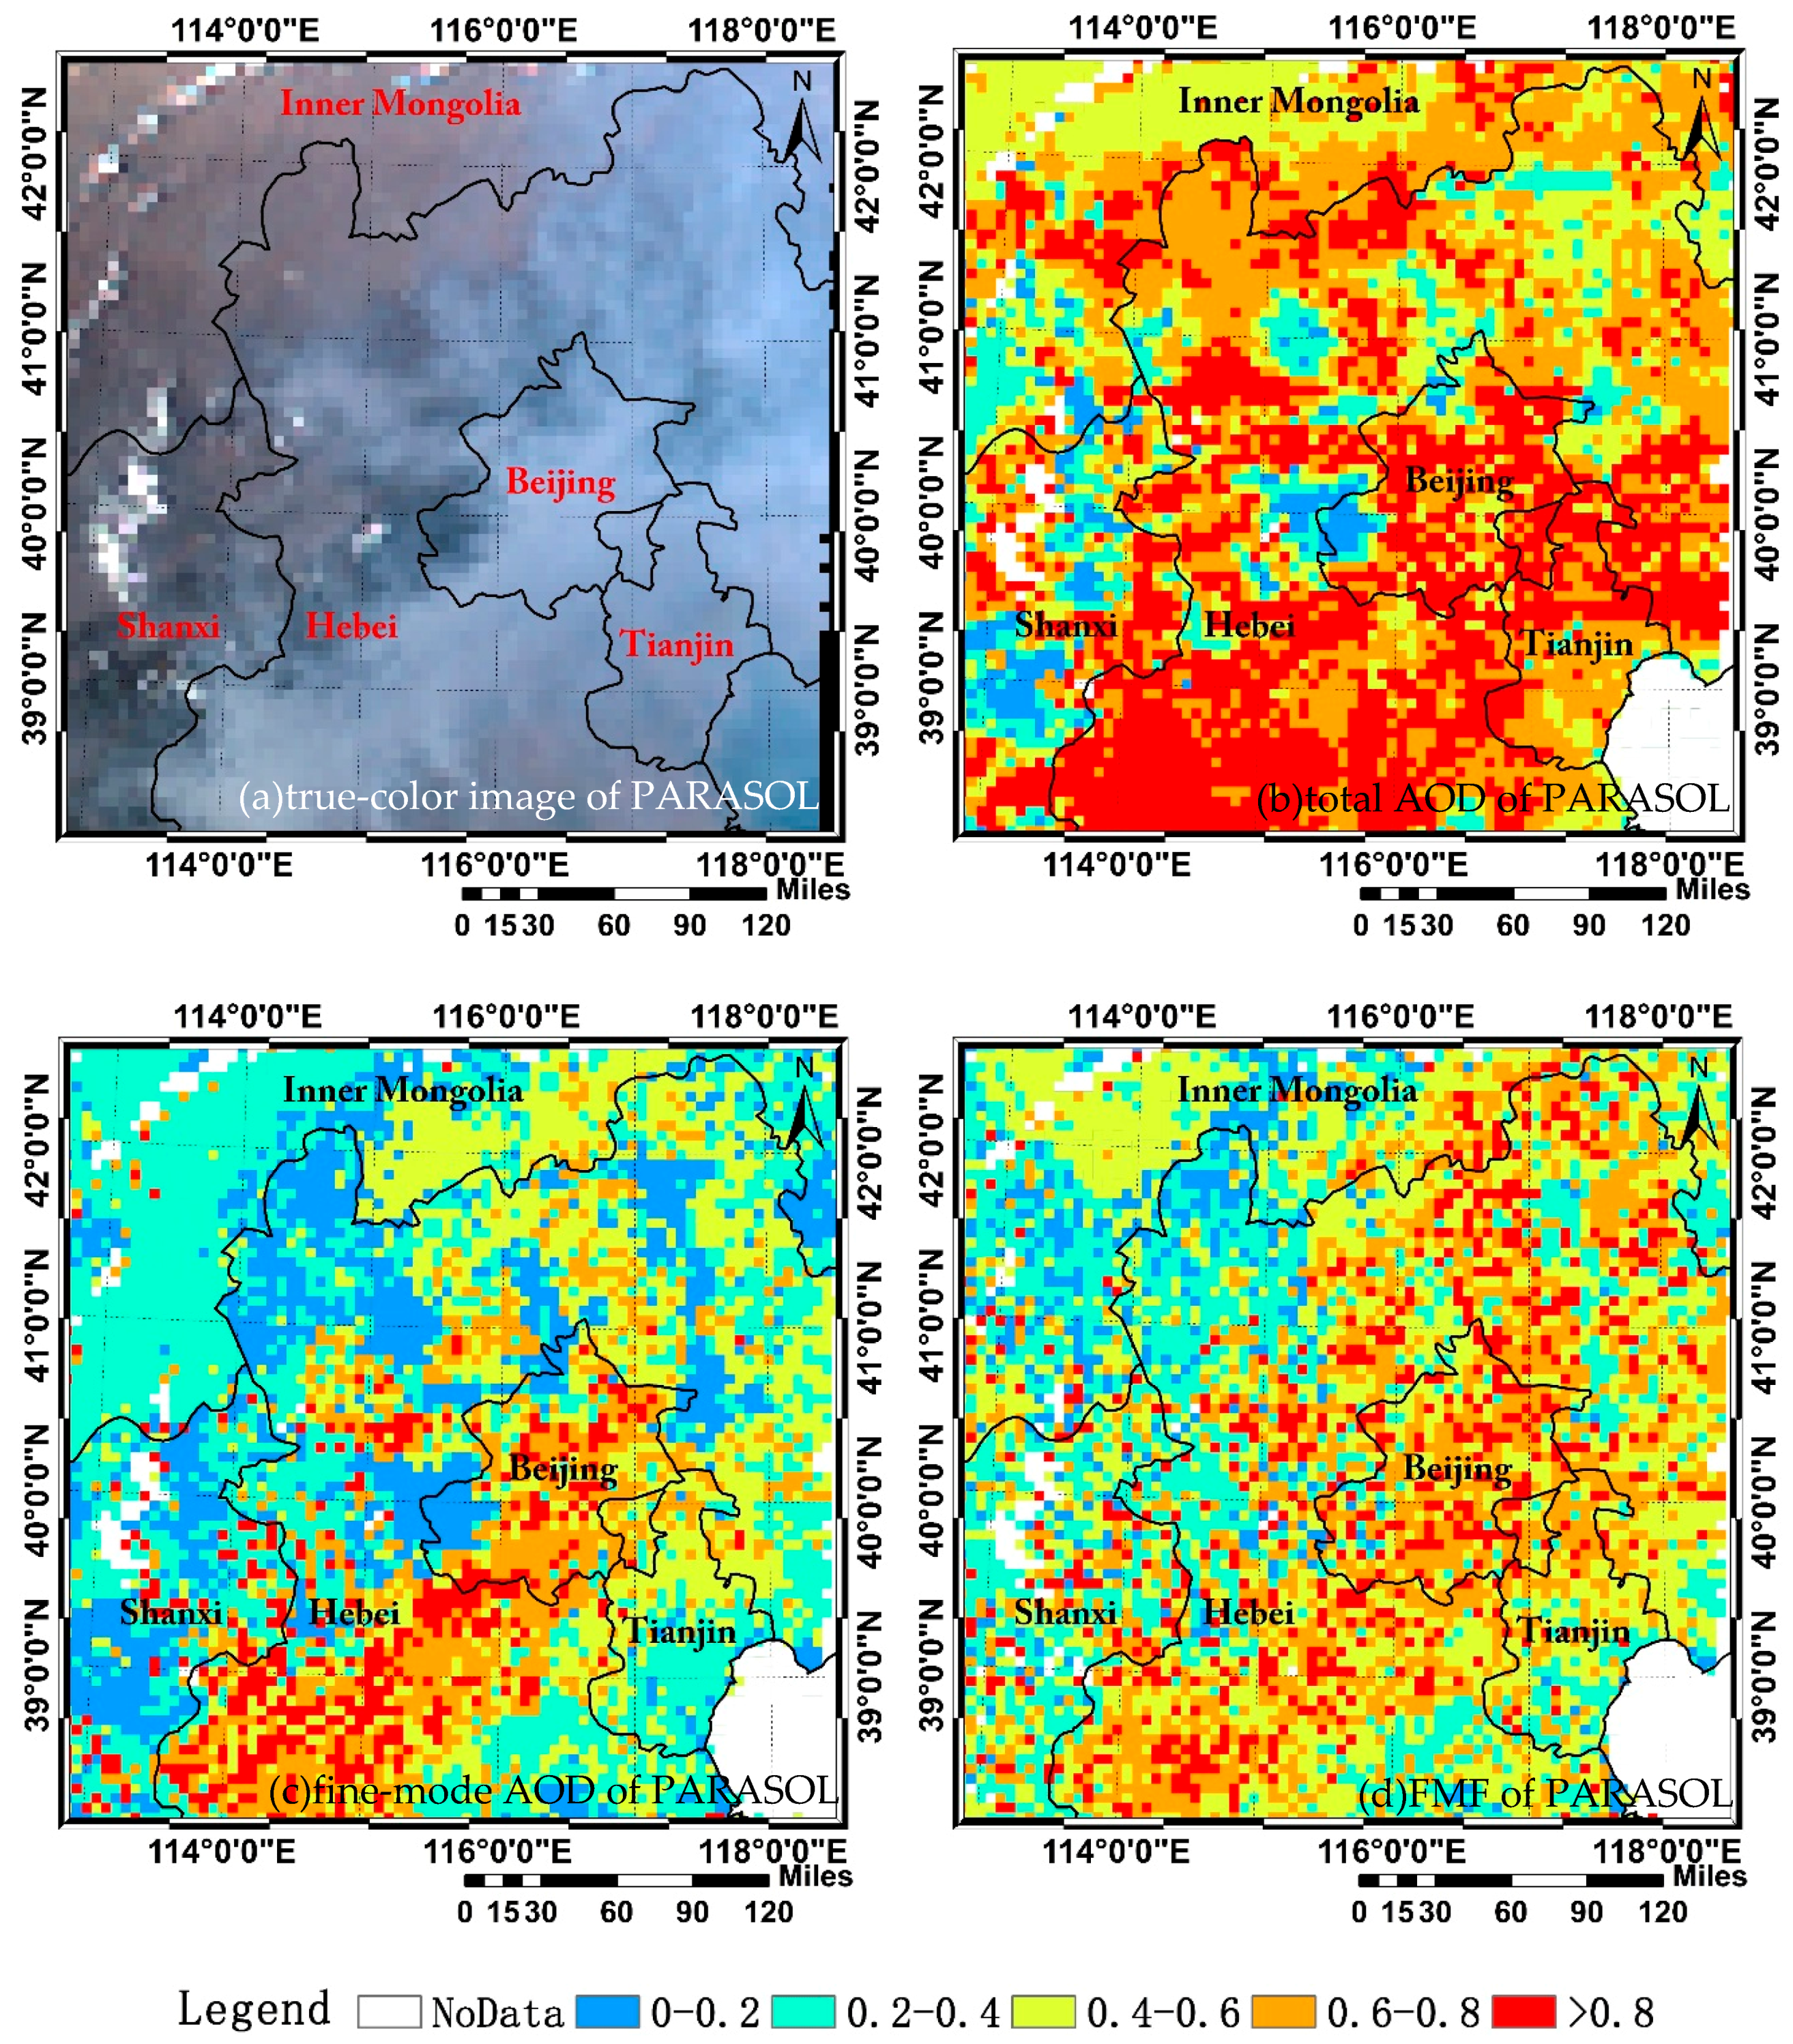
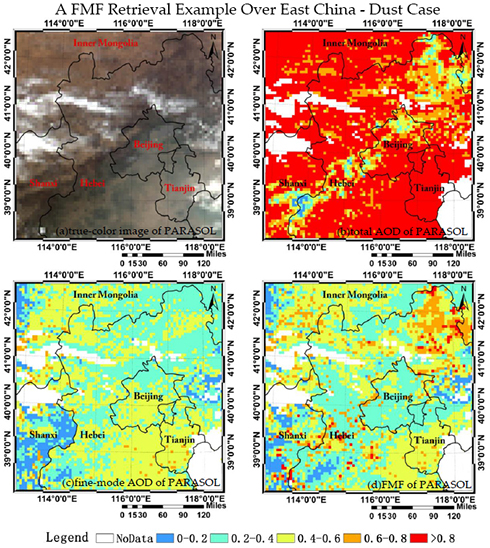
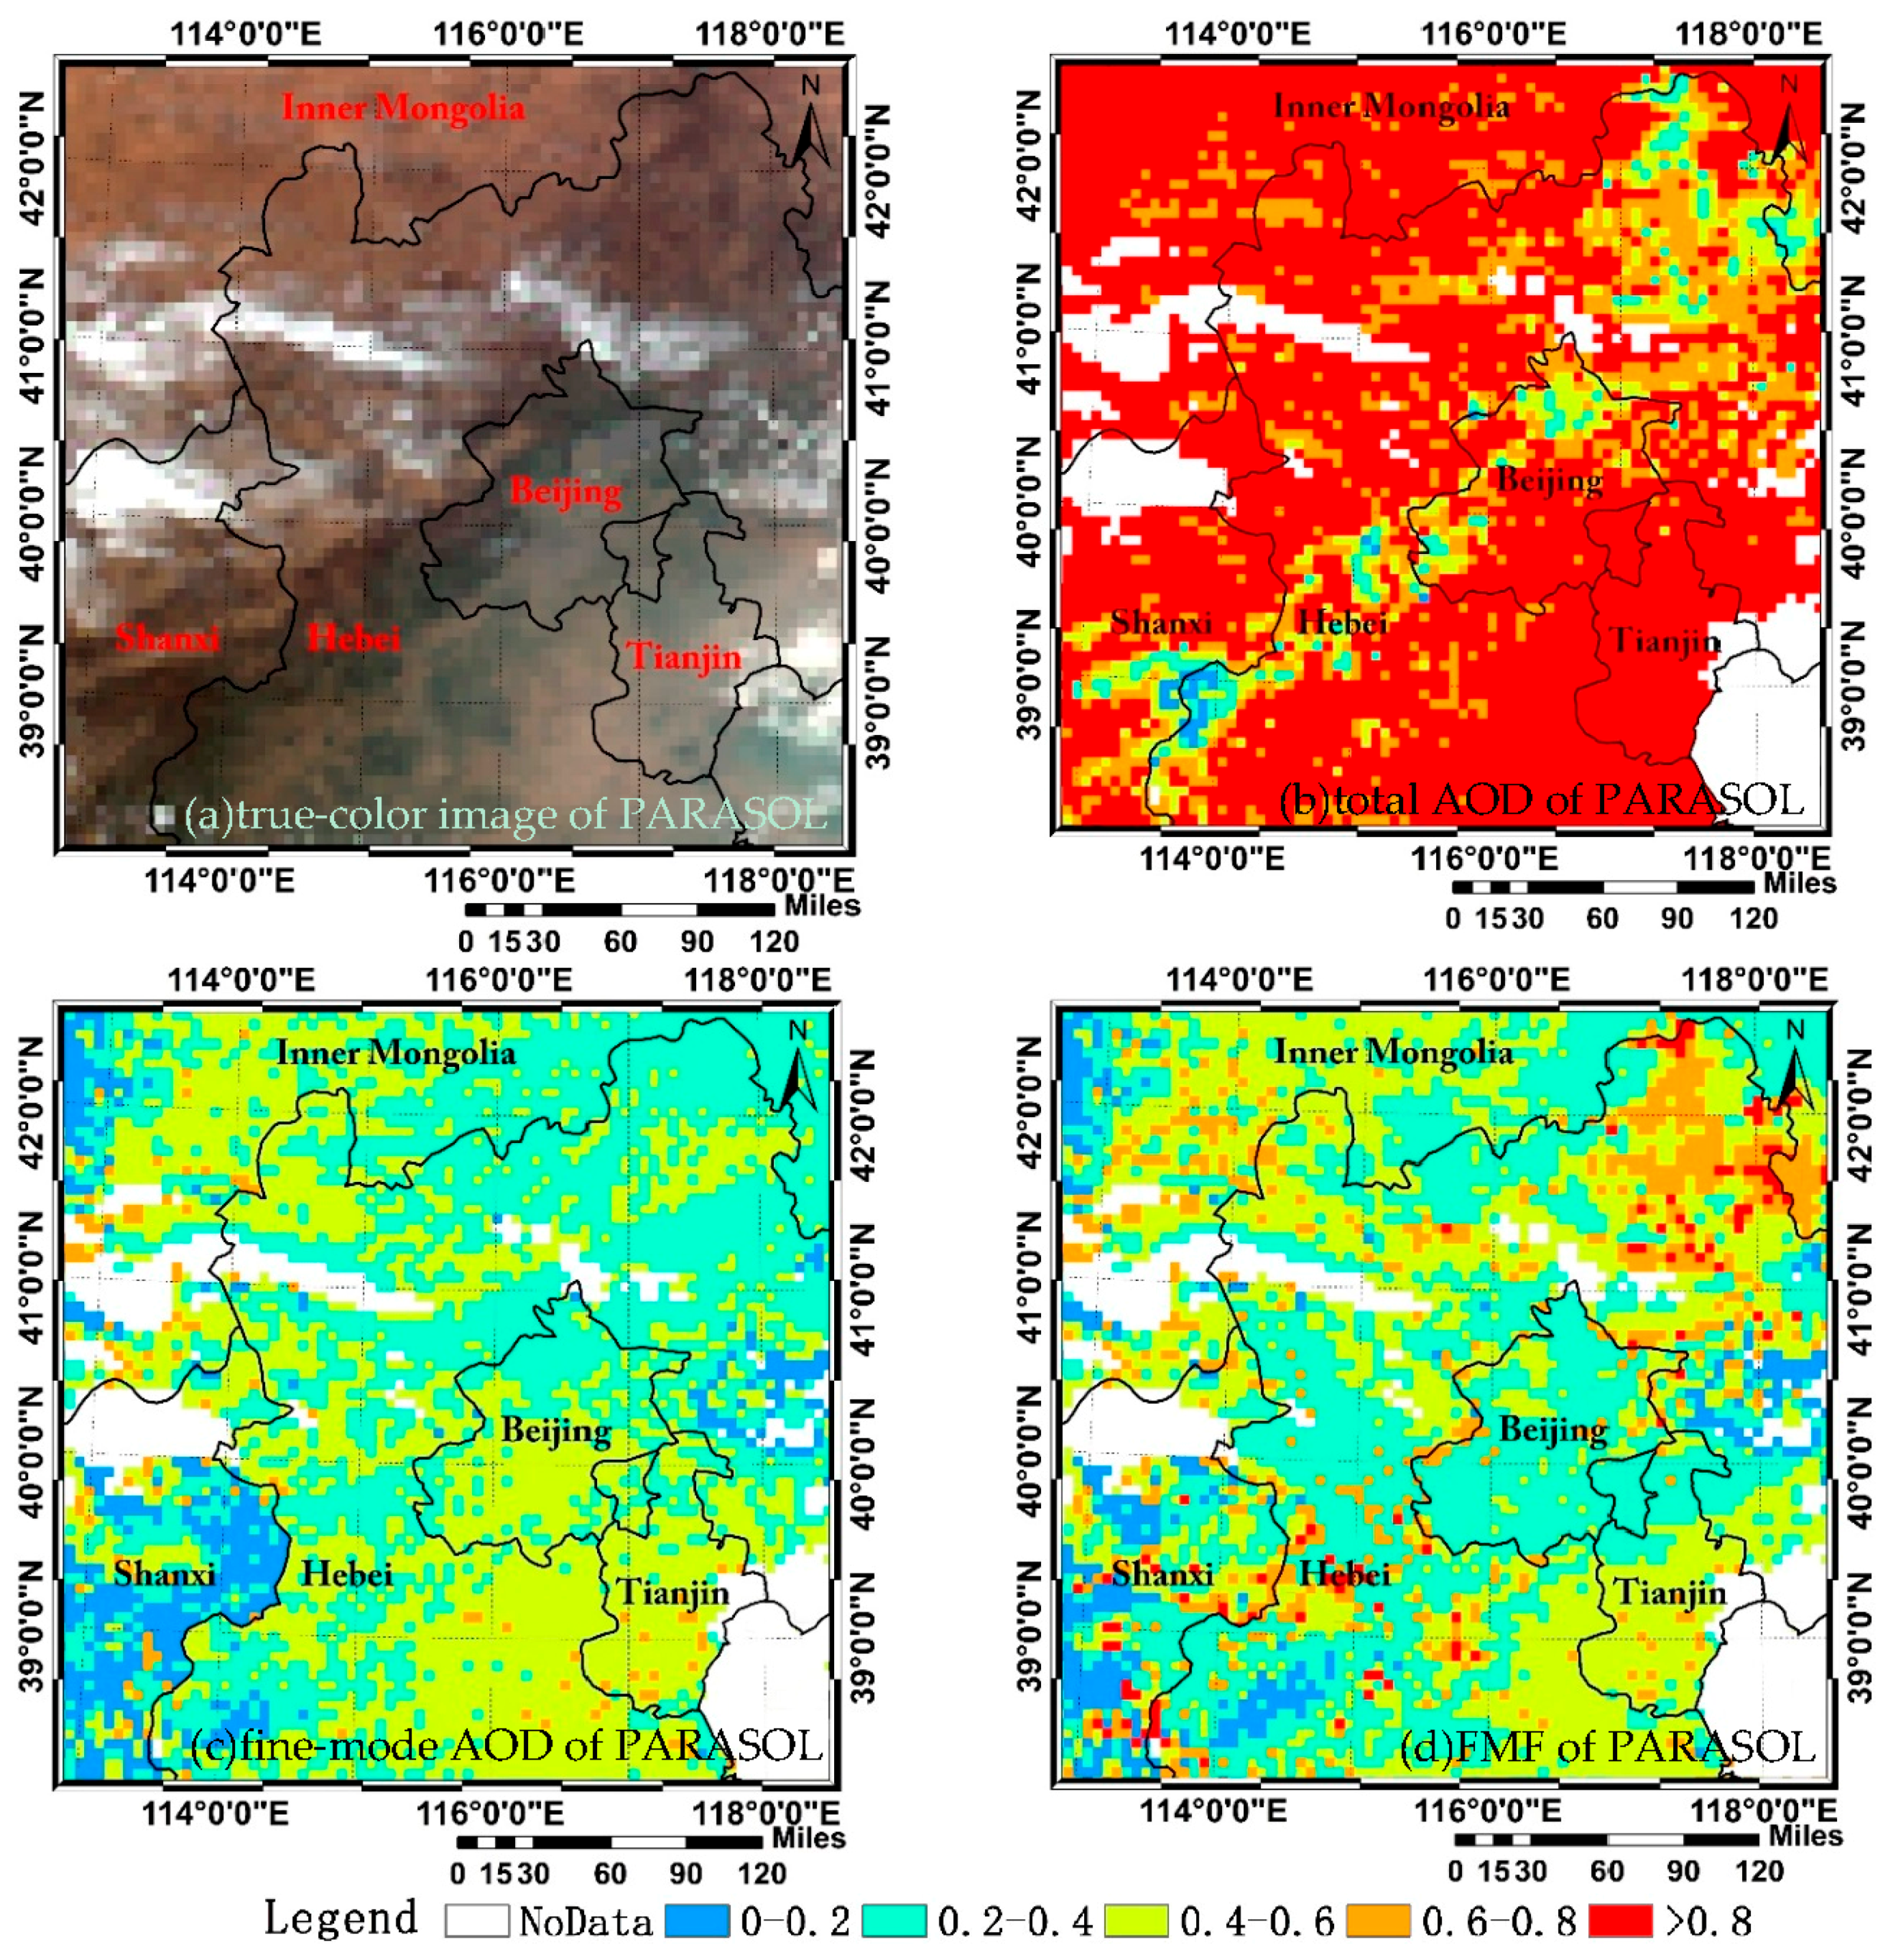
3.1. Case Study over North China

We use cases over North China to evaluate the performance of our method. From Figure 3, most areas are covered with aerosols in the true-color image taken on 28 April 2012. The values of total AOD are mostly greater than 0.8. However, the values of the fine-mode AOD in most areas range from 0.2 to 0.6. The values of FMF in most areas are less than 0.4, which represents the dominance of coarse-mode aerosols.
From Figure 4, most areas are covered with aerosols in the true-color image taken on 5 October 2013. The air quality was very poor that day, and the PM2.5 concentrations at 9:00 AM had reached 272 μg/m3. The values of the total AOD are greater than 0.6 and in most regions are over 0.8. Meanwhile, the values of the fine-mode AOD increase as the AOD increases. The values of FMF in most areas of Beijing, Tianjin, and Hebei are greater than 0.8, which represents the dominance of the fine-mode aerosols.

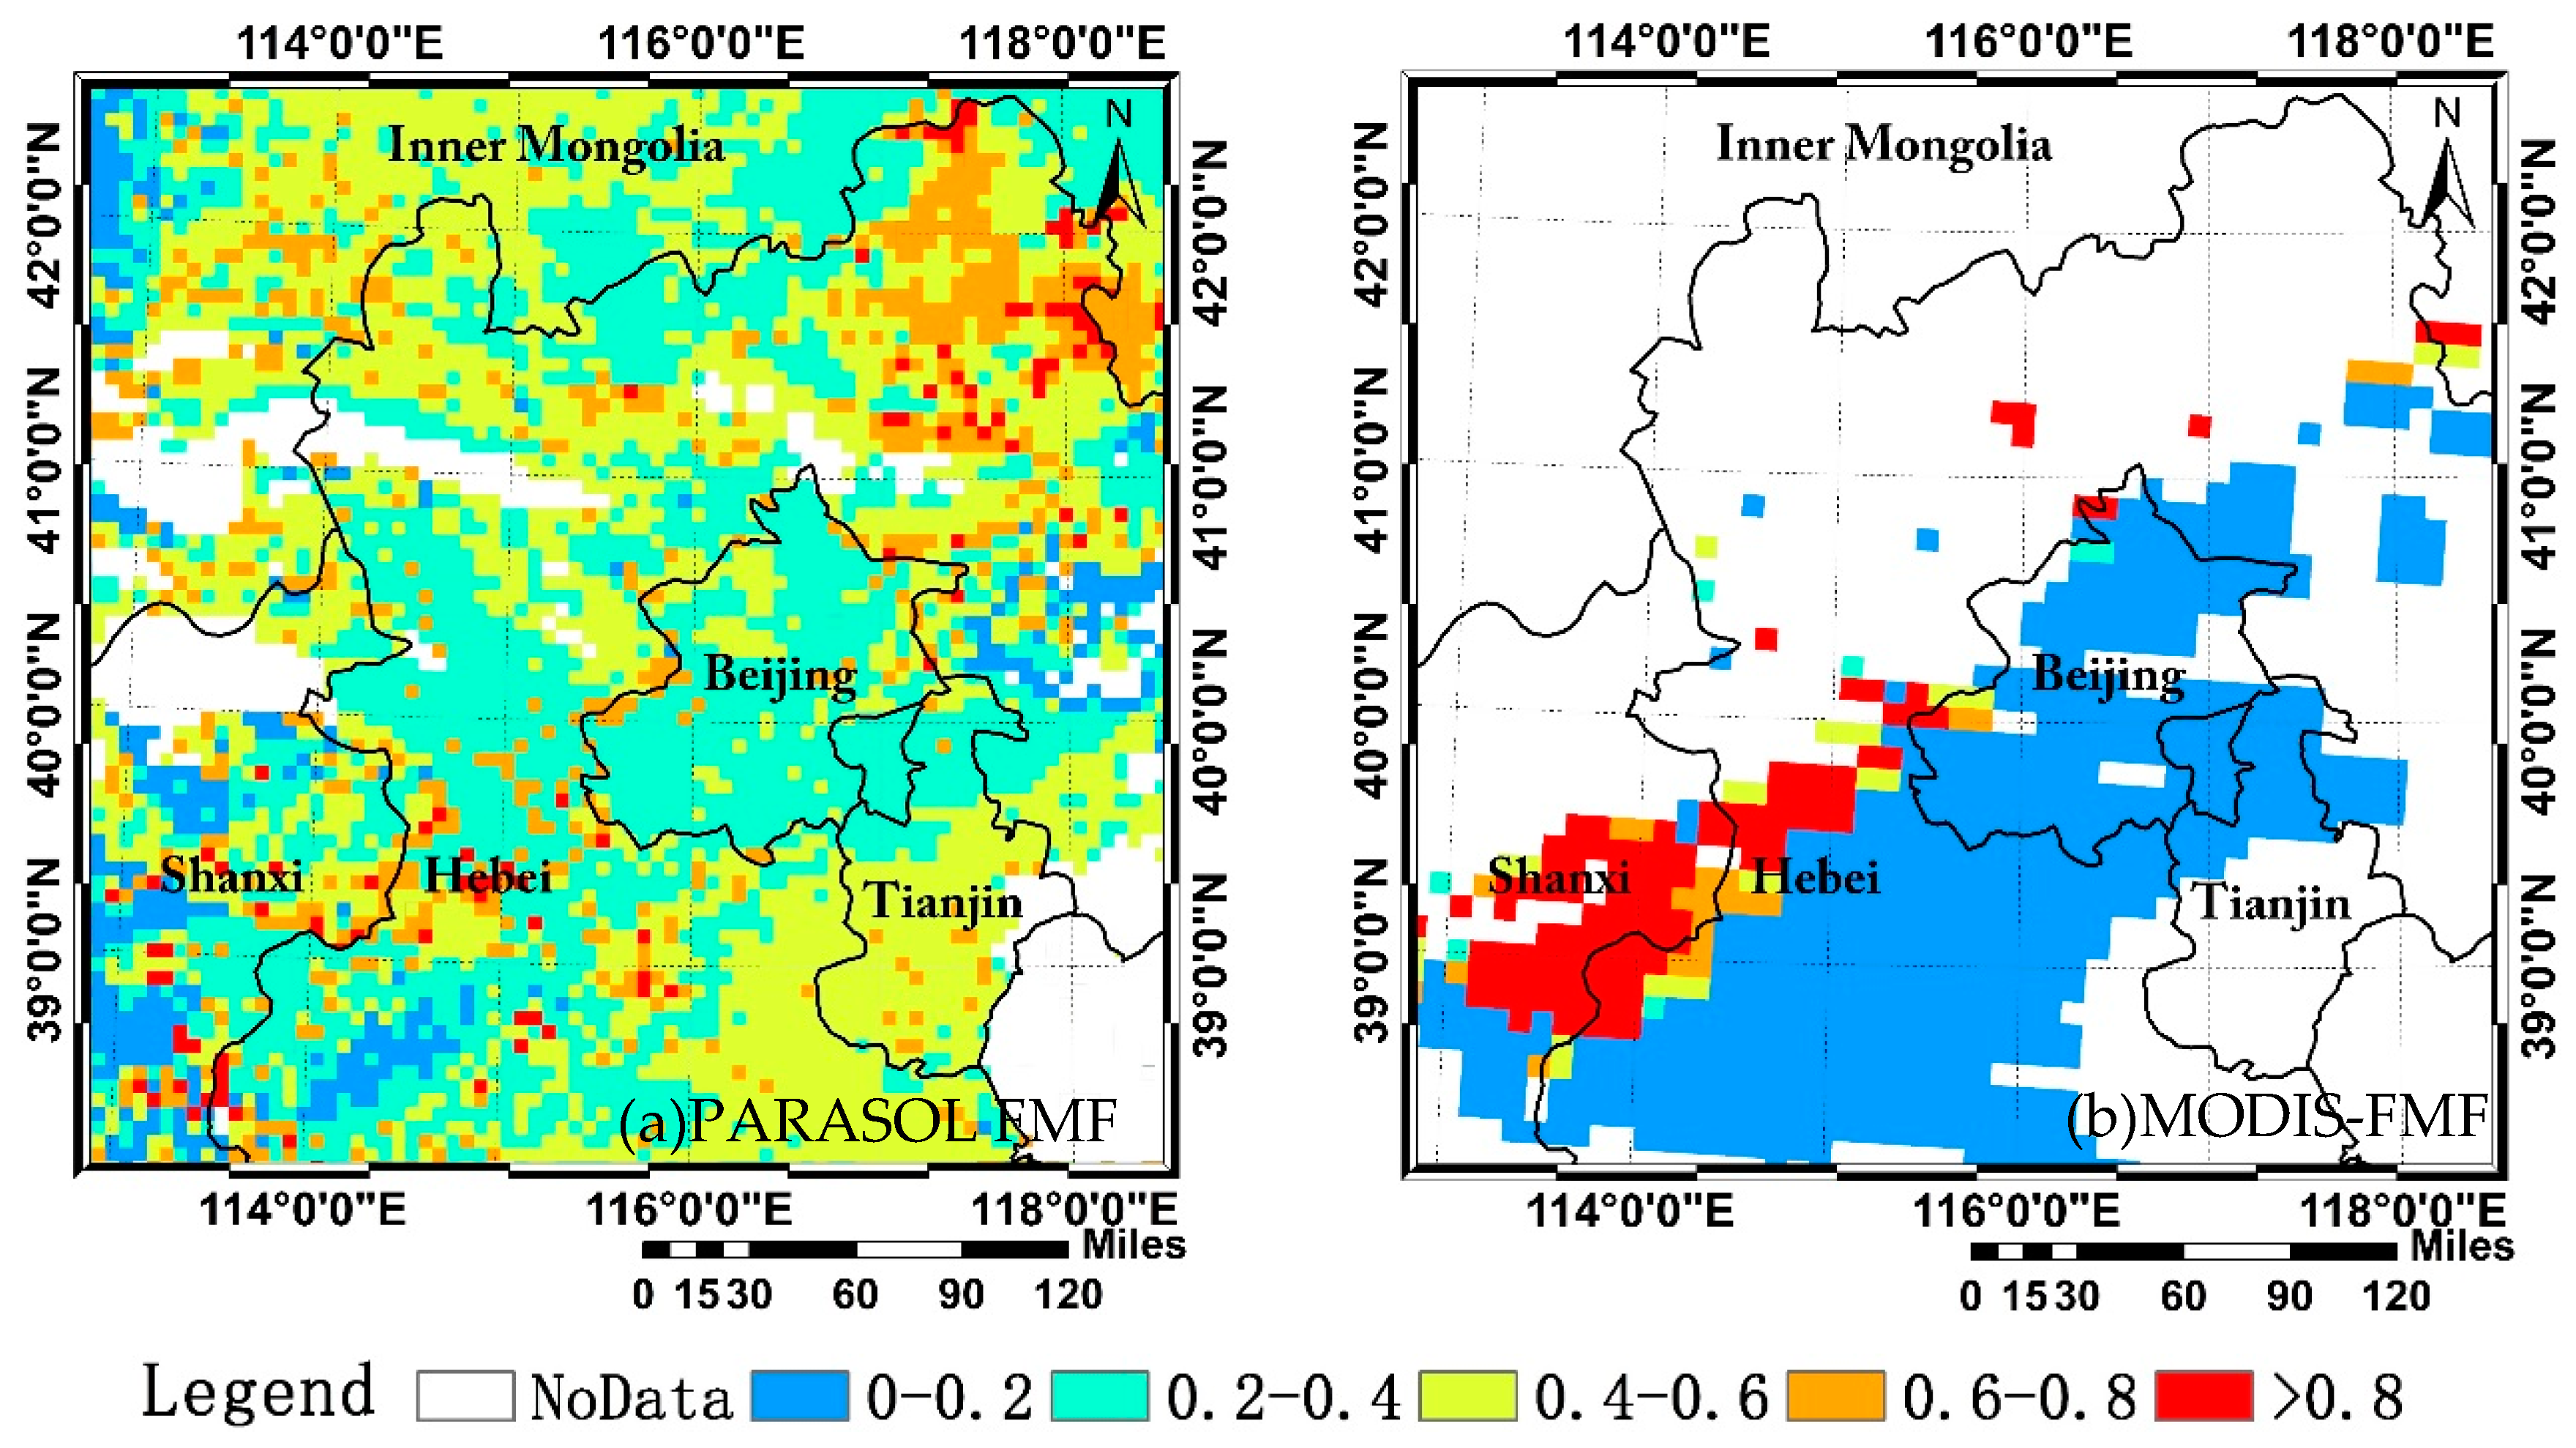
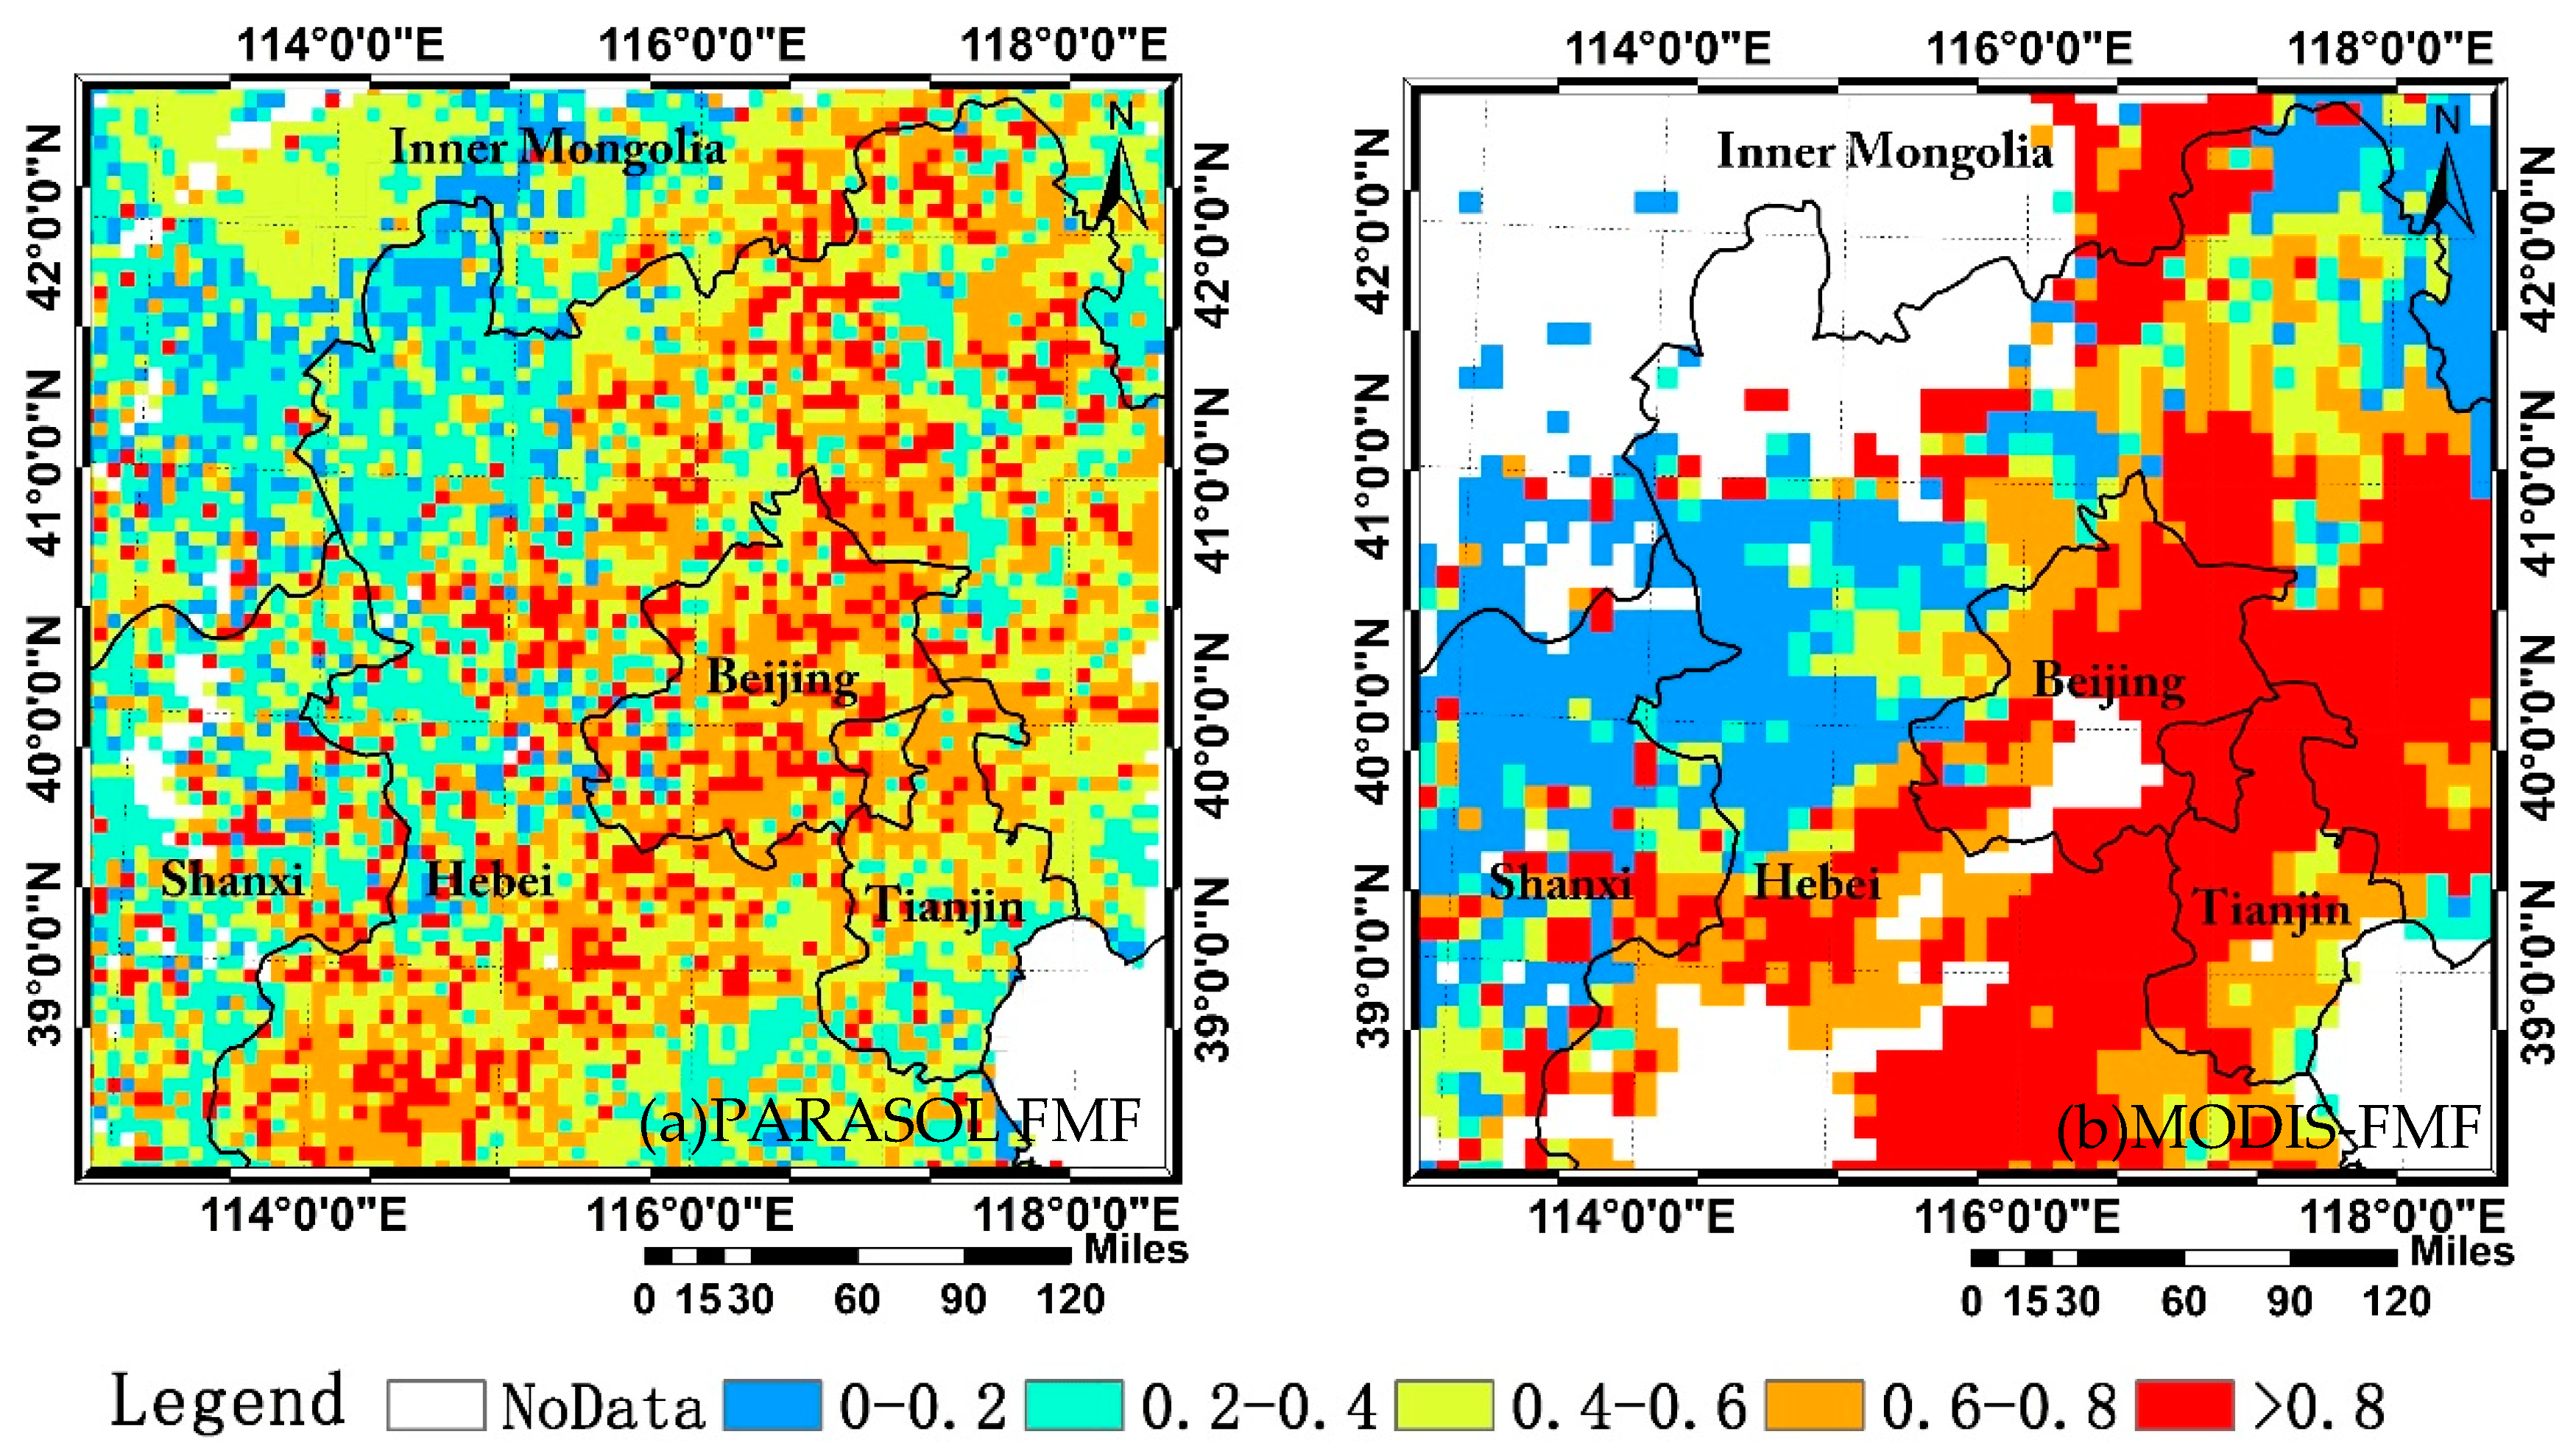
3.2. The Comparison of the FMF Retrieval Results with MODIS

We also compared the FMF retrieved using our method with the MODIS FMF product. The FMF retrieval algorithm of MODIS assumes that the TOA reflectance is the weighted sum of the spectral reflectance from a combination of fine- and coarse-dominated aerosol models and that the retrieved FMFs are discrete values from 0.0 to 1.0 (with an interval of 0.1). However, the MODIS FMF product shows a low correlation with the AERONET FMF product [36], and MODIS finds this parameter difficult to retrieve over land [8]. The spatial resolution of the MODIS FMF product used in this study is 10 km.
Figure 5 shows the comparison of the dust case. The retrieved FMF of our method provides much more detail than those from MODIS, and the retrieved extent is also wider than that of MODIS. The reason for the low retrieval extent in MODIS is mainly because of the applicability of the DDV method. However, the FMF values of the MODIS product are quite different than our result. As a result of the MODIS FMF value being discrete, most values are equal to 0.0, which means that there are no fine-mode particles. However, in our results, the FMF values in the same area as that of the MODIS data mainly range from 0.2–0.4. According to the AERONET measurement data, the FMF values in Beijing and Xianghe site are 0.225 and 0.227, respectively. The corresponding MODIS results are both 0.0, whereas the corresponding results of our method are 0.286 and 0.277, which are considerably better than the MODIS results.
Figure 6 shows the comparison of an urban haze case. The two FMF retrieval results have some of the same spatial distribution features. However, some differences remain. Most FMF values are equal to 0.0 and 1.0 in the MODIS results. However, our results provide more precise values. The AERONET FMF results of the Beijing_RADI and Xianghe sites on 5 October 2013 are 0.763 and 0.918, respectively. The corresponding MODIS results are both 1.0, but the corresponding results of our method are 0.722 and 0.927, respectively, which are very close to the ground-based measurement data results and better than the MODIS results. In addition, the extent of the retrieved FMF of our method is larger than that of MODIS.
Figure 7 shows the comparisons between the two retrieved FMF results and the AERONET FMF results for the Beijing and Xianghe sites in 2012. Because of the limitations of the DDV method, there are nearly no MODIS FMF data available in winter over North China, resulting in a total of only 42 validation points. The comparison of the retrieved PARASOL FMF with AERONET ground-based data produces a high correlation R2 of 0.854. However, the comparison of the MODIS FMF and AERONET measurements only produces a R2 of 0.418, and many MODIS FMFs in the comparison are equal to 0.0, which suggests that the MODIS FMF has a lower correlation with the AERONET FMF.
As shown in Figure 7, MODIS FMFs are constant values from 0.0 to 1.0, but the AERONET and our FMFs are continuous. Additionally, there is almost no similarity between our FMFs and the MODIS FMFs. A related study has revealed that the MODIS FMF is not recommended for PM2.5 retrieval [37], and the scatterplot shows a high R2 between the AERONET FMFs and our FMFs, which suggests that our results are comparable to the AERONET FMFs and that our method could provide a new way to retrieve FMFs. Thus, our method has the potential for application in atmospheric environmental studies.

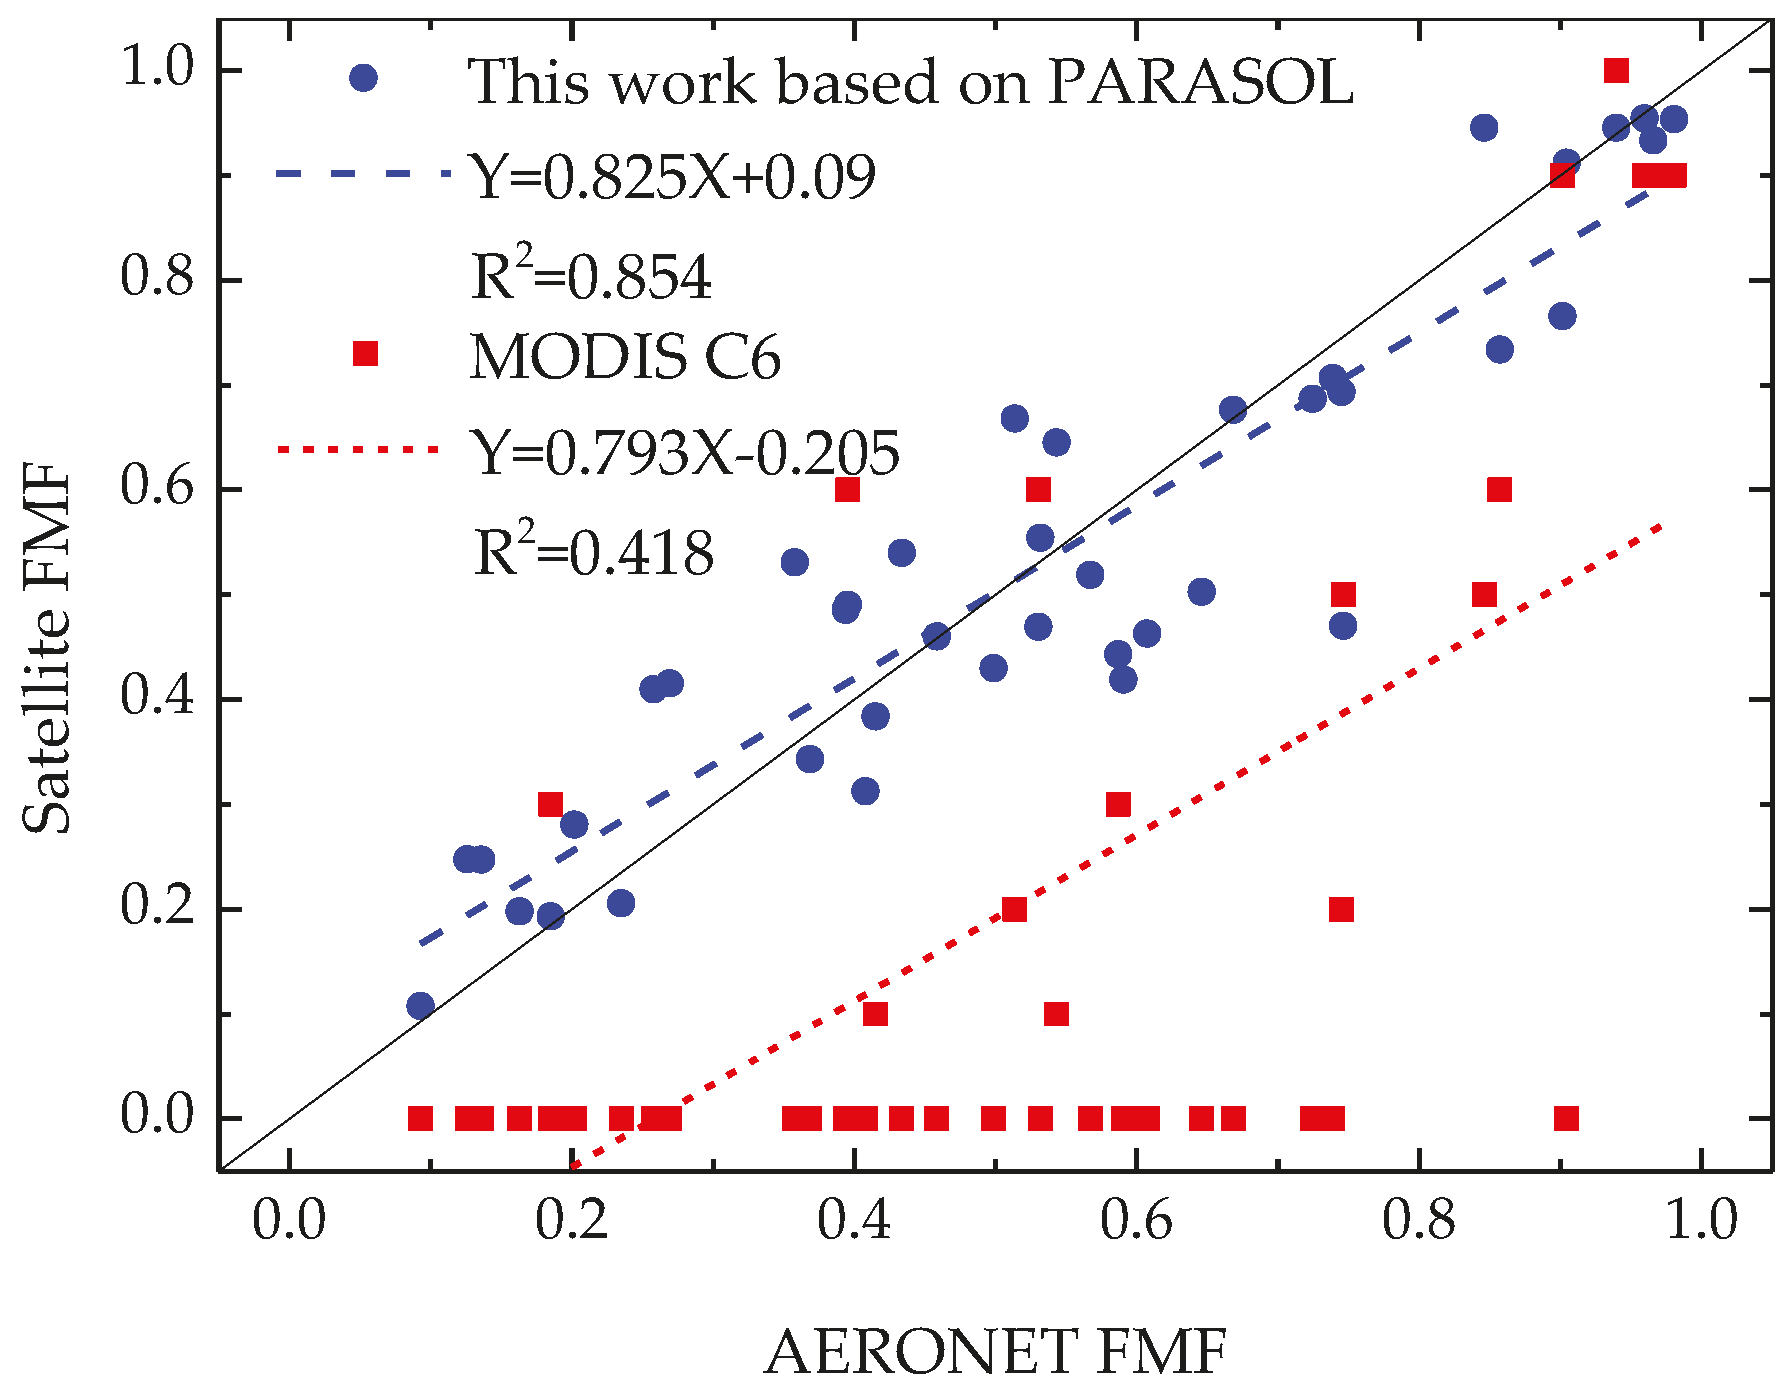
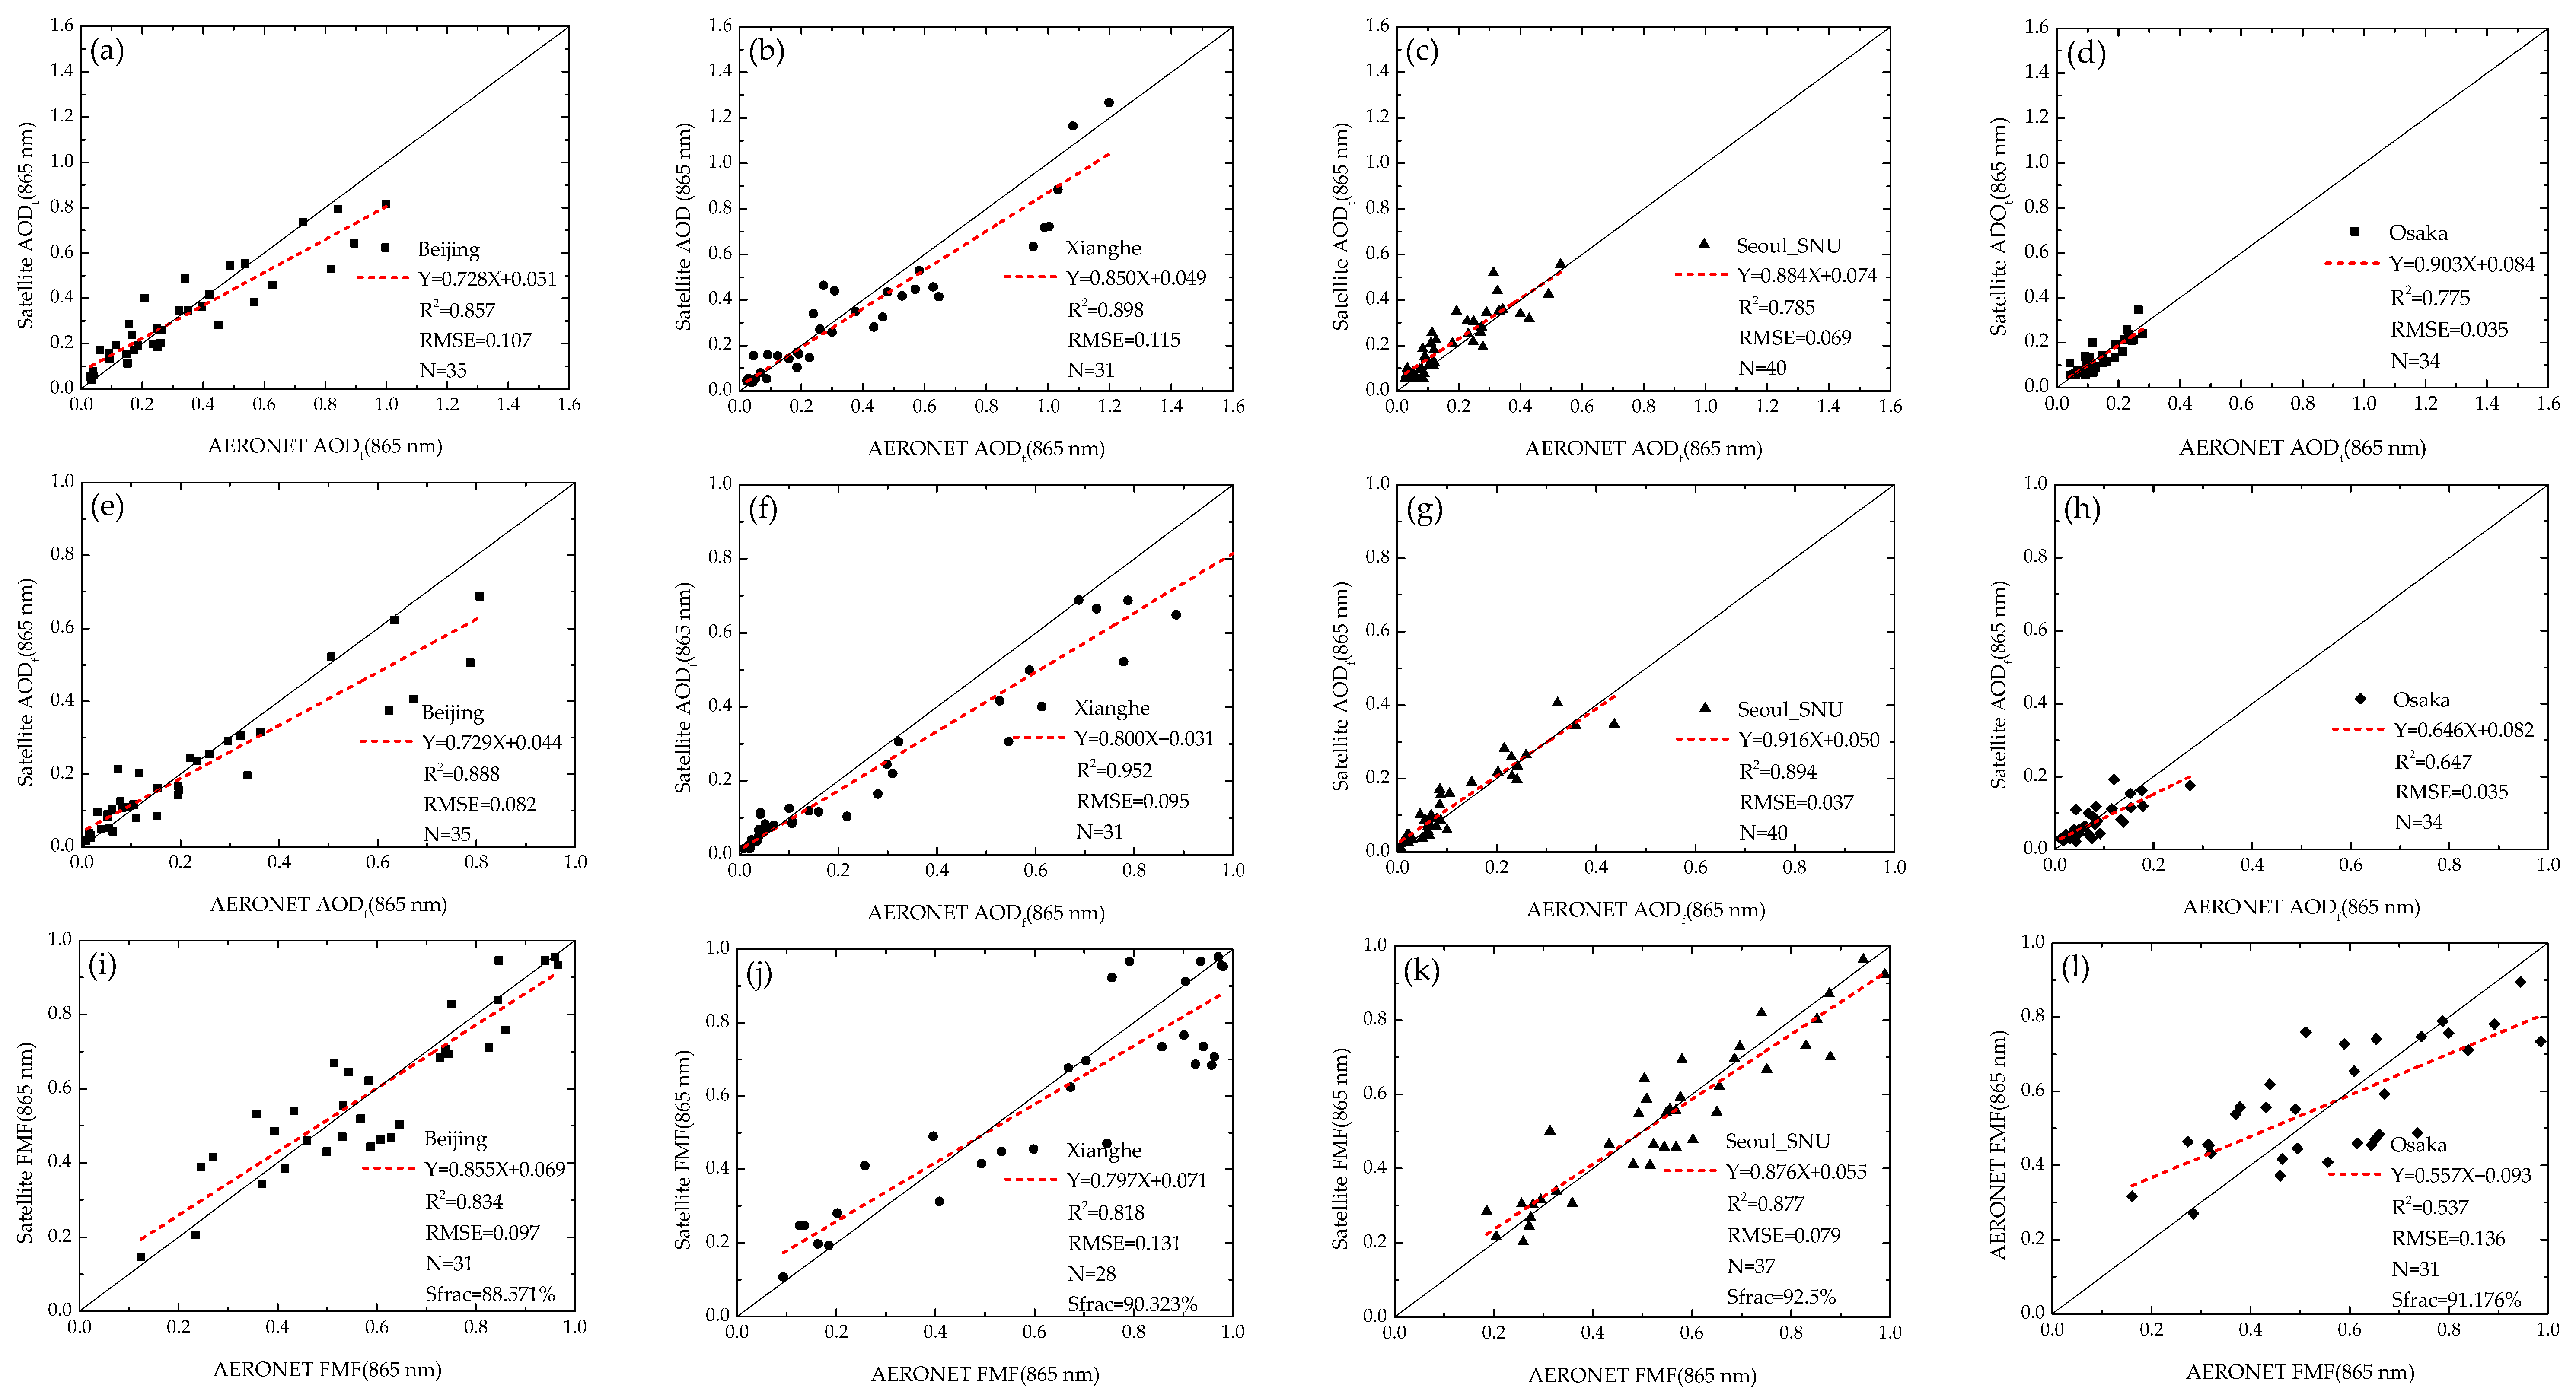
3.3. Validation against AERONET

The retrieved FMFs of our method versus the AERONET FMFs are shown in Figure 8. As a result of the uncertainty in the aerosol model, surface intensity and polarized reflectance estimation, and satellite observations, the total AOD may be less than the fine-mode AOD, making the FMF greater than 1.0. We consider this situation to be a failure and use ‘Sfrac’ to present the successful fraction of the retrieved FMF.
As shown in the validation results, for Beijing (the first column in Figure 8), the R2 values of the total AOD, fine-mode AOD, and FMF are all greater than 0.8; the corresponding root mean square error (RMSE) values are 0.107, 0.082, and 0.097, respectively; and the Sfrac is 88.571%. For Xianghe (the second column in Figure 8), the R2 values of the total AOD, fine-mode AOD, and FMF are all greater than 0.8; the corresponding RMSE values are 0.115, 0.095, and 0.131, respectively, and the Sfrac is 90.323%. For Seoul_SNU (the third column in Figure 8), the R2 value of the total AOD is 0.785, which is slightly lower than the two sites above, but the R2 values of the fine-mode AOD and FMF are both greater than 0.8. The corresponding RMSE values are 0.069, 0.037, and 0.079, respectively, and the Sfrac is 92.5%. However, because the total AOD and fine-mode AOD values for Osaka (the fourth column in Figure 8) are much lower than the three sites above, the relative error is much higher, as it is hard to detect weak aerosol signals in satellite observations. Thus, the FMF retrieval result is not optimal for Osaka. The R2 values of the three parameters are 0.775, 0.647, and 0.537, with RMSE values of 0.035, 0.035, and 0.136, respectively. However, the total mean absolute error (AE) and relative error (RE) of the retrieved FMF are 0.091 and 19.33%, respectively, which suggest that our method is able to meet most general demands of atmospheric environmental monitoring.

4. Discussion

4.1. The Estimation of Surface/Surface Polarized Reflectance

First, the surface intensity and polarized reflectance estimation models are semi-empirical in this study, and the two models use NDVI as a parameter. However, the NDVI value is easily affected by atmospheric aerosols. When the AOD is high, the NDVI values decrease sharply [38]. This leads to the overestimation of the surface intensity and polarized reflectance, and the AOD results will be underestimated. Moreover, changes in the total AOD and fine-mode AOD values, which correspond to the overestimation of the surface intensity and polarized reflectance, are not synchronous, and the effect on the FMF retrieval is uncertain. To solve this problem, we use the Aerosol Free vegetation Index (AFRI) to build an estimation model, but the semi-empirical model usually has a regional limitation. For example, ω , which is used in the estimation of surface intensity reflectance and obtained by the regression analysis based on the AERONET measurements, is 0.45 over east China; however, it is 0.35 over Osaka if we want to obtain a comparable result. Thus, the empirical parameter of this surface reflectance estimation model varies with the study area and is still not obtained from satellite observation directly, even if we replace NDVI with AFRI. Establishing a reflectance estimation model that is not affected by the atmospheric conditions and can be widely used in the world is a goal of future work.

4.2. The Retrieval Method of FMF

The FMF retrieval method in this study uses both the intensity and polarized measurements to retrieve FMF, and the retrieval results are comparable to AERONET ground-based observation data. However, our method may lead to the fine-mode AOD being greater than the total AOD, leading to the failure of the FMF retrieval. According to the validation results in Section 3.3, the failure ratio is approximately 10%. Lowering the failure ratio is also a goal of future work we wish to perform.

4.3. The Retrieval Accuracy of AOD and FMF

According to the validation results in Section 3.3, this study is similar to other studies in the sense that the retrieval precision of the low-AOD area is poor. The main cause of this phenomenon is that, when the AOD is low, the aerosol information received by the satellite is very weak, and the estimation of the surface reflectance is quite difficult. To solve this problem, we need not only a precise surface reflectance estimation method but also an accurate aerosol model. Any error caused by the two factors could increase the relative error and lead to error propagation. Thus, the question of how to improve the retrieval accuracy over low-AOD areas is a considerable challenge for satellite remote sensing in general.

4.4. Error Estimation

According to the absolute error transfer formula, the absolute error of the FMF following Equation (15) can be written as
Δ F M F = | F M F A O D f | · Δ A O D f ¯ + | F M F A O D t | · Δ A O D t ¯ = | 1 A O D t | · Δ A O D f ¯ + | A O D f A O D t 2 | · Δ A O D t ¯ ,
where Δ F M F is the absolute error of the retrieved FMF, A O D f is the fine-mode AOD, Δ A O D f ¯ is the mean retrieval absolute error of A O D f , A O D t is the total AOD, and Δ A O D t ¯ is the mean retrieval absolute error of Δ A O D t ¯ .
According to the relative error transfer formula, the relative errors of the FMF following Equation (16) can be written as
Δ F M F F M F × 100 % = ( | l n F M F A O D f | · Δ A O D f ¯ + | l n F M F A O D t | · Δ A O D t ¯ ) × 100 % = ( | 1 A O D f | · Δ A O D f ¯ + | 1 A O D t | · Δ A O D t ¯ ) × 100 %
where Δ F M F F M F × 100 % is the relative error of the retrieved FMF.
From Equations (15) and (16), we know that the total AOD and fine-mode AOD retrieved in this study can affect the performance of the FMF retrieval method, and the absolute and relative errors of the retrieved FMF decreases with increasing fine-mode and total AODs. This suggests that our FMF retrieval method is more reliable when the AOD is high.
According to the validation in Section 3.3, the total Δ A O D f ¯ and Δ A O D t ¯ at the four sites are 0.059 and 0.040, respectively. We also analyzed the total mean A O D f and A O D t of the AERONET ground-based data in 2012 at those sites, the corresponding statistics are 0.307 and 0.413, respectively. Incorporating these values into Equations (15) and (16), we calculate that the total mean Δ F M F and Δ F M F F M F × 100 % are, in theory, 0.206% and 27.67%, respectively.

5. Conclusions

In this study, we used multi-angle intensity and polarization measurements from the PARASOL instrument to retrieve total AOD and fine-mode AOD via the lookup table approach. We then performed retrievals of FMF over East Asia. During the retrieval process, two semi-empirical models were used to estimate the surface intensity and polarized reflectance, and two sets of aerosol retrieval lookup tables for intensity and polarized measurements were built using the 6SV radiative transfer code.
Compared with the MODIS FMF product, the FMF retrieval results of our method could provide much more detail and a higher accuracy. The comparisons of FMF retrieval results with AERONET ground-based measurement data produced high correlations for the Beijing, Xianghe, and Seoul_SNU sites, with corresponding R2 values for the retrieved FMFs of 0.834, 0.818, and 0.877, respectively. However, note that the R2 value of the retrieved FMF for the Osaka site is only 0.537, which is due to the low signal-to-noise ratio of the satellite observation due to a much lower aerosol load.
Compared with the statistically optimized retrieval algorithm [39], our method is easier to implement and is more efficient. This method can be applied in atmospheric environmental studies and can contribute significantly to the estimation of anthropogenic aerosol contents and fine particulate matter concentrations [37,40]. Additionally, the satellite-derived aerosol parameters are used for Data Assimilation (DA) in many studies [41,42,43,44], and our work has implications beyond diagnosing air quality. Because the FMF can constrain the AOD, assimilating FMF and AOD retrievals is better than assimilating only the MODIS AOD and could improve the aerosol forecast results. Therefore, relevant studies could benefit from our method.
Our FMF retrieval method uses coincident multi-angle intensity and polarization measurements to retrieve total AOD and fine-mode AOD, and the FMF can be calculated as the ratio of the retrieved fine-mode AOD to the total AOD. This differs from traditional FMF retrieval methods, such as the MODIS implementation. Although our method provides a new solution to obtain FMF and could obtain comparable retrieval results, it still has some shortcomings, such as the lack of a universal reflectance estimation model, the failure of FMF retrievals when the fine-mode AOD is greater than the total AOD, and the low retrieval accuracy over low-AOD areas. These three problems will be the focus of future work and are important for optimizing our method.

Acknowledgments

This work is supported by the “Strategic Priority Research Program—Climate Change: Carbon Budget and Relevant Issues” of the Chinese Academy of Sciences (Grant No: XDA05100202), the project supported by National Natural Science Foundation of China (Grant No: 41501399, No: 41505022, No: 41301391) and the Major Project of High Resolution Earth Observation System (Grant No: 30-Y20A39-9003-15/17). We thank Hongbin Chen, Philippe Goloub, Pucai Wang, Xiangao Xia, Sang-woo Kim, and Janet Elizabeth Nichol for their efforts in establishing and maintaining the Beijing, Xianghe, Seoul_SNU, and Osaka AERONET sites. We thank the LERTS (Laboratoire d’Etudes et de Recherche en Télédétection Spatiale), CNES (Centre National d’Etudes Spatiales), and LOA (Laboratoire d’Optique Atmosphérique) for the PARASOL level 1 data. We are grateful to Eric F. Vermote, Jean-Claude Roger, S.Y. Kotchenova, J.J. Morcrette, D. Tanré, J.L. Deuzé, and M. Herman for the 6SV Radiative Transfer code. We sincerely thank American Journal Experts (AJE) for their helpful English language editing. Finally, we sincerely thank the anonymous reviewers for their helpful comments and one anonymous reviewer for the full technical edit.

Author Contributions

All authors conceived and designed the study. Yang Zhang and Zhengqiang Li performed the FMF retrieval method and prepared the paper. Lili Qie provided useful advice regarding the determination of the aerosol model. Ying Zhang, Zhihong Liu, Xingfeng Chen, and Weizhen Hou provided technical guidance and revised the paper. Kaitao Li, Donghui Li, and Hua Xu assisted with the satellite and ground-based data collection.

Conflicts of Interest

The authors declare no conflicts of interest.

References

  1. Kaufman, Y.J.; Tanre, D.; Boucher, O. A satellite view of aerosols in the climate system. Nature 2002, 419, 215–223. [Google Scholar] [CrossRef] [PubMed]
  2. Tollefson, J. Asian pollution delays inevitable warming. Nature 2010, 463, 860–861. [Google Scholar] [CrossRef] [PubMed]
  3. Kaufman, Y.J.; Wald, A.E.; Remer, L.A.; Gao, B.C. The MODIS 2.1-μm channel-correlation with visible reflectance for use in remote sensing of aerosol. IEEE Trans. Geosci. Remote Sens. 1997, 35, 1286–1298. [Google Scholar] [CrossRef]
  4. Levy, R.C.; Remer, L.A.; Mattoo, S.; Vermote, E.F.; Kaufman, Y.J. Second-generation operational algorithm: Retrieval of aerosol properties over land from inversion of moderate resolution imaging spectroradiometer spectral reflectance. J. Geophys. Res. Atmos. 2007, 112, 3710–3711. [Google Scholar] [CrossRef]
  5. Tanré, D.; Remer, L.A.; Kaufman, Y.J.; Mattoo, S.; Hobbs, P.V.; Livingston, J.M.; Russell, P.B.; Smirnov, A. Retrieval of aerosol optical thickness and size distribution over ocean from the MODIS airborne simulator during tarfox. J. Geophys. Res. Atmos. 1999, 104, 2261–2278. [Google Scholar] [CrossRef]
  6. Kaufman, Y.J.; Boucher, O.; Tanré, D.; Chin, M.; Remer, L.A.; Takemura, T. Aerosol anthropogenic component estimated from satellite data. Geophys. Res. Lett. 2005, 32, 317–330. [Google Scholar] [CrossRef]
  7. Kleidman, R.G.; O’Neill, N.T.; Remer, L.A.; Kaufman, Y.J.; Eck, T.F.; Tanré, D.; Dubovik, O.; Holben, B.N. Comparison of moderate resolution imaging spectroradiometer (MODIS) and aerosol robotic network (AERONET) remote-sensing retrievals of aerosol fine mode fraction over ocean. J. Geophys. Res. Atmos. 2005, 110, 3127–3137. [Google Scholar] [CrossRef]
  8. Levy, R.C.; Remer, L.A.; Kleidman, R.G.; Mattoo, S. Global evaluation of the collection 5 MODIS dark-target aerosol products over land. Atmos. Chem. Phys. 2010, 10, 10399–10420. [Google Scholar] [CrossRef] [Green Version]
  9. Deuzé, J.L.; Bréon, F.M.; Devaux, C.; Goloub, P.; Herman, M.; Lafrance, B.; Maignan, F.; Marchand, A.; Nadal, F.; Perry, G.; et al. Remote sensing of aerosols over land surfaces from polder-adeos-1 polarized measurements. J. Geophys. Res. 2001, 106, 4913–4926. [Google Scholar] [CrossRef]
  10. Tanré, D.; Bréon, F.M.; Deuzé, J.L.; Dubovik, O.; Ducos, F.; François, P.; Goloub, P.; Herman, M.; Lifermann, A.; Waquet, F. Remote sensing of aerosols by using polarized, directional and spectral measurements within the a-train: The parasol mission. Atmos. Meas. Tech. 2011, 4, 1383–1395. [Google Scholar] [CrossRef]
  11. Bréon, F.-M.; Vermeulen, A.; Descloitres, J. An evaluation of satellite aerosol products against sunphotometer measurements. Remote Sens. Environ. 2011, 115, 3102–3111. [Google Scholar] [CrossRef]
  12. Fan, X.; Goloub, P.; Deuzé, J.-L.; Chen, H.; Zhang, W.; Tanré, D.; Li, Z. Evaluation of parasol aerosol retrieval over north East Asia. Remote Sens. Environ. 2008, 112, 697–707. [Google Scholar] [CrossRef]
  13. Parasol Level-1 Product Data Format and User Manual. 2006. Available online: http://www.icare.univ-lille1.fr/parasol/overview_product (accessed on 18 April 2016).
  14. Kotchenova, S.Y.; Vermote, E.F. Validation of a vector version of the 6s radiative transfer code for atmospheric correction of satellite data. Part II. Homogeneous lambertian and anisotropic surfaces. Appl. Opt. 2007, 46, 4455–4464. [Google Scholar] [CrossRef] [PubMed]
  15. Kotchenova, S.Y.; Vermote, E.F.; Raffaella, M.; Klemm, F.J. Validation of a vector version of the 6s radiative transfer code for atmospheric correction of satellite data. Part I: Path radiance. Appl. Opt. 2006, 45, 6762–6774. [Google Scholar] [CrossRef] [PubMed]
  16. Vermote, E.F.; Tanré, D.; Deuzé, J.L.; Herman, M.; Morcette, J.J. Second simulation of the satellite signal in the solar spectrum, 6s: An overview. IEEE Trans. Geosci. Remote Sens. 1997, 35, 675–686. [Google Scholar] [CrossRef]
  17. Cheng, T.H.; Gu, X.F.; Xie, D.H.; Li, Z.Q.; Yu, T.; Chen, X.F. Simultaneous retrieval of aerosol optical properties over the Pearl River Delta, China using multi-angular, multi-spectral, and polarized measurements. Remote Sens. Environ. 2011, 115, 1643–1652. [Google Scholar] [CrossRef]
  18. Kaufman, Y.J.; Tanré, D.; Remer, L.A.; Vermote, E.F.; Chu, A.; Holben, B.N. Operational remote sensing of troposphereic aerosol over land from EOS moderate resolution imaging spectroradiometer. J. Geophys. Res. Atmos. 1997, 102. [Google Scholar] [CrossRef]
  19. Wang, Z.; Chen, L.; Li, Q.; Li, S.; Jiang, Z.; Wang, Z. Retrieval of aerosol size distribution from multi-angle polarized measurements assisted by intensity measurements over East China. Remote Sens. Environ. 2012, 124, 679–688. [Google Scholar] [CrossRef]
  20. Zhang, Y.; Liu, Z.; Wang, Y.; Ye, Z.; Leng, L. Inversion of aerosol optical depth based on the CCD and IRS sensors on the HJ-1 satellites. Remote Sens. 2014, 6, 8760–8778. [Google Scholar] [CrossRef]
  21. von Hoyningen-Huene, W. Retrieval of aerosol optical thickness over land surfaces from top-of-atmosphere radiance. J. Geophys. Res. 2003, 108, D9. [Google Scholar] [CrossRef]
  22. Nadal, F.; Breon, F.M. Parameterization of surface polarized reflectance derived from polder spaceborne measurements. IEEE Trans. Geosci. Remote Sens. 1999, 37, 1709–1718. [Google Scholar] [CrossRef]
  23. Dubovik, O.; King, M.D. A flexible inversion algorithm for retrieval of aerosol optical properties from sun and sky radiance measurements. J. Geophys. Res. 2000, 105, 20673–20696. [Google Scholar] [CrossRef]
  24. Holben, B.N.; Eck, T.F.; Slutsker, I.; Tanré, D.; Buis, J.P.; Setzer, A.; Vermote, E.; Reagan, J.A.; Kaufman, Y.J.; Nakajima, T. AERONET-a federated instrument network and data archive for aerosol characterization. Remote Sens. Environ. 1998, 66, 1–16. [Google Scholar] [CrossRef]
  25. Li, Z.; Goloub, P.; Devaux, C.; Gu, X.; Deuzé, J.-L.; Qiao, Y.; Zhao, F. Retrieval of aerosol optical and physical properties from ground-based spectral, multi-angular, and polarized sun-photometer measurements. Remote Sens. Environ. 2006, 101, 519–533. [Google Scholar] [CrossRef]
  26. Lee, K.H.; Kim, Y.J. Satellite remote sensing of Asian aerosols: A case study of clean, polluted, and Asian dust storm days. Atmos. Meas. Tech. 2010, 3, 1771–1784. [Google Scholar] [CrossRef]
  27. Li, S.; Chen, L.; Tao, J.; Han, D.; Wang, Z.; Su, L.; Fan, M.; Yu, C. Retrieval of aerosol optical depth over bright targets in the urban areas of North China during winter. Sci. China Earth Sci. 2012, 55, 1545–1553. [Google Scholar] [CrossRef]
  28. Davies, C.N. Size distribution of atmospheric particles. J. Aerosol Sci. 1974, 5, 293–300. [Google Scholar] [CrossRef]
  29. Remer, L.A.; Kaufman, Y.J. Dynamic aerosol model: Urban/industrial aerosol. J. Geophys. Res. Atmos. 1998, 103, 13859–13871. [Google Scholar] [CrossRef]
  30. Eck, T.F.; Holben, B.N.; Reid, J.S.; Dubovik, O.; Smirnov, A.; O’Neill, N.T.; Slutsker, I.; Kinne, S. Wavelength dependence of the optical depth of biomass burning, urban, and desert dust aerosols. J. Geophys. Res. Atmos. 1999, 104, 31333–31349. [Google Scholar] [CrossRef]
  31. Anders, A. The parameters of atmospheric turbidity. Tellus 1964, 16, 64–75. [Google Scholar]
  32. O’Neill, N.T.; Eck, T.F.; Holben, B.N.; Smirnov, A.; Dubovik, O.; Royer, A. Bimodal size distribution influences on the variation of angstrom derivatives in spectral and optical depth space. J. Geophys. Res. Atmos. 2001, 106, 9787–9806. [Google Scholar] [CrossRef]
  33. O’Neill, N.T.; Eck, T.F.; Smirnov, A.; Holben, B.N.; Thulasiraman, S. Spectral discrimination of coarse and fine mode optical depth. J. Geophys. Res. Atmos. 2003, 108, 2932–2938. [Google Scholar] [CrossRef]
  34. Eck, T.F.; Holben, B.N.; Sinyuk, A.; Pinker, R.T.; Goloub, P.; Chen, H.; Chatenet, B.; Li, Z.; Singh, R.P.; Tripathi, S.N. Optical properties of fine/coarse mode aerosol mixtures. J. Geophys. Res. Atmos. 2010, 115, 5548–5554. [Google Scholar] [CrossRef]
  35. Chew, B.N.; Campbell, J.R.; Reid, J.S.; Giles, D.M.; Welton, E.J.; Salinas, S.V.; Liew, S.C. Tropical cirrus cloud contamination in sun photometer data. Atmos. Environ. 2011, 45, 6724–6731. [Google Scholar] [CrossRef]
  36. Levy, R.C.; Remer, L.A.; Tanré, D.; Mattoo, S.; Vermote, E.F.; Kaufman, Y.J. Algorithm for Remote Sensing of Tropospheric Aerosol over Dark Targets from MODIS: Collections 005 and 051: Revision 2. 2009. Available online: http://modis.gsfc.nasa.gov/data/atbd/atbd_mod02.pdf (accessed on 18 April 2016). [Google Scholar]
  37. Zhang, Y.; Li, Z. Remote sensing of atmospheric fine particulate matter (PM2.5) mass concentration near the ground from satellite observation. Remote Sens. Environ. 2015, 160, 252–262. [Google Scholar] [CrossRef]
  38. Liu, G.; Liang, C.; Kuo, T.; Lin, T.; Huang, S. Comparison of the NDVI, ARVI and AFRI vegetation index, along with their relations with the AOD using SPOT 4 vegetation data. Terr. Atmos. Ocean. 2004, 15, 15–31. [Google Scholar]
  39. Dubovik, O.; Herman, M.; Holdak, A.; Lapyonok, T.; Tanré, D.; Deuzé, J.L.; Ducos, F.; Sinyuk, A.; Lopatin, A. Statistically optimized inversion algorithm for enhanced retrieval of aerosol properties from spectral multi-angle polarimetric satellite observations. Atmos. Meas. Tech. 2011, 4, 975–1018. [Google Scholar] [CrossRef] [Green Version]
  40. Li, Z.; Zhang, Y.; Shao, J.; Li, B.; Hong, J.; Liu, D.; Li, D.; Wei, P.; Li, W.; Li, L.; et al. Remote sensing of atmospheric particulate mass of dry PM2.5 near the ground: Method validation using ground-based measurements. Remote Sens. Environ. 2016, 173, 59–68. [Google Scholar] [CrossRef]
  41. Liu, Z.; Liu, Q.; Lin, H.C.; Schwartz, C.S.; Lee, Y.H.; Wang, T. Three-dimensional variational assimilation of MODIS aerosol optical depth: Implementation and application to a dust storm over East Asia. J. Geophys. Res. Atmos. 2011, 116, 399–411. [Google Scholar] [CrossRef]
  42. Schwartz, C.S.; Liu, Z.; Lin, H.C.; Mckeen, S.A. Simultaneous three-dimensional variational assimilation of surface fine particulate matter and MODIS aerosol optical depth. J. Geophys. Res. 2012, 117, 110–117. [Google Scholar] [CrossRef]
  43. Saide, P.E.; Carmichael, G.R.; Liu, Z.; Schwartz, C.S.; Lin, H.C.; Silva, A.M.D.; Hyer, E. Aerosol optical depth assimilation for a size-resolved sectional model: Impacts of observationally constrained, multi-wavelength and fine mode retrievals on regional scale analyses and forecasts. Atmos. Chem. Phys. 2013, 13, 10425–10444. [Google Scholar] [CrossRef]
  44. Schwartz, C.S.; Liu, Z.; Lin, H.C.; Cetola, J.D. Assimilating aerosol observations with a “hybrid” variational-ensemble data assimilation system. J. Geophys. Res. Atmos. 2014, 119, 4043–4069. [Google Scholar] [CrossRef]
Figure 1. The flow chart of FMF (fine-mode fraction) retrieval. AOD refers to aerosol optical depth. LUT refers to lookup table. NDVI refers to normalized differential vegetation index.
Remotesensing 08 00417 g001
Figure 2. The total and fine-mode AOD retrieval flow chart.
Remotesensing 08 00417 g002
Figure 3. The retrieval results of PARASOL for 28 April 2012. (a) is a true-color image, and (b), (c), and (d) are the retrieval results of the total AOD (865 nm), fine-mode AOD (865 nm), and FMF (865 nm), respectively.
Remotesensing 08 00417 g003
Figure 4. The retrieval results of PARASOL for 5 October 2013. (a) is a true-color image, and (b), (c), and (d) are the retrieval results of the total AOD (865 nm), fine-mode AOD (865 nm), and FMF (865 nm), respectively.
Remotesensing 08 00417 g004
Figure 5. The comparison of the FMF retrieval results of PARASOL and MODIS FMF products for 28 April 2012. (a) is the FMF result of this work; and (b) is the FMF result of MODIS. MODIS refers to Moderate-resolution Imaging Spectroradiometer.
Remotesensing 08 00417 g005
Figure 6. The comparison of the FMF retrieval results of PARASOL and MODIS FMF products for 5 October 2013. (a) is the FMF result of this work, and (b) is the FMF result of MODIS.
Remotesensing 08 00417 g006
Figure 7. The scatterplot of satellite FMFs versus AERONET FMFs at the Beijing and Xianghe sites. AERONET refers to Aerosol Robotic Network.
Remotesensing 08 00417 g007
Figure 8. (al) The validation results of the Beijing, Xianghe, Seoul_SNU, and Osaka sites. (a), (e), and (i) are the validation results of the PARASOL total AOD (AODt), fine-mode AOD (AODf) and FMF of the Beijing site, respectively. (b), (f), and (j) are the validation results of the PARASOL AODt, AODf and FMF of the Xianghe site, respectively. (c), (g), and (k) are the validation results of the PARASOL AODt, AODf and FMF of the Seoul_SNU site, respectively. (d), (h), and (l) are the validation results of the PARASOL AODt, AODf, and FMF of the Osaka site, respectively.
Remotesensing 08 00417 g008
Table 1. Sensor parameters of PARASOL (Polarization and Anisotropy of Reflectances for Atmospheric Science coupled with Observations from a Lidar) [13].
PARASOL BandCentral Wavelength (nm)Band Width (nm)PolarizedSpatial Resolution (km)Scanning Directions
443443.913.5No6 (at nadir)16
490491.516.5Yes
565563.915.5No
670669.915Yes
763762.811No
765762.538No
865863.433.5Yes
910906.921No
10201019.417No
Table 2. Detailed parameters of the Nadal and Breon model [22]. ρ and β are empirical parameters that correspond to various surface types and NDVI values.
Surface TypeNDVIρ*100β
Forest0–0.150.70120
0.15–0.30.75125
≥0.30.65120
Shrublands0–0.151.5090
0.15–0.30.95120
≥0.30.70140
Low vegetation0–0.151.3090
0.15–0.30.9590
≥0.30.75130
Desert0–0.152.5045
≥0.152.5045
Table 3. The parameters of aerosol models for intensity measurement [26,27]. mr is the real part of the complex refractive index, mi is the imaginary part of the complex refractive index, and C is the percentage density of fine particles by number. The different classes show different aerosol scattering properties. The ρ 0 ( μ s μ v φ ) , T ( μ s ) , T ( μ v ) , and S values that correspond to these classes, which guarantee the optimal aerosol model can be distinguished by Equation (7), are mainly determined by C.
ClassParameters
mrmi r n, Fine σ n, Fine r n, Coarse σ n, Coarse C
11.4830.00780.10890.5350.98010.5680.05
21.54650.01300.12020.61350.97240.60220.13
31.4850.00880.09390.5310.98260.5830.20
41.5370.00230.06590.6190.96180.5310.43
51.53930.01290.08450.61570.82870.61260.53
61.5280.01480.08390.54060.74760.62810.60
71.4680.01020.08960.5040.92690.6180.76
81.4820.0090.09020.4740.62290.6560.82
91.48530.00950.0950.52460.79580.64510.90
101.54650.0130.12020.61350.97240.60220.99
Table 4. The input parameters of the lookup table for 6SV.
ParametersValue
Sensor bandPARASOL 670 nm, 865 nm
Solar zenith angle0°–88°, interval 4°
View zenith angle0°–88°, interval 4°
Relative azimuth angle0°–180°, interval 5°
AOD at 550 nm0.01, 0.1, 0.25, 0.5, 0.75, 1.0, 1.25, 1.5, 1.75, 2.0
Aerosol modelStated in Section 2.3

