Article

Spatiotemporal Characterization of Land Subsidence and Uplift (2009–2010) over Wuhan in Central China Revealed by TerraSAR-X InSAR Analysis

1
State Key Laboratory of Geodesy and Earth’s Dynamics, Institute of Geodesy and Geophysics, Chinese Academy of Sciences, Wuhan 430077, China
2
University of Chinese Academy of Sciences, Beijing 100049, China
*
Author to whom correspondence should be addressed.
Remote Sens. 2016, 8(4), 350; https://doi.org/10.3390/rs8040350
Submission received: 10 March 2016 / Revised: 11 April 2016 / Accepted: 14 April 2016 / Published: 20 April 2016
(This article belongs to the Special Issue Earth Observations for Geohazards)

Abstract

:
The effects of ground deformation pose a significant geo-hazard to the environment and infrastructure in Wuhan, the most populous city in Central China, in the eastern Jianghan Plain at the intersection of the Yangtze and Han rivers. Prior to this study, however, rates and patterns of region-wide ground deformation in Wuhan were little known. Here we employ multi-temporal SAR interferometry to detect and characterize spatiotemporal variations of ground deformation in major metropolitan areas in Wuhan. A total of twelve TerraSAR-X images acquired during 2009–2010 are used in the InSAR time series analysis. InSAR-derived results are validated by levelling survey measurements and reveal a distinct subsidence pattern within six zones in major commercial and industrial areas, with a maximum subsidence rate up to −67.3 mm/year. A comparison analysis between subsiding patterns and urban developments as well as geological conditions suggests that land subsidence in Wuhan is mainly attributed to anthropogenic activities, natural compaction of soft soil, and karst dissolution of subsurface carbonate rocks. However, anthropogenic activities related to intensive municipal construction and industrial production have more significant impacts on the measured subsidence than natural factors. Moreover, remarkable signals of secular land uplift are found along both banks of the Yangtze River, especially along the southern bank, with deformation rates ranging mostly from +5 mm/year to +17.5 mm/year. A strong temporal correlation is highlighted between the detected displacement evolutions and the water level records of the Yangtze River, inferring that this previously unknown deformation phenomenon is likely related to seasonal fluctuations in water levels of the Yangtze River.

Graphical Abstract

1. Introduction

Accompanying large-scale urbanization and industrialization during the past 35 years, more than 95 megacities in China have undergone rapid land subsidence [1]. The potential consequences of land subsidence mainly include degradation of the aquifer system and damage to the utility infrastructures, buildings, railroads, highways and bridges [2,3]. In this context, intensive efforts and investigations related to land subsidence monitoring have been untaken in four major subsiding regions in China: the Yangtze River Delta [4,5], the North China Plain [6,7], the Fenwei Basin [8] and the Pearl Delta [9]. As one of the most populous cities in China, Wuhan city has experienced a rapid urban expansion over the past decades. Consequently, various types of geohazards relevant to ground deformation have been frequently occurring in Wuhan metropolitan areas, due to anthropogenic activities (e.g., groundwater pumping, tunnel excavation) and/or natural geological processes (e.g., alluvial soil consolidation, karst collapse and surface water loading) [10,11]. Prior to this study, however, rates and patterns of region-wide ground deformation in Wuhan were still little known. Consequently, there is an increasing demand for regular and large-scale monitoring of ground deformation to support the integrated sustainable development of Wuhan.
Over past decades, space-borne Synthetic Aperture Radar Interferometry (InSAR) has been proven as an effective remote sensing technique to detect ground deformation associated with earthquakes [12,13], volcano eruptions [14,15], permafrost degradation [16], glacier movement [17] , landsides activity [18,19] and subsidence investigation [20,21,22]. Compared with point-measurement geodetic techniques such as Global Positioning System (GPS) and levelling surveys, InSAR provides deformation measurements at a significantly improved resolution over large areas. However, it is still a challenge as a practical tool for monitoring subtle ground deformation due to temporal and spatial decorrelation as well as atmospheric disturbances. To overcome the limitations of conventional InSAR methods, in recent years some advanced InSAR approaches have been developed based on time-series interferometric analysis of multi-temporal SAR acquisitions over the same areas, herein referred to as multi-temporal InSAR (MT-InSAR) techniques. The MT-InSAR techniques, mainly involving persistent scatterer InSAR (PSI) methods [23,24,25] and small baseline subset (SBAS) methods [26,27,28], identify and exploit a subset of image pixels which maintain a high coherence level over the study period, allowing the average rates and temporal evolutions of ground deformation to be estimated with millimeter-level accuracy. These advanced InSAR techniques have been widely used in monitoring urban ground deformation, such as in Macao [3], Shanghai [29], Guangzhou [30], Lisbon [31] and Mexico [32].
In this paper, we present results from the first application of multi-temporal InSAR in ground deformation monitoring in Wuhan. The StaMPS (Stanford Method for Persistent Scatterer) approach [24,33] is applied to 12 TerraSAR-X images acquired from October 2009 to August 2010 to retrieve and characterize spatiotemporal variations of ground deformation in major metropolitan areas in Wuhan. Moreover, a comparison between InSAR-based results and in situ data is carried out to validate the InSAR observations. Finally, the potential causes of the observed ground deformation are discussed through an integrated analysis of multidisciplinary information related to karst geology, surface hydrology, urban development and geotechnical engineering.

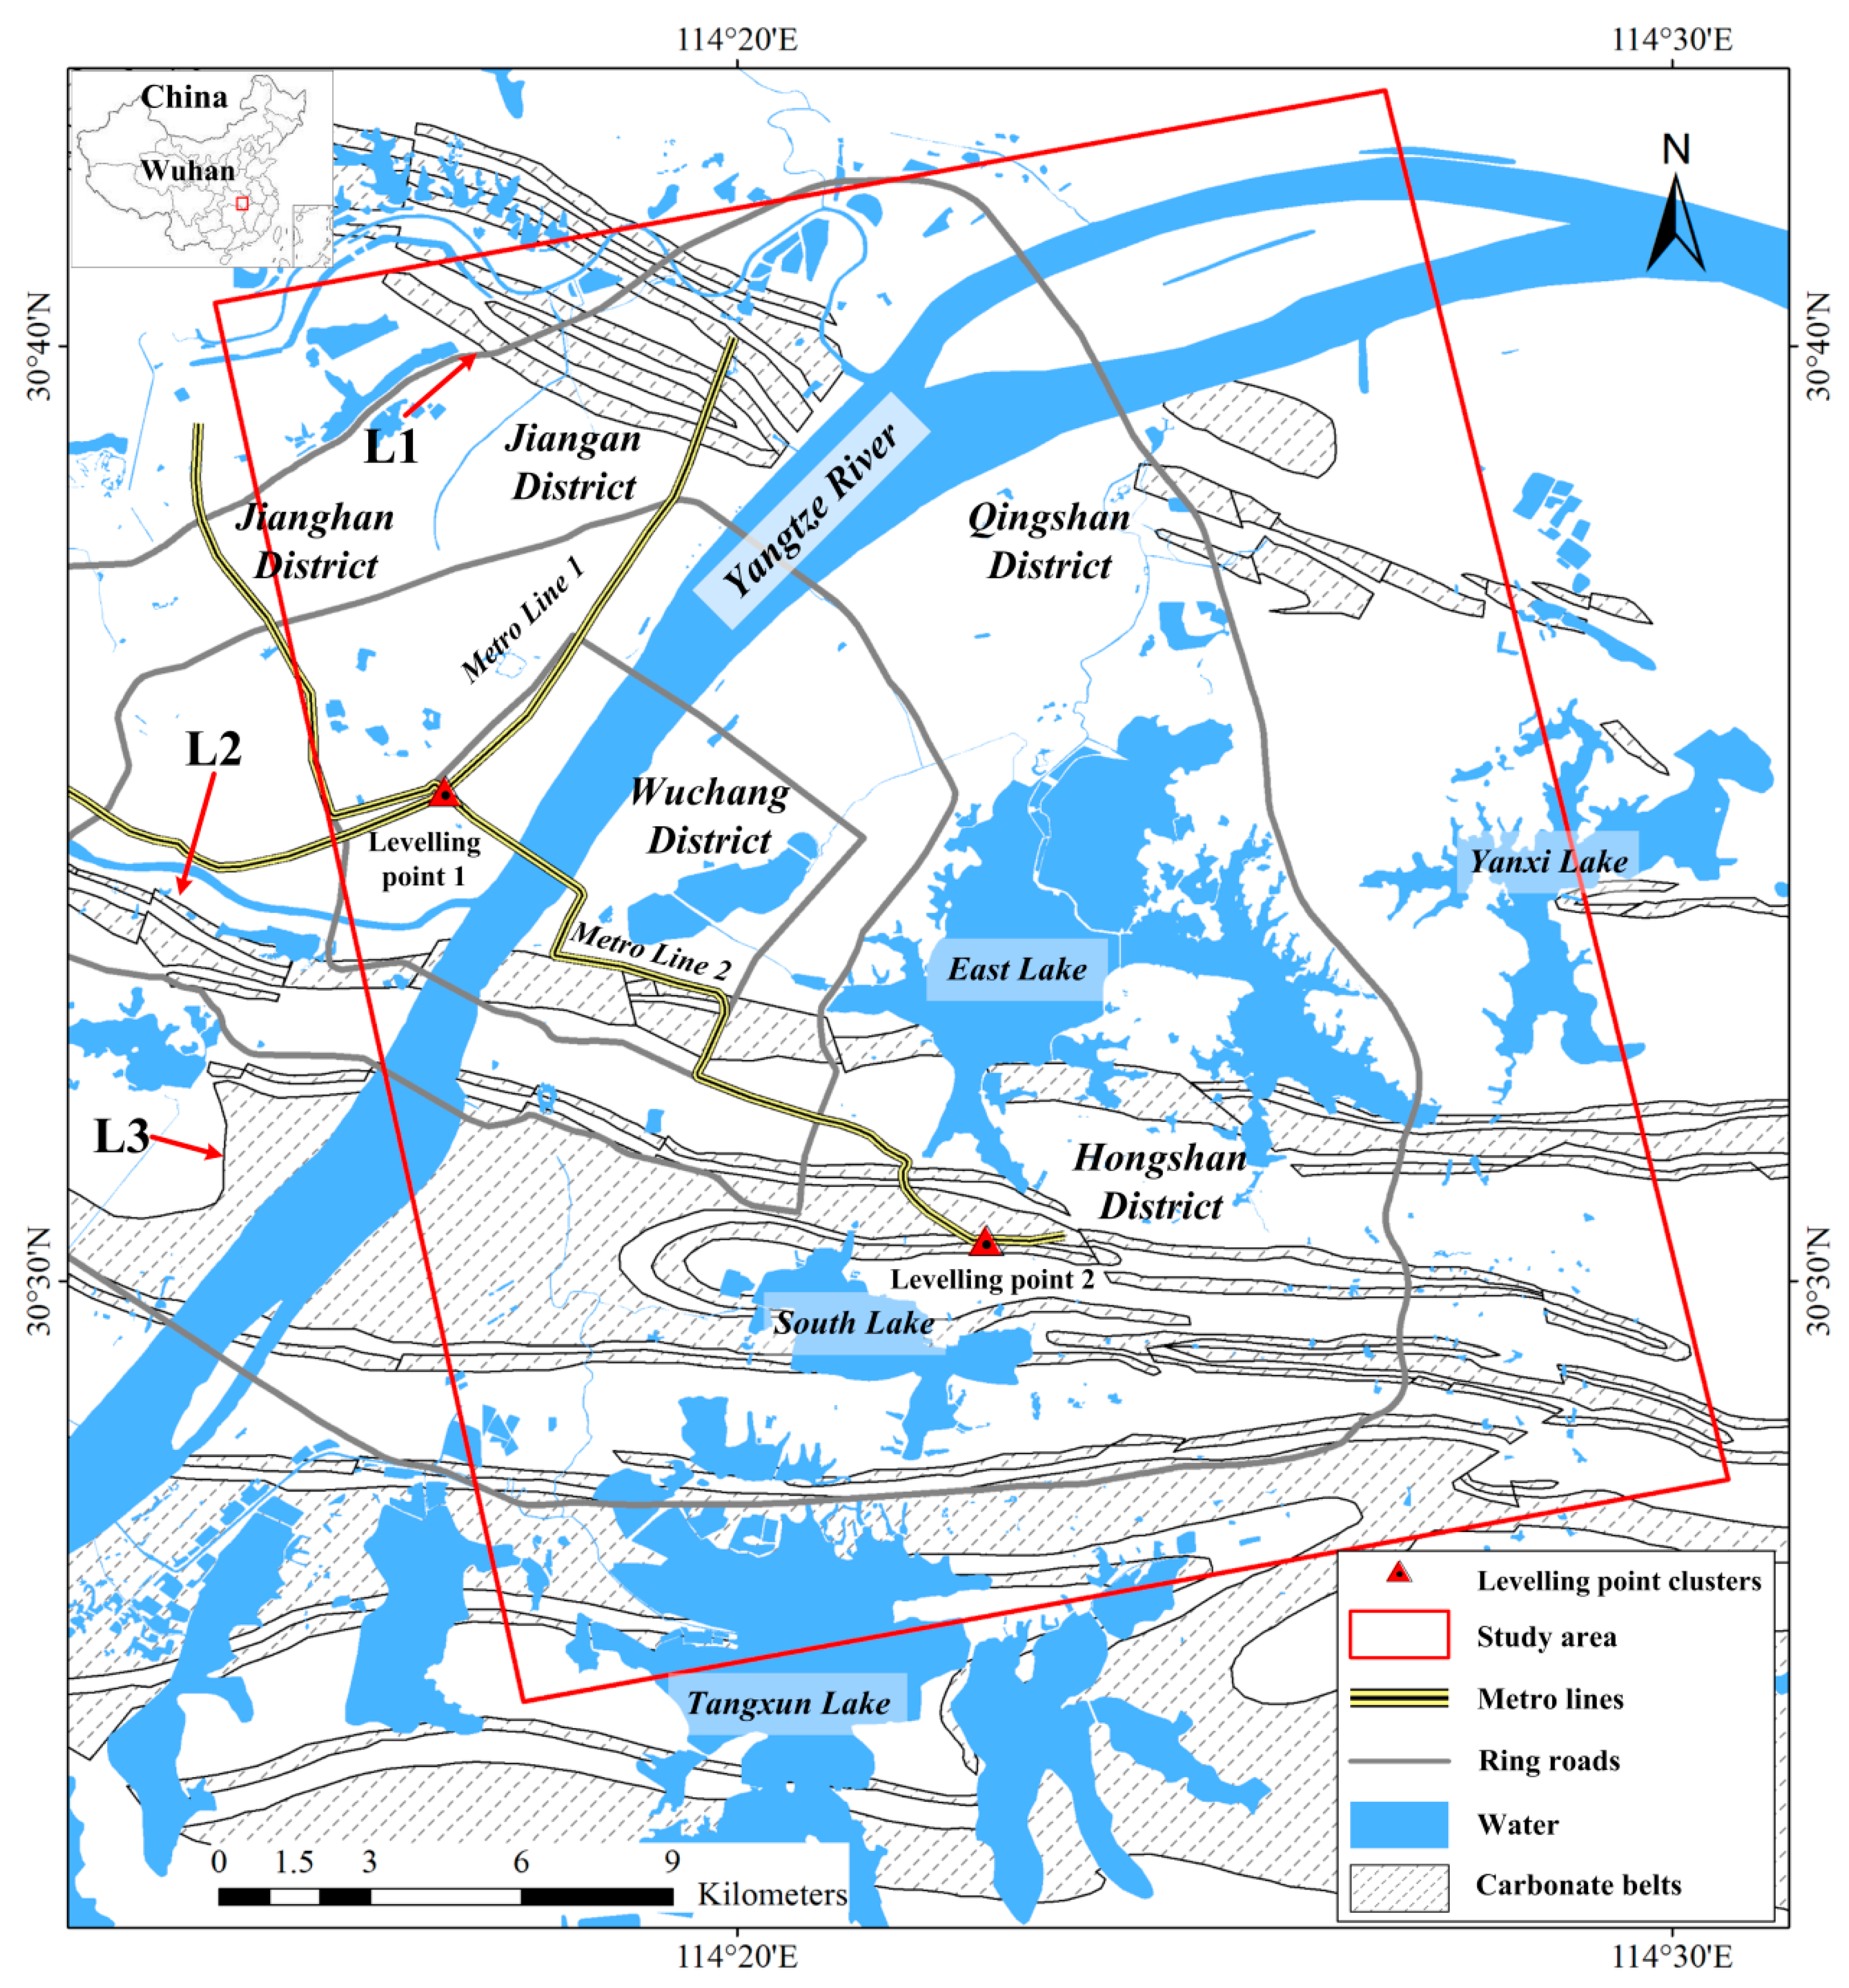
2. Study Area and Data Used

2.1. Geological Setting of Study Area

Wuhan, the capital of Hubei province and the most populous city in Central China, lies in the eastern Jianghan Plain at the intersection of the middle reaches of the Yangtze and Han rivers. The city contains many lakes and parks, including expansive East Lake, the largest urban lake in China. The geology of Wuhan is part of the Yangtze geosyncline sag with the characteristics of paraplatform, and developed well in a alluvial plain with monadnock. Climatically, Wuhan is in a subtropical monsoon climate zone, characterized by high temperature in summer, low temperature in winter and abundant precipitation. The average annual precipitation reaches up to 1261.2 mm, concentrated in the flood season from June to August [34].
The study area in this work is located at major metropolitan areas in Wuhan, with a total area of approximately 28 km by 20.5 km, and mainly contains Hankou and Wuchang parts (Figure 1). The Hankou region is characterized with an alluvial plain formed by flood siltation of Yangtze and Han rivers as well as lakes, and the Wuchang region is denuded hilly land except the alluvial plain along the Yangtze River. Soft soils are widely distributed throughout most areas of Hankou and in the riverside area of Wuchang. There are one or more layers of lens formed by silt clay and silt in the area 5~30 m beneath the ground surface, and the thickness of the lens reaches about 10~20 m. The materials of the lens, presenting a plastic flow state and strong hydrophilic and alteration features, easily lead to ground inhomogeneous subsidence under the influence of pumping groundwater and vibration [11]. In addition, there are insidious carbonate rocks in the second bottom along Yangtze River and the south of Changjiang Bridge and well-developed karst geology in the Wuhan urban areas (see Figure 1). A large number of karst collapses caused by human activities, such as pumping groundwater for water supply and mine dewatering, have been recorded since 1931 and pose a serious threat to buildings and human safety [35].

2.2. Datasets Used

In this study, 12 TerraSAR-X scenes at HH polarization, acquired between October 2009 and August 2010 along ascending track 142, are used to investigate the ground deformation in Wuhan. More parameters of the TerraSAR-X data are summarized in Table 1. The coverage of the TerraSAR scenes is shown as the red rectangle in Figure 1.
SRTM (Shuttle Radar Topography Mission) DEM with a resolution of 30 m are used to remove the topographic phase and geocode interferograms. This 30-m DEM was released in 2015 by USGS (U.S. Geological Survey) and can be downloaded at https://lta.cr.usgs.gov/SRTM1Arc. In addition, daily water level data on the Yangtze River acquired by the Hankou hydrological station from October 2009 to October 2010, provided by the Hubei Administration of hydrology and water resources, are used to analyze possible causes for ground uplift along both banks of the Yangtze River.
Finally, in situ measurements collected repeatedly by precise levelling campaigns between 2008 and 2010 are utilized to evaluate the InSAR-derived results. The levelling campaigns were carried out over two construction areas of Metro Line 2 (see Figure 1), situated around Xunlimen Station in Hankou district and Mingdu Station in Hongshan district, respectively. More detailed descriptions on the levelling surveys were reported in [37,38].

3. Multi-Temporal InSAR Data Processing

The StaMPS approach, an implementation of persistent scatterer (PS) Interferometry technique, is employed in this study to carry out multi-temporal InSAR analysis of the 12 TerraSAR-X data. The StaMPS approach uses spatial correlation of the interferometric phase to find PS pixels without prior knowledge of temporal variations in the deformation rate. This strategy can detect low amplitude pixels with phase stability in most terrain types, with or without buildings, and is applicable in areas undergoing temporally variable deformation with no prior knowledge [24]. Due to the large subsidence rates of the study area and the limitation of the quantity of SAR images, we applied the SB (small baseline) method implemented in the StaMPS approach [39] to derive ground deformation. The fundamental procedures of the StaMPS-SB method are briefly introduced below and more detailed descriptions of this method can be consulted in [24,33,39,40].

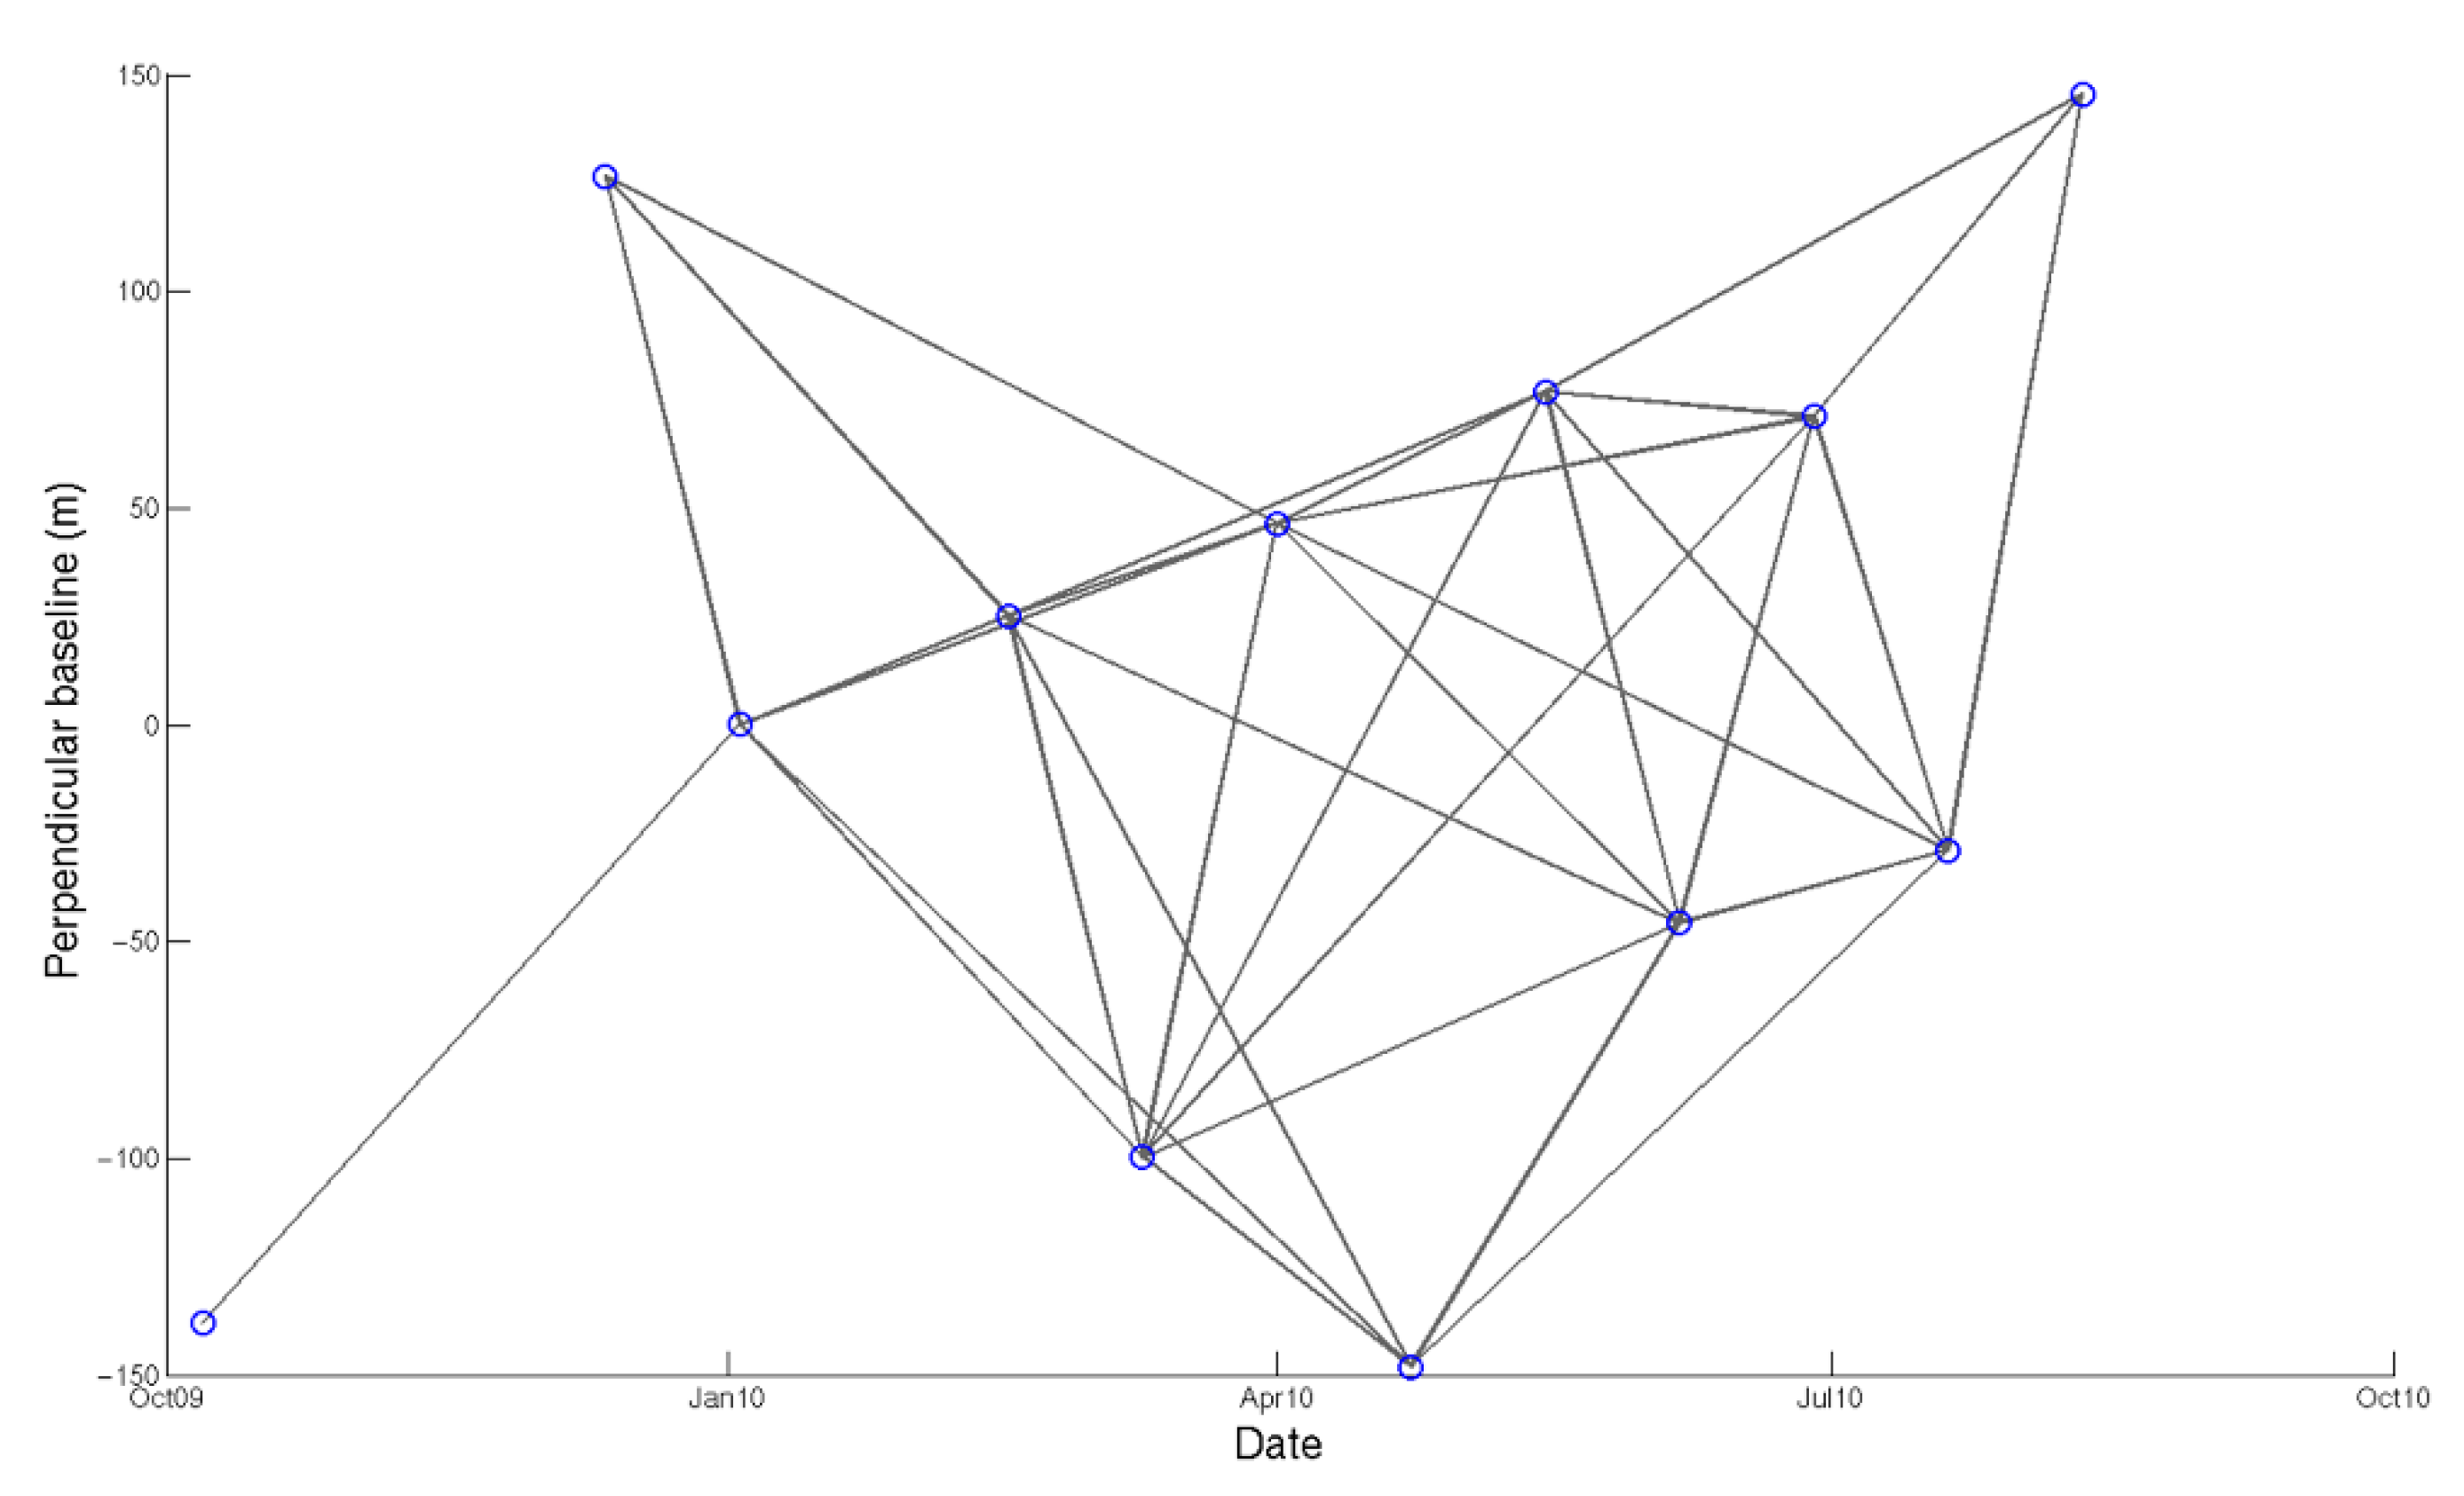
3.1. Interferogram Formation

The first key step of the StaMPS-SB method is to generate the interferograms. A coregistration algorithm is applied to reduce the coregistration errors owing to long perpendicular baselines [33]. In order to minimize the temporal and spatial decorrelation, interferometric pairs with small temporal and perpendicular baselines are selected to generate interferograms. Decorrelation is further reduced by spectral filtering in range and discarding of the non-overlapping Doppler frequencies in azimuth [39]. Specifically, we imposed 33 interferograms generated from the 12 TerrSAR-X datasets by using DORIS (Delft Object-oriented Radar Interferometric Software), with a perpendicular baseline constraint of 180 m and a maximum temporal baseline of 110 days (Figure 2). After the interferograms generation, we used 30 m resolution SRTM DEM to remove the topographic phase contribution from the interferometric phase and geocode interferograms.

3.2. SDFP Pixel Identification

StaMPS-SB method performs time-series analysis on the pixels whose filtered phase decorrelates little over short time intervals, referred to as slowly-decorrelating filtered phase (SDFP) pixels [39].
For the consideration of the computational cost, initial SDFP pixels candidates are selected by setting a threshold (0.6) for the amplitude difference dispersion, which is the standard deviation of the amplitude difference between the master and slave divided by the mean amplitude [39].
Then, the spatial correlation of interferometric phase analysis is applied to identify SDFP pixels from the candidates. The wrapped phase Φ i n t , x , i , of the xth pixel in the ith “flattened” and topographically corrected interferogram can be expressed as the sum of the phase change due to deformation in the satellite line-of-sight (LOS) direction Φ d e f , x , i , the phase due to the difference in atmospheric retardation between passes Φ a t m , x , i , the residual phase due to orbit inaccuracies Δ Φ o r b , x , i , the residual phase due to look angle error Δ Φ θ , x , i , and the noise term due to variability in scattering, thermal noise, coregistration errors and uncertainty in the position of the phase center in azimuth Φ n , x , i :
Φ i n t , x , i = W { Φ d e f , x , i + Φ a t m , x , i + Δ Φ o r b , x , i + Δ Φ θ , x , i + Φ n , x , i }
where W{ · } is a wrapping operator. The SDFP pixels are those for which | Φ n , x , i | is small enough that it does not completely obscure the signal, so Φ n , x , i is required to estimate accurately to identify SDFP pixels. For this purpose, the first four terms on the right-hand of Equation (1) must be estimated and subtracted from the wrapped phase. A bandpass filtering of surrounding pixels in the frequency domain is adopted to estimate the spatially-correlated look angle (SCLA) error, including the phase due to ground deformation ( Φ d e f , x , i ), variation in atmospheric delay ( Φ a t m , x , i ), orbital inaccuracies ( Δ Φ o r b , x , i ) and spatially correlated DEM error ( Δ Φ θ , x , i c ). The spatially uncorrelated look angle (SULA) error term ( Δ Φ θ , x , i u ) which is mainly caused by spatially uncorrelated DEM error and deviation of the pixel’s phase center from physical center of the backscattering object, is then estimated by an inversion associated with its correlation with perpendicular baseline. Subtracting these estimates from the interferometric phase, we get an estimate of Φ n , x , i which is then characterized with a measure similar to coherence, referred to as γ x , and the candidate pixels with low γ x are rejected. The procedure is adopted iteratively until γ x is converged, and a set of SDFP pixels are finally identified [33,39].

3.3. 3-D Phase Unwrapping and Time-Series Deformation Retrieval

The three-dimensional phase unwrapping algorithm proposed by Hooper [40,41] is applied on the sets of SDFP pixels to recover the unambiguous phase values. In order to unwrap correctly, the spatially uncorrelated contribution needs to be subtracted before unwrapping. After phase unwrapping, spatial and temporal bandpass filtering is applied to remove the spatially correlated contributions. Finally, the displacement time series for each SDFP pixel is obtained by least-squares inversion [39]. Deformation rate and displacement time series for each SDFP pixel are finally calibrated to a stable reference point which corresponds to the WUHN International GNSS Service (IGS) station located in Wuhan University (114.357259°E, 30.531654°N).

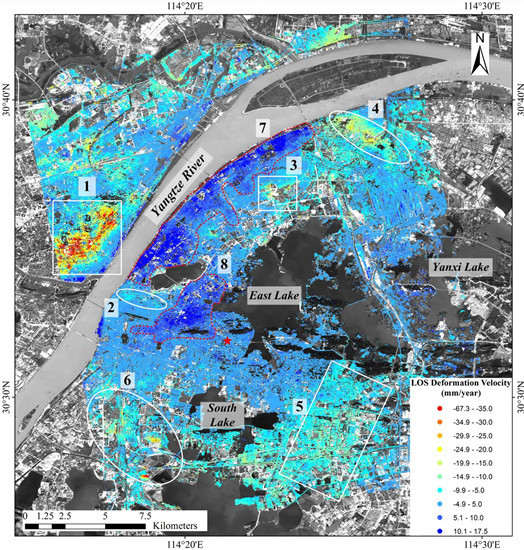
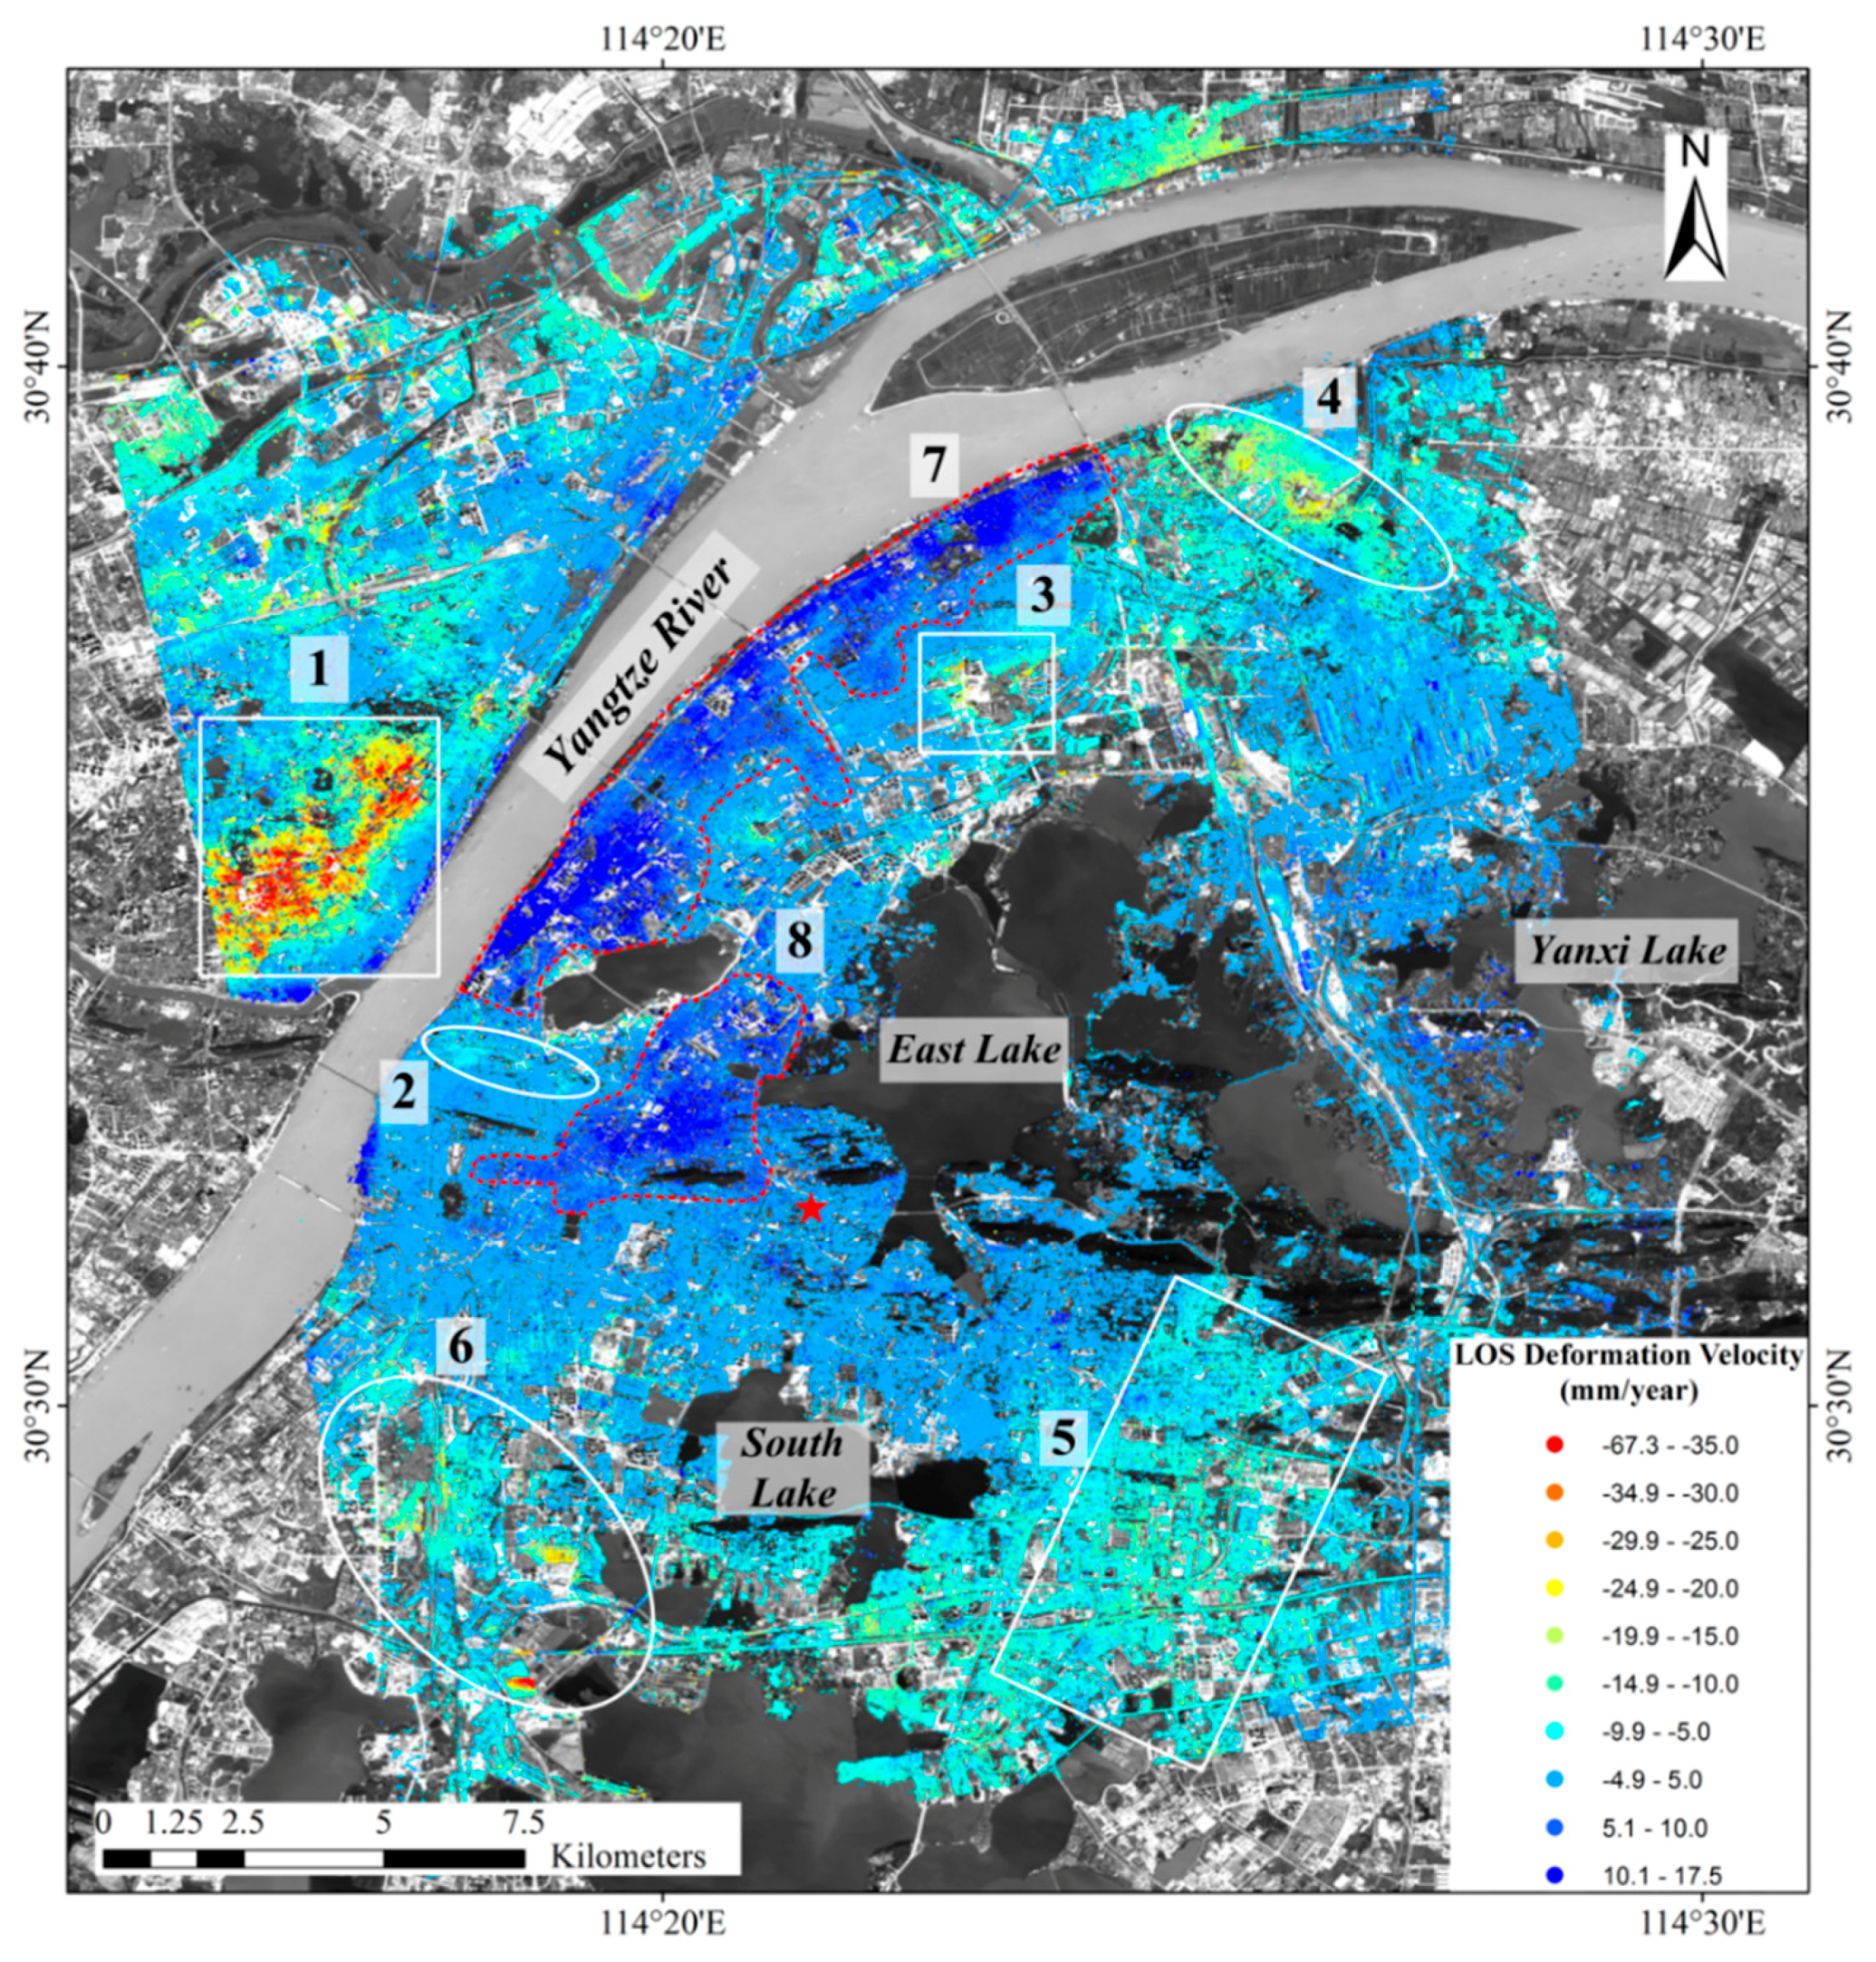
4. Results and Interpretations

4.1. InSAR-Derived Results and Validation

A total of more than one million SDFP pixels were ultimately identified and exploited by means of the StaMPS-SB time-series analysis for the 12 TerraSAR-X images, with an average density of ~1933 SDFP pixels/km2. Figure 3 illustrates the spatial distribution of the SDFP pixels and the corresponding linear deformation velocity in the radar line-of-sight (LOS) direction. The annual deformation rates of SDFP pixels relative to the reference point range from −67.3 mm/year to +17.5 mm/year.
Heterogeneous land subsidence patterns are widely found in major urban areas of Wuhan, mostly concentrated in commercial zones in Hankou (Zone 1), industrial zones around Wuhan Iron and Steel Corp. in Qingshan (Zone 3) and the Donghu New Technology Development Zone (Zone 5) in Wuchang, as well as occurring in karst carbonate areas in Wuchang and Qingshan districts (Zone 2, 4 and 6, respectively). Causes for the observed subsidence could be generally divided into two categories of urban development (for Zone 1, 3 and 5) and karst geology (for Zone 2, 4 and 6). More detailed analysis of possible causes for land subsidence in these zones will be presented in next sub-sections. It is worth noting that exceptional land-uplift signals, with deformation rates ranging mostly from +5 to +17.5 mm/year, are detected along both banks of Yangtze River especially along the southern bank (Zone 7), and also in urban areas located on one sector of a carbonate rock belt between Yangtze River and East Lake (Zone 8). A possible explanation for this anomalous phenomenon in two uplift zones will be discussed in Section 5.
An accuracy assessment of the InSAR-derived deformation results was performed by comparing them against the precise levelling measurements as descripted in Section 2. To enable the comparison, the levelling measurements have been projected along radar LOS direction and interpolated via a linear fit within the acquisition period of the InSAR observations. A comparison method used in an InSAR validation project of European Space Agency named as PSIC4 [42] was applied to the accuracy assessment. In this study the comparison was carried out between each levelling point and all SDFP pixels located within a circle with 50 m radius around the corresponding levelling point. Results suggest that the InSAR-derived deformation rates agreed well with the levelling survey measurements with an average absolute difference of 3.1 mm/year and standard deviation of 1.8 mm/year.

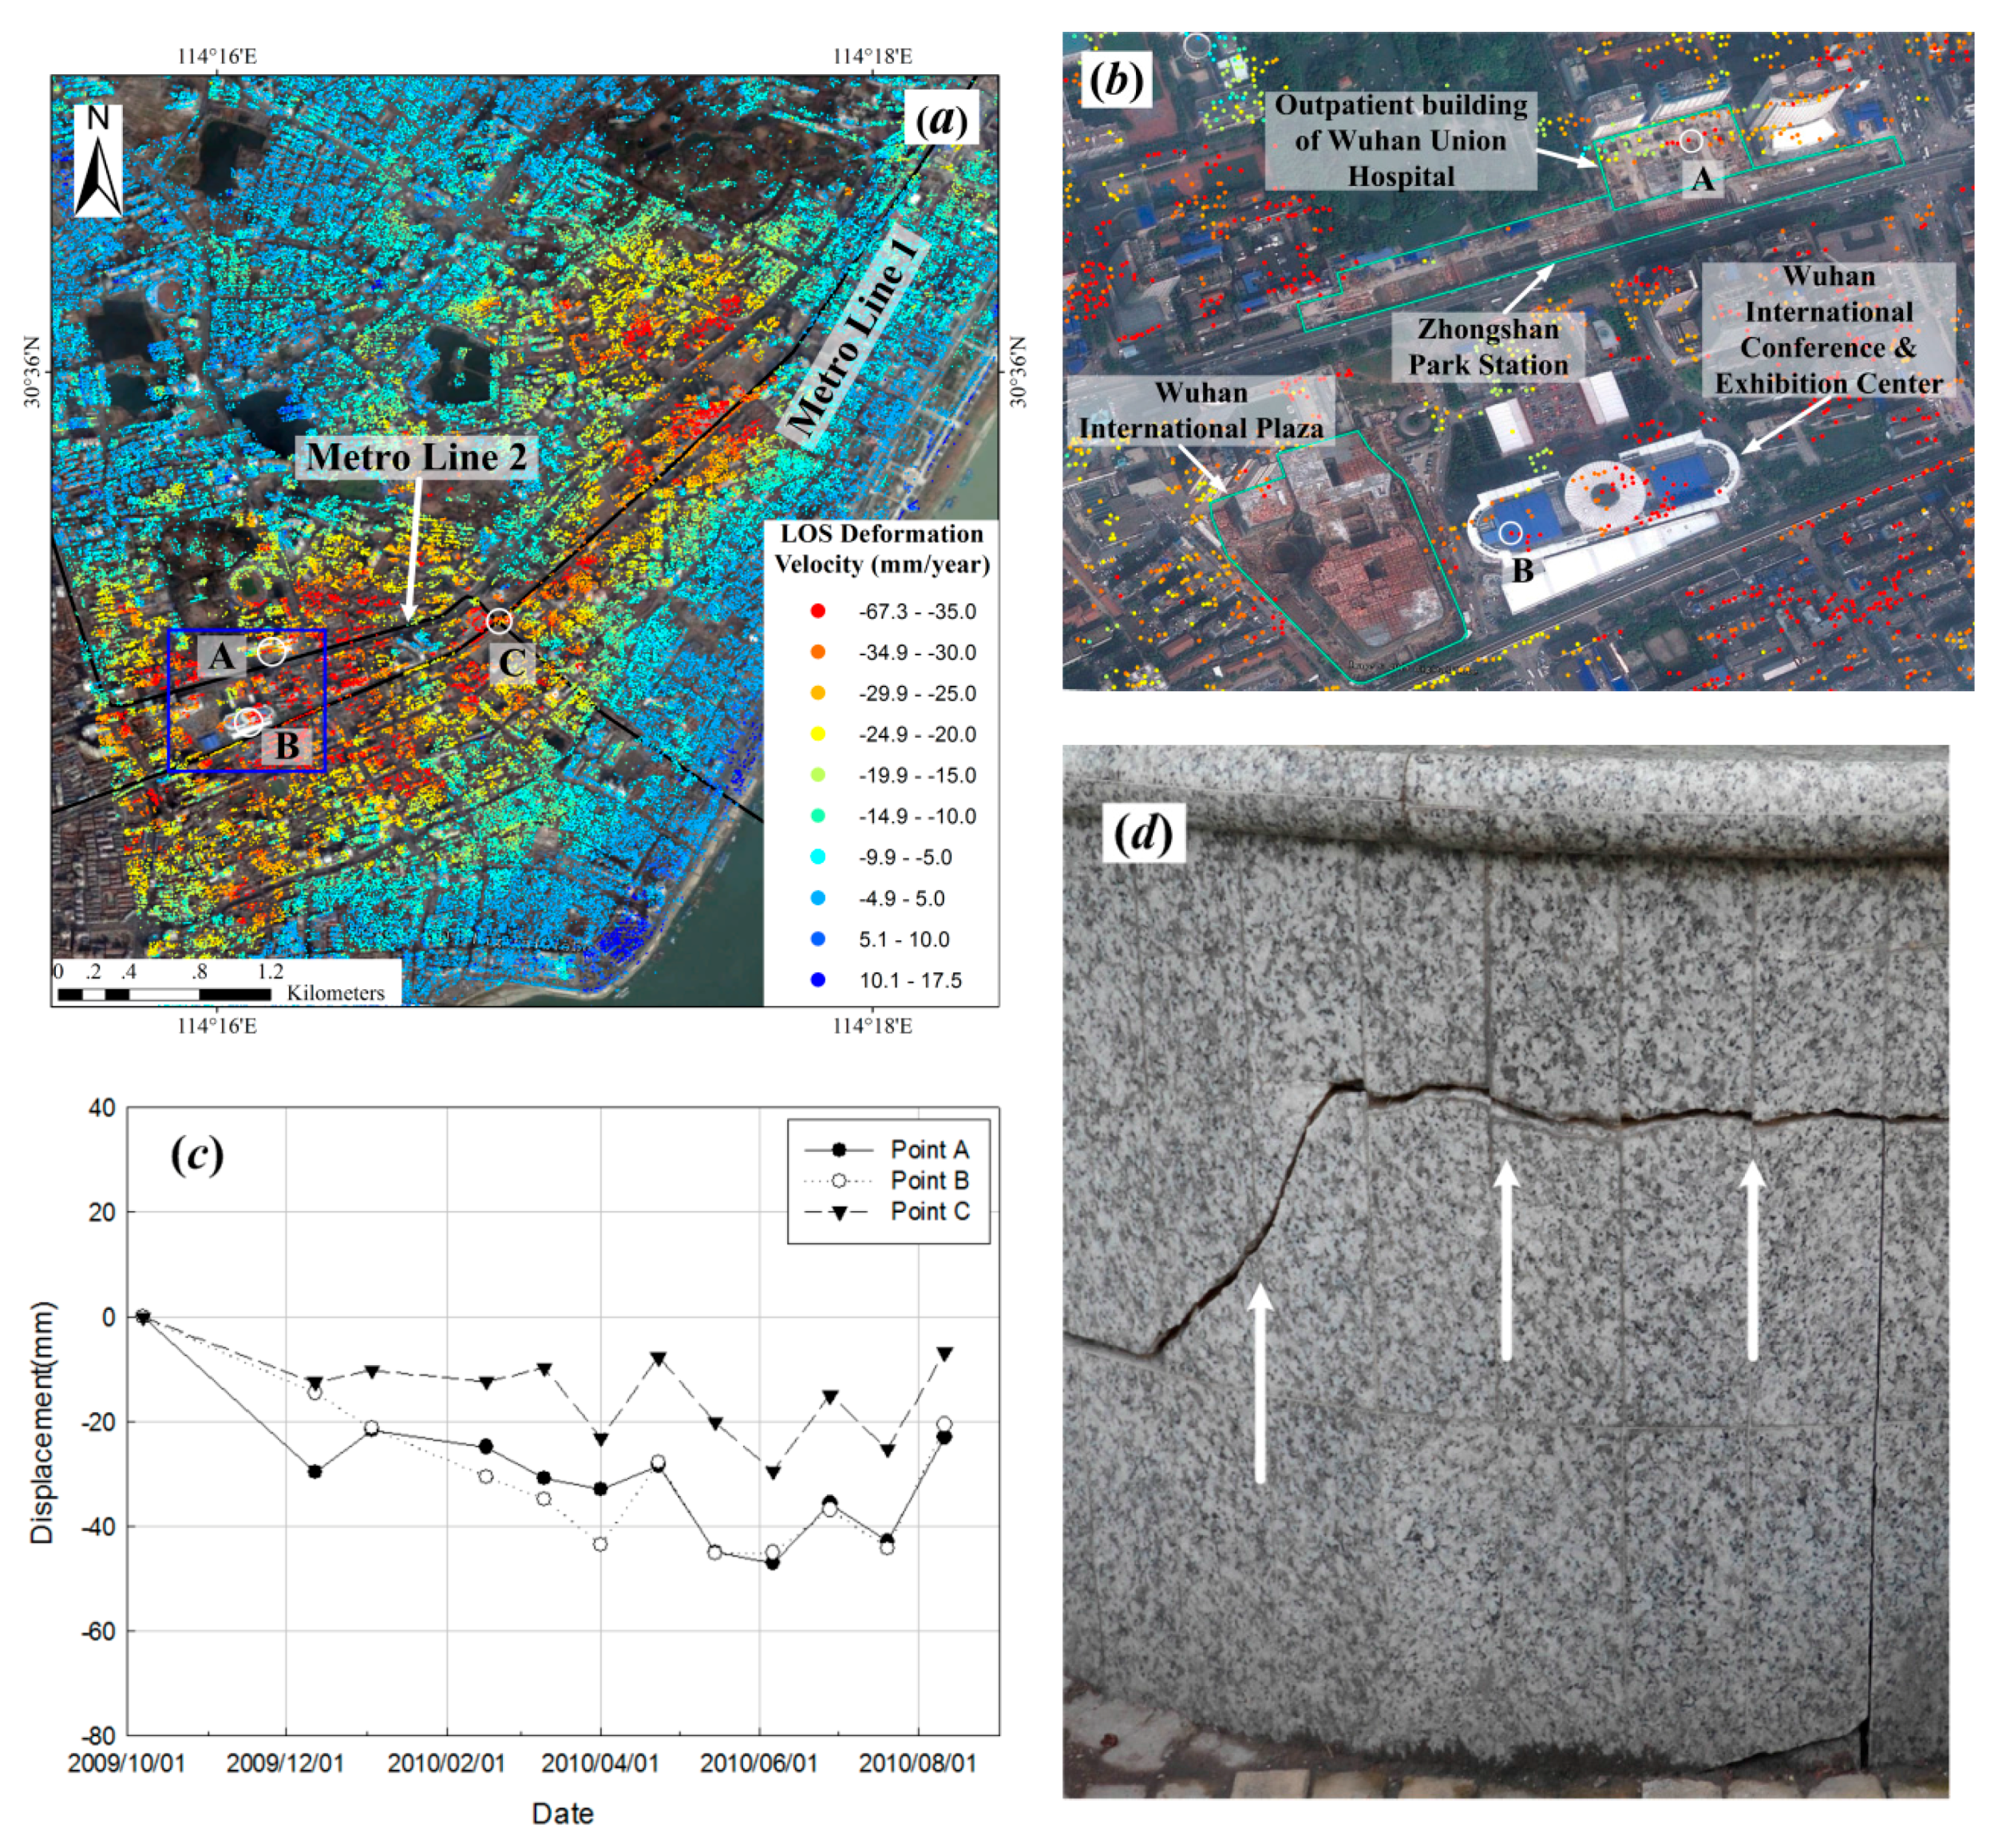
4.2. Subsidence Caused by Urban Development

As shown in Figure 3, major commercial zones in Hankou, industrial zones around Wuhan Iron and Steel Corp. and the Donghu New Technology Development Zone exhibit wide and continuous coverage of land subsidence, which are most likely attributed to ground water over-exploitation due to growing demand for intensive municipal constructions and industrial production in these regions.
In particular, a distinct subsidence bowl with a maximum subsidence rate of −67.3 mm/year is detected in the central urban area in Hankou (Zone 1 as show in Figure 3). Thus, we select this subsiding region for a more detailed analysis of the relationship between urban development and resulting land subsidence. Figure 4 illustrates a zoomed deformation rate map of this region (white rectangle 1 in Figure 3). A serious subsidence was detected in these areas in high densities of SDFP pixels from the InSAR results. In Zone 1, extensive urban construction activities were undertaken during the period of SAR imagery acquisitions, typically including the Metro Line 2 tunneling as well as large-scale building constructions such as the outpatient building of Wuhan Union Hospital and Wuhan International Plaza (see Figure 4b). Furthermore, Figure 4c presents the deformation time series corresponding to three pixels (labelled in Figure 4a as Point A, B and C), located on buildings near the Wuhan Union Hospital, the Wuhan International Conference & Exhibition Center and in the vicinity of levelling benchmarks in the Xunlimen Station of Metro Line 2, respectively. The subsidence of Point B is also testified by an in situ photograph of the building (shown in Figure 4d), and the subsidence rate of Point C consists with measurements of levelling surveys at the Xunlimen Station (−14.7 mm/year vs. −11.6 mm/year).
Moreover, most subsiding areas of Zone 1 as shown in Figure 4a are situated at an alluvial plane formed by soft sediment soils of Yangtze and Han rivers as well as lakes. The alluvial deposits in this region are characterized by a highly compressible layer of silt and clay typically with a depth of 5~30 m below the ground surface [11], and therefore can easily lead to heterogeneous subsidence as a result of external load on the soft soils due to intensive construction of infrastructure and buildings.

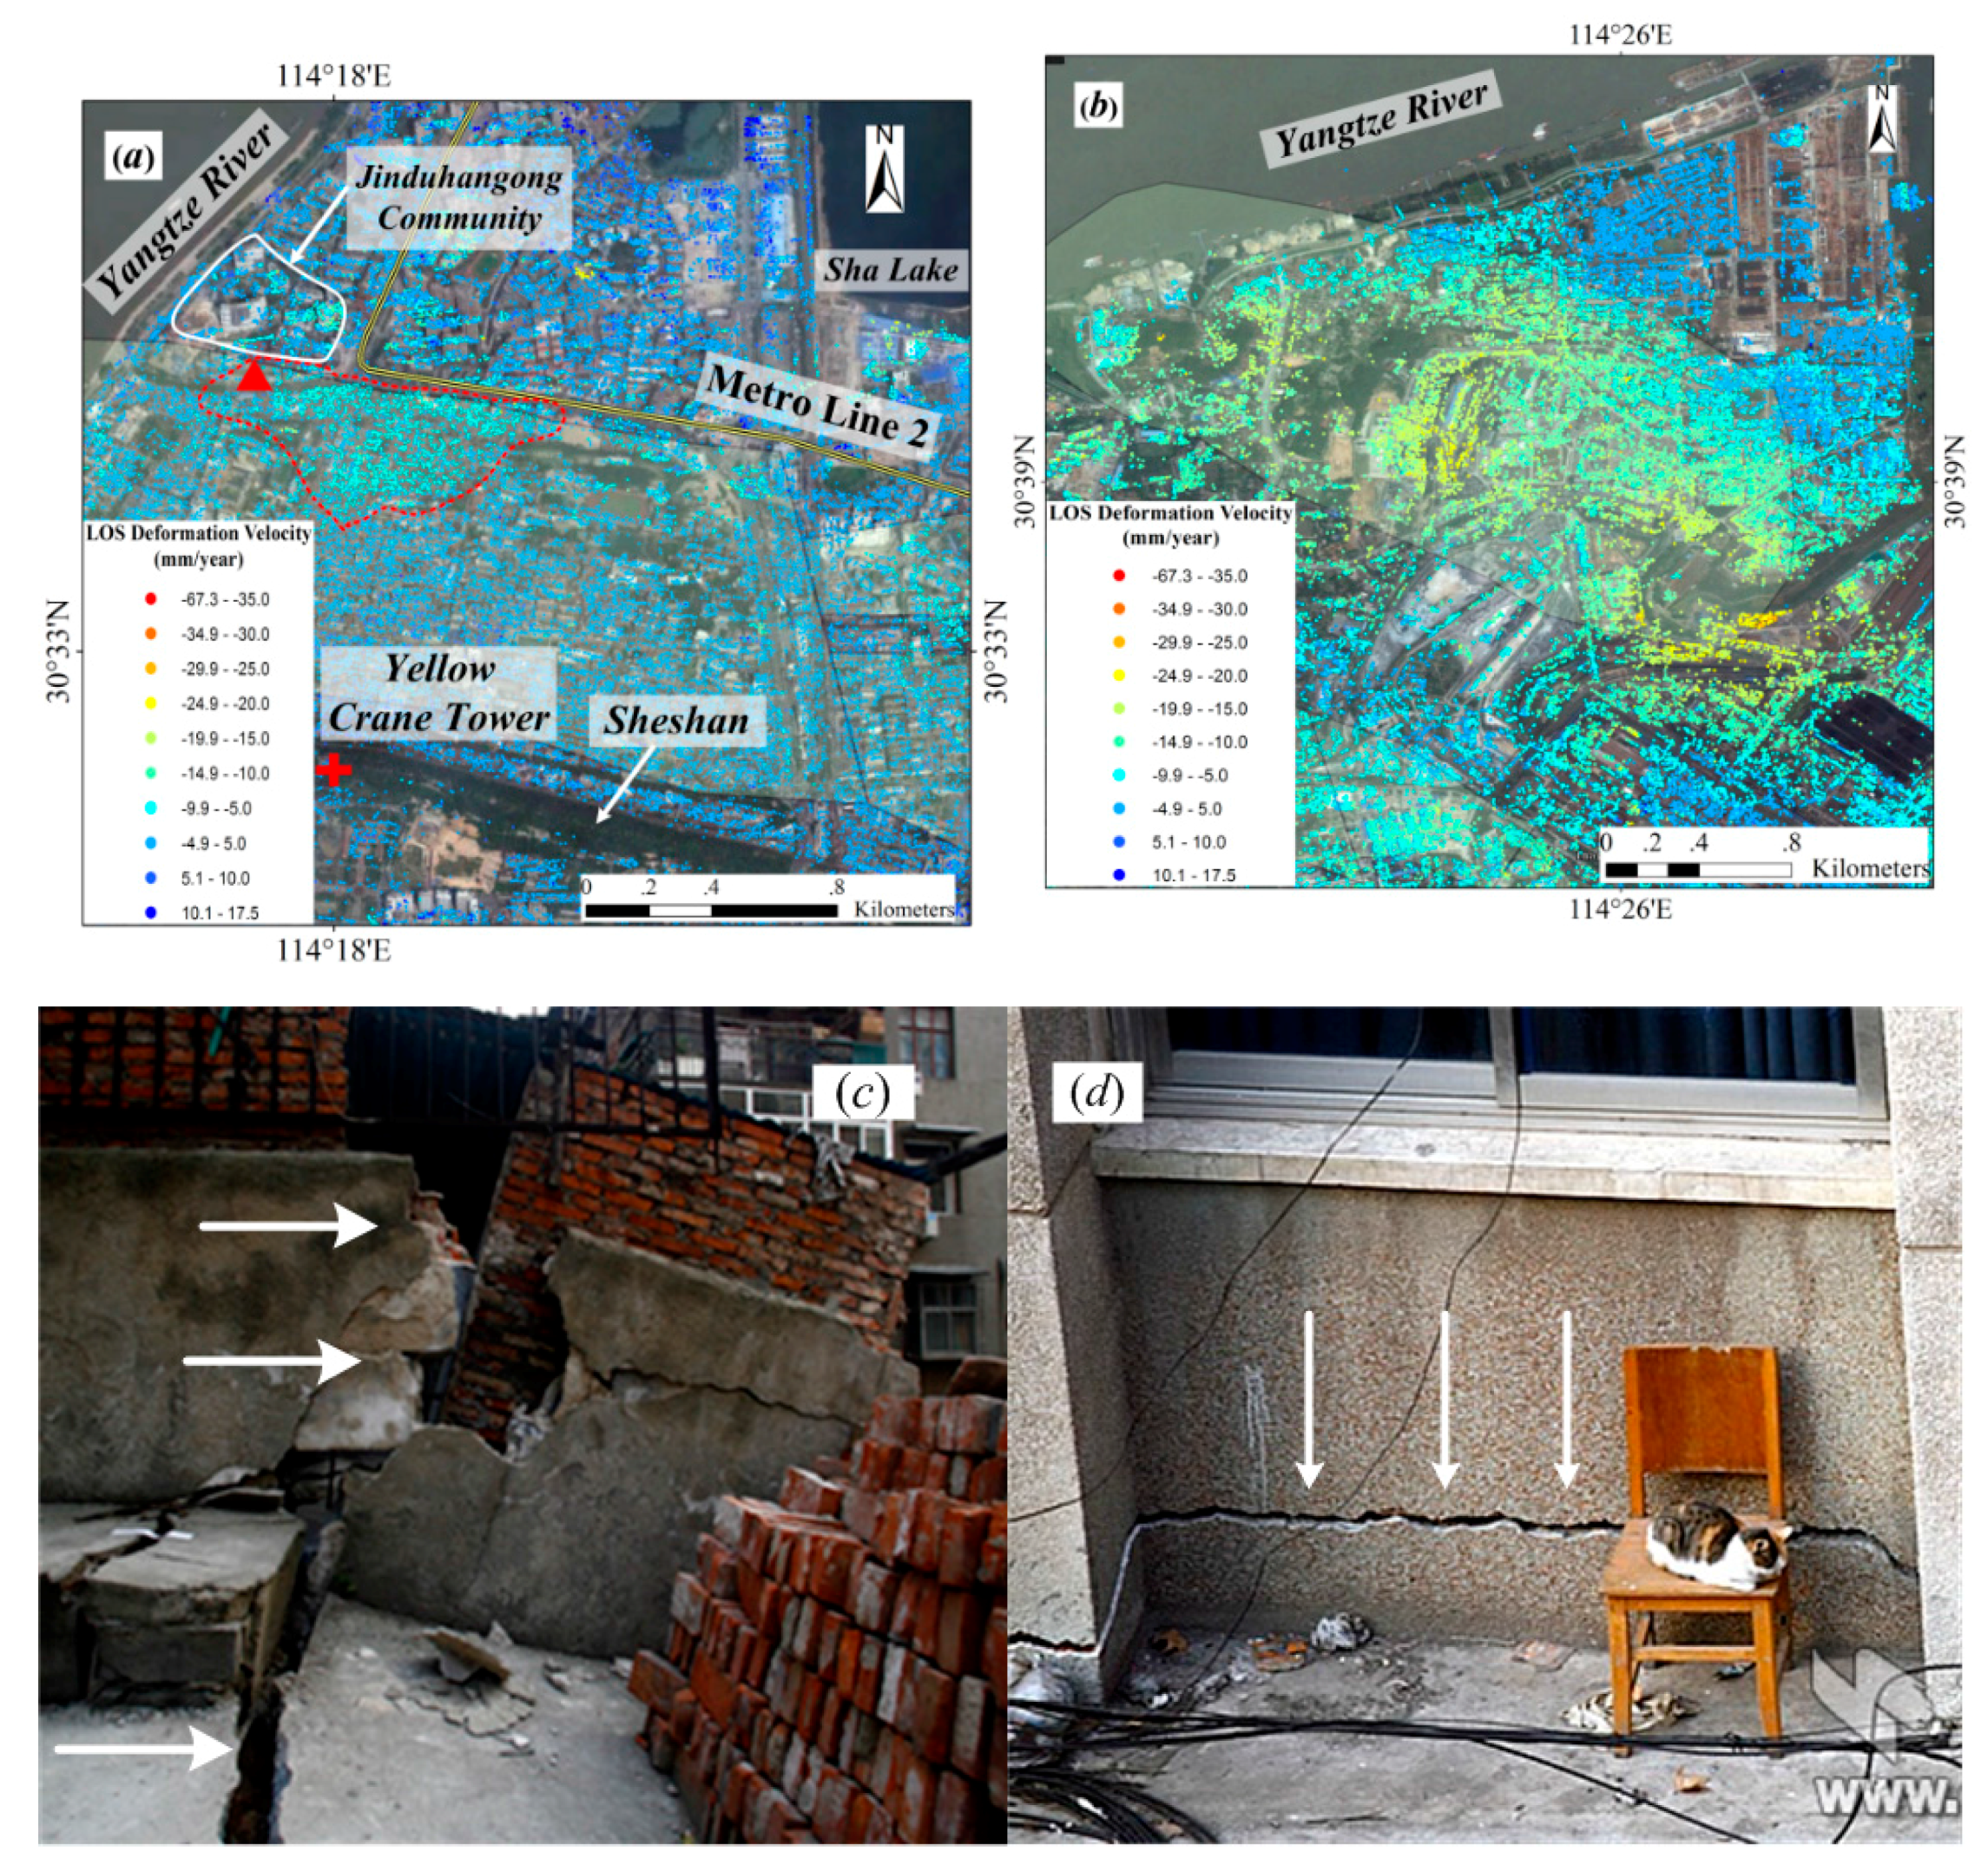
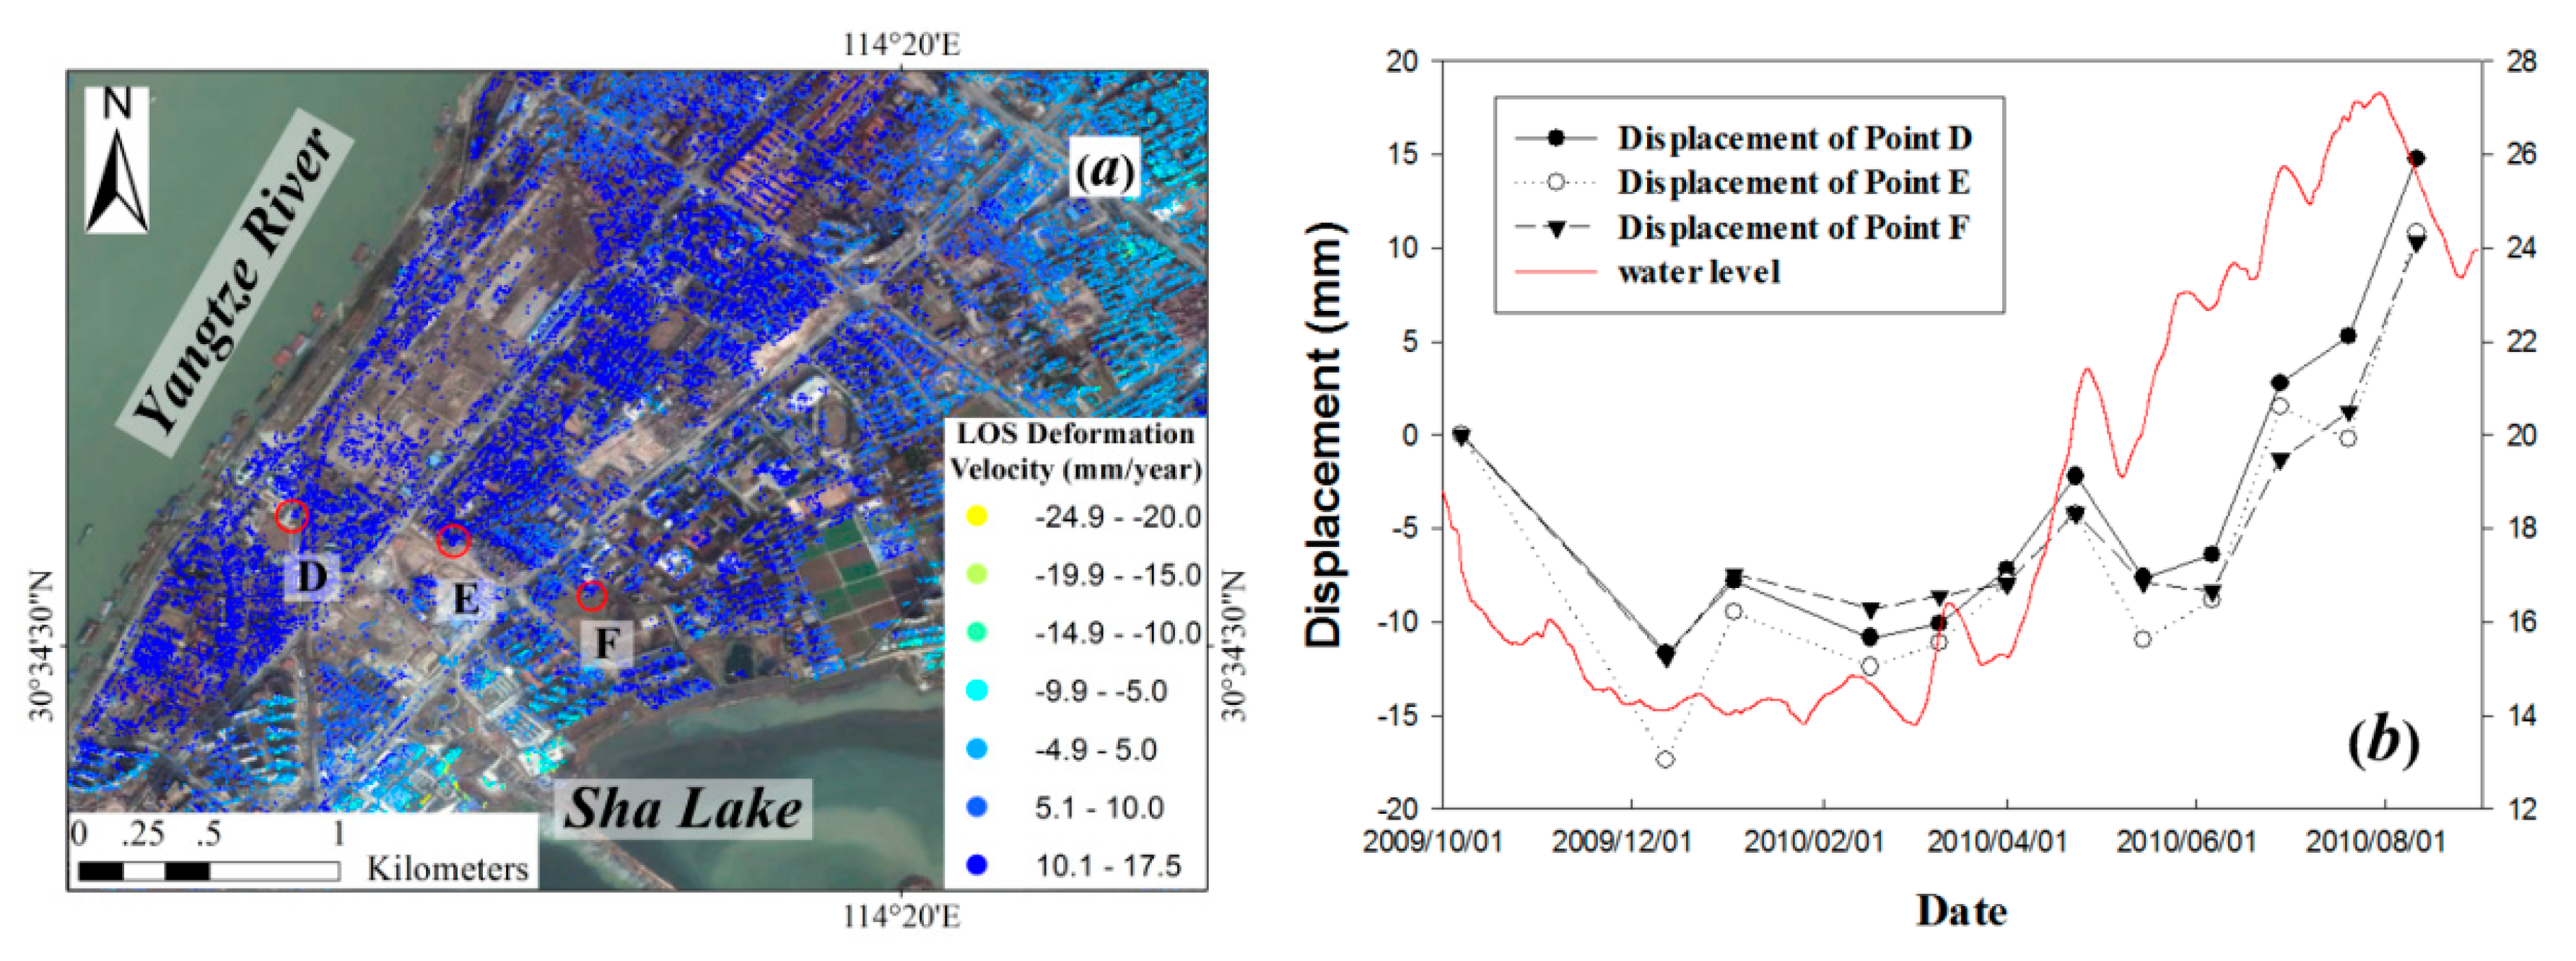
4.3. Subsidence Related to Carbonate Karstification

In Figure 3, we can notice a strong spatial correlation between land subsidence variations and distributions of the known karst inventory (see Figure 1). Subsiding areas associated with carbonate karst geology are mainly identified in Zone 2, 4 and 6 (see Figure 3) which are close to the Yangtze River and located in three major carbonate rock belts named Tianxingzhou, Daqiao, and Baishazhou, respectively. In these carbonate belts, various karst types of solution fissures, grooves and sinks as well as small caves are extensively developed, where the karst cave encountering rate of boreholes is about 46.0%~50.1%, and about 30% of karst caves are unfilled or half-filled [43]. This shallow carbonate karstification can provide a channel for loss of the upper sandy soil if hydraulic variations of groundwater frequently occur in the vertical and horizontal karst seepage zones [44]. In particular, there is a close hydraulic connection between the karst subsurface water and the Yangtze River, and consequently, the active water level variations of the river, especially during wet/flood seasons [35], promote the dissolution of carbonate rocks and amplify karst subsidence or collapses.
Figure 5a,b illustrate the zoomed deformation rate maps of Zone 2 and Zone 4, two representative karst-impacted sites corresponding to residential and industrial contexts, respectively. In Figure 5a, heterogeneous subsidence signals (−5~−15 mm/year) are detected in Zone 2, which includes several urban blocks near Yellow Crane Tower situated on Sheshan (Snake Hill), one of the most renowned cultural towers in China. Moderate subsidence recoded in the deformation rate map is restricted to the western sector of the karst area, with maximum LOS displacement rates of −10 mm/year. This subsiding area has suffered severe karst collapses in recent years, triggered by groundwater variations due to building construction in the neighboring Jinduhangong community [45]. Some of the damage observed in the facades of the buildings and paved surfaces during the collapse event in 2011 are illustrated in Figure 5c,d.
Comparing with the heterogeneous subsidence pattern in the Zone 2, a relatively significant and spatially continuous ground settlement, with LOS deformation rates from −10 to −30 mm/year, can be found in Zone 4 (see Figure 5b). These karstification-related subsiding areas, located in a major industrial region of Wuhan, contain some of production bases of SINOPEC Wuhan Company and Wuhan Iron and Steel Corp. (Wuhan, China). Therefore, we suggest that dissolution of shallow carbonate rocks is a major cause for land subsidence in the Zone 4 that might be compounded by possible groundwater over-extraction for industrial production demands.

5. Discussion

It is noted that a remarkable ground uplift phenomenon has been detected in both bank areas of Yangtze River, especially along the southern bank (see Zone 7 in Figure 3), with deformation rates ranging from +5 to +17.5 mm/year. Here this exceptional uplift signal is highlighted in a zoomed deformation velocity map in Figure 6a for a representative site of the Zone 7 that is located on the bank sector between the River and the Sha Lake, and is further illustrated in Figure 6b by the deformation time series corresponding to the SDFP points (labelled in Figure 6a).
Due to a good spatial correlation between the deformation signals and the river locations, the most likely cause for the ground deformation observed in these areas is groundwater discharges and recharges related to seasonal fluctuations in water levels of the Yangtze River. In fact, this strong relationship between mass movements of river banks (e.g., ground deformations, bank erosions or landslides) and hydrological processes involving both the magnitude and frequency rainfall events and the seasonal fluctuations of river water levels have been emphasized by previous studies in China [46] and worldwide [47,48,49,50]. Consequently, comparing the LOS displacement histories of these mentioned SDFP points and the water level changes of Yangtze River during the study period, we can observe a coherent temporal correlation of variations and amplitudes between them (see Figure 6b). For this study, we notice a 5 m decrease of the river water level measured in the dry season between autumn 2009 and spring 2010, which corresponds to a mean cumulative deformation of about −10 mm at three SDFP points. However, a significant change of the deformation direction occurred around the lowest water stand in early March 2010, and an accelerating uplift from the beginning of the wet season in Wuhan lasted until 11 August 2010 when the maximum value of cumulative uplift reached approximately 15 mm, following the peak of water levels amounting to 27.3 m on 30 July 2010.
In addition, a similar deformation behavior with the southern bank of the Yangtze River is found in the Zone 8 near Hongshan Square (see Figure 3), which is situated in a sector of the carbonate rock belt named Daqiao between Yangtze River and East Lake. We suggest that the seasonal fluctuations of river water levels might partially contribute to ground deformation variations in this area. However, it is difficult to provide a comprehensive explanation for this deformation phenomenon due to relatively complex hydrological-conditions in this area, because ground water and pore water pressure data are not available for this study.

6. Conclusions

In this work, we applied StaMPS-based multi-temporal InSAR methodology to high-resolution TerraSAR-X images from 2009 to 2010 to detect ground deformation in Wuhan, and provided detailed information on spatiotemporal characterization of land subsidence and uplift in this region, for the first time. The results of accuracy assessment suggest that the InSAR-derived deformation rates agreed well with the levelling survey measurements with an average absolute difference of 3.1 mm/year and standard deviation of 1.8 mm/year. We found that noticeable land subsidence occurred widely in major urban areas of Wuhan and the average measured rates of subsidence ranged from approximately −5 mm/year to −67.3 mm/year during the period of observation. These subsiding areas were mostly concentrated in six commercial and industrial zones in Hankou and Wuchang districts, as well as three karst carbonate belts in Wuchang and Qingshan districts. The main contributing factors to the detected land subsidence include anthropogenic activities, natural compaction of soft soil, and karst dissolution of subsurface carbonate rocks. However, anthropogenic activities, such as intensive municipal construction (e.g., building and subway tunneling) and industrial production, have more significant impacts on the measured subsidence rates than natural factors. Moreover, remarkably secular uplift signals were detected along both banks of theYangtze River, especially along the southern bank, with deformation rates ranging mostly from +5 mm/year to +17.5 mm/year. A strong temporal correlation is highlighted between the detected displacement time series and the water level records of the Yangtze River, suggesting that this previously unknown deformation phenomenon in Wuhan is likely related to seasonal fluctuations in the water levels of the Yangtze River.
This study demonstrates the potential of multi-temporal InSAR analysis of high-resolution SAR datasets for ground deformation monitoring in Wuhan, which is characterized by vulnerable hydrological environments and complex deformation regimes. The InSAR-derived results also indicate an urgent demand for regular and large-scale monitoring of deformation-relevant geohazards in this region, which could help not only to better characterize the development of catastrophic hazards relevant to ground deformation but to recognize previously unknown deformation problems, such as instability and collapse of Yangtze River embankments. In the near future, more acquisitions of SAR images (e.g., TerraSAR-X, Sentinel-1) and more ground observations, especially hydrological and meteorological data, will be collected, meaning a further joint analysis of multidisciplinary data could be carried out to thoroughly study such complicated ground deformation phenomena in this study area.

Acknowledgments

The work in this study was supported by the National Natural Science Foundation of China (No. 41590854, 41274024, 41431070, 41321063), the National Basic Research Program of China (No. 2012CB957702) and the Hundred Talents Program of The Chinese Academy of Sciences (No. Y205771077). The authors would like to thank DLR for providing the TerraSAR-X images via the TerraSAR-X AO project (No. MTH1827), TU Delft for providing the DORIS software, Hooper at the University of Leeds for providing the StaMPS software, and Li Gang at the Chinese University of Hong Kong for the helpful advice in the data processing.

Author Contributions

Lin Bai designed the study and wrote the manuscript, Liming Jiang supervised the study and reviewed the manuscript, and Hansheng Wang and Qishi Sun contributed to the discussions.

Conflicts of Interest

The authors declare no conflict of interest.

References

  1. He, Q.; Ye, X.; Li, Z.; Liu, W. The status and prevention strategy of land subsidence in China. Geol. J. China Univ. 2006, 12, 161–168. (In Chinese) [Google Scholar]
  2. Miller, M.M.; Shirzaei, M. Spatiotemporal characterization of land subsidence and uplift in Phoenix using InSAR time series and wavelet transforms. J. Geophys. Res. Solid Earth 2015, 120, 5822–5842. [Google Scholar] [CrossRef]
  3. Jiang, L.; Lin, H.; Cheng, S. Monitoring and assessing reclamation settlement in coastal areas with advanced InSAR techniques: Macao city (China) case study. Int. J. Remote Sens. 2011, 32, 3565–3588. [Google Scholar] [CrossRef]
  4. Perissin, D.; Wang, T. Time-series InSAR applications over urban areas in China. IEEE J. Sel. Top. Appl. Earth Obs. Remote Sens. 2011, 4, 92–100. [Google Scholar] [CrossRef]
  5. Dai, K.; Liu, G.; Li, Z.; Li, T.; Yu, B.; Wang, X.; Singleton, A. Extracting vertical displacement rates in Shanghai (China) with multi-platform SAR images. Remote Sens. 2015, 7, 9542–9562. [Google Scholar] [CrossRef]
  6. Luo, Q.; Perissin, D.; Zhang, Y.; Jia, Y. L-and X-band multi-temporal InSAR analysis of Tianjin subsidence. Remote Sens. 2014, 6, 7933–7951. [Google Scholar] [CrossRef]
  7. Liu, P.; Li, Q.; Li, Z.; Hoey, T.; Wang, C. Land subsidence over oilfields in the Yellow River Delta. Remote Sens. 2015, 7, 1540–1564. [Google Scholar] [CrossRef]
  8. Qu, F.; Zhang, Q.; Lu, Z.; Zhao, C.; Yang, C.; Zhang, J. Land subsidence and ground fissures in Xi’an, China 2005–2012 revealed by multi-band InSAR time-series analysis. Remote Sens. Environ. 2014, 155, 366–376. [Google Scholar] [CrossRef]
  9. Jiang, L.; Lin, H.; Zhao, Q. Spatial and temporal deformation characteristics of marine alluvial deposits due to land reclamation: implications from InSAR observation and geotechnical estimate. Earth Surf. Process. Landf. 2010, 35, 331–343. [Google Scholar] [CrossRef]
  10. Fan, S. A discussion on karst collapse in Wuhan (Hubei). Resour. Environ. Eng. 2006, 20, 608–616. (In Chinese) [Google Scholar]
  11. Wu, B.; Peng, J.; Wang, Z.; Liu, J. An analysis on geographical backgrounds of disasters in China urban areas. J. Catastrophol. 1997, 1, 28–33. (In Chinese) [Google Scholar]
  12. Massonnet, D.; Rossi, M.; Carmona, C. The displacement field of the Landers earthquake mapped by radar interferometry. Nature 1993, 364, 138–142. [Google Scholar] [CrossRef]
  13. Peltzer, G.; Rosen, P. Surface displacement of the 17 May 1993 Eureka Valley, California, earthquake observed by SAR interferometry. Science 1995, 268, 1333–1336. [Google Scholar] [CrossRef] [PubMed]
  14. Massonnet, D.; Briole, P.; Arnaud, A. Deflation of Mount Etna monitored by spaceborne Radar interferometry. Nature 1995, 375, 567–570. [Google Scholar] [CrossRef]
  15. Salvi, S.; Atzori, S.; Tolomei, C.; Allievi, J. Inflation rate of the Colli Albani volcanic complex retrieved by the permanent scatterers SAR interferometry technique. Geophys. Res. Lett. 2004, 31. [Google Scholar] [CrossRef]
  16. Li, Z.; Zhao, R.; Hu, J.; Wen, L.; Feng, G.; Zhang, Z. InSAR analysis of surface deformation over permafrost to estimate active layer thickness based on one-dimensional heat transfer model of soils. Sci. Rep. 2015, 5, 1–9. [Google Scholar] [CrossRef] [PubMed]
  17. Kumar, V.; Venkataramana, G.; Høgda, K.A. Glacier surface velocity estimation using SAR interferometry technique applying ascending and descending passes in Himalayas. Int. J. Appl. Earth Obs. Geoinform. 2011, 13, 545–551. [Google Scholar] [CrossRef]
  18. Kimura, H.; Yamaguchi, Y. Detection of landslide areas using satellite radar interferometry. Photogramm. Eng. Remote Sens. 2000, 66, 337–344. [Google Scholar]
  19. Tomás, R.; Li, Z.; Lopez-Sanchez, J.M.; Liu, P.; Singleton, A. Using wavelet tools to analyse seasonal variations from InSAR time-series data: A case study of the Huangtupo landslide. Landslides 2015. [Google Scholar] [CrossRef]
  20. Cigna, F.; Osmanoğlu, B.; Cabral-Cano, E.; Dixon, T.H.; Ávila-Olivera, J.A. Monitoring land subsidence and its induced geological hazard with Synthetic Aperture Radar Interferometry: A case study in Morelia, Mexico. Remote Sens. Environ. 2012, 117, 146–161. [Google Scholar] [CrossRef]
  21. Bianchini, S.; Sandro, M. Analysis of recent ground subsidence in the Sibari plain (Italy) by means of satellite SAR interferometry-based methods. Int. J. Remote Sens. 2015, 36, 4550–4569. [Google Scholar] [CrossRef]
  22. Solari, L.; Ciampalini, A.; Raspini, F.; Bianchini, S.; Moretti, S. PSInSAR analysis in the Pisa Urban Area (Italy): A case study of subsidence related to stratigraphical factors and urbanization. Remote Sens. 2016, 8. [Google Scholar] [CrossRef]
  23. Ferretti, A.; Prati, C.; Rocca, F. Permanent scatterers in SAR interferometry. IEEE Trans. Geosci. Remote Sens. 2001, 39, 8–20. [Google Scholar] [CrossRef]
  24. Hooper, A.; Zebker, H.; Segall, P.; Kampes, B. A new method for measuring deformation on volcanoes and other natural terrains using InSAR persistent scatterers. Geophys. Res. Lett. 2004, 31. [Google Scholar] [CrossRef]
  25. Kampes, B.M. Displacement Parameter Estimation Using Permanent Scatterer Interferometry. Ph.D. Thesis, Delft University of Technology, Delft, The Netherlands, 2005. [Google Scholar]
  26. Mora, O.; Mallorqui, J.J.; Broquetas, A. Linear and nonlinear terrain deformation maps from a reduced set of interferometric SAR images. IEEE Trans. Geosci. Remote Sens. 2003, 41, 2243–2253. [Google Scholar] [CrossRef]
  27. Lanari, R.; Mora, O.; Manunta, M.; Mallorqui, J.; Berardino, P.; Sansosti, E. A small-baseline approach for investigating deformations on full-resolution differential SAR interferograms. IEEE Trans. Geosci. Remote Sens. 2004, 42, 1377–1386. [Google Scholar] [CrossRef]
  28. Schmidt, D.A.; Bürgmann, R. Time-dependent land uplift and subsidence in the Santa Clara valley, California, from a large interferometric synthetic aperture radar data set. J. Geophys. Res. Solid Earth 2003, 108, 1–13. [Google Scholar] [CrossRef]
  29. Perissin, D.; Wang, Z.; Lin, H. Shanghai subway tunnels and highways monitoring through Cosmo-SkyMed Persistent Scatterers. ISPRS J. Photogramm. Remote Sens. 2012, 73, 58–67. [Google Scholar] [CrossRef]
  30. Zhao, Q.; Lin, H.; Jiang, L.; Chen, F.; Cheng, S. A study of ground deformation in the Guangzhou urban area with persistent scatterer interferometry. Sensors 2009, 9, 503–518. [Google Scholar] [CrossRef] [PubMed]
  31. Heleno, S.I.; Oliveira, L.G.; Henriques, M.J.; Falcão, A.P.; Lima, J.N. Persistent Scatterers Interferometry detects and measures ground subsidence in Lisbon. Remote Sens. Environ. 2011, 115, 2152–2167. [Google Scholar] [CrossRef]
  32. Osmanoğlu, B.; Dixon, T.H.; Wdowinski, S.; Cabral-Cano, E.; Jiang, Y. Mexico City subsidence observed with persistent scatterer InSAR. Int. J. Appl. Earth Obs. Geoinform. 2011, 13, 1–12. [Google Scholar] [CrossRef]
  33. Hooper, A.; Segall, P.; Zebker, H. Persistent scatterer interferometric synthetic aperture radar for crustal deformation analysis, with application to Volcán Alcedo, Galápagos. J. Geophys. Res. Solid Earth 2007, 112, 1–21. [Google Scholar] [CrossRef]
  34. Xu, Y. Research on Buoyancy of Groundwater Based on Geological Conditions of Wuhan. Master’s Thesis, Wuhan University of Technology, Wuhan, China, 2010. [Google Scholar]
  35. Wu, Y.; Jiang, W.; Ye, H. Karst collapse hazard assessment system of Wuhan city based on GIS. In Proceedings of the 2010 International Symposium in Pacific Rim, Taipei, Taiwan, 26–30 April 2010.
  36. Luo, X. Division of “Six Belts and Five Types” of carbonate region and control of karst geological disaster in Wuhan. J. Hydraul. Eng. 2013, 45, 171–179. (In Chinese) [Google Scholar]
  37. Lian, B.; Hu, B.; Wang, X.; Liu, F.; Yu, H. Monitoring and numerical analysis on the foundation pit excavation for Mingdu Station of Wuhan subway. J. Yangtze River Sci. Res. Inst. 2014, 31, 34–38. (In Chinese) [Google Scholar]
  38. Ding, L.; Li, W.; Wu, X.; Zhou, C. Analysis of monitoring deep foundation pit for Xunlimen Station of Wuhan Metro. J. Railw. Eng. Soc. 2010, 9, 74–81. (In Chinese) [Google Scholar]
  39. Hooper, A. A multi-temporal InSAR method incorporating both persistent scatterer and small baseline approaches. Geophys. Res. Lett. 2008, 35. [Google Scholar] [CrossRef]
  40. Hooper, A.; Zebker, H.A. Phase unwrapping in three dimensions with application to InSAR time series. J. Opt. Soc. Am. A 2007, 24, 2737–2747. [Google Scholar] [CrossRef]
  41. Hooper, A. A statistical-cost approach to unwrapping the phase of InSAR time series. In Proceeding of the 2010 International Workshop on ERS SAR Interferometry, Frascati, Italy, 30 November–4 Dcember 2010.
  42. Raucoules, D.; Bourgine, B.; De Michele, M. Validation and intercomparison of Persistent Scatterers Interferometry: PSIC4 project results. J. Appl. Geophys. 2009, 68, 335–347. [Google Scholar] [CrossRef]
  43. Luo, X. Features of the shallow karst development and control of karst collapse in Wuhan. Carsol. Sin. 2013, 4, 419–432. (In Chinese) [Google Scholar]
  44. Gutiérrez, F.; Parise, M.; De Waele, J.; Jourde, H. A review on natural and human-induced geohazards and impacts in karst. Earth-Sci. Rev. 2014, 138, 61–88. [Google Scholar] [CrossRef]
  45. Zhong, Y.; Zhang, M.; Pan, L. Risk assessment for urban karst collapse in Wuchang District of Wuhan based on GIS. J. Tianjin Norm. Univ. (Nat. Sci. Ed.) 2015, 35, 48–53. (In Chinese) [Google Scholar]
  46. Jian, W.; Xu, Q.; Yang, H.; Wang, F. Mechanism and failure process of Qianjiangping landslide in the Three Gorges Reservoir, China. Environ. Earth Sci. 2014, 72, 2999–3013. [Google Scholar] [CrossRef]
  47. Bányai, L.; Mentes, G.; Újvári, G.; Kovács, M.; Czap, Z. Recurrent landsliding of a high bank at Dunaszekcső, Hungary: Geodetic deformation monitoring and finite element modeling. Geomorphology 2014, 210, 1–13. [Google Scholar] [CrossRef]
  48. Fox, G.A.; Wilson, G. The role of subsurface flow in hillslope and stream bank erosion: A review. Soil Sci. Soc. Am. J. 2010, 74, 717–733. [Google Scholar] [CrossRef]
  49. Rinaldi, M.; Casagli, N.; Dapporto, S.; Gargini, A. Monitoring and modelling of pore water pressure changes and riverbank stability during flow events. Earth Surf. Process. Landf. 2004, 29, 237–254. [Google Scholar] [CrossRef]
  50. Újvári, G.; Mentes, G.; Bányai, L.; Kraft, J.; Gyimóthy, A.; Kovács, J. Evolution of a bank failure along the River Danube at Dunaszekcső, Hungary. Geomorphology 2009, 109, 197–209. [Google Scholar] [CrossRef]
Figure 1. The geographic location and simplified geological setting of the study area. The distributions of carbonate belts are redrawn from Luo [36]. L1, L2 and L3 represent three major carbonate rock belts named Tianxingzhou, Daqiao and Baishazhou, respectively. The red rectangle is the study area’s extent. The red triangle represents the location of the levelling points, situated around Xunlimen Station in Hankou district and Mingdu Station in Hongshan district.
Remotesensing 08 00350 g001
Figure 2. Temporal/perpendicular baseline plots for TerraSAR-X images and interferograms used for the analysis. The blue circles represent the 12 TerraSAR-X images and the gray lines represent the 33 individual interferograms.
Remotesensing 08 00350 g002
Figure 3. The mean LOS deformation velocity map over the study area during the period from October 2009 to August 2010. The red star represents the location of the reference point. White rectangles indicate Zone 1, 3 and 5 where land subsidence was mainly caused by urban development. White ellipses indicate Zone 2, 4 and 6 where land subsidence was mainly caused by karst geology. Red dotted polygons indicate Zone 7 and 8 where the uplift occurs. This result is superimposed on a Landsat 8 image.
Remotesensing 08 00350 g003
Figure 4. Mean LOS deformation rate map superimposed on Google Earth image over (a) Zone 1; (b) the area highlighted in Figure 4a (blue box), engineering projects under construction are marked with light green lines; (c) Displacement time series corresponding to the SDFP pixels labeled as Point A, Point B and Point C in Figure 4a; (d) A photograph of structural damage on Wuhan International Conference & Exhibition Center caused by ground subsidence.
Remotesensing 08 00350 g004
Figure 5. Mean LOS deformation velocity map superimposed on Google Earth image over (a) Zone 2 and (b) Zone 4. The light green polygons represent the distributions of carbonate belts. The subsidence region in Zone 2 is outlined by a red dashed line. The red triangle represents the karst surface collapse that occurred in December 2011. The red cross represents the Yellow Crane Tower; (c,d) illustrate the photographs of structural damage caused by karst collapses that occurred in 2011.
Remotesensing 08 00350 g005
Figure 6. (a) Mean LOS deformation velocity map superimposed on Google Earth image over the bank sector between the Yangtze River and the Sha Lake; (b) Displacement time series relevant to the SDFP pixels labeled as Point D, E and F in Figure 6a vs. water level time series of the Yangtze River.
Remotesensing 08 00350 g006
Table 1. The parameters of the TerraSAR-X data.
ParametersDescription
Track no.142
Imaging ModesStripMap
PolarizationHH
Orbit directionAscending
Looking directionRight
Central incidence angle (degree)34.9
Range resolution(m)2.0
Azimuth resolution (m)3.3
No. of images12
Date of earliest image used7 October 2009
Date of latest image used11 August 2010

