Article

Examining the Influence of Seasonality, Condition, and Species Composition on Mangrove Leaf Pigment Contents and Laboratory Based Spectroscopy Data

by
Francisco Flores-de-Santiago
1,*,
John M. Kovacs
2,3,
Jinfei Wang
4,
Francisco Flores-Verdugo
5,
Chunhua Zhang
6 and
Fernando González-Farías
1
1
Instituto de Ciencias del Mary Limnología, Universidad Nacional Autónoma de México, A.P. 70-305, Av. Universidad 3000, Ciudad Universitaria, Coyoacán 04510, Mexico
2
Department of Geography, Nipissing University, 100 College Drive, North Bay, ON P1B 8L7, Canada
3
TropWATER. Centre for Tropical Water & Aquatic Ecosystem Research, James Cook University, Townsville, Queensland 4810, Australia
4
Department of Geography, University of Western Ontario, 1151 Richmond Street, London, ON N6A 5C2, Canada
5
Instituto de Ciencias del Mary Limnología, Universidad Nacional Autónoma de México, Unidad Mazatlán, Av. Joel Montes Camarena s/n, Mazatlán, Sinaloa 82040, Mexico
6
Department of Geography and Geology, Algoma University, 1520 Queen Street, Sault Ste. Marie, ON P6A 2G4, Canada
*
Author to whom correspondence should be addressed.
Remote Sens. 2016, 8(3), 226; https://doi.org/10.3390/rs8030226
Submission received: 20 January 2016 / Revised: 29 February 2016 / Accepted: 7 March 2016 / Published: 10 March 2016
(This article belongs to the Special Issue Remote Sensing in Coastal Environments)

Abstract

:
The purpose of this investigation was to determine the seasonal relationships (dry vs. rainy) between reflectance (400–1000 nm) and leaf pigment contents (chlorophyll-a (chl-a), chlorophyll-b (chl-b), total carotenoids (tcar), chlorophyll a/b ratio) in three mangrove species (Avicennia germinans (A. germinans), Laguncularia racemosa (L. racemosa), and Rhizophora mangle (R. mangle)) according to their condition (stressed vs. healthy). Based on a sample of 360 leaves taken from a semi-arid forest of the Mexican Pacific, it was determined that during the dry season, the stressed A. germinans and R. mangle show the highest maximum correlations at the green (550 nm) and red-edge (710 nm) wavelengths (r = 0.8 and 0.9, respectively) for both chl-a and chl-b and that much lower values (r = 0.7 and 0.8, respectively) were recorded during the rainy season. Moreover, it was found that the tcar correlation pattern across the electromagnetic spectrum was quite different from that of the chl-a, the chl-b, and chl a/b ratio but that their maximum correlations were also located at the same two wavelength ranges for both seasons. The stressed L. racemosa was the only sample to exhibit minimal correlation with chl-a and chl-b for either season. In addition, the healthy A. germinans and R. mangle depicted similar patterns of chl-a and chl-b, but the tcar varied depending on the species. The healthy L. racemosa recorded higher correlations with chl-b and tcar at the green and red-edge wavelengths during the dry season, and higher correlation with chl-a during the rainy season. Finally, the vegetation index Red Edge Inflection Point Index (REIP) was found to be the optimal index for chl-a estimation for both stressed and healthy classes. For chl-b, both the REIP and the Vogelmann Red Edge Index (Vog1) index were found to be best at prediction. Based on the results of this investigation, it is suggested that caution be taken as mangrove leaf pigment contents from spectroscopy data have been shown to be sensitive to seasonality, species, and condition. The authors suggest potential reasons for the observed variability in the reflectance and pigment contents relationships.

Graphical Abstract

1. Introduction

Mangroves are salt tolerant trees distributed along intertidal coasts of tropical and subtropical regions [1,2]. These forests provide a variety of environmental functions such as a nursery habitat for both terrestrial and marine fauna; they act as a natural barrier against tropical storms and hurricanes; and are an important resource for local communities [3]. Mangrove forests are also extremely important contributors to global organic carbon dynamics [4,5,6], to primary productivity [7,8], for nutrient recycling [5,9], and can help to mitigate climate change impacts [10]. Despite their ecological relevance, mangrove forests are under considerable degradation due to anthropogenic perturbations including aquaculture expansion [11,12]. In fact, Duke et al. [13] have suggested that the services offered by mangrove ecosystems could become ecologically insignificant within the next 100 years if the current deforestation rates are maintained. Consequently, many techniques, including remote sensing, have been investigated in order to properly classify and monitor these forested wetlands (e.g., [14,15,16,17,18]).
A considerable number of the remote sensing assessments of mangroves have used optical spaceborne data (e.g., [19,20,21,22,23]). Although the use of these multispectral data can provide basic mangrove forest mapping (e.g., Landsat Thematic Mapper (TM) and Satellite Pour l’Observation de la Terre (SPOT)), the coarse spectral resolution of these platforms limits the extent of biophysical data that can be extracted from these forests. Thus, there has been an increasing interest in the use of spectroscopy data, currently using in situ instruments, as an alternative to multispectral data for accurate quantification of mangrove biophysical variables such as leaf pigment contents and nitrogen. For example, Vaiphasa et al. [24] used reflectance of 16 mangrove species in order to test species separability. Their results indicated that 16 mangrove species were statistically different at most spectral locations. Wang and Sousa [25] conducted a laboratory study measuring the reflectance of leaves collected from a forest canopy dominated by Avicennia germinans (A. germinans), Laguncularia racemosa (L. racemosa), and Rhizophora mangle (R. mangle) located along the Caribbean coast of Panama. The results from this study demonstrated that wavebands at 780, 790, 800, 1480, 1530, and 1550 nm were identified as the most useful bands for mangrove species classification. Panigrahy et al. [26] examined the leaf reflectance characteristics of four tropical mangrove species (Avicennia alba, Avicennia marina, Rhizophora mucronata, and Sonneratia caseolaris) common to India showing unique spectral signatures four all species using information collected from the red, near infra-red, and middle infra-red regions of the spectrum. Zhang et al. [27] performed a laboratory study assessing relationships between pigment content (chlorophyll-a, chlorophyll-b, and total carotenoids) and leaf reflectance (350–2500 nm) from two subtropical mangrove species (A. germinans and R. mangle). The results from this work indicated that traditional vegetation indices do not necessarily improve the ability to predict pigment content. Contrary, wavebands at the red-edge position were found to be the best predictors of the leaf pigment contents. Zhang et al. [28] applied the use of spectral response curves for estimating nitrogen leaf concentrations in two mangrove species (A. germinans and R. mangle). Their results confirmed that artificial neural networks could be used to assess mangrove health based on the amount of leaf nitrogen content. Flores-de-Santiago et al. [29] studied the influence of seasonality in estimating chlorophyll-a content from 35 vegetation indices using a pooled sample of three mangrove species (A. germinans, L. racemosa, and R. mangle). Their results indicated that vegetation indices using information from the red-edge wavebands are best at predicting leaf chlorophyll-a content. Zhang et al. [30] conducted a laboratory study in order to select optimal wavebands for species discrimination based on three mangrove species (A. germinans, L. racemosa, and R. mangle). Their results indicated that wavebands at 520, 560, 650, 710, 760, 2100, and 2230 are the most appropriate for mangrove classification.
Of particular interest in remote sensing is leaf reflectance, which can provide unique information regarding the actual physiological state of plants [31,32]. Specifically, spectroscopy assessments of pigments, such as chlorophyll-a (chl-a), chlorophyll-b (chl-b), and total carotenoids (tcar), may provide more detailed, accurate, and quick results for environmental monitoring of mangroves using spaceborne platforms. It is well known that the aforementioned pigments present different absorption patterns with maximum reflectance at unique wavelengths [33,34]. Thus, potential spectroscopy discrimination could be achieved for separating mangrove conditions (i.e., degraded) according to pigment contents. Moreover, prior to any application of multispectral or hyperspectral satellite imagery in mapping mangroves, it is necessary to test the feasibility of applying laboratory-based spectroscopy data for identifying mangrove species under various health conditions (e.g., stressed, healthy).
The vast majority of spectroscopy studies have focused on the association between spectral reflectance and leaf chl a or chl b contents (e.g., [35,36,37,38,39,40]) but some have also assessed tcar content (e.g., [41,42,43,44]), and a few have considered the chlorophyll a/b ratio (chl a/b) (e.g., [45,46,47]). Regarding mangroves, the results of previous studies indicate that each mangrove species presents a unique characteristic with regards to their reflectance [25,29,30]. Therefore, the purpose of this investigation was to examine relationships between spectroscopy variability (450–1000 nm) and leaf pigment contents (chl-a, chl-b, tcar, and chl a/b) in the three most common species found in the Americas (A. germinans, L. racemosa, and R. mangle). Given that a previous work [29] has shown a shift in leaf pigment contents for these species, we further consider the potential impact of two contrasting seasons on these relationships.

2. Methods

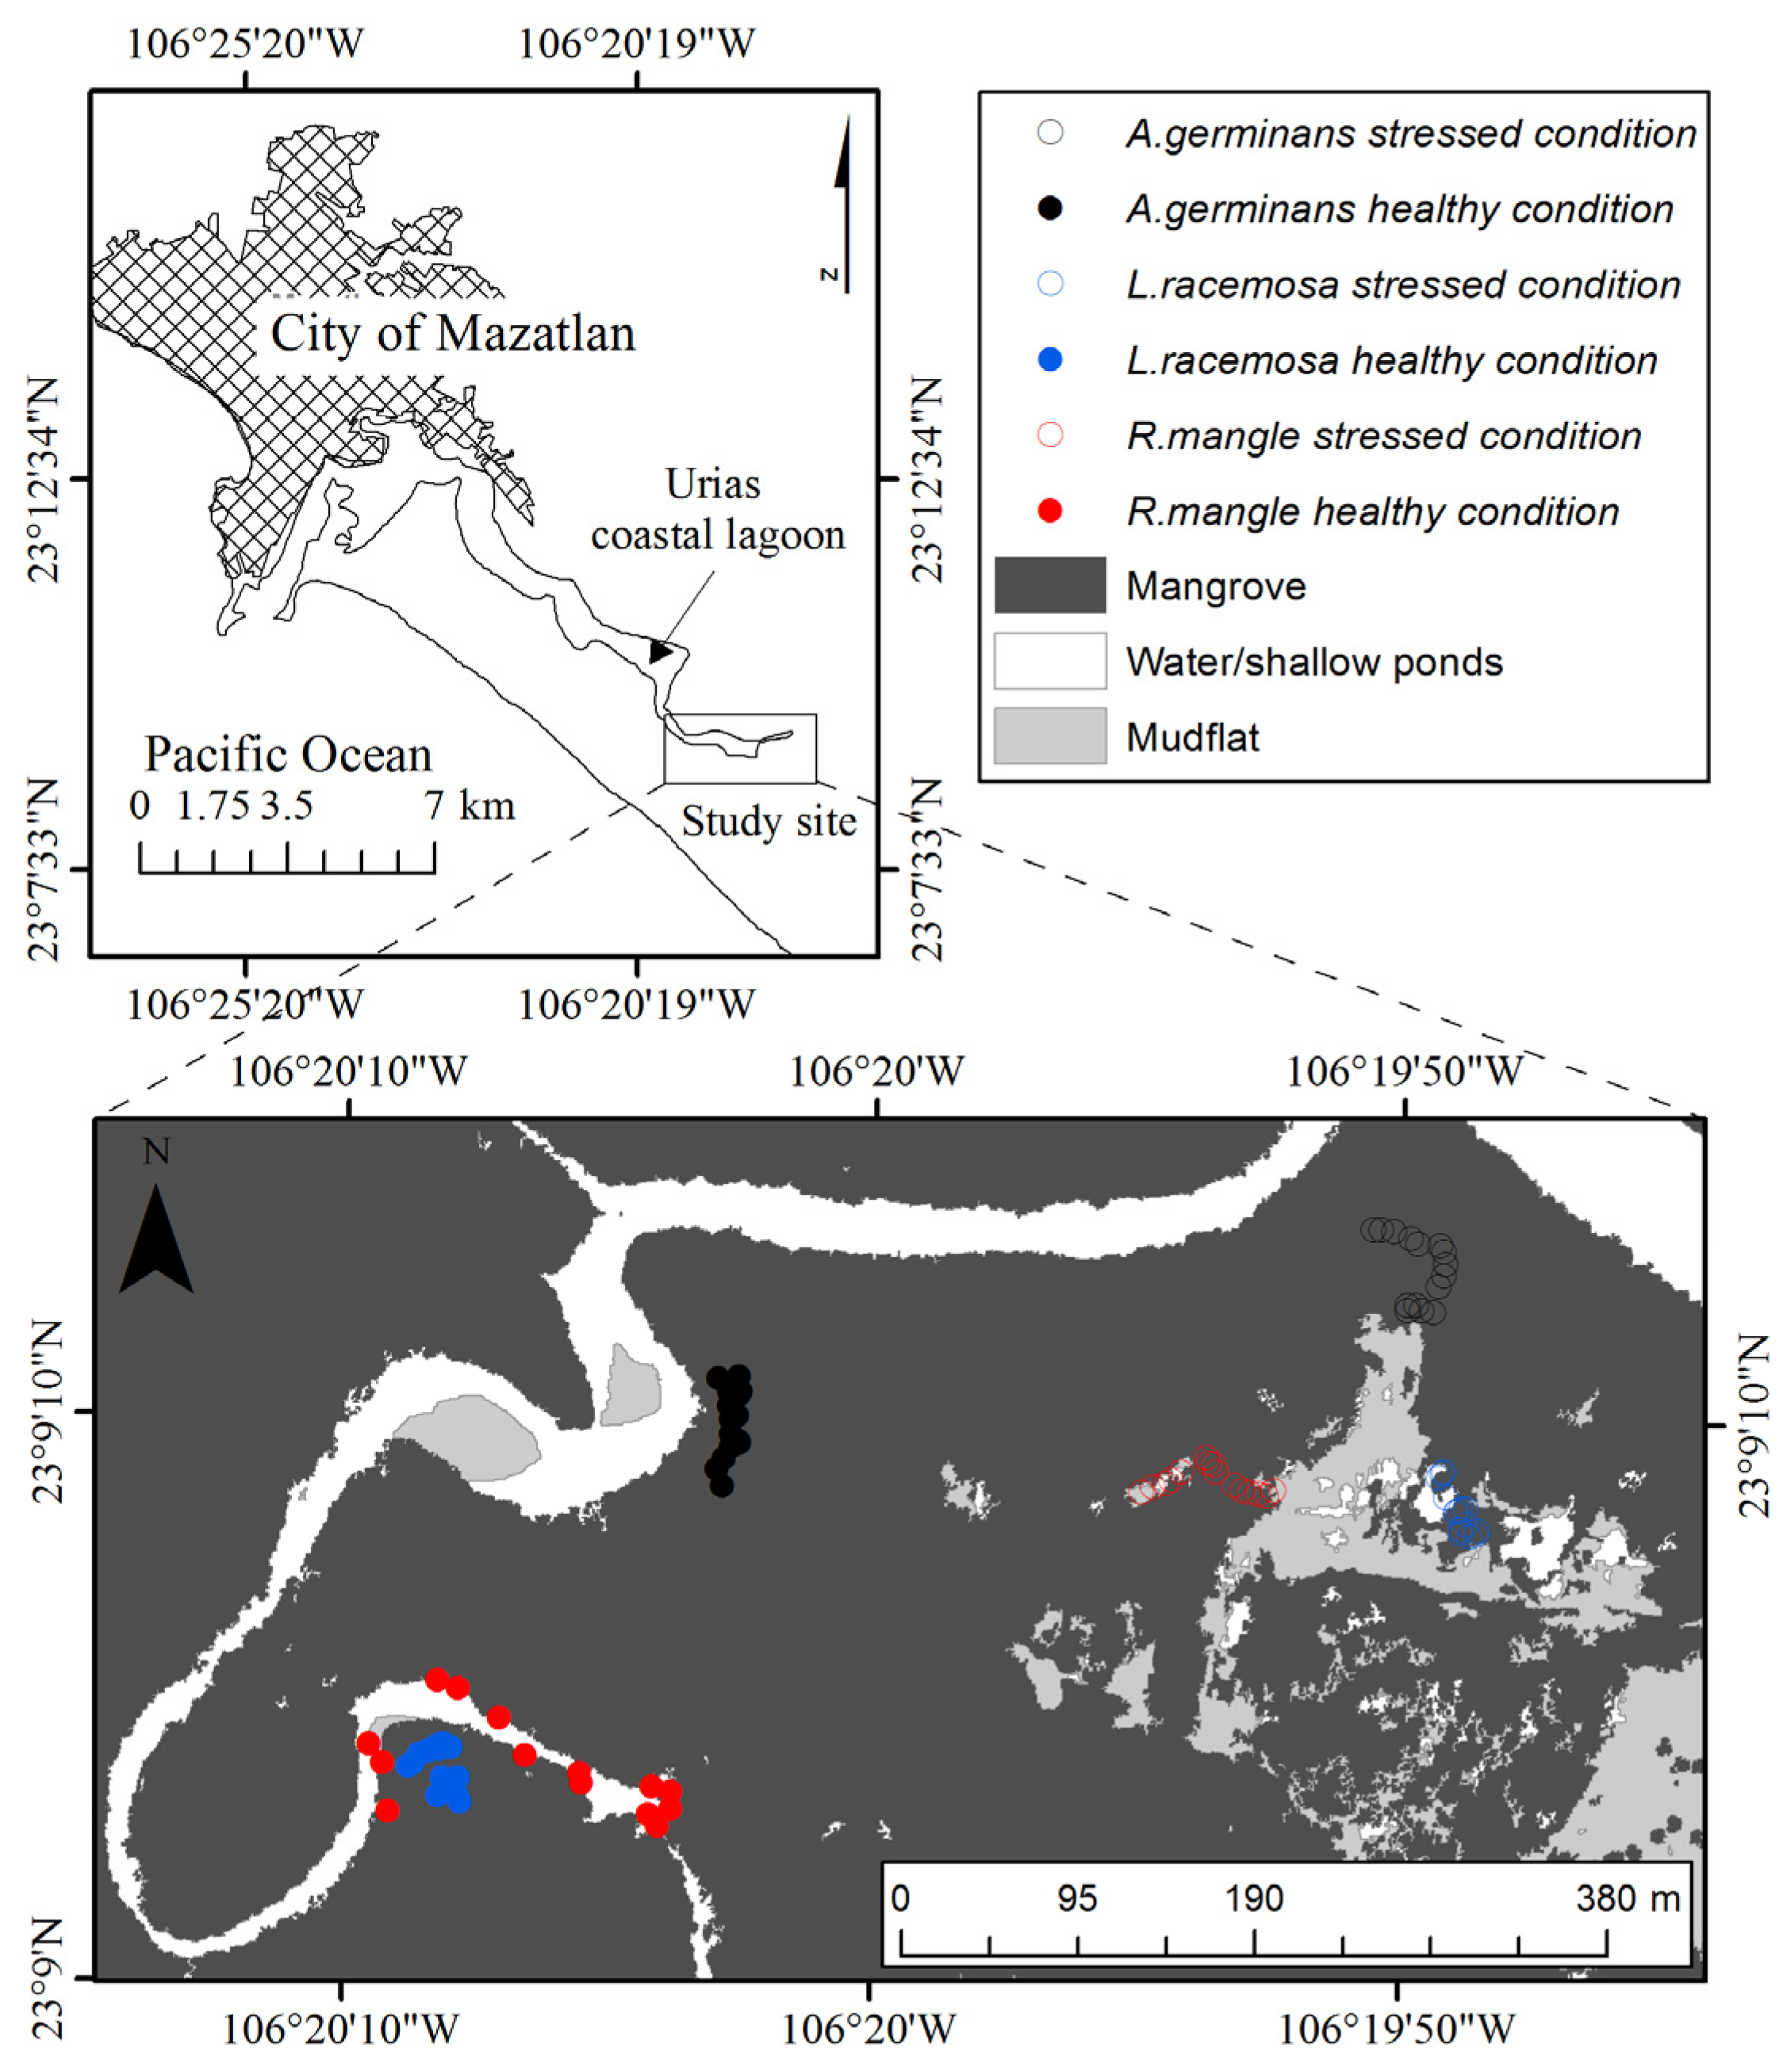
2.1. Study Site and Data Collection

The Urias coastal lagoon (Figure 1) is located on an alluvial plain close to the city of Mazatlan, Mexico (23°10′N and 106°20′W). This coastal lagoon is shallow, saline, and has a smooth slope that extends towards the interior of the main tidal channel and experiences semi-diurnal tidal amplitudes of approximately 1.5 m, creating a complete mixed seasonal column of water [48]. The Urias coastal lagoon is considered an anti-estuarine body of water because it has no constant freshwater input [49]. The majority of the mangroves of this system are located along the border of the main channel and along the many small tidal creeks. The three species commonly found in this area are the black mangrove (A. germinans), the white mangrove (L. racemosa), and the red mangrove (R. mangle) [50].
These mangrove forests are constantly exposed to saline water from the Pacific Ocean but do experience sharp seasonal changes in water salinity during the summer months (June–September) when the freshwater input exceeds the evaporation rate creating a more ideal environment for mangroves [49]. To deal with the issue of seasonal changes in salinity, fieldwork were conducted in the southern section of the Urias system at the end of the dry (i.e., most stressful situation in May) and at the end of the rainy (most optimal situation in October) seasons.
According to others [27,28,29,30,48,51,52], six classes of mangroves are typical of this coastal lagoon: stressed condition black, white, and red mangroves located adjacent to the dry inland saltpan areas (~80 psu); and the healthy (i.e., non-stressed) black, white, and red mangroves located along or in very close proximity to the main tidal channels (~35 psu). For both the dry and rainy seasons, we selected 30 random leaves from each of these mangrove classes. Specifically, the 3rd to the 5th leaves from the tip were clipped in order to maintain a sample of just mature leaves [53]. Once cut, all leaves were stored in a plastic bag within a small cooler at 4 °C for immediate transportation to the laboratory. Using a differential GPS and a red trail tape around the trees we ensured that the leaves were taken from the same trees during both field trips.

2.2. Leaf Spectroscopy Data

In a laboratory setting the spectroscopy reflectance of each leaf was measured using a FieldSpec HandHeld device (ASD Inc. Boulder, CO, USA), which has a spectral range of 325–1075 nm and a spectral resolution of 1.0 nm. The FieldSpec HandHeld device was equipped with a plant probe unit that was connected using and optical fiber cable. A white reference (spectralon) was used at 5 min intervals in order to calibrate the measurements. For each measurement, the value recorded for each leaf was based on an average of 10 spectral readings. We used the plant probe light source on top of a black plate in order to obtain reflectance values. All reflectance values below 450 nm and above 1000 nm were deleted due to noise inherent to the instrument. The spectral reflectance (R) was then converted to pseudo-absorption (log(1/R)).

2.3. Leaf Pigment Contents

Immediately after the leaf spectroscopy assessment, leaf pigment contents (chl-a, chl-b, and tcar) were measured using the same leaf samples. Due to difference in leaf morphology among the three mangrove species (i.e., length and width), we normalized leaf pigment per unit area (mg/m2) using the diameter dimensions of a copper cylinder. Specifically, a 1.25 cm diameter leaf circle was taken from each leaf using the cutting cylinder. Care was taken to avoid collecting samples from the leaf midriff veins. The leaf material was then crushed in 100 mL of acetone at 80%. Each sample was then filtered and quantified according to the [54] equations; additionally the chl a/b ratio was calculated:
Chlorophyll-a = 12.21A663 − 2.81A646
Chlorophyll-b = 20.13A646 − 5.03A663
Total carotenoids = [1000A470 − 3.27(chl-a) − 104(chl-b)]/229
where Axxx corresponds to the absorbance wavelength, and chl-a and chl-b represents chlorophyll-a and chlorophyll-b content, respectively.

2.4. Statistical Analysis

Box plots were constructed for visual interpretation of seasonal leaf pigment variability among the six mangrove classes. Since box plots cannot determine the significance between the samples, the Mann–Whitney U-test was used for the seasonal assessment (dry vs. rainy) for each pair of pigment among the three mangrove species. Additionally, the Kruskal–Wallis one-way analysis of variance H-test by ranks was used to determine inter-species significance for each pigment (chl-a, chl-b, tcar, chl a/b ratio), condition (stress, healthy), and season (dry, rainy). In order to identify the best relationship between the leaf pigment contents and the electromagnetic spectrum (450–1000 nm), multiple correlograms (i.e., Pearson correlation) were created using the three pigments (chl-a, chl-b, tcar) and the chl a/b ratio for each of the pseudo-absorption wavelengths. Significant levels for the correlograms were quantified using the equations provided by [55]. Based on a previous study of only chl-a content determination [29], the Vogelmann Red Edge Index (Vog1), the Red Edge Inflection Point Index (REIP), and the Photochemical Reflectance Index (PRI) were additionally tested as these vegetation indices (VI) had been shown to be optimal for mangrove chl-a leaf estimation.
Vog1 = R740/R720
REIP = R700 + 40[0.5(R670 + R780) − R700/(R740 − R700)]
PRI = (R531 − R570)/(R531 + R570)
Regression analysis was used to assess the relationships between the pigment contents and the various vegetation indices (VIs). Following a bootstrapping technique provided by [56], pigment contents were estimated from these equations. Specifically, in the bootstrapping technique two-thirds of the random data were used for model calibration (i.e., linear equations between pigment contents and VI) and the remaining one-third used for model validation. For the validation step the standard error of estimate (SE) was used to identify the best predictive model. Statistical analyses were carried out using Minitab-17 and OriginPro-8 Software .

3. Results

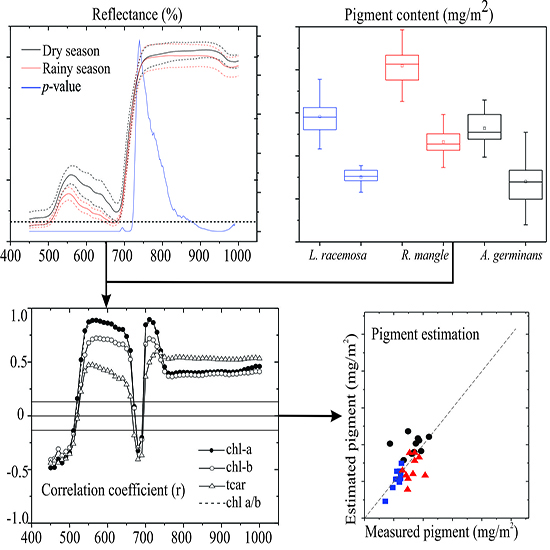
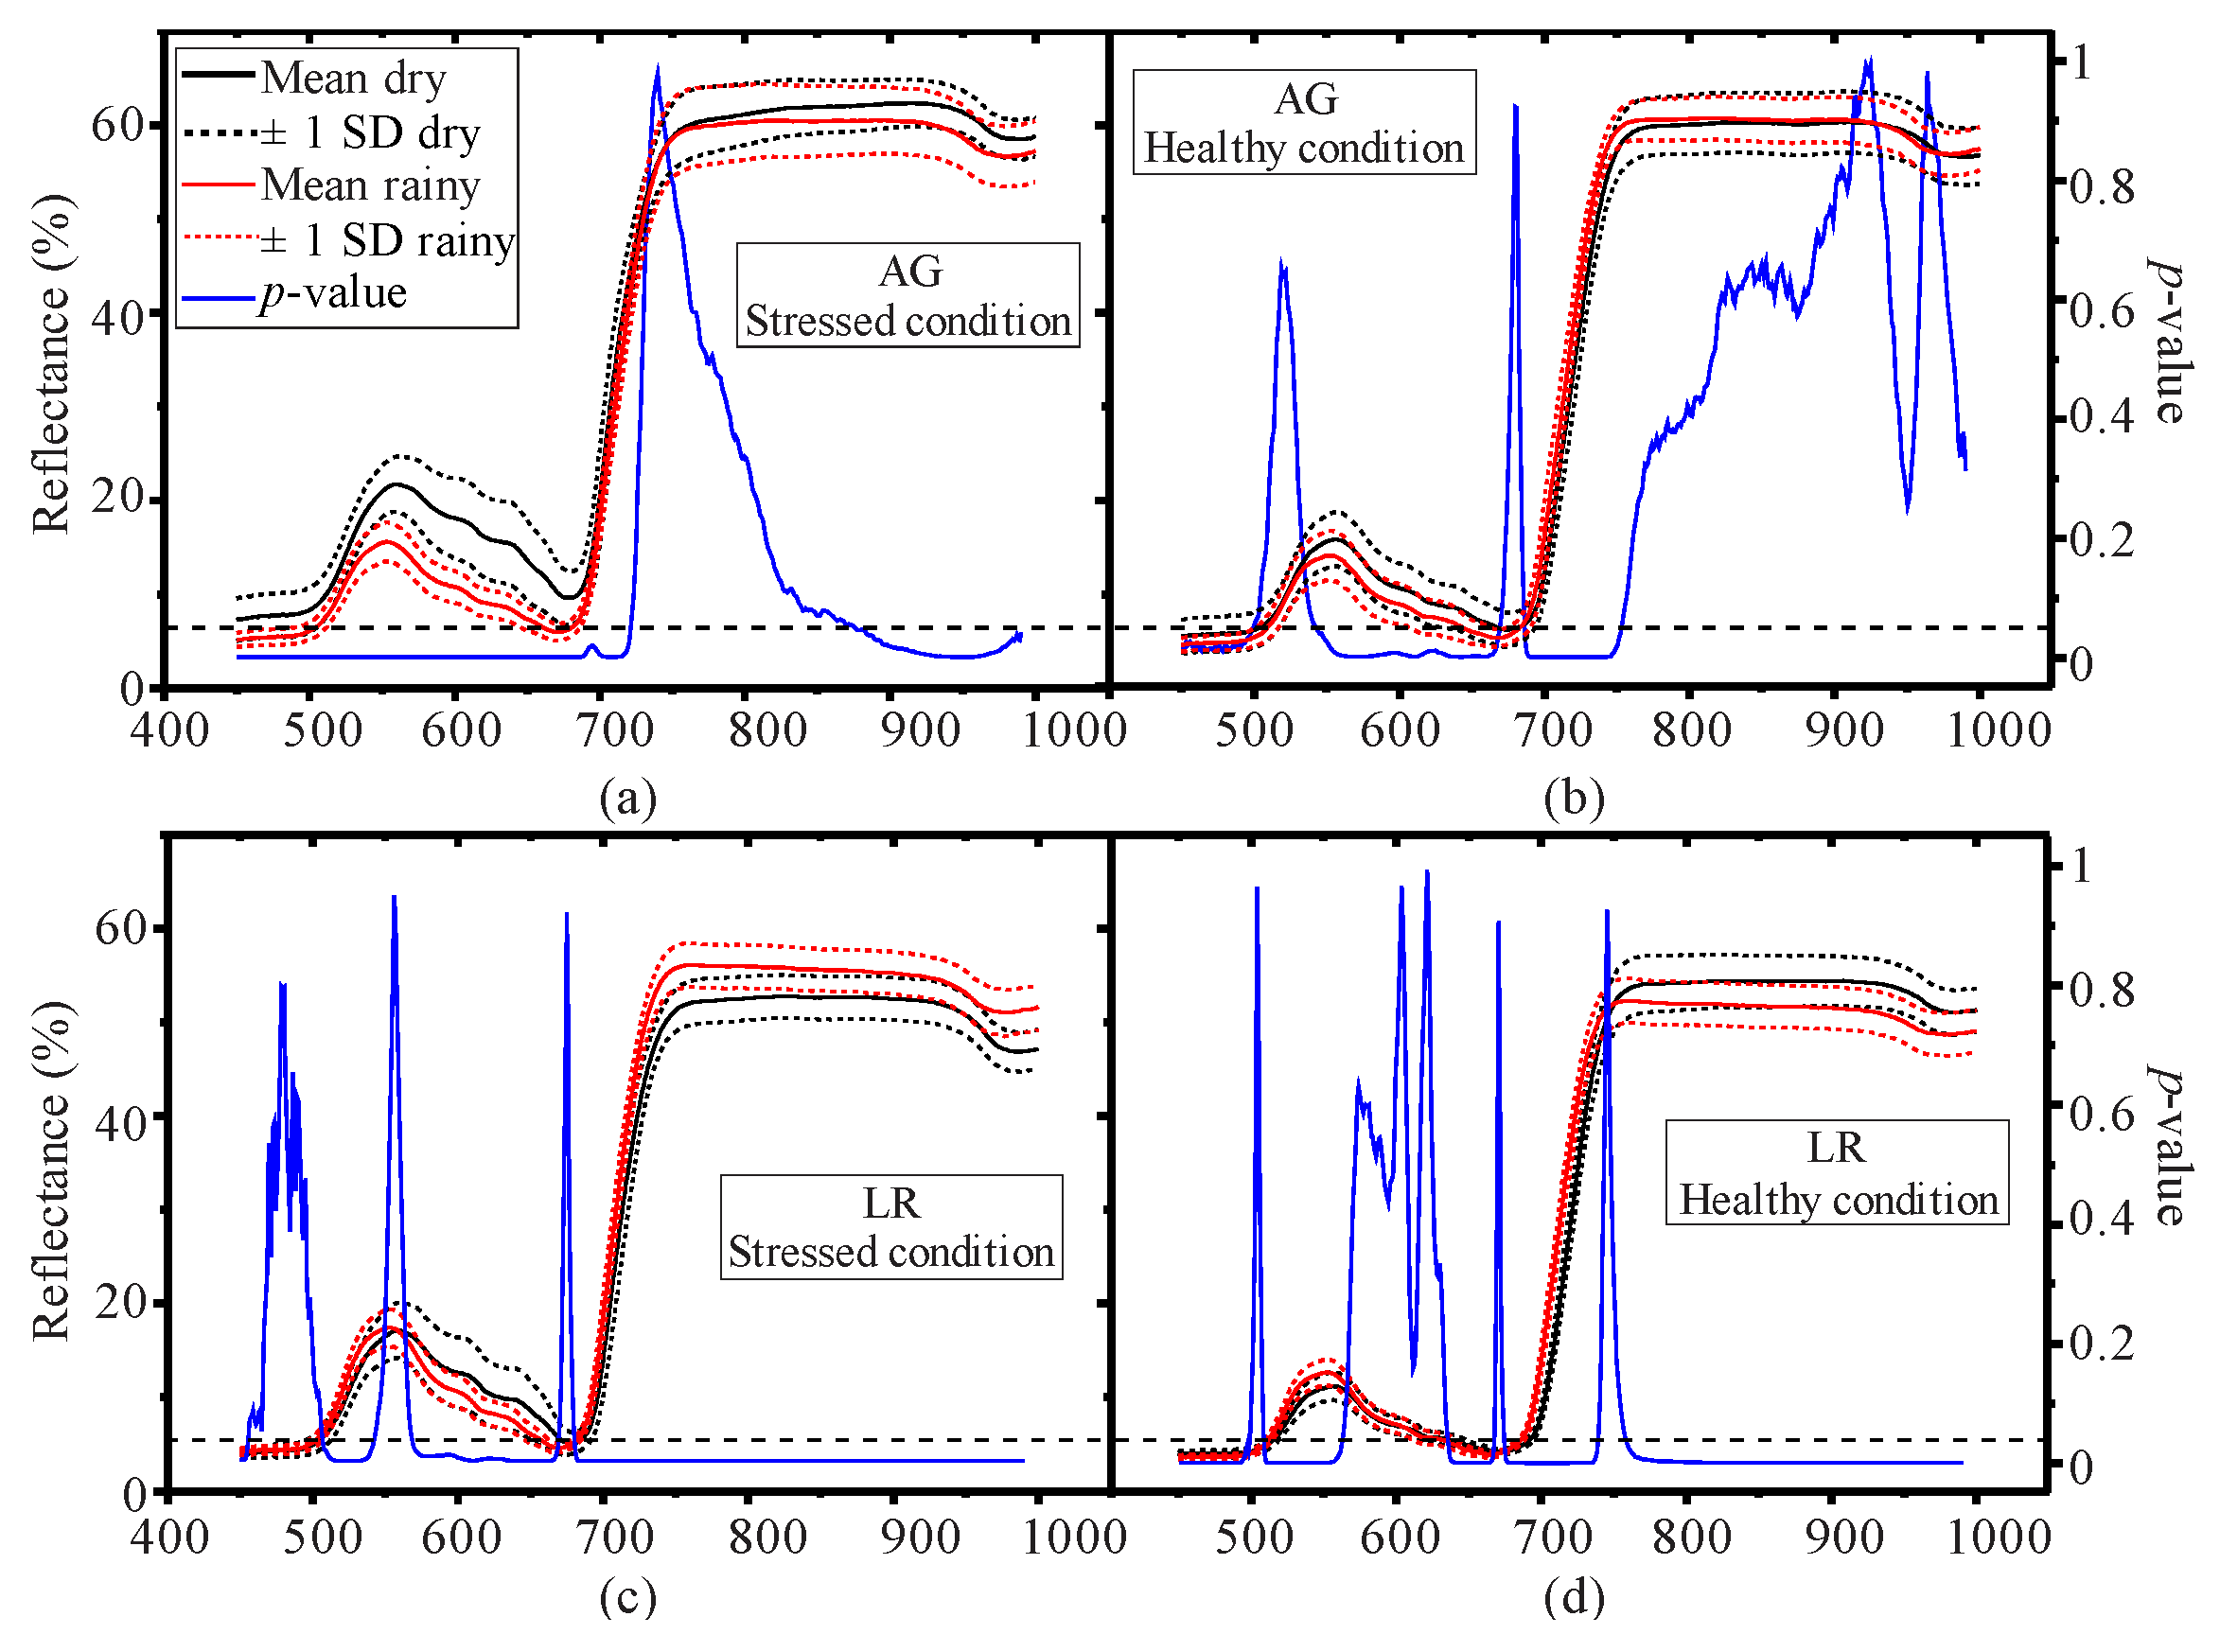
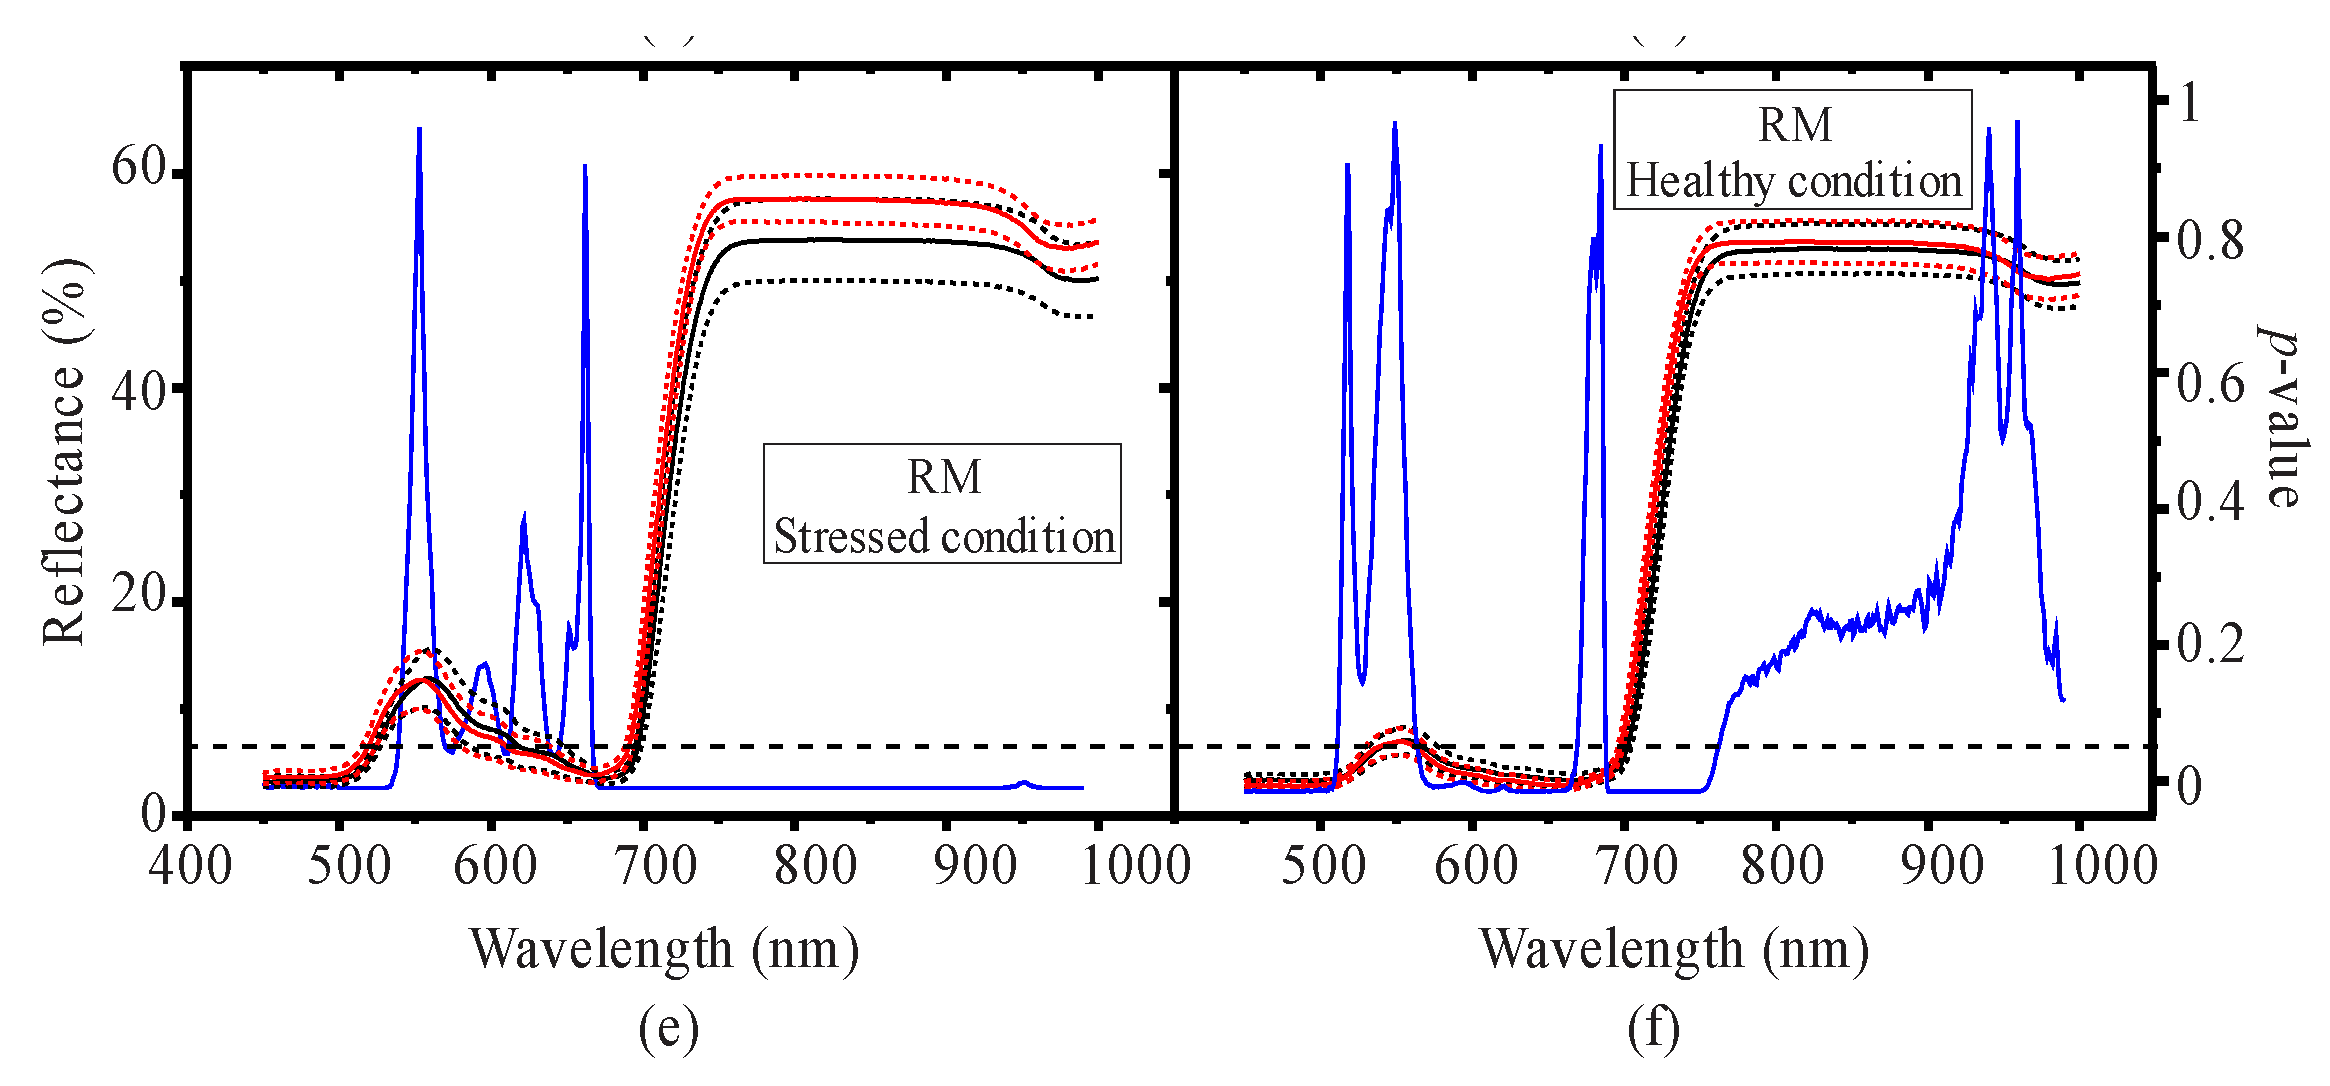
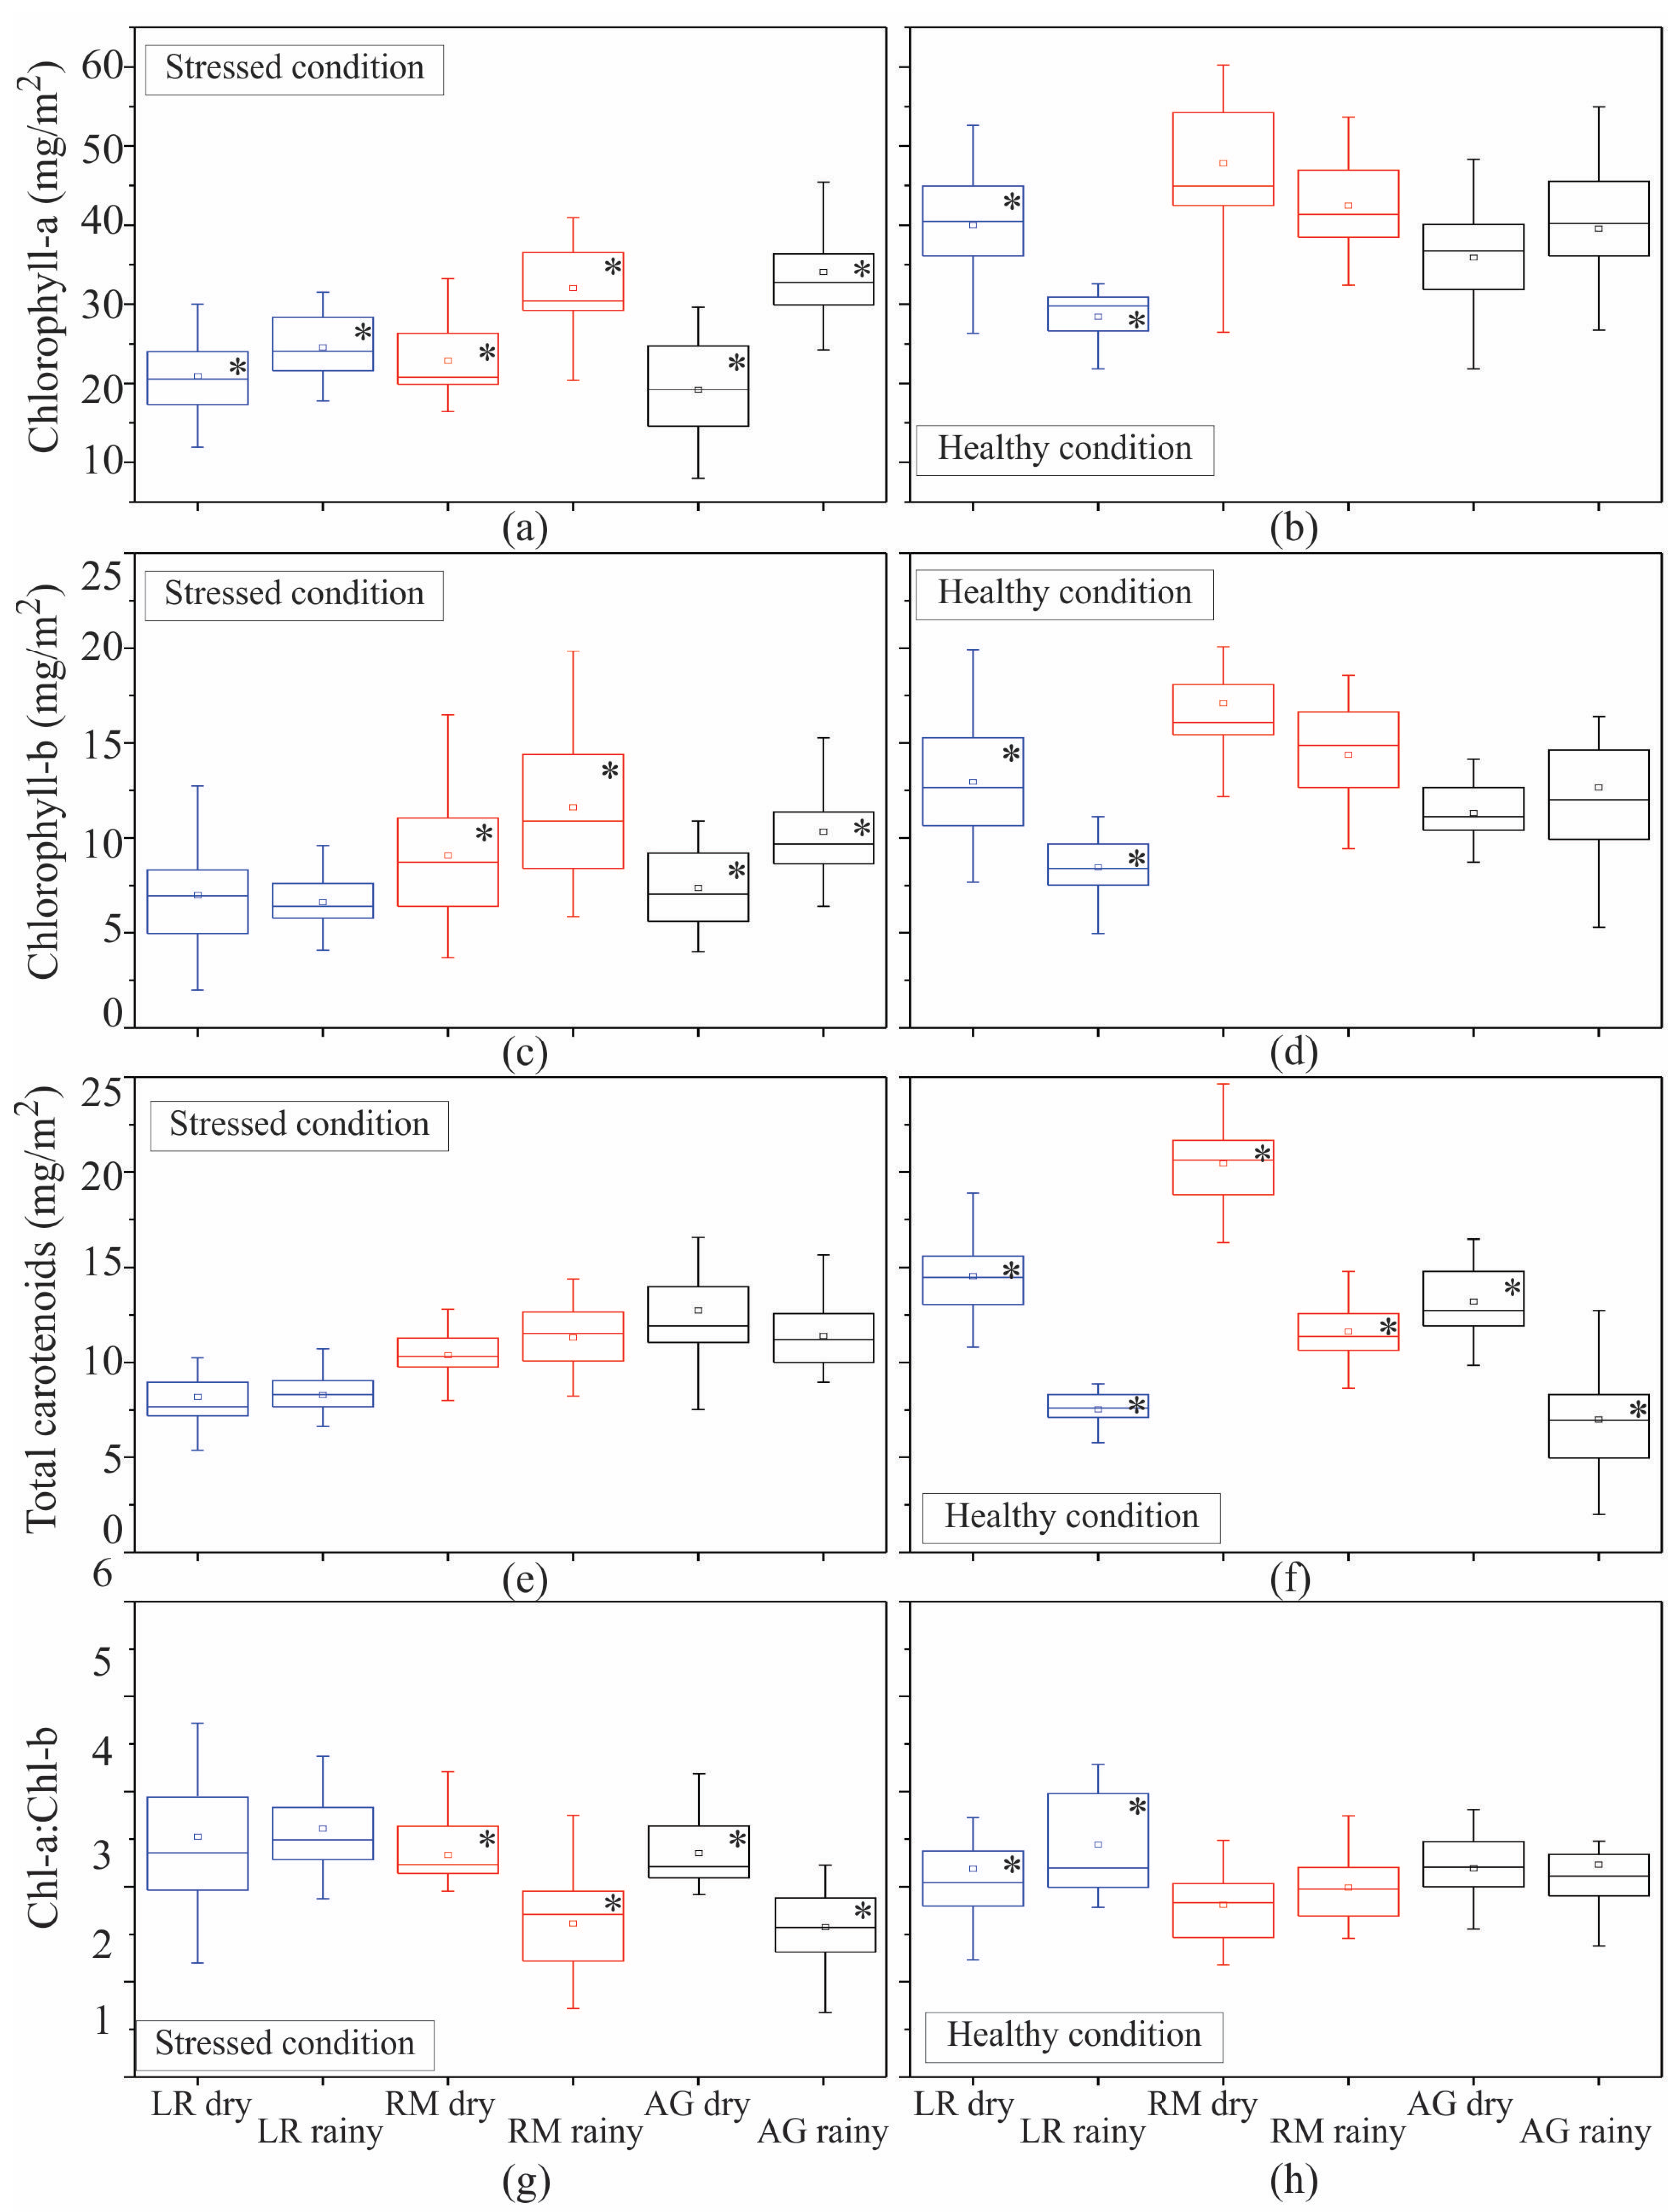
3.1. Seasonal Assessment of the Spectroscopy Data and Mangrove Leaf Pigments

Figure 2 shows the reflectance curves of the six mangrove classes for both the dry and rainy seasons. When comparing the two conditions it is apparent that the spectral curves for the mangroves under stress show greater differences between the seasons. Specifically, the stressed black mangrove shows much higher reflectance in the green to red portions of the electromagnetic spectrum (i.e., 550–670 nm) during the dry season with only a slight increase in the near-infrared region (i.e., >900 nm) (Figure 2a). The stressed white mangrove showed no seasonal differences from 450 to 510 nm, and at 550 and 680 nm (Figure 2c), whereas the stressed red mangrove showed between 550 and 680 nm (Figure 2e). Both showed significant differences beyond 680 nm. The three healthier mangrove species showed no seasonal differences at 680 nm with only the white showing significant differences from 750 to 1000 nm. Additionally, no seasonal differences were found in certain parts of the electromagnetic spectrum for red and black healthy mangroves. For instance, the region from 500 to 550 nm was found to be equal in the black mangrove, from 580 to 650 nm in the white mangrove, and from 500 to 570 nm in the red mangrove (Figure 2b,d,f).
Figure 3 depicts the statistical differences in reflectance amongst the three mangrove species during the dry and rainy season for both stressed and healthy conditions. It is clear from this figure that only the red-edge position shows no difference in reflectance for the stressed mangrove classes (Figure 3a). For healthier mangroves, the lack of difference at the red-edge only appears in the rainy season and, moreover, unlike the stressed mangrove a lack of difference is observed for both seasons at the extreme lower end of the blue spectral region (Figure 3b).
Figure 4 shows pigment content variability for all six mangrove classes according to the seasons. Stressed mangroves had significantly much higher chl-a content during the rainy season as compared to the same trees during the dry season (Figure 4a), and all three healthy mangroves (Figure 4b) showed higher chl-a content compared to the stressed classes. Unlike the healthy white mangrove, no significant differences (p > 0.05) in chl-a content were found between both seasons for the red and black mangroves (Figure 4b). The chl-b content showed a relatively similar seasonal pattern with all three stressed and healthy classes (Figure 4c,d). However, the chl-b levels were significantly higher in the rainy season for both stressed red and stressed black mangrove. Regarding tcar content, the stressed mangroves did not present significant differences (p > 0.05) between both seasons (Figure 4e), but the tcar content did significantly decrease (p < 0.05) during the rainy season for all three healthy mangroves (Figure 4f). The three stressed mangroves presented a different pattern regarding the chl a/b ratio. Specifically, the white mangrove did not show significant seasonal differences (p > 0.05), whereas the red and black mangroves did with a significant decrease in the chl a/b ratio during the rainy season (Figure 4g). Interestingly, the opposite holds true for healthy mangroves having no observed significant difference in the red and black but showing a significant increase in the rainy season for the white (Figure 4h). Regarding the inter-species assessment, significant differences in all pigments (p < 0.05, n = 30) were found among the three mangrove species for the stress and healthy conditions in both dry and rainy seasons (Table 1 and Table 2).

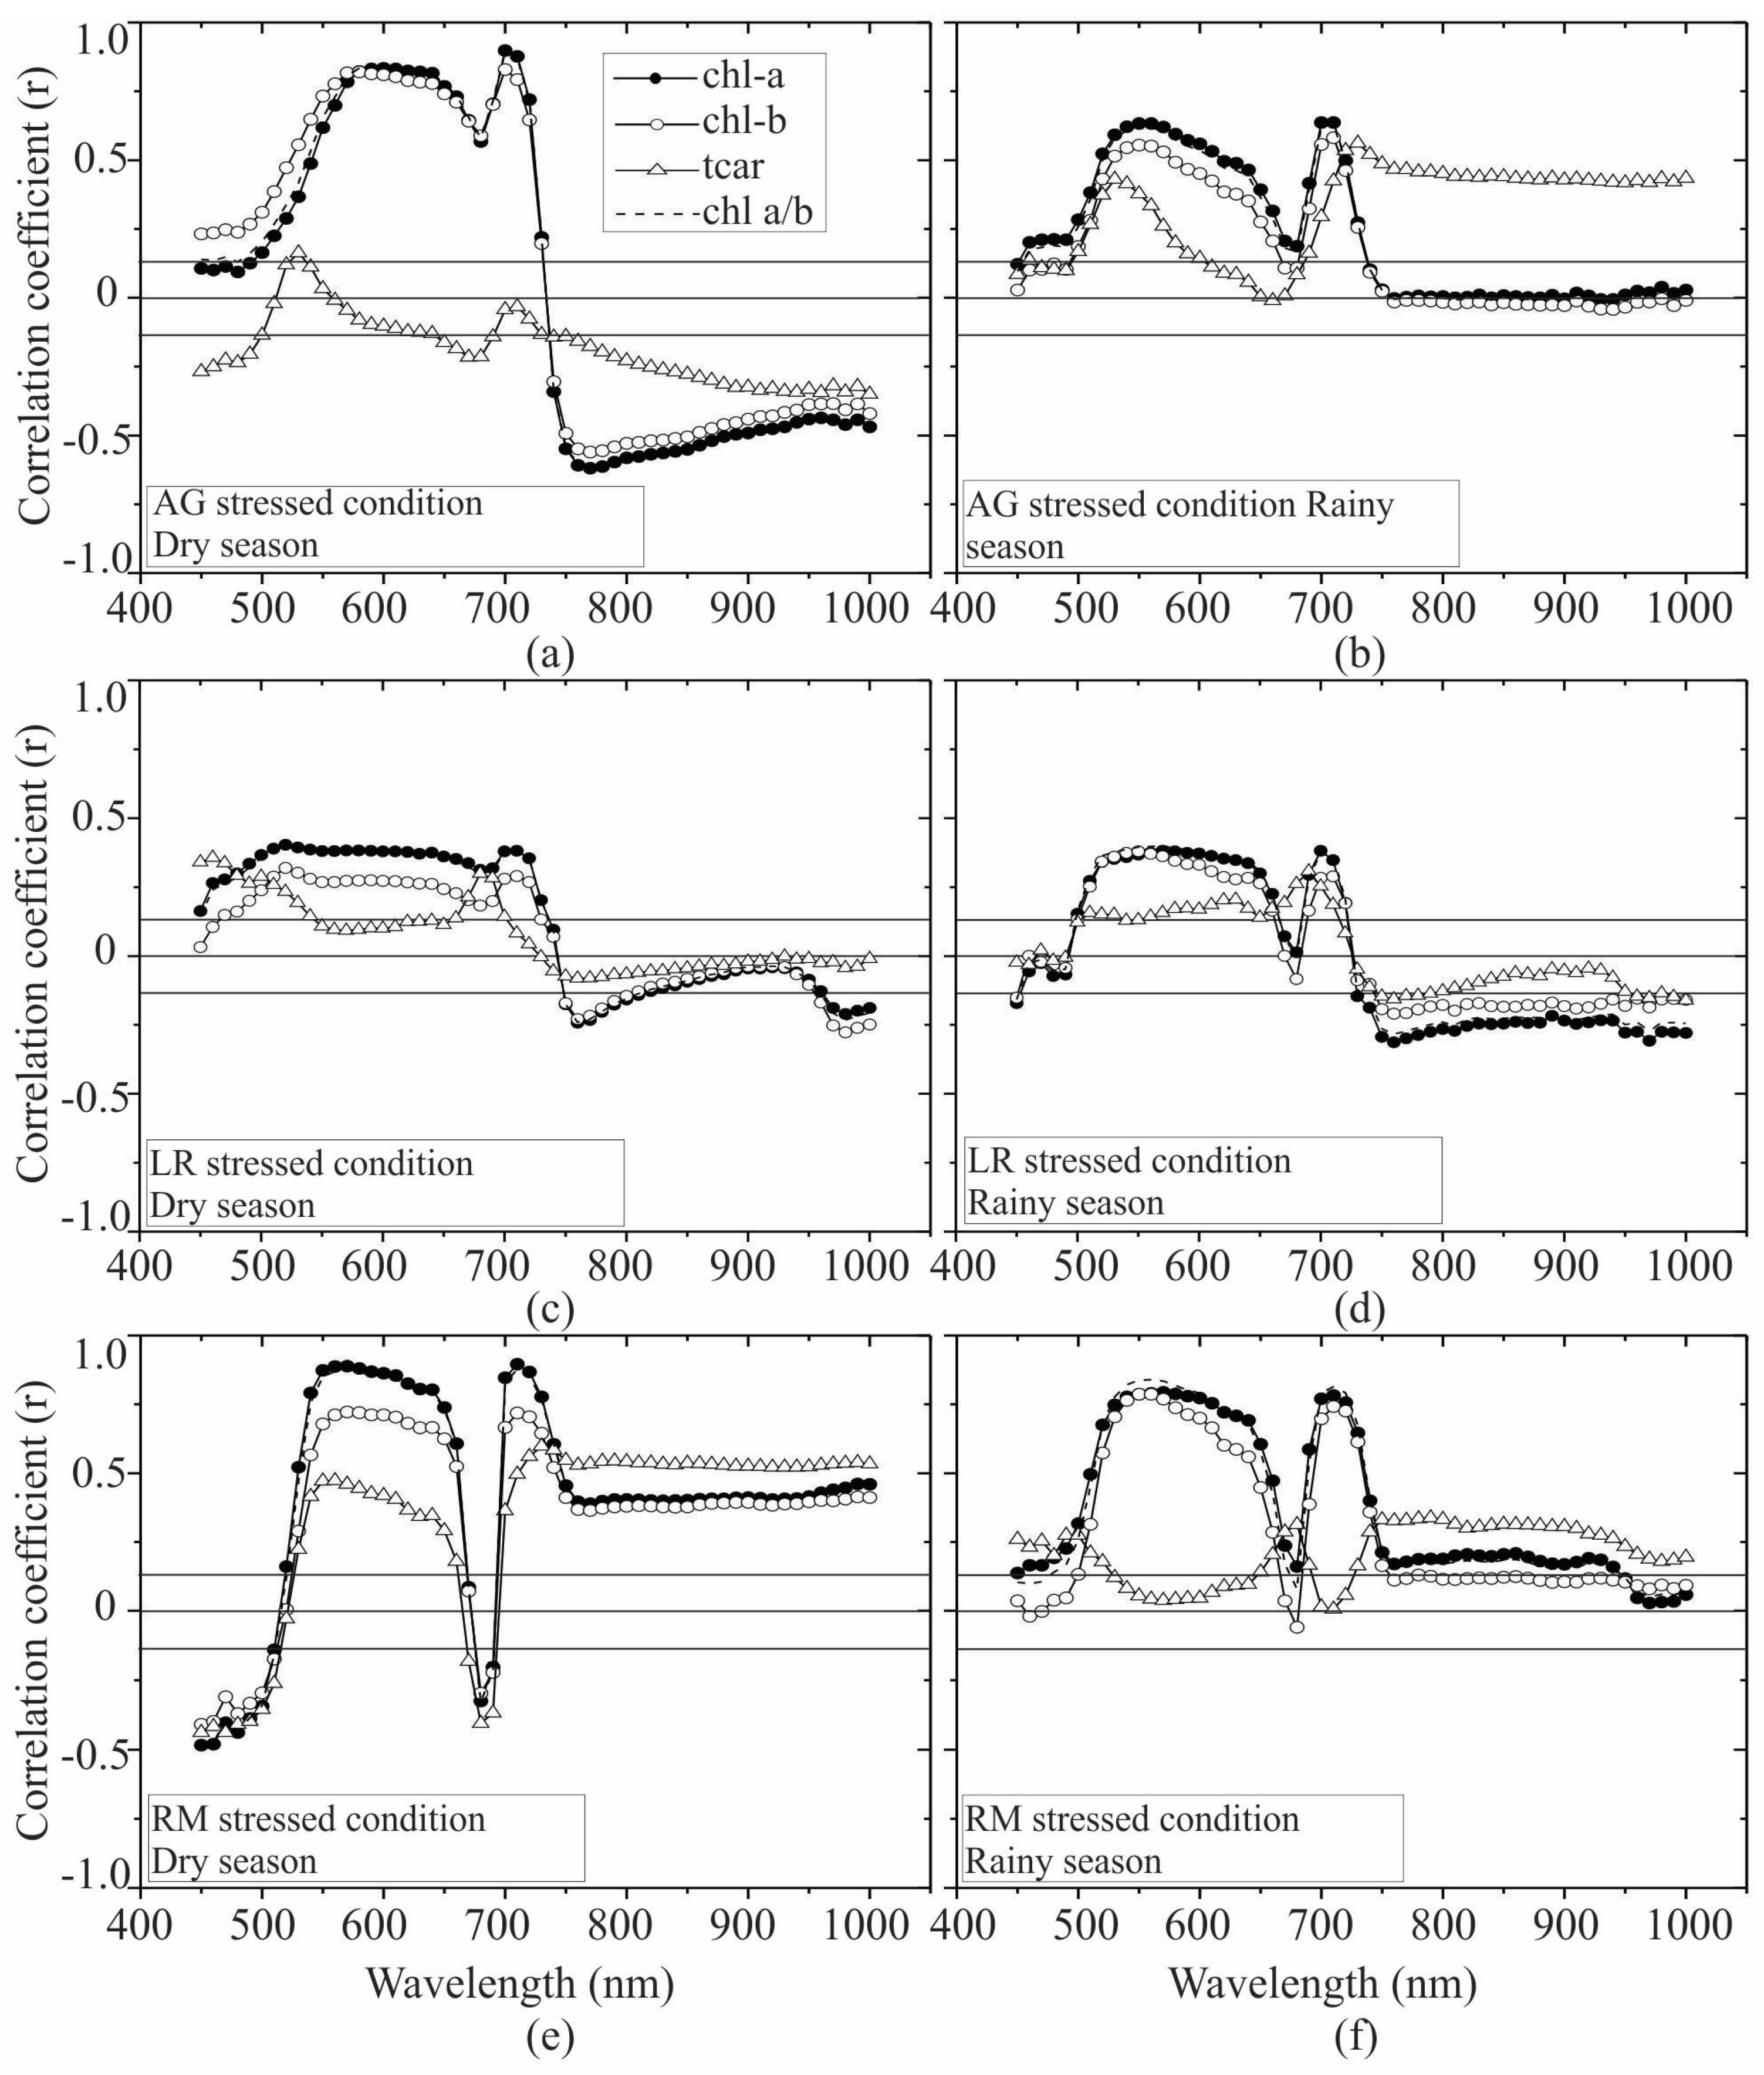
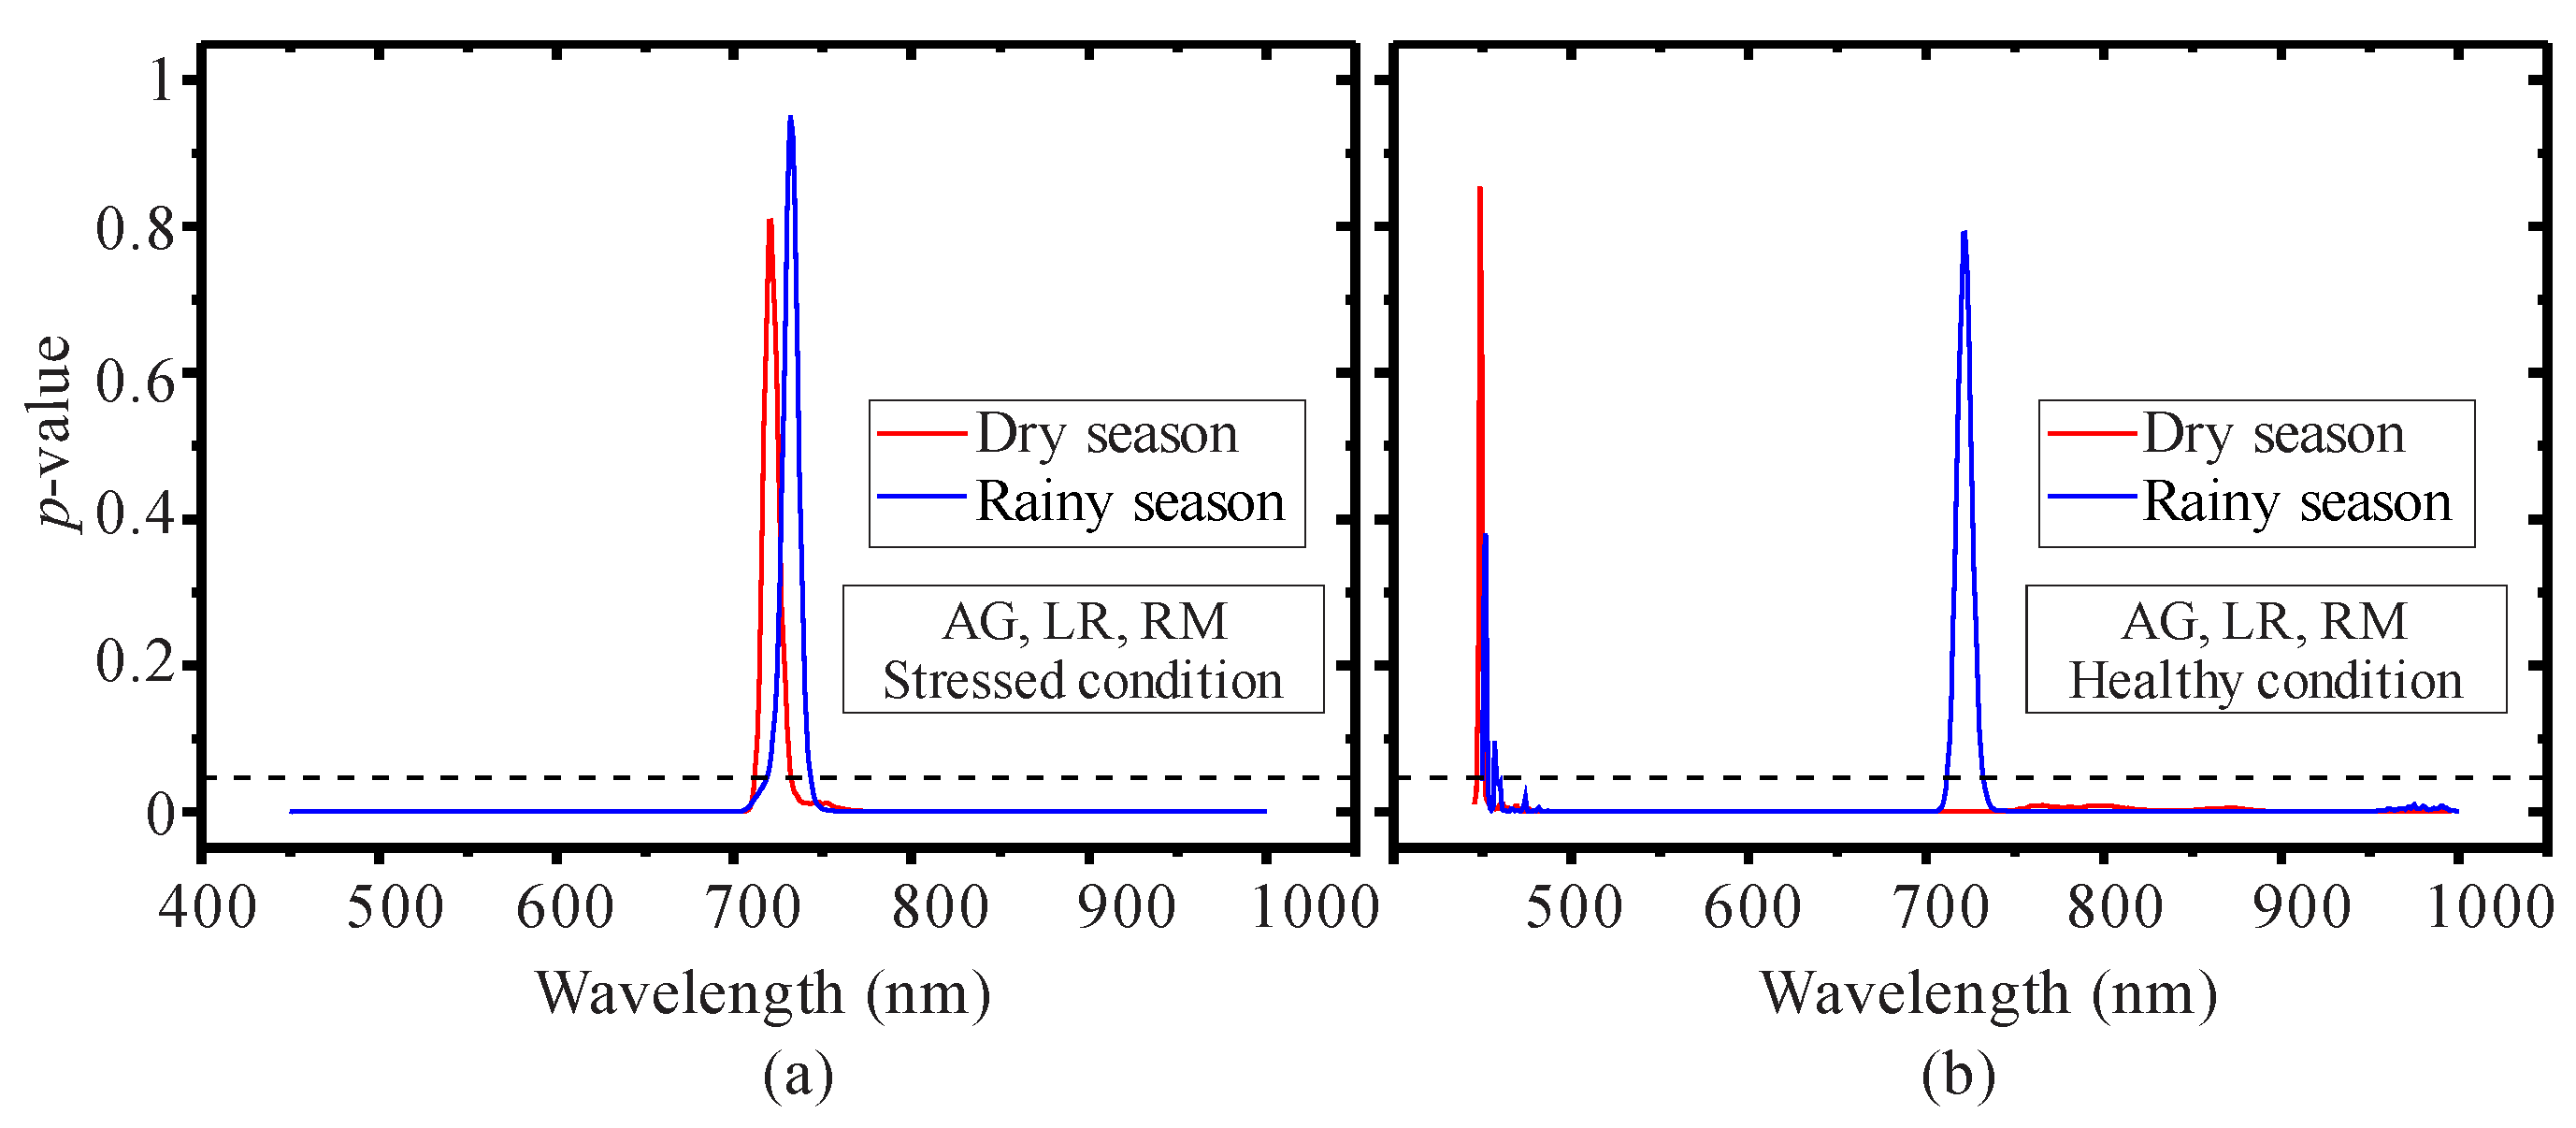
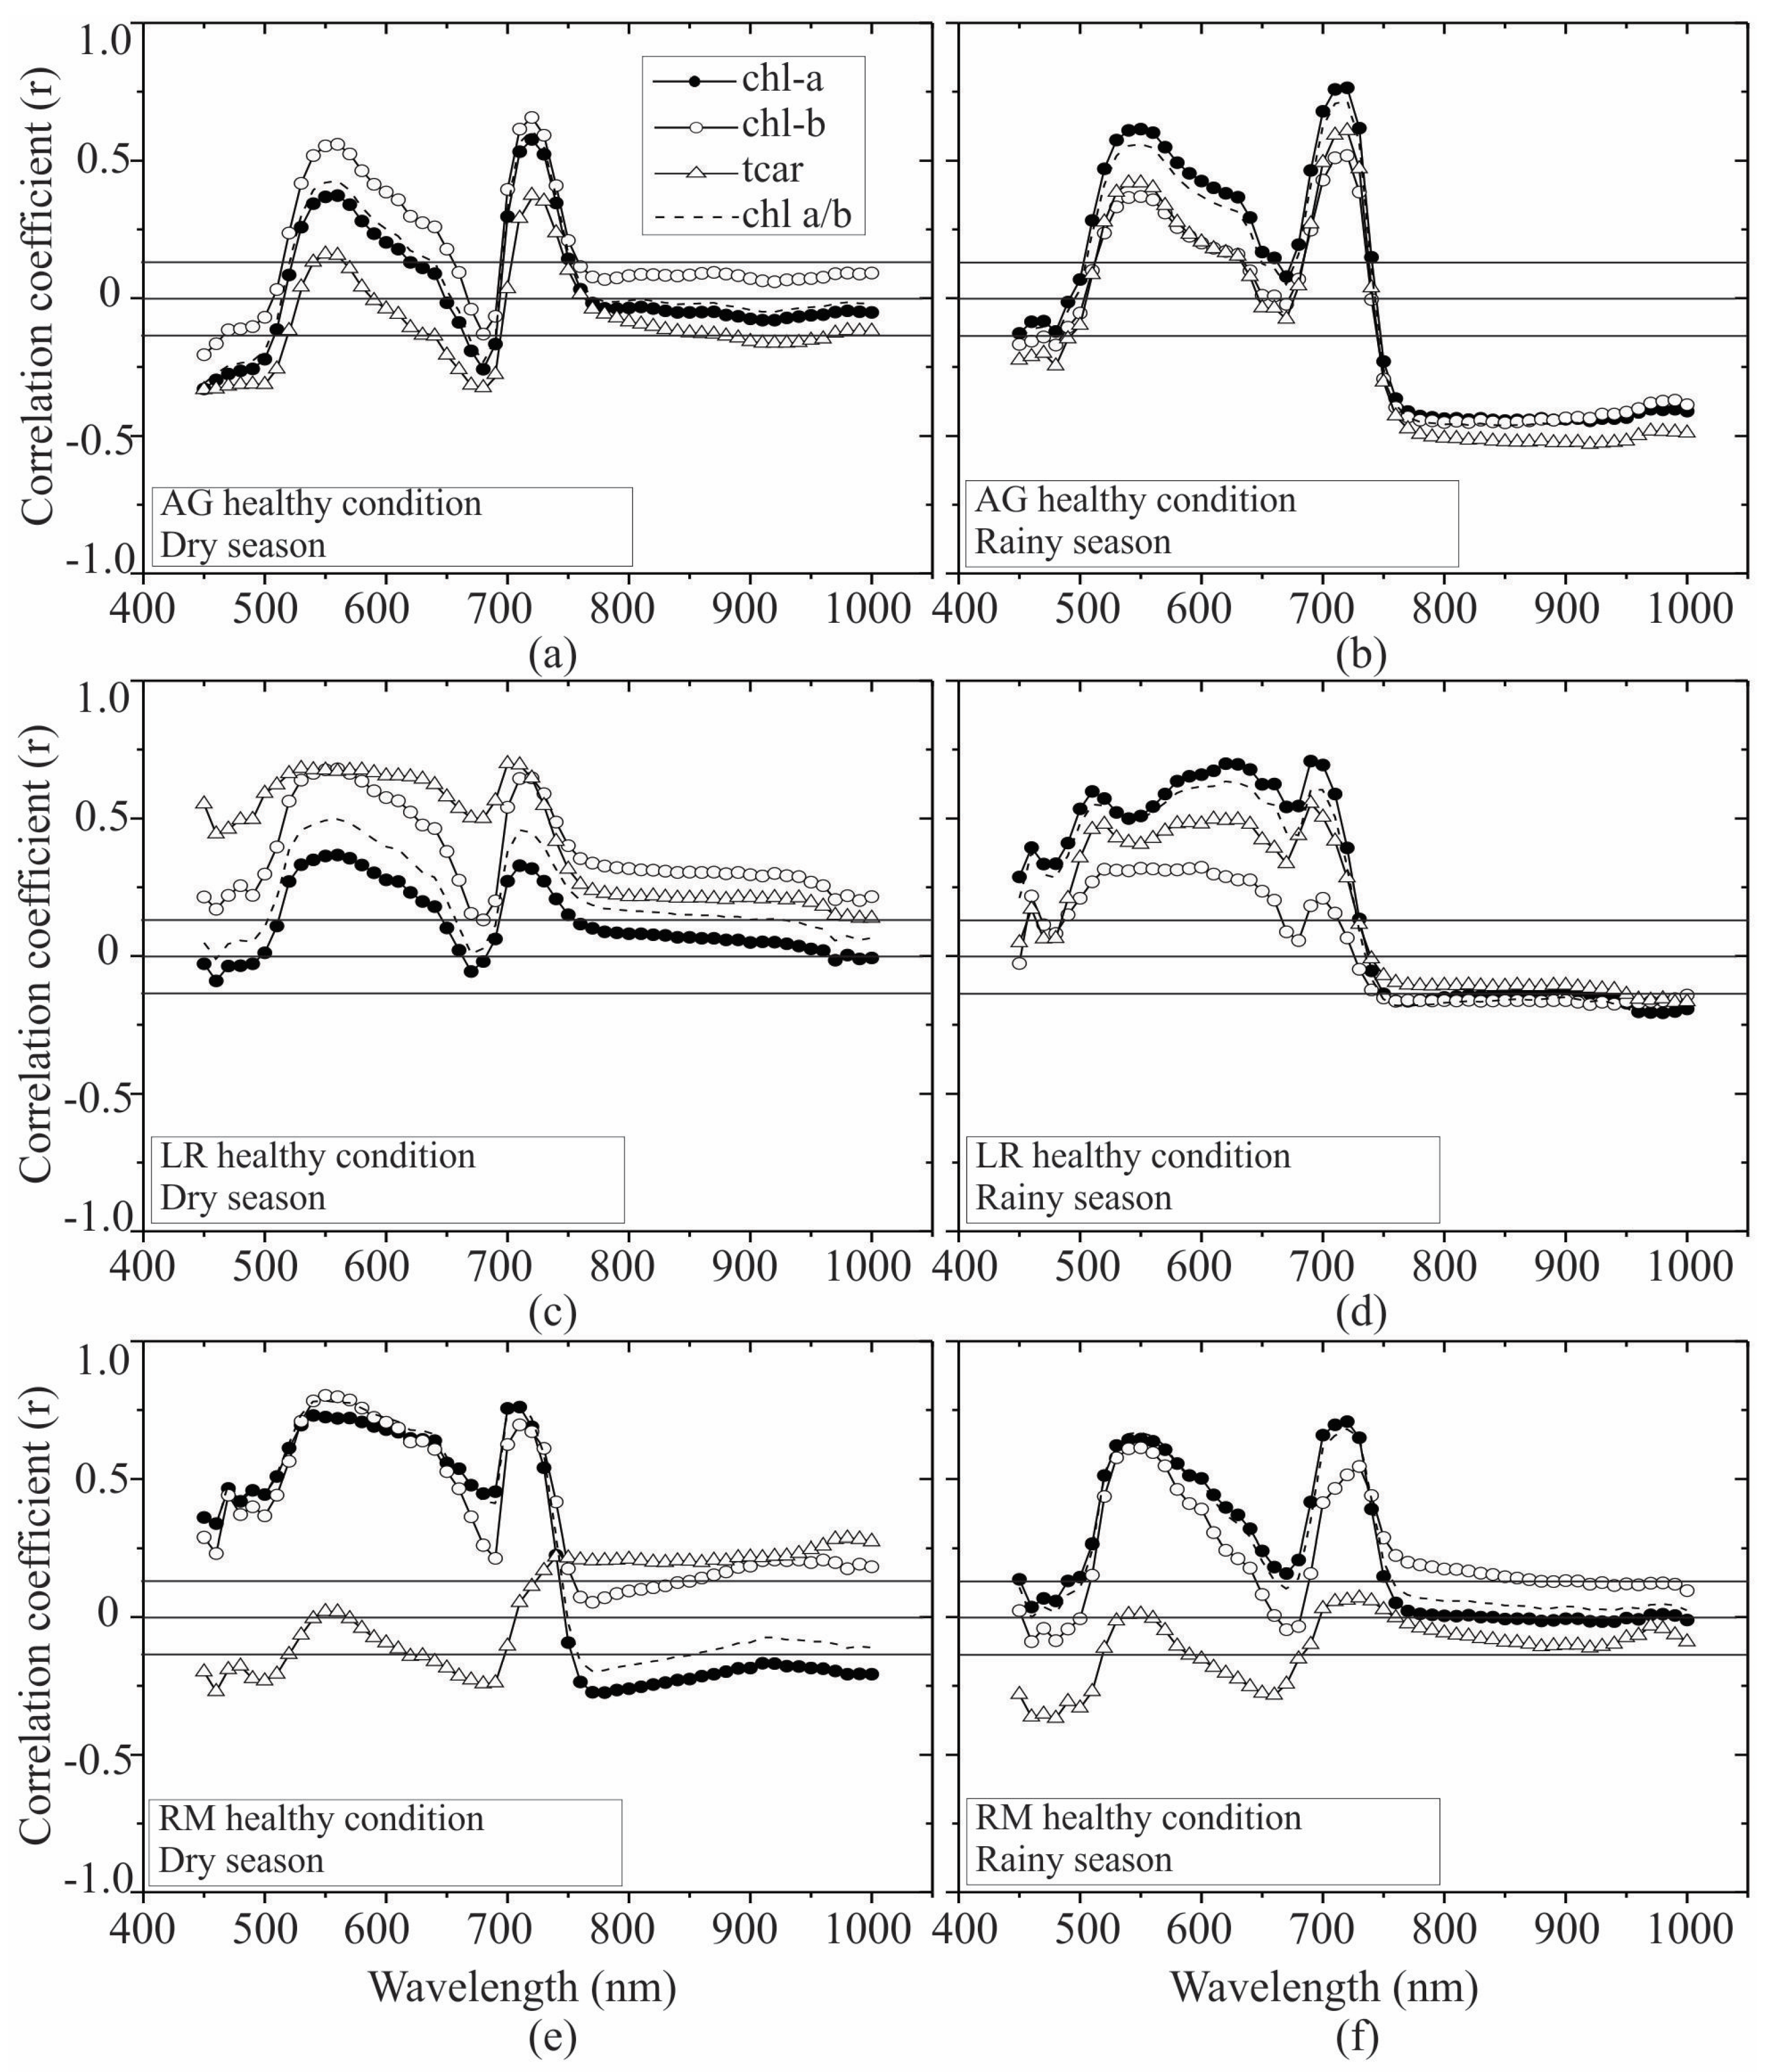
3.2. Seasonal Assessment of the Spectroscopy Correlations

Figure 5 shows the correlation coefficient (r) between pigment contents and pseudo-absorption for the stressed mangroves. During the dry season, the stress black mangrove presented a notable increase in the correlation coefficient of the chl-a, chl-b, and chl a/b ratio at the green (r = 0.83, 570 nm) and red-edge (r = 0.9, 710 nm) wavelengths (Figure 5a). A similar pattern was found during the rainy season (Figure 5b), but the correlation coefficients were lower (r = 0.63, 570 and 710 nm). The stressed red mangrove displayed a similar pattern to the black mangrove for both seasons with the maximum correlation coefficients of chl-a and chl-b recorded for the same wavelengths (i.e., 570 and 710 nm) (Figure 5e,f). It is important to note that the chl-b correlation coefficients were slightly lower compared to the chl-a for the stress black and red mangroves. Although the tcar pattern was quite different to the chl-a and chl-b for the stressed black and red mangroves, their locations of the relatively maximum correlation were similar to that of the chl-a and chl-b. Interestingly, the stressed white mangrove was the only class that did not show any high correlation values (e.g., r > 0.50) for the chl-a and chl-b for both seasons (Figure 5c,d). Clearly, the correlation coefficients of the white mangrove were much lower compared to the black and red mangroves.
Unlike the stressed trees, the correlation coefficient for the healthy mangroves (Figure 6) did not show evidence of seasonal change for the chl-a and chl-b in some of the classes. The healthy black and red mangroves depicted a similar pattern for both seasons, but the chl-b had slightly higher correlation compared to the chl-a at the same wavelengths (i.e., 570 and 710 nm) in the dry season; and the opposite situation, higher chl-a correlation for the rainy season (Figure 6). The tcar content presented a similar arrangement compared to the chl-b content in the healthy black and white mangroves during both seasons (Figure 6a–d) but not so for the healthy red mangrove (Figure 6e,f). Interestingly, the healthy white mangrove had higher correlations with accessory pigments (chl-b and tcar) at the green and red wavelengths during the dry season (Figure 6c); and higher correlations with the major pigment (i.e., chl-a) during the rainy season (Figure 6d). It is important to note that the chl a/b ratio showed a clear relationship with the chl-a pattern for all of the three mangrove species.
Seasonal differences between the linear equations, based on leaf chl-a with the VIs, were clearly evident with coefficients of determination (R2) higher during the dry season (Table 3 and Table 4). In contrast, the R2 from the chl-b equations presented lower values with only a few significant results. Additionally, none of the equations were significant for the tcar determination. As expected, the white mangrove showed minimum R2 for chl-a and chl-b for the stressed classes during the dry season. Overall, the REIP index provided the highest R2 for chl-a during both seasons. Although the R2 values from the chl-b regression were lower compared to the chl-a, the REIP and Vog1 indices presented the highest R2. However, there were some species that presented high PRI index R2 for the chl-b in the healthy classes.
Regarding pigment content estimation, the leaf chl-a estimation for the dry season in the stressed classes also showed lower SEs when compared to those calculated from the rainy season data, with the exception of the white mangrove. Conversely, the healthy classes showed lower SE values during the rainy season except for the PRI index (Figure 7). Overall, the REIP index was found to be the optimal index for the stressed classes during both the dry and the rainy seasons. Regarding the chl-b estimation, the REIP index was found to be optimal during the dry and rainy seasons in the stressed white mangrove. However, the PRI worked quite well for red mangrove estimates during the two seasons (Figure 8). For the healthy classes, the PRI was found to be the index for red mangrove estimation in the dry season, whereas the REIP and the Vog1 indices did better for the black and white mangroves.

4. Discussion

There is a constant need to improve and develop new techniques to assess biochemical mangrove characteristics for environmental purposes. This study assessed seasonal relationships between leaf reflectance and pigment contents, among the three species and two conditions (stress and healthy) for a semi-arid region of Mexico. The results from our investigation indicated that the unique spectral signatures of the six mangrove classes could, to some degree, be explained in terms of leaf pigment variability. Moreover, the results would indicate that fresh water availability and proximity to the tidal channel greatly influences the mangrove leaf chlorophyll content. In fact, mangroves are generally considered a very tolerant group of trees because they can accommodate very stressful conditions encountered along tropical and subtropical coastlines. However, mangroves located in subtropical regions (i.e., arid or semi-arid environment) are very sensitive to seasonal variability in precipitation, hydroperiod (i.e., duration of flooding), and light irradiance levels [4,48]. Hence, it has been suggested that higher solar irradiance and hypersaline conditions could affect mangrove growth in subtropical regions by affecting metabolic processes such as the reduction in the stomatal conductance [10]. Given the sub-optimal hydrological conditions (salinity of 35–80 psu) present for even the healthier mangroves of this semi-arid subtropical forest it is not surprising to find much lower overall chlorophyll content as compared to mangroves located in more tropical latitudes [57] where higher freshwater inputs and less severe seasonality are present.
The importance of the green and red-edge wavelengths is not a novel contribution to the reflectance assessments of tropical leaf pigment contents. For instance, previous studies have found high sensitivity to pigment content using reflectance at wavelengths around 550 nm and 705 nm in a variety of plants [58,59,60,61,62,63]. However, the differences among the three species regarding pigment contents linked to the high variability in the spectroscopy responses among our mangroves, suggest that the three species respond differently due to seasonal and tree health condition. Thus, in our study chl-a, chl-b, and tcar presented the highest correlations at similar wavelengths, even though the three pigments are chemically quantified using different absorbance equations [54].
Based on the correlograms from Figure 5 and Figure 6, the specific reflectance at the 550–570 nm and 705–715 nm could be suitable for remote sensing estimations of chl-a leaf contents in some species of mangroves (e.g., red and black). As a result, reflectance-based algorithms such as Vog1 and REIP for quantifying mangrove leaf chl-a and chl-b contents in semi-arid regions should use the wavebands between 550–570 nm (green channel) and 705–715 nm (red-edge) as optimal zones. Conversely, wavelengths at the 650–680 nm (red channel), and 732–1000 nm (near-infrared) ranges should be used as insensitive areas. Contrary to [26], we did not find high correlation values within the near-infrared regions (800–1000 nm). However, they tested different species of mangroves (i.e., Avicennia alba, Avicennia marina, and Rhizophora mucronata). Consequently, these results indicate that each mangrove species and condition should be considered when dealing with spectroscopy assessments of leaf pigment contents. Additionally, it is also apparent that seasonality can play a key role in the success of such endeavors as shown for these semi-arid mangroves.
While the methods used in our study may not provide the most accurate results of leaf pigment contents for all mangrove species, it does offer a convenient approach when considering seasonal spectroscopy variability for the three dominant mangrove species of the Americas. We believe the use of mangrove leaves from different conditions (i.e., fringe–basin) provides a more realistic assessment of the relationships between reflectance and mangrove leaf pigment contents as the samples were collected within close proximity from one another and yet shown such high variability.
Among the three mangrove species analyzed in our study, L. racemosa was the most difficult to assess regarding the relationships between the reflectance and the leaf pigment contents. Compared to the red and black mangroves under stress condition, the white mangrove showed minimal correlations throughout the wavelengths with the leaf chlorophylls content (i.e., chl-a and chl-b). This pattern was less evident in the healthy classes, but the white mangrove still showed the lowest correlations with both chlorophylls during the dry and rainy seasons. Unfortunately, there are just a few works related to mangrove reflectance at the leaf level (e.g., [24,25,26,27,28,29,30,32]), and at the canopy level (e.g., [64,65,66,67]) to derive general assumptions of these relationships which can be a challenge give the variety of mangrove species and conditions found around the world. Previous works, for example, used the same three mangrove species in the tropical coast of Panama for reflectance separability among such species [25]. A more recent work carried out by [26] assessed the separability at leaf level, but in tropical mangrove species in the Indian Ocean (i.e., Avicennia alba, Avicennia marina, Rhizophora mucronata, and Sonneratia caseolaris). The closest work in semi-arid mangroves using spectroscopy data and pigment content was performed by [27] who used the same three mangrove species for their assessment. However, only the red and black mangroves were used for the leaf pigment contents determination, but similar results with maximum correlations and the green and the red-edge were found. As mentioned before, further investigation needs to be carried out regarding mangrove biochemistry at the leaf level for the accurate explanation of L. racemosa response found in our study.
There may be many reasons why the observed discrepancies in relationships among the mangrove species and conditions were observed in this study. For example, the locations of the spectral responses of mangrove leaf pigments are between 400–700 nm [68], and the organic compounds related to the absorption features in the visible and near-infrared regions are responses to inorganic C-H, N-H, and O-H bonds [26]. Primary results indicate that the reflectance characteristics of each mangrove are related to the absorption properties of the organic compounds presented within the leaves. According to Snedaker et al. [69], L. racemosa is the only mangrove species in the Americas that has shown to decrease stomatal conductance under high CO2 levels. Moreover, they indicated that the water use efficiency of L. racemosa was highly altered under the same conditions. Consequently, it is possible that L. racemosa might have a competitive disadvantaged among other mangrove species, particularly in semi-arid regions [2]. For example, it is well known that mangroves from semi-arid regions can grow under salt concentration as high as 80 psu [2,70] and that L. racemosa is the most susceptible to salinity changes, which affects the stomatal conductance of their leaves through variations in salinity, humidity, soil moisture, and temperature. Consequently, L. racemosa leaf structure becomes unstable by isotope fraction [71], under adverse salinity levels affecting the chemical composition and biochemical responses. L. racemosa manages salinity by controlling stomatal aperture, which in turn maintains carbon gain with improved leaf water use efficiency, but at the same time brings a parallel decline in potential nitrogen use effectiveness [72]. In this sense, under stressful conditions as shown in our study area, L. racemosa trees could change the biochemical properties of their leaves, affecting the reflectance as potentially seen in our investigation.
The dissipation of the excess of energy as heat, and the presence of tcar is common in stressed plants [33]. In our study, there was a clear pattern among the healthy mangroves during the rainy season, where the tcar content decreased for all three species. Although there were no seasonal differences in chl-a and chl-b content among the healthy classes of R. mangle and A. germinans, the tcar significantly decreased while the chl a/b ratio remained constant. This pattern could be explained using the suggestions by [48], where fringe mangroves (i.e., healthy) from semi-arid regions are constantly flooded by local tidal influence avoiding hypersaline conditions and, thus, variability in major pigments, such as chl-a, are not affected by seasonal precipitation. However, the decrease of tcar during the rainy season could be the result of less solar irradiance as compared to the dry season. Changes in pigment composition results in visible and near-infrared alterations and thus the structure and function of the photosynthetic apparatus is adjusted in leaves depending on the response to changes of irradiance [33]. It has been widely accepted that photosynthetic pigments, mostly chl-a and chl-b, tend to increase with decreasing irradiance facilitating light harvesting in shade-tolerant species [73]. Contrary, shade-intolerant species such as L. racemosa [2,48] could increase the canopy cover and thus decrease the leaf chl-a content when optimal environmental conditions (i.e., rainy season) are present such as shown in this investigation.

5. Conclusions

Mangrove forests are one of the most important coastal ecosystems within tropical and subtropical regions, and yet, these forested wetlands are under a constant degradation due to many anthropogenic perturbations. This study aimed to examine the seasonal relationships between reflectance (400–1000 nm) and leaf pigment contents (chl-a, chl-b, tcar, and chl a/b ratio) in three mangrove species (A. germinans, L. racemosa, and R. mangle) under various conditions (stress vs. healthy) and two seasons (dry vs. rainy). The results of this study indicate that stressed mangroves had much higher variability in chl-a content during the dry season as compared to the same trees during the rainy season. Consequently, it is likely that photosynthesis in the stressed mangroves classes is frequently light saturated. Any excess of light would be wasteful and could, in fact, give raise to photoinhibition and other harmful effects. Contrary to the stressed mangroves, the correlation coefficient for the healthy mangroves did not show an evident seasonal change for the chl-a content. The results also indicate that spectrally, mangrove species and health conditions are relatively distinct in various wavelength regions. For instance, the stressed mangroves presented highest correlation with chl-a in the green and red-edge regions (r = 0.8 and 0.9, respectively), while correlation with tcar content did not show a relationship with reflectance during the both seasons. Conversely, relations with accessory pigment such as chl-b were higher in the three mangrove species under healthy condition during the dry season.
Monitoring the condition of mangrove forests using detailed spectroscopy correlations at the leaf level is the first obvious step in obtaining accurate spaceborne monitoring of large mangrove areas at the canopy level using high spatial resolution imagery. However, further studies should include the examination of the potential influence of canopy structure characteristics, such as leaf orientation, leaf morphology, three height, canopy coverage, and background information on the spectral response.
We believe that the present study is the first to include white mangrove spectroscopy correlation with pigment contents for semi-arid regions. Consequently, the identification of locations of high correlation along the electromagnetic spectrum could provide reliable information for accurate quantification of pigments. This could be of utmost importance for primary productivity models, carbon balance, and ecological assessments.

Acknowledgments

The first author acknowledges financial support for this research through grants provided by the Consejo Nacional de Ciencia y Tecnología of Mexico (CONACYT grant #198885), the Dirección General de Asuntos del Personal Académico (DGAPA-UNAM), the Programa de Apoyo a Proyectos de Investigación e Innovación Tecnológica (PAPIIT grant #IN211213) of the Universidad Nacional Autónoma de México (UNAM) and from a Natural Sciences and Engineering Research Council (NSERC) of Canada Discovery grant awarded to the third author. The second author also acknowledges financial support through a NSERC Discovery grant (grant #RGPIN-2014-06188). Funding for the field campaigns was provided to the fourth author through the Instituto de Ciencias del Mar y Limnología, UNAM.

Author Contributions

F.F.S., J.M.K., J.W., and F.F.V. are the principal authors of this manuscript having written the manuscript. The other co-authors contributed in the interpretation and discussion of the results and contributed some portions of the manuscript.

Conflicts of Interest

The authors declare no conflict of interest.

References

  1. Blasco, F.; Saenger, P.; Janodet, E. Mangroves as indicators of coastal change. Catena 1996, 27, 167–178. [Google Scholar] [CrossRef]
  2. Saenger, P. Mangrove Ecology, Silviculture, and Conservation, 1st ed.; Kluwer Academic Publisher: London, UK, 2002. [Google Scholar]
  3. Walters, B.B.; Rönnbäck, P.; Kovacs, J.M.; Crona, B.; Hussain, A.; Badola, R.; Dahdouh-Guebas, F.; Barbier, E. Ethnobiology, socio-economics and management of mangrove forests: A review. Aquat. Bot. 2008, 89, 220–236. [Google Scholar] [CrossRef]
  4. Flores-Verdugo, F.; Day, J.W.; Briseño-Dueñas, R. Structure, litter fall, decomposition, and detritus dynamics of mangroves in a Mexican coastal lagoon with an ephemeral inlet. Mar. Ecol. Prog. Ser. 1987, 35, 83–90. [Google Scholar] [CrossRef]
  5. Bashan, Y.; Holguin, G. Plant growth-promoting bacteria: A potential tool for arid mangrove reforestation. Trees 2002, 16, 159–166. [Google Scholar] [CrossRef]
  6. Kristensen, E.; Bouillon, S.; Dittmar, T.; Marchand, C. Organic carbon dynamics in mangrove ecosystems: A review. Aquat. Bot. 2008, 89, 201–219. [Google Scholar] [CrossRef]
  7. Dittmar, T.; Hertkorn, N.; Kattner, G.; Lara, R.J. Mangroves, a major source of dissolved organic carbon to the oceans. Global Biogeochem. Cycles 2006, 20, GB1012. [Google Scholar] [CrossRef]
  8. Raven, P.H.; Evert, R.F.; Eichhorn, S.E. Biology of Plants, 8th ed.; Worth Publishers: New York, NY, USA, 2012. [Google Scholar]
  9. Feller, I.C.; Whigham, D.F.; O’Neill, J.P.; McKee, K.L. Effects of nutrient enrichment on within-stand cycling in a mangrove forest. Ecology 1999, 80, 2193–2205. [Google Scholar] [CrossRef]
  10. Gilman, E.L.; Ellison, J.; Duke, N.C.; Field, C. Threats to mangroves from climate change and adaptation options: A review. Aquat. Bot. 2008, 89, 237–250. [Google Scholar] [CrossRef]
  11. Valiela, I.; Bowen, J.L.; York, J.K. Mangrove forest: One of the worlds threatened major tropical environments. BioScience 2001, 51, 807–815. [Google Scholar] [CrossRef]
  12. Polidoro, B.A.; Carpenter, K.E.; Collis, L.; Duke, N.C.; Ellison, A.M.; Ellison, J.C.; Farnsworth, E.J.; Fernando, E.S.; Kathiresan, K.; Koedam, N.E.; et al. The loss of species: Mangrove extinction risk and geographic areas of global concern. PLoS ONE 2010, 5, e10095. [Google Scholar] [CrossRef] [PubMed]
  13. Duke, N.C.; Meynecke, J.O.; Dittman, S.; Ellison, A.M.; Anger, K.; Berger, U.; Cannicci, S.; Diele, K.; Ewel, K.C.; Field, C.D.; et al. A world without mangroves? Science 2007, 317, 41–42. [Google Scholar] [CrossRef] [PubMed] [Green Version]
  14. Heumann, B.W. Satellite remote sensing of mangrove forests: Recent advances and future opportunities. Prog. Phys. Geog. 2011, 35, 87–108. [Google Scholar] [CrossRef]
  15. Kuenzer, C.; Bluemel, A.; Gebhardt, S.; Quoc, T.V.; Dech, S. Remote sensing of mangrove ecosystems: A review. Remote Sens. 2011, 3, 878–928. [Google Scholar] [CrossRef]
  16. Flores-de-Santiago, F.; Kovacs, J.M.; Lafrance, P. An object-oriented classification method for mapping mangroves in Guinea, West Africa, using multipolarized ALOS PALSAR L-band data. Int. J. Remote Sens. 2013, 34, 563–586. [Google Scholar] [CrossRef]
  17. Kovacs, J.M.; Jiao, X.; Flores-de-Santiago, F.; Zhang, C.; Flores-Verdugo, F. Assessing relationships between Radarsat-2 C-band and structural parameters of a degraded mangrove forest. Int. J. Remote Sens. 2013, 34, 7002–7019. [Google Scholar] [CrossRef]
  18. Kovacs, J.M.; Lu, X.X.; Flores-Verdugo, F.; Zhang, C.; Flores-de-Santiago, F.; Jiao, X. Applications of ALOS PALSAR for monitoring biophysical parameters of a degraded black mangrove (Avicennia germinans) forest. ISPRS J. Photogramm. Remote Sens. 2013, 82, 102–111. [Google Scholar] [CrossRef]
  19. Souza-Filho, P.W.M.; Paradella, W.R. Recognition of the main geobotanical features along the Braganca mangrove coast (Brazilian Amazon region) from Landsat TM and RADARSAT-a data. Wetlands Ecol. Manag. 2002, 10, 121–130. [Google Scholar] [CrossRef]
  20. Sulong, I.; Mohd-Lokman, H.; Mohd-Tarmizi, K.; Ismail, A. Mangrove mapping using Landsat imagery and aerial photographs: Kemaman district, Terengganu, Malaysia. Environ. Dev. Sustain. 2002, 4, 135–152. [Google Scholar] [CrossRef]
  21. Wang, Y.; Bonynge, G.; Nugranad, J.; Traber, M.; Ngusaru, A.; Tobey, J.; Hale, L.; Bowen, R.; Makota, V. Remote sensing of mangrove change along the Tanzania coast. Mar. Geod. 2003, 26, 35–48. [Google Scholar] [CrossRef]
  22. Godstime, K.J.; Adegoke, J.O.; Saba, E.; Nwilo, P.; Akinyede, J. Satellite-based assessment of the extent and changes in the mangrove ecosystem of the Niger delta. Mar. Geod. 2007, 30, 249–267. [Google Scholar]
  23. Satyanarayana, B.; Mohamad, K.A.; Idris, I.F.; Husain, M.L.; Dahdouh-Guebas, F. Assessment of mangrove vegetation based on remote sensing and ground-truth measurements at Tumpat, Kelantan Delta, East Coast of Peninsular Malaysia. Int. J. Remote Sens. 2011, 32, 1635–1650. [Google Scholar] [CrossRef]
  24. Vaiphasa, C.; Ongsomwang, S.; Vaiphasa, T.; Skidmore, A.K. Tropical mangrove species discrimination using hyperspectral data: A laboratory study. Estuar. Coast. Shelf Sci. 2005, 65, 371–379. [Google Scholar] [CrossRef]
  25. Wang, L.; Sousa, W.P. Distinguishing mangrove species with laboratory measurements of hyperspectral leaf reflectance. Int. J. Remote Sens. 2009, 30, 1267–1281. [Google Scholar] [CrossRef]
  26. Panigrahy, S.; Kumar, T.; Manjunath, K.R. Hyperspectral leaf signature as an added dimension for species discrimination: Case of study of four tropical mangroves. Wetlands Ecol. Manag. 2012, 20, 101–110. [Google Scholar] [CrossRef]
  27. Zhang, C.; Liu, Y.; Kovacs, J.M.; Flores-Verdugo, F.; Flores-de-Santiago, F.; Chen, K. Spectral response to varying levels of leaf pigments collected from a degraded mangrove forest. J. Appl. Remote Sens. 2012, 6, 063501. [Google Scholar]
  28. Zhang, C.; Kovacs, J.M.; Wachowiak, M.P.; Flores-Verdugo, F. Relationship between hyperspectral measurements and mangrove leaf nitrogen concentrations. Remote Sens. 2013, 5, 891–908. [Google Scholar] [CrossRef]
  29. Flores-de-Santiago, F.; Kovacs, J.M.; Flores-Verdugo, F. The influence of seasonality in estimating mangrove leaf chlorophyll-a content from hyperspectral data. Wetlands Ecol. Manag. 2013, 21, 193–207. [Google Scholar] [CrossRef]
  30. Zhang, C.; Kovacs, J.M.; Liu, Y.; Flores-Verdugo, F.; Flores-de-Santiago, F. Separating mangrove species and conditions using laboratory hyperspectral data: A case of study of a degraded mangrove forest of the Mexican Pacific. Remote Sens. 2014, 6, 11673–11688. [Google Scholar] [CrossRef]
  31. Cochrane, M.A. Using vegetation reflectance variability for species level classification of hyperspectral data. Int. J. Remote Sens. 2000, 21, 2075–2087. [Google Scholar] [CrossRef]
  32. Vaiphasa, C.; Skidmore, A.K.; de Boer, W.F.; Vaiphasa, T. A hyperspectral band selector for plant species discrimination. ISPRS J. Photogramm. Remote Sens. 2007, 62, 225–235. [Google Scholar] [CrossRef]
  33. Hopkins, W.G.; Hüner, N.P.A. Introduction to Plant Physiology, 4th ed.; John Wiley & Sons: New York, NY, USA, 2008. [Google Scholar]
  34. Jensen, J.R. Introductory Digital Image Processing, 3rd ed.; Pearson Education, Inc.: New York, NY, USA, 2005. [Google Scholar]
  35. Sims, D.A.; Gamon, J.A. Relationships between leaf pigment content and spectral reflectance across a wide range of species, leaf structures and developmental stages. Remote Sens. Environ. 2002, 81, 337–354. [Google Scholar] [CrossRef]
  36. Peñuelas, J.; Filella, I. Visible and near-infrared reflectance techniques for diagnosing plant physiological status. Trends Plant Sci. 1998, 3, 151–156. [Google Scholar] [CrossRef]
  37. Blackburn, G.A. Relationships between spectral reflectance and pigment concentrations in stack of deciduous broadleaves. Remote Sens. Environ. 1999, 70, 224–237. [Google Scholar] [CrossRef]
  38. Zarco-Tejada, P.J.; Miller, J.R.; Noland, T.L.; Mohammed, G.H.; Sampson, P.H. Scaling-up and model inversion methods with narrowband optical indices for chlorophyll content estimation in closed forest canopies with hyperspectral data. IEEE Trans. Geosci. Remote Sens. 2001, 39, 1491–1506. [Google Scholar] [CrossRef]
  39. Zarco-Tejada, P.J.; Pushnik, J.C.; Dobrowski, S.; Ustin, S.L. Steady state chlorophyll a fluorescence detection from canopy derivative reflectance and double-peak red edge effects. Remote Sens. Environ. 2003, 84, 283–294. [Google Scholar] [CrossRef]
  40. Wu, C.; Niu, Z.; Tang, Q.; Huang, W. Estimating chlorophyll content from hyperspectral vegetation indices: Modeling and validation. Agric. For. Meteorol. 2008, 148, 1230–1241. [Google Scholar] [CrossRef]
  41. Blackburn, G.A. Quantifying chlorophylls and carotenoids at leaf level and canopy scales: An evaluation of some hyperspectral approaches. Remote Sens. Environ. 1998, 66, 273–285. [Google Scholar] [CrossRef]
  42. Merzlyak, M.N.; Solovchenko, A.E.; Gitelson, A.A. Reflectance spectral features and non-destructive estimation of chlorophyll, carotenoid and anthocyanin content in apple fruit. Postharvest Biol. Technol. 2003, 27, 197–211. [Google Scholar] [CrossRef]
  43. Vittorio, A.V.D. Enhancing leaf radiative transfer model to estimate concentrations and in vivo specific absorption coefficients of total carotenoids and chlorophylls a and b from single-needle reflectance and transmittance. Remote Sens. Environ. 2009, 113, 1948–1966. [Google Scholar] [CrossRef]
  44. Garrity, S.R.; Eitel, J.U.H.; Vierling, L.A. Disentangling the relationships between plant pigments and the photochemical reflectance index reveals a new approach for remote estimation of carotenoid content. Remote Sens. Environ. 2011, 115, 628–635. [Google Scholar] [CrossRef]
  45. Dale, M.P.; Causton, D.R. Use of the chlorophyll a/b ratio as a bioassay for the light environment of a plant. Funct. Ecol. 1992, 6, 190–196. [Google Scholar] [CrossRef]
  46. Li, G.; Wan, S.; Zhou, J.; Yang, Z.; Qin, P. Leaf chlorophyll fluorescence, hyperspectral reflectance, pigments content, malondialde-hyde and proline accumulation responses of castor bean (Ricinus communis L.) seedlings to salt stress levels. Ind. Crop. Prod. 2010, 31, 13–19. [Google Scholar] [CrossRef]
  47. Main, R.; Cho, M.A.; Mathieu, R.; O’Kennedy, M.M.; Ramoelo, A.; Koch, S. An investigation into robust spectral indices for leaf chlorophyll estimation. ISPRS J. Photogramm. Remote Sens. 2011, 66, 751–761. [Google Scholar] [CrossRef]
  48. Flores-de-Santiago, F.; Kovacs, J.M.; Flores-Verdugo, F. Seasonal changes in leaf chlorophyll a content and morphology in a sub-tropical mangrove forest of the Mexican Pacific. Mar. Ecol. Prog. Ser. 2012, 444, 57–68. [Google Scholar] [CrossRef]
  49. Villalba, L.A. Descripción general del estero de Urías, Mazatlán, Sinaloa. Cienc. Mar. 1986, 8, 32–37. [Google Scholar]
  50. Arreola-Lizarraga, J.A.; Flores-Verdugo, F.J.; Ortega-Rubio, A. Structure and litterfall of an arid mangrove stand on the Gulf of California, Mexico. Aquat. Bot. 2004, 79, 137–143. [Google Scholar] [CrossRef]
  51. Kovacs, J.M.; Liu, Y.; Zhang, C.; Flores-Verdugo, F.; Flores-de-Santiago, F. A field based statistical approach for validating a remotely sensed mangrove forest classification scheme of Isla La Palma, Sinaloa, Mexico. Wetlands Ecol. Manag. 2011, 19, 409–421. [Google Scholar] [CrossRef]
  52. Flores-de-Santiago, F.; Kovacs, J.M.; Flores-Verdugo, F. Assessing the utility of a portable pocket instrument for estimating seasonal mangrove leaf chlorophyll contents. Bull. Mar. Sci. 2013, 89, 621–633. [Google Scholar] [CrossRef]
  53. Biber, P.D. Evaluating a chlorophyll content meter on three coastal wetland plant species. Agric. Food Environ. Sci. 2007, 1, 1–11. [Google Scholar]
  54. Lichtenthaler, H.K.; Wellburn, A.R. Determination of total carotenoids and chlorophylls a and b in leaf extracts in different solvents. Biochem. Soc. Trans. 1983, 11, 591–592. [Google Scholar] [CrossRef]
  55. Chatfield, C. Fitting time-series models in the time domain. In The Analysis of Time Series an Introduction, 6th ed.; Chatfield, C., Ed.; Chapman & Hall: London, UK, 1996; Volume 4, pp. 49–53. [Google Scholar]
  56. Uraibi, H.S.; Midi, H.; Talib, B.A.; Yousif, J.B. Linear regression model selection based on robust bootstrapping technique. Am. J. Appl. Sci. 2009, 6, 1191–1198. [Google Scholar] [CrossRef]
  57. Parida, A.K.; Das, A.B.; Mittra, B. Effects of salt on growth, ion accumulation, photosynthesis and leaf anatomy of the mangrove, Bruguiera parviflora. Trees 2004, 18, 167–174. [Google Scholar] [CrossRef]
  58. Gitelson, A.A.; Merzlyak, M.N. Spectral reflectance changes associated with autumn senescence of Aesculus hippocastanum L. and Acer platanoides L. leaves. Spectral features and relation to chlorophyll estimation. J. Plant Physiol. 1994, 143, 286–292. [Google Scholar] [CrossRef]
  59. Gitelson, A.A.; Merzlyak, M.N.; Grits, Y. Novel algorithms for remote sensing of chlorophyll content in higher plants. IEEE Trans. Geosci. Remote Sens. 1996, 4, 2355–2357. [Google Scholar]
  60. Gitelson, A.A.; Kaufman, Y.J.; Merzlyak, M.N. Use of a green channel in remote sensing of global vegetation from EOS-MODIS. Remote Sens. Environ. 1996, 58, 289–298. [Google Scholar] [CrossRef]
  61. Gitelson, A.; Merzlyak, M.N.; Lichtenthaler, H.K. Detection of red edge position and chlorophyll content by reflectance measurements near 700 nm. J. Plant Physiol. 1996, 148, 501–508. [Google Scholar] [CrossRef]
  62. Lichtenthaler, H.K.; Gitelson, A.; Lang, M. Nondestructive determination of chlorophyll content of leaves of a green and an aurea mutant of tobacco by reflectance measurements. J. Plant Physiol. 1996, 148, 483–493. [Google Scholar] [CrossRef]
  63. Datt, B. Remote sensing of chlorophyll a, chlorophyll b, chlorophyll a + b, and total carotenoid content in Eucalyptus leaves. Remote Sens. Environ. 1998, 66, 111–121. [Google Scholar] [CrossRef]
  64. Held, A.; Ticehurst, C.; Lymburner, L.; Williams, N. High resolution mapping of tropical mangrove ecosystems using hyperspectral and radar remote sensing. Int. J. Remote Sens. 2003, 24, 2739–2759. [Google Scholar] [CrossRef]
  65. Hirano, A.; Madden, M.; Welch, R. Hyperspectral image data for mapping wetland vegetation. Wetlands 2003, 23, 436–448. [Google Scholar] [CrossRef]
  66. Yang, C.; Everitt, J.H.; Fletcher, R.S.; Jensen, R.R.; Mausel, P.W. Evaluating AISA + hyperspectral imagery for mapping black mangrove along the South Texas gulf coast. Photogramm. Eng. Remote Sens. 2009, 75, 425–435. [Google Scholar] [CrossRef]
  67. Kamal, M.; Phinn, S. Hyperspectral data for mangrove species mapping: A comparison of pixel-based and object-based approach. Remote Sens. 2011, 3, 2222–2242. [Google Scholar] [CrossRef]
  68. Das, A.B.; Parida, A.; Basak, U.C.; Das, P. Studies on pigments, proteins and photosynthetic rates in some mangroves and mangrove associates from Bhitarkanika, Orissa. Mar. Biol. 2002, 141, 415–422. [Google Scholar]
  69. Snedaker, S.C.; Araujo, R.J. Stomatal conductance and gas exchange in four species of Caribbean mangrove exposed to ambient and increased CO2. Mar. Freshw. Res. 1998, 49, 325–327. [Google Scholar] [CrossRef]
  70. Tomlinson, P.B. The Botany of Mangrove; Cambridge University Press: Cambridge, UK, 1994. [Google Scholar]
  71. Wooller, M.; Smallwood, B.; Jacobson, M.; Fogel, M. Carbon and nitrogen stable isotopic variation in Laguncularia racemosa (L.) (white mangrove) from Florida and Belize: Implications for trophic level studies. Hydrobiologia 2003, 499, 13–23. [Google Scholar] [CrossRef]
  72. Sobrado, M.A. Leaf characteristics and gas exchange of the mangrove Laguncularia racemosa as affected by salinity. Photosynthetica 2005, 43, 217–221. [Google Scholar] [CrossRef]
  73. Beneragama, C.K.; Goto, K. Chlorophyll a:b ratio increases under low-light in “shade-tolerant” Euglena gracilis. Trop. Agric. Res. 2010, 22, 12–25. [Google Scholar]
Figure 1. Study site within the Mexican Pacific. Symbols in the legend indicate sample locations.
Remotesensing 08 00226 g001
Figure 2. Spectral curves of the six mangrove classes during the dry and rainy seasons based on the means and the first standard deviations: Avicennia germinans (AG), Laguncularia racemosa (LR), and Rhizophora mangle (RM). The blue line represents the p-value between the dry and rainy season at each nanometer. p = 0.05 is shown by the flat dashed line across the bottom of each graph. (a) AG stressed condition; (b) AG healthy condition; (c) LR stressed condition; (d) LR healthy condition; (e) RM stressed condition; and (f) RM healthy condition.
Remotesensing 08 00226 g002aRemotesensing 08 00226 g002b
Figure 3. ANOVA p-plots among reflectance from the three mangrove species during the dry and rainy seasons for both stressed and healthy conditions: Avicennia germinans (AG), Laguncularia racemosa (LR), and Rhizophora mangle (RM). The flat black dashed line at the bottom of each graph represents p = 0.05. (a) AG, LR, and RM stressed condition; (b) AG, LR, and RM healthy condition.
Remotesensing 08 00226 g003
Figure 4. Chlorophyll-a, chlorophyll-b, total carotenoids, and the chlorophyll a/b ratio box plots for the six classes of mangroves during the dry and rainy seasons. Each box plot depicts the mean (small square), the 25%–75% quartiles (rectangle), and the median (line dividing the box plot): LR: Laguncularia racemosa, RM: Rhizophora mangle, AG: Avicennia germinans. An asterisk indicates a seasonal significant difference at p < 0.05, based on the Mann–Whitney U-test. (a) Chlorophyll-a stressed condition; (b) chlorophyll-a healthy condition; (c) chlorophyll-b stressed condition; (d) chlorophyll-b healthy condition; (e) total carotenoids stressed condition, (f)total carotenoids healthy condition; (g) chlorophyll a/b ratio stressed condition; (h) chlorophyll a/b ratio healthy condition.
Remotesensing 08 00226 g004
Figure 5. Correlograms of leaf pigments and pseudo-absorption of mangroves under stress condition for the dry and rainy seasons. Avicennia germinans (AG), Laguncularia racemosa (LR), and Rhizophora mangle (RM). The horizontal lines at ±0.12 correlation indicate the 95% confidence limits. Chl-a overlaps the chl a/b ratio line. (a)AG dry season; (b) AG rainy season; (c) LR dry season; (d) LR rainy season; (e) RM dry season; (f) RM rainy season.
Remotesensing 08 00226 g005
Figure 6. Correlograms of leaf pigments and pseudo-absorption of mangroves under healthy condition for the dry and rainy seasons. Avicennia germinans (AG), Laguncularia racemosa (LR), and Rhizophora mangle (RM). The horizontal lines at ±0.12 correlation indicate the 95% confidence limit. (a) AG dry season, (b) AG rainy season; (c) LR dry season; (d) LR rainy season; (e) RM dry season; (f) RM rainy season. 3.3. Estimation of Chlorophyll-a, Chlorophyll-b, and Total Carotenoids Contents Based on Selected Vegetation Indices.
Remotesensing 08 00226 g006
Figure 7. Predicted versus measured chlorophyll-a content during the dry and rainy seasons based on select regression equations from Table 3 and Table 4. Hollow symbols indicate stressed mangroves while filled symbols indicate healthy mangroves. The standard error of estimate (SE) is indicated for each prediction. The dashed lines represent a 1:1 relation. (a) Stressed condition Vog1; (b) REIP; and (c) PRI; (d) healthy condition Vog1; (e) REIP; and (f) PRI.
Remotesensing 08 00226 g007
Figure 8. Predicted versus measured chlorophyll-b content during the dry and rainy seasons based on select regression equations from Table 3 and Table 4. Hollow symbols indicate stressed mangroves while filled symbols indicate healthy mangroves. The standard error of estimate (SE) is indicated for each prediction. The dashed lines represent a 1:1 relation. (a) Stressed condition Vog1; (b) REIP; and (c) PRI; (d) healthy condition Vog1; (e) REIP; and (f) PRI.
Remotesensing 08 00226 g008
Table 1. Comparing the samples from the Avicennia germinans, Laguncularia racemosa, and Rhizophora mangle, mangrove species using a Kruskal–Wallis H-test for the pigments (n = 30) during the dry season. * Significant H calculated value at α = 0.05.
PigmentConditionHp
Chl-astressed19.6 *0
Chl-bstressed7.1 *0.03
Tcarstressed45.5 *0
Chl a/bstressed40.1 *0
Chl-ahealthy26.2 *0
Chl-bhealthy42.9 *0
Tcarhealthy58.7 *0
Chl a/bhealthy13.5 *0.001
Table 2. Comparing the samples from the Avicennia germinans, Laguncularia racemosa, and Rhizophora mangle, mangrove species using a Kruskal–Wallis H-test for the pigments (n = 30) during the rainy season. * Significant H value at α = 0.05.
PigmentConditionHp
Chl-astressed42.9 *0
Chl-bstressed43 *0
Tcarstressed48 *0
Chl a/bstressed43.4 *0
Chl-ahealthy50 *0
Chl-bhealthy46.3 *0
Tcarhealthy51 *0
Chl a/bhealthy8.7 *0.013
Table 3. Regression analysis of vegetation indices with leaf pigment chlorophyll-a, chlorophyll-b, and total carotenoids for the stressed mangrove classes: Avicennia germinans (AG), Laguncularia racemosa (LR), and Rhizophora mangle (RM). * Critical F-observed value at 4.1 (α = 0.05).
PigmentSeasonSpeciesVIRegression EquationR2
AGVog10.9483 − 0.0122X0.85 *
DryAGREIP−6.56 + 0.732X0.66 *
AGPRI0.15 − 0.0037X0.51 *
LRVog10.9672 − 0.0116X0.30 *
DryLRREIP−6.981 + 0.614X0.35 *
LRPRI0.1293 − 0.0029X0.32 *
RMVog10.8316 − 0.0064X0.53 *
DryRMREIP−4.139 + 0.5007X0.82 *
chl-a RMPRI0.21 − 0.0048X0.55 *
AGVog10.763 − 0.003X0.10
RainyAGREIP−13.26 + 0.44X0.47 *
AGPRI0.029 − 0.0003X0.01
LRVog10.8738 − 0.0067X0.30 *
RainyLRREIP−24.38 + 0.786X0.40 *
LRPRI0.028 − 0.0012X0.22 *
RMVog10.868 − 0.0066X0.54 *
RainyRMREIP−28.96 + 0.95X0.61 *
RMPRI0.06 − 0.0017X0.33 *
AGVog10.9784 − 0.035X0.68 *
DryAGREIP−6.47 + 1.849X0.40 *
AGPRI0.15 − 0.009X0.29 *
LRVog10.8444 − 0.019X0.15
DryLRREIP−0.84 + 1.05X0.20
LRPRI0.09 − 0.0034X0.13
RMVog10.831 − 0.02196X0.48 *
DryRMREIP−3.418 + 1.623X0.67 *
chl-b RMPRI0.21 − 0.016X0.52 *
AGVog10.7096 − 0.0058X0.06
RainyAGREIP−7.88 + 0.94X0.40 *
AGPRI0.019 − 0.00006X0
LRVog10.7906 − 0.0113X0.19
RainyLRREIP−12.89 + 1.015X0.18
LRPRI0.013 − 0.0017X0.09
RMVog10.792 − 0.01X0.39 *
RainyRMREIP−16.24 + 1.27X0.34 *
RMPRI0.046 − 0.003X0.33 *
AGVog10.8558 − 0.0097X0.06
DryAGREIP0.825 + 0.4549X0.03
AGPRI0.079 + 0.00045X0.01
LRVog10.7469 − 0.0007X0.01
DryLRREIP5.089 − 0.0237X0.01
LRPRI0.062 + 0.0012X0.02
RMVog10.7103 − 0.0037X0.02
DryRMREIP6.706 + 0.1631X0.01
tcar RMPRI0.043 + 0.0043X0.06
AGVog10.478 + 0.01X0.19
RainyAGREIP−0.57 + 0.212X0.01
AGPRI−0.031 + 0.004X0.30
LRVog10.7705 − 0.0059X0.05
RainyLRREIP−14.5 + 0.942X0.16
LRPRI0.0022 − 0.00002X0
RMVog10.704 − 0.001X0.02
RainyRMREIP−6.32 + 0.25X0.05
RMPRI0.006 + 0.0009X0.01
Table 4. Regression analysis of vegetation indices with leaf pigment chlorophyll-a, chlorophyll-b, and total carotenoids for the healthy mangrove classes. Avicennia germinans (AG), Laguncularia racemosa (LR), and Rhizophora mangle (RM). * Critical F-observed value at 4.1 (α = 0.05).
PigmentSeasonSpeciesVIRegression EquationR2
AGVog10.7499 − 0.0043X0.47 *
DryAGREIP−1.235 + 0.4X0.68 *
AGPRI0.086 − 0.001X0.47 *
LRVog10.6255 − 0.0009X0.05
DryLRREIP11.24 + 0.0648X0.31 *
LRPRI0.0322 − 0.00016X0.11
RMVog10.6875 − 0.0027X0.53 *
DryRMREIP8.445 + 0.1774X0.73 *
chl-a RMPRI0.089 − 0.0013X0.68 *
AGVog10.765 − 0.0038X0.61 *
RainyAGREIP−17.92 + 0.547X0.72 *
AGPRI−0.0036 + 0.00001X0
LRVog10.82 − 0.0047X0.66 *
RainyLRREIP−13.66 + 0.5X0.54 *
LRPRI−0.002 − 0.0003X0.15
RMVog10.727 − 0.003X0.37 *
RainyRMREIP−1.37 + 0.28X0.57 *
RMPRI−0.01 + 0.000009X0
AGVog10.7565 − 0.0148X0.55 *
DryAGREIP−0.041 + 1.219X0.62 *
AGPRI0.092 − 0.0053X0.61 *
LRVog10.6058 − 0.00129X0.02
DryLRREIP12.07 + 0.1436X0.21 *
LRPRI0.035 − 0.0007X0.29 *
RMVog10.6021 − 0.0031X0.20 *
DryRMREIP13.75 + 0.214X0.31 *
chl-b RMPRI0.062 − 0.0024X0.62 *
AGVog10.759 − 0.011X0.63 *
RainyAGREIP−16.2 + 1.5X0.69 *
AGPRI−0.0007 − 0.0002X0.05
LRVog10.75 − 0.0076X0.26 *
RainyLRREIP−2.47 + 0.39X0.05
LRPRI−0.006 − 0.0005X0.07
RMVog10.665 − 0.0056X0.21 *
RainyRMREIP2.6 + 0.59X0.46 *
RMPRI−0.01 + 0.000048X0.01
AGVog10.6834 − 0.0068X0.08
DryAGREIP−1.856 + 1.15X0.36
AGPRI0.053 − 0.0015X0.03
LRVog10.6347 − 0.0033X0.03
DryLRREIP13.12 + 0.046X0.06
LRPRI0.029 − 0.00021X0.07
RMVog10.5874 − 0.002X0.04
DryRMREIP15.03 + 0.126X0.05
tcar RMPRI0.042 − 0.0011X0.05
AGVog10.729 − 0.01X0.2
RainyAGREIP−14.99 + 1.76X0.10
AGPRI−0.018 + 0.002X0.14
LRVog10.78 − 0.013X0.2
RainyLRREIP−9.46 + 1.39X0.02
LRPRI−0.009 − 0.0002X0.06
RMVog10.548 + 0.003X0.02
RainyRMREIP9.15 + 0.15X0.01
RMPRI−0.036 + 0.0023X0.04

