Review

VIIRS Reflective Solar Bands Calibration Progress and Its Impact on Ocean Color Products

1
NOAA National Environmental Satellite, Data, and Information Service, Center for Satellite Applications and Research, E/RA3, 5830 University Research Ct., College Park, MD 20740, USA
2
Global Science and Technology, 7855 Walker Drive, Suite 200, Greenbelt, MD 20770, USA
*
Author to whom correspondence should be addressed.
Remote Sens. 2016, 8(3), 194; https://doi.org/10.3390/rs8030194
Submission received: 28 November 2015 / Revised: 28 January 2016 / Accepted: 23 February 2016 / Published: 27 February 2016
(This article belongs to the Collection Visible Infrared Imaging Radiometers and Applications)

Abstract

:
The radiometric calibration for the reflective solar bands (RSB) of the Visible Infrared Imaging Radiometer Suite (VIIRS) on board the Suomi National Polar-orbiting Partnership (SNPP) platform has reached a mature stage after four years since its launch. The characterization of the vignetting effect of the attenuation screens, the bidirectional reflectance factor of the solar diffuser, the degradation performance of the solar diffuser, and the calibration coefficient of the RSB have all been made robust. Additional investigations into the time-dependent out-of-band relative spectral response and the solar diffuser degradation non-uniformity effect have led to newer insights. In particular, it has been demonstrated that the solar diffuser (SD) degradation non-uniformity effect induces long-term bias in the SD-calibration result. A mitigation approach, the so-called Hybrid Method, incorporating lunar-based calibration results, successfully restores the calibration to achieve ~0.2% level accuracy. The successfully calibrated RSB data record significantly impacts the ocean color products, whose stringent requirements are especially sensitive to calibration accuracy, and helps the ocean color products to reach maturity.

Graphical Abstract

1. Introduction

The Visible Infrared Imaging Radiometer Suite (VIIRS) is one of five instruments housed by the Suomi National Polar-orbiting Partnership (SNPP) satellite launched on 28 October 2011 [1,2]. It is a scanning radiometer, which collects visible and infrared imagery and radiometric measurements of the land, atmosphere, cryosphere, and oceans. With an ascending sun-synchronous orbit passing the equator around 1:30 p.m. local time, VIIRS covers almost the entire Earth surface every day. VIIRS data are used to measure cloud and aerosol properties, ocean color, sea and land surface temperature, ice motion and temperature, fires, and Earth’s albedo [1]. They are also used to improve our understanding of global climate change.
VIIRS has 22 spectral bands covering a spectral range from 0.410–12.013 µm, which include 14 reflective solar bands (RSB), 7 thermal emissive bands (TEB), and a panchromatic day/night band (DNB). The VIIRS RSB are calibrated on-orbit with an on-board solar diffuser (SD) [3,4,5], whose performance and degradation is itself tracked by a solar diffuser stability monitor (SDSM) [6,7,8]. The VIIRS RSB on-orbit changes are also monitored with scheduled monthly lunar observations through the instrument’s space view (SV) port [9,10,11,12], which is also used to provide the instrument’s dark scene response. Figure 1 is a schematic diagram for VIIRS and its on-board calibrators [13]. VIIRS views the SV, earth view (EV), blackbody (BB), and SD, respectively, via a rotating telescope assembly (RTA) and half-angle mirror (HAM). Figure 2 shows the scan angles as well as the Angle of Incidence (AOI) for each view [13,14].
The accuracy of the RSB calibration using the SD strongly depends on that of the bidirectional reflectance factor (BRF) of the SD and that of the vignetting function (VF) of the screen placed in the front of the SD port, through which the SD is illuminated by the Sun [15,16]. The BRF changes on-orbit with time due to the degradation of the SD caused by solar exposure. Any inaccuracy in the BRF or the VF brings out an annual oscillation as well as a long-term drift in the derived calibration coefficients, also called F-factors in the VIIRS community [3,4,5]. We have carefully derived the BRF and the VF [16], improved the accuracy of the SDSM calibration [8], and refined other related algorithms [5]. With these improvements, both short-term and long-term stability and high accuracy of the F-factors are obtained [5]. However, it is found that the SD degrades non-uniformly with respect to both incident and outgoing directions, thus invalidates the key assumption in the SD/SDSM calibration methodology that the SD degradation in the outgoing direction towards the SDSM can be used interchangeably with the result for the outgoing direction towards the RTA. The actual discrepancy results in a long-term bias in the calibration coefficients derived from the SD calibration, especially for short wavelength bands [5,8].
The lunar calibration does not have the long-term bias issue since the reflectance of the lunar surface is very stable in the VISible (VIS) and Near-InfraRed (NIR) spectral range [17]. However, the accuracy of the calibration strongly depends on that of view geometric effect correction [9,10,11,12,18]. Any error in the correction induces a seasonal oscillation in the calibration coefficients derived from the lunar calibration [10,11,12]. In addition, lunar calibration can only be implemented about nine months each year [9]. With careful correction of the geometric effect, stable and clean RSB calibration coefficients can be derived from the lunar calibration [12,16]. In general, the derived lunar F-factors are consistent with those derived from the SD/SDSM observations [10,11,12,16]. However, there are observable differences between the lunar and the SD F-factors [10,11,12,16]. For VIIRS, the AOI of the SD exactly coincides with that of the SV, as illustrated in Figure 2. Thus, the SD/SDSM calibration and the lunar calibration should in principle provide the same on-orbit changes over time. Considering the potential bias of the SD F-factors due to the temporal non-uniformity of the SD degradation, which is a primary reason for the differences of the two sets of F-factors, and the stability of the lunar surface’s reflectance, the lunar calibration should provide a more reliable long-term calibration baseline [16]. Nevertheless, the monthly lunar observations are infrequent and unavailable for several months of the year due to a spacecraft roll angle safety constraint preventing a lunar view through the space view port [9,10,11]. A hybrid approach has been developed to appropriately combine SD-based and lunar-based calibration coefficients to generate a set of hybrid calibration coefficients, leading to overall stable short- and long-term calibrated VIIRS RSB Sensor Data Records (SDR) [14,19]. This is especially important for VIIRS ocean color Environmental Data Records (EDR).
The ocean color EDR products [20,21,22,23,24] are highly sensitive to the accuracy of the RSB calibration and can also be used to check the RSB calibration accuracy itself [25]. Significant long-term drifts and unexpected features have indeed been discovered in the VIIRS normalized water-leaving radiances from the short wavelength bands and the VIIRS chlorophyll-a calculated using the NOAA Interface Data Processing Segment (IDPS) SDR [25,26], which are the current official SDR products produced using the SD F-factors derived by the VIIRS SDR team [4]. The application of the reprocessed SDR with our best and latest improved SD F-factors does significantly improve the quality of the ocean color EDR products due to removal of the seasonal oscillations and other errors in the SD calibration coefficients [26], but still fails to address the long-term drifts present in the products. The hybrid F-factors finally remove the long-term drifts observed in the ocean color EDR and meet the ocean color EDR’s stringent requirement for the RSB calibration [14]. Preliminary results of the performance of the ocean color EDR with the hybrid F-factors-implemented SDR have been reported in our previous works [14,26].
In this paper, we review the algorithms of the VIIRS SDR from Raw Data Records (RDR), the RSB on-orbit calibration algorithms and performance, the ocean color EDR improvements, and discuss the challenging issues related to the VIIRS RSB calibration. In Section 2, the SDR algorithms are reviewed and related issues are discussed. In Section 3, the algorithms for SD calibration, lunar calibration, and hybrid calibration coefficients are reviewed, calibration results are displayed, and challenge issues are discussed. In Section 4, ocean color EDR processed using the SDR generated with IDPS and hybrid F-factors, respectively, are demonstrated and compared. They are also compared with the in situ measurements. It is shown that the ocean color EDR processed using the SDR generated with the hybrid F-factors match very well. This work completes the standard core of the methodology and analyses, and enables VIIRS to further many science products to reach higher data quality, especially for ocean color products. Section 5 summaries and concludes the work.

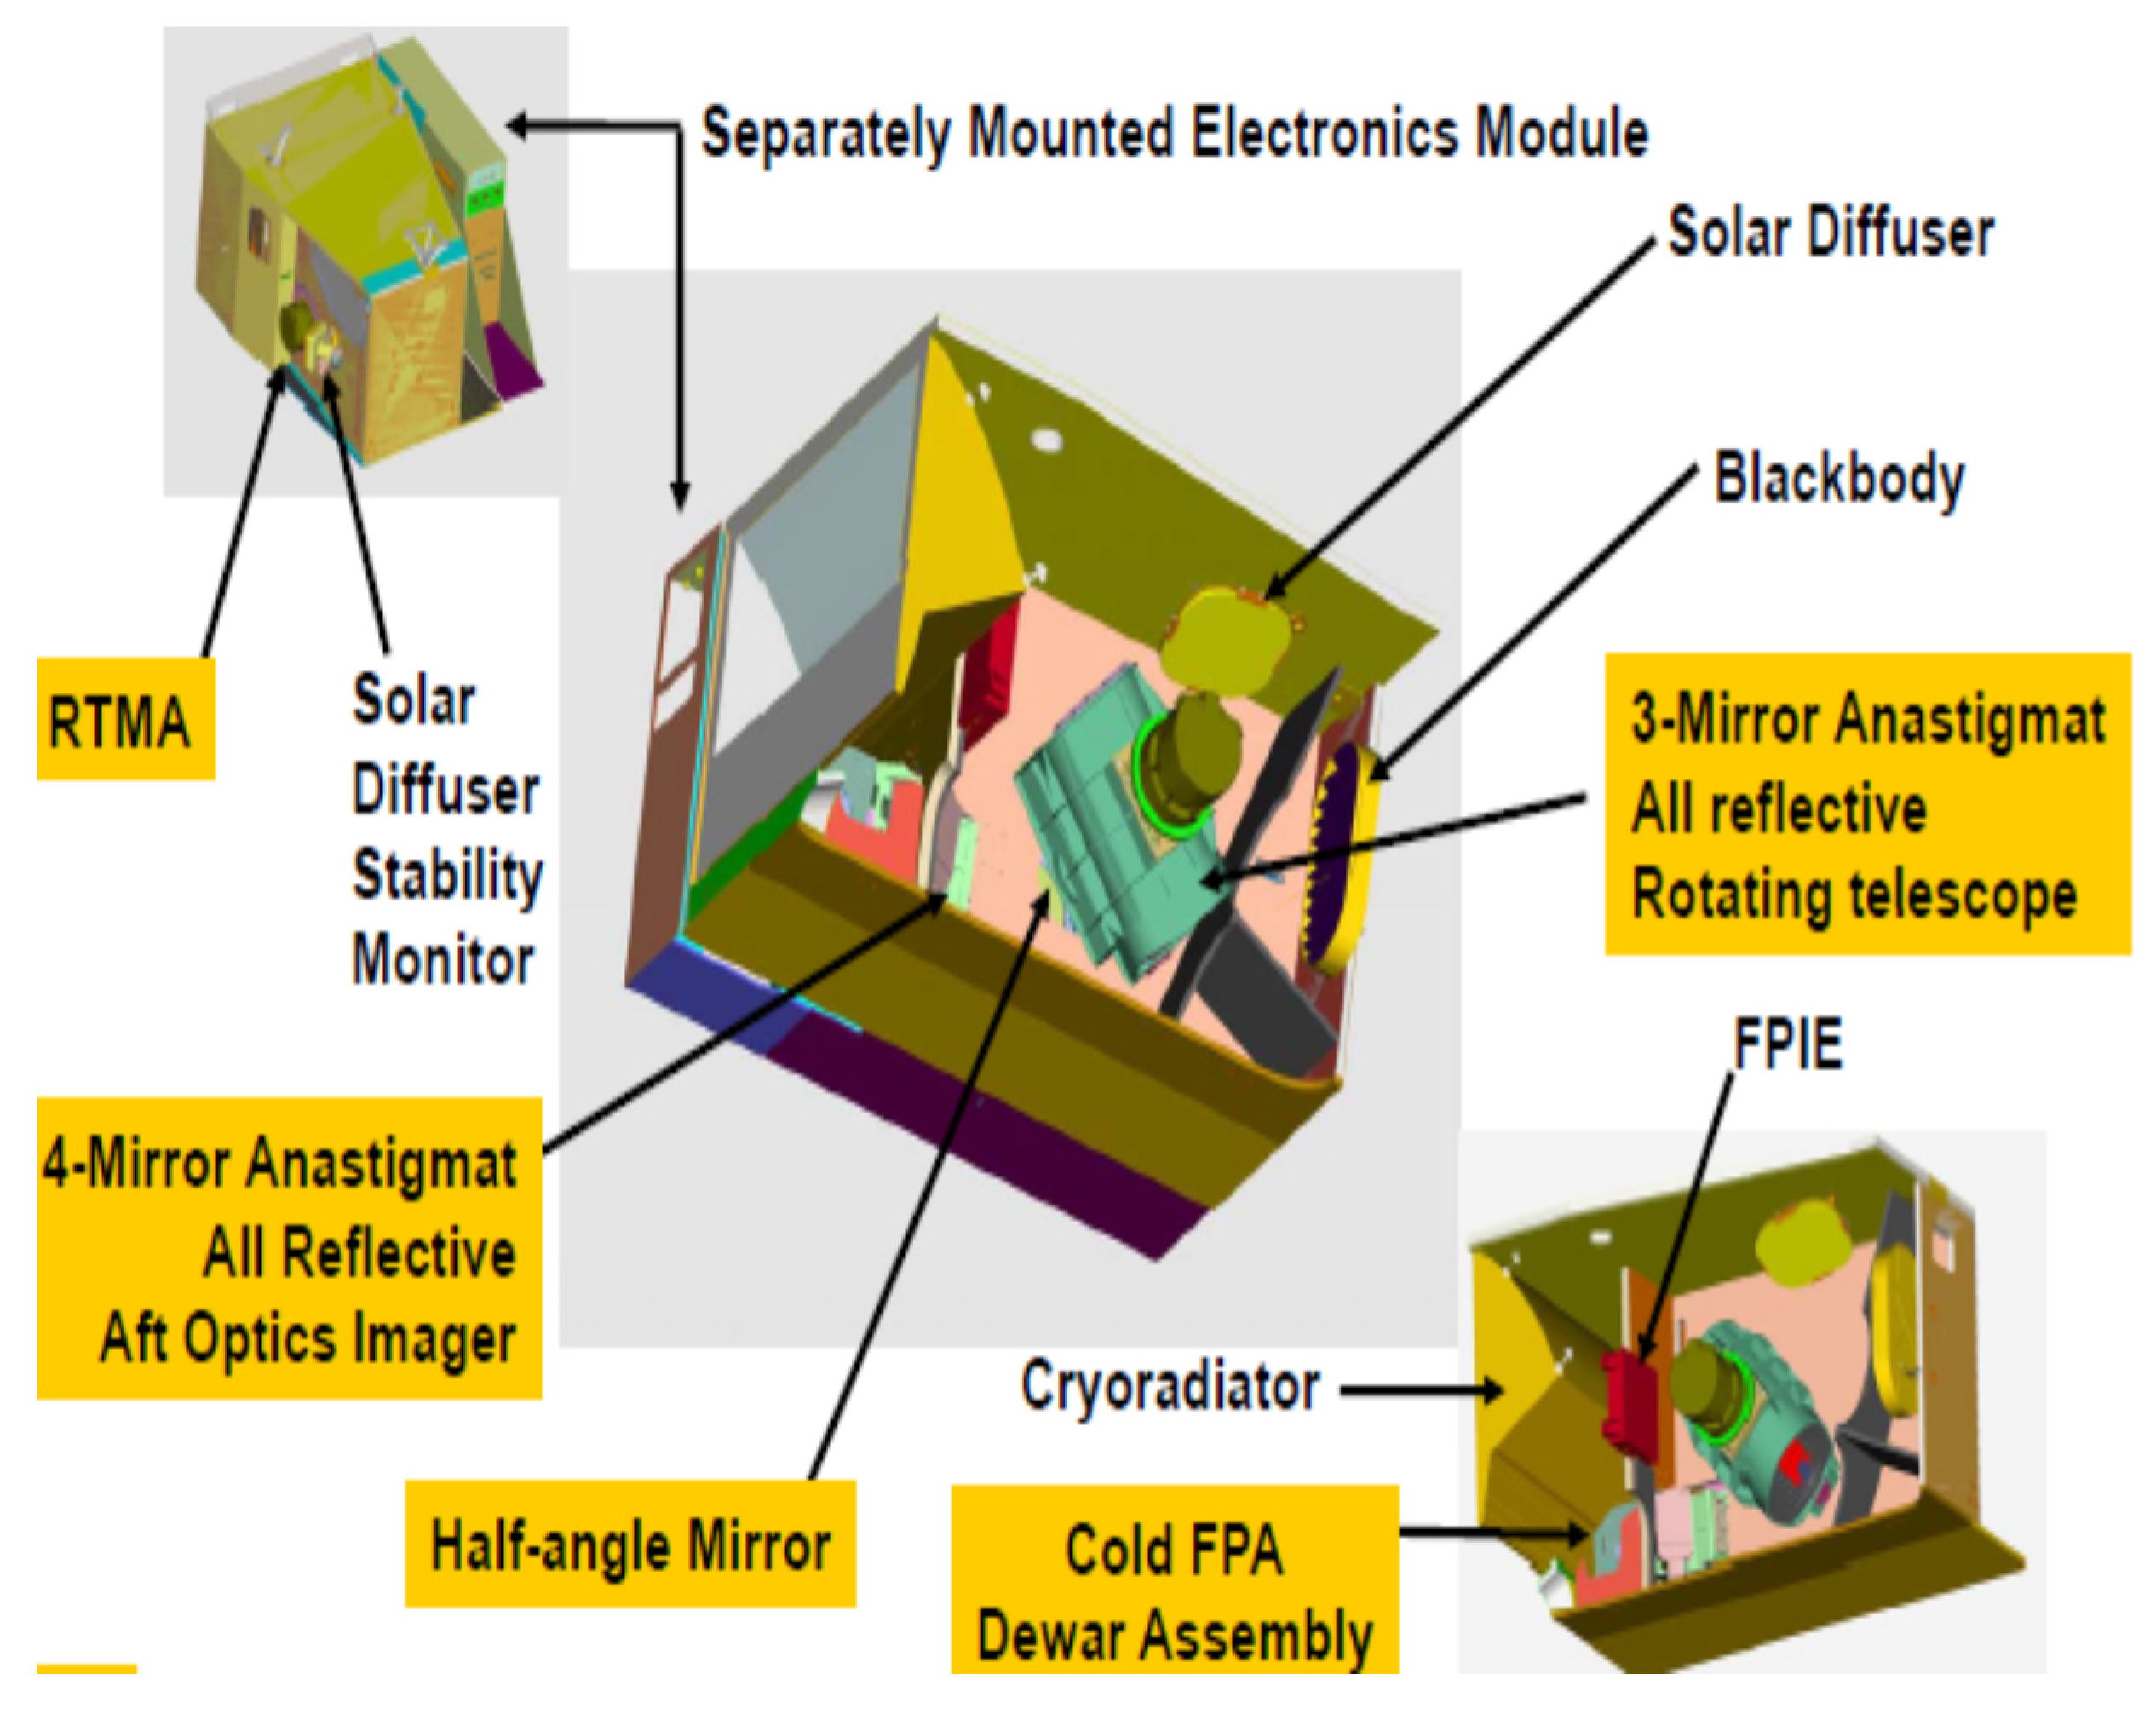
2. VIIRS Sensor Data Records

The 14 VIIRS RSB cover a spectral range from 410–2250 nm. Table 1 lists the center wavelengths of the RSB and their specification. The background response for a detector of an RSB is provided by the detector reading of the SV, as mentioned previously. In the VIIRS RSB radiance retrieval methodology, a quadratic approximation is applied to establish the relationship between the radiance of the incident sunlight at the center wavelength of a RSB detector and the background-subtracted digital number dn of the detector [13]. This is different from the methodology for the Moderate-resolution Imaging Spectroradiometer (MODIS), where a simple linear approximation is used to establish the relationship [27,28].
The top-of-atmosphere (TOA) radiance, called SDR in the VIIRS community, is the baseline for all science products. A remote sensor can only provide its responses to a target at selected wavelengths. To convert the instrument responses to the corresponding TOA radiance, a relationship between them has to be established first. For SNPP VIIRS RSB, a quadratic form is applied to relate the at-aperture radiance and instrument background-subtracted response, as mentioned above [13,14], that is:
L B ( P , S , D , t ) = F ( B , D , M , G , t ) j = 0 2 c j ( B , D , M , G ) d n B j ( P , S , D ) R V S ( ϑ , B )
where B, D, P, S, M, and t, denote band, detector, pixel, scan, and HAM side, and time, respectively. LB(P,S,D,t) is the radiance at wavelength of band B, RVS(ϑ,B) is the response-versus-scan angle (RVS) at the angle of incidence (AOI), ϑ, of the HAM. c0(B,D,M,G), c1(B,D,M,G), and c2(B,D,M,G) are the temperature-effect-corrected prelaunch measured offset, linear, and nonlinear coefficients of the quadratic form [29]. dnB(P,S,D) is the background-subtracted instrument response, and F(B,D,M,G,t) is the scale factor, called F-factor, as mentioned previously, for the coefficients of the quadratic form at time t relative to those of the quadratic form of the prelaunch [13]. In Equation (1), it is assumed that the three coefficients of the quadratic form change at the same rate for all time. This assumption enables a robust ratio approach to be developed for the SDR reprocessing in cases when only the F-factors are updated [30]. From Equation (1), it is clearly seen that the offset should be zero since for the dark scene on both sides it should be zero. The prelaunch-measured calibration coefficients were originally fitted with prelaunch measurements without forcing the offset to be zero, but they were refitted later with the offset set to zero after the instrument had been on orbit for more than a year. Even though the non-zero nonlinear term is considered in VIIRS RSB SDR algorithm, the impact of the non-linear effect is small. In fact, it is smaller than 1% for all RSB as long as the radiance does not exceed the specified maximum radiance, Lmax.
F(B,D,M,G,t) is the time-dependent F-factor and needs to be updated constantly. The RVS was measured prelaunch but may change on-orbit due to the degradation of the scan mirror as demonstrated by both Aqua and Terra MODIS scan mirrors [31]. Since the HAM is inside the instrument, it degrades much more slowly than the scan mirrors of the two MODIS instruments, where the scan mirror directly faces the Earth’s surface. The slower degradation of the VIIRS HAM can be seen from the much slower degradation of the VIIRS short wavelength VIS bands [5]. Nevertheless, it degrades with time and its degradation is wavelength-dependent. Its degradation should also be AOI-dependent, as demonstrated also by the time-dependent RVS of MODIS [31]. The degradation of the HAM at the AOI of the SV is tracked by the F-factors and it is one of the contributions to the variations of the F-factors with time [5]. However, the HAM degradation attributing to AOI difference, or time-dependent RVS, is not considered in this paper and it is beyond the need of this work due to its small effect.
The current official forward SDR products are produced by the NOAA IDPS using the F-factors derived from the SD/SDSM calibration [4]. The VIIRS Ocean Color Team at the NOAA Center for Satellite Applications and Research (STAR) has reprocessed the SDR with the hybrid F-factors using the Application Development Library (ADL) for the early mission. For the later mission, the ratio approach [30] was used, since new prelaunch calibration coefficients, c0(B,D,M,G), c1(B,D,M,G), and c2(B,D,M,G) have already been applied in IDPS SDR. The reprocess of SDR using the ADL is a time-consuming process. The ratio approach dramatically improves the efficiency by two orders of magnitude [30]. The VIIRS Ocean Color Team has started, since September 2014, to produce near real-time SDR on a daily basis using our hybrid F-factors for scientific quality of the ocean color EDR products.

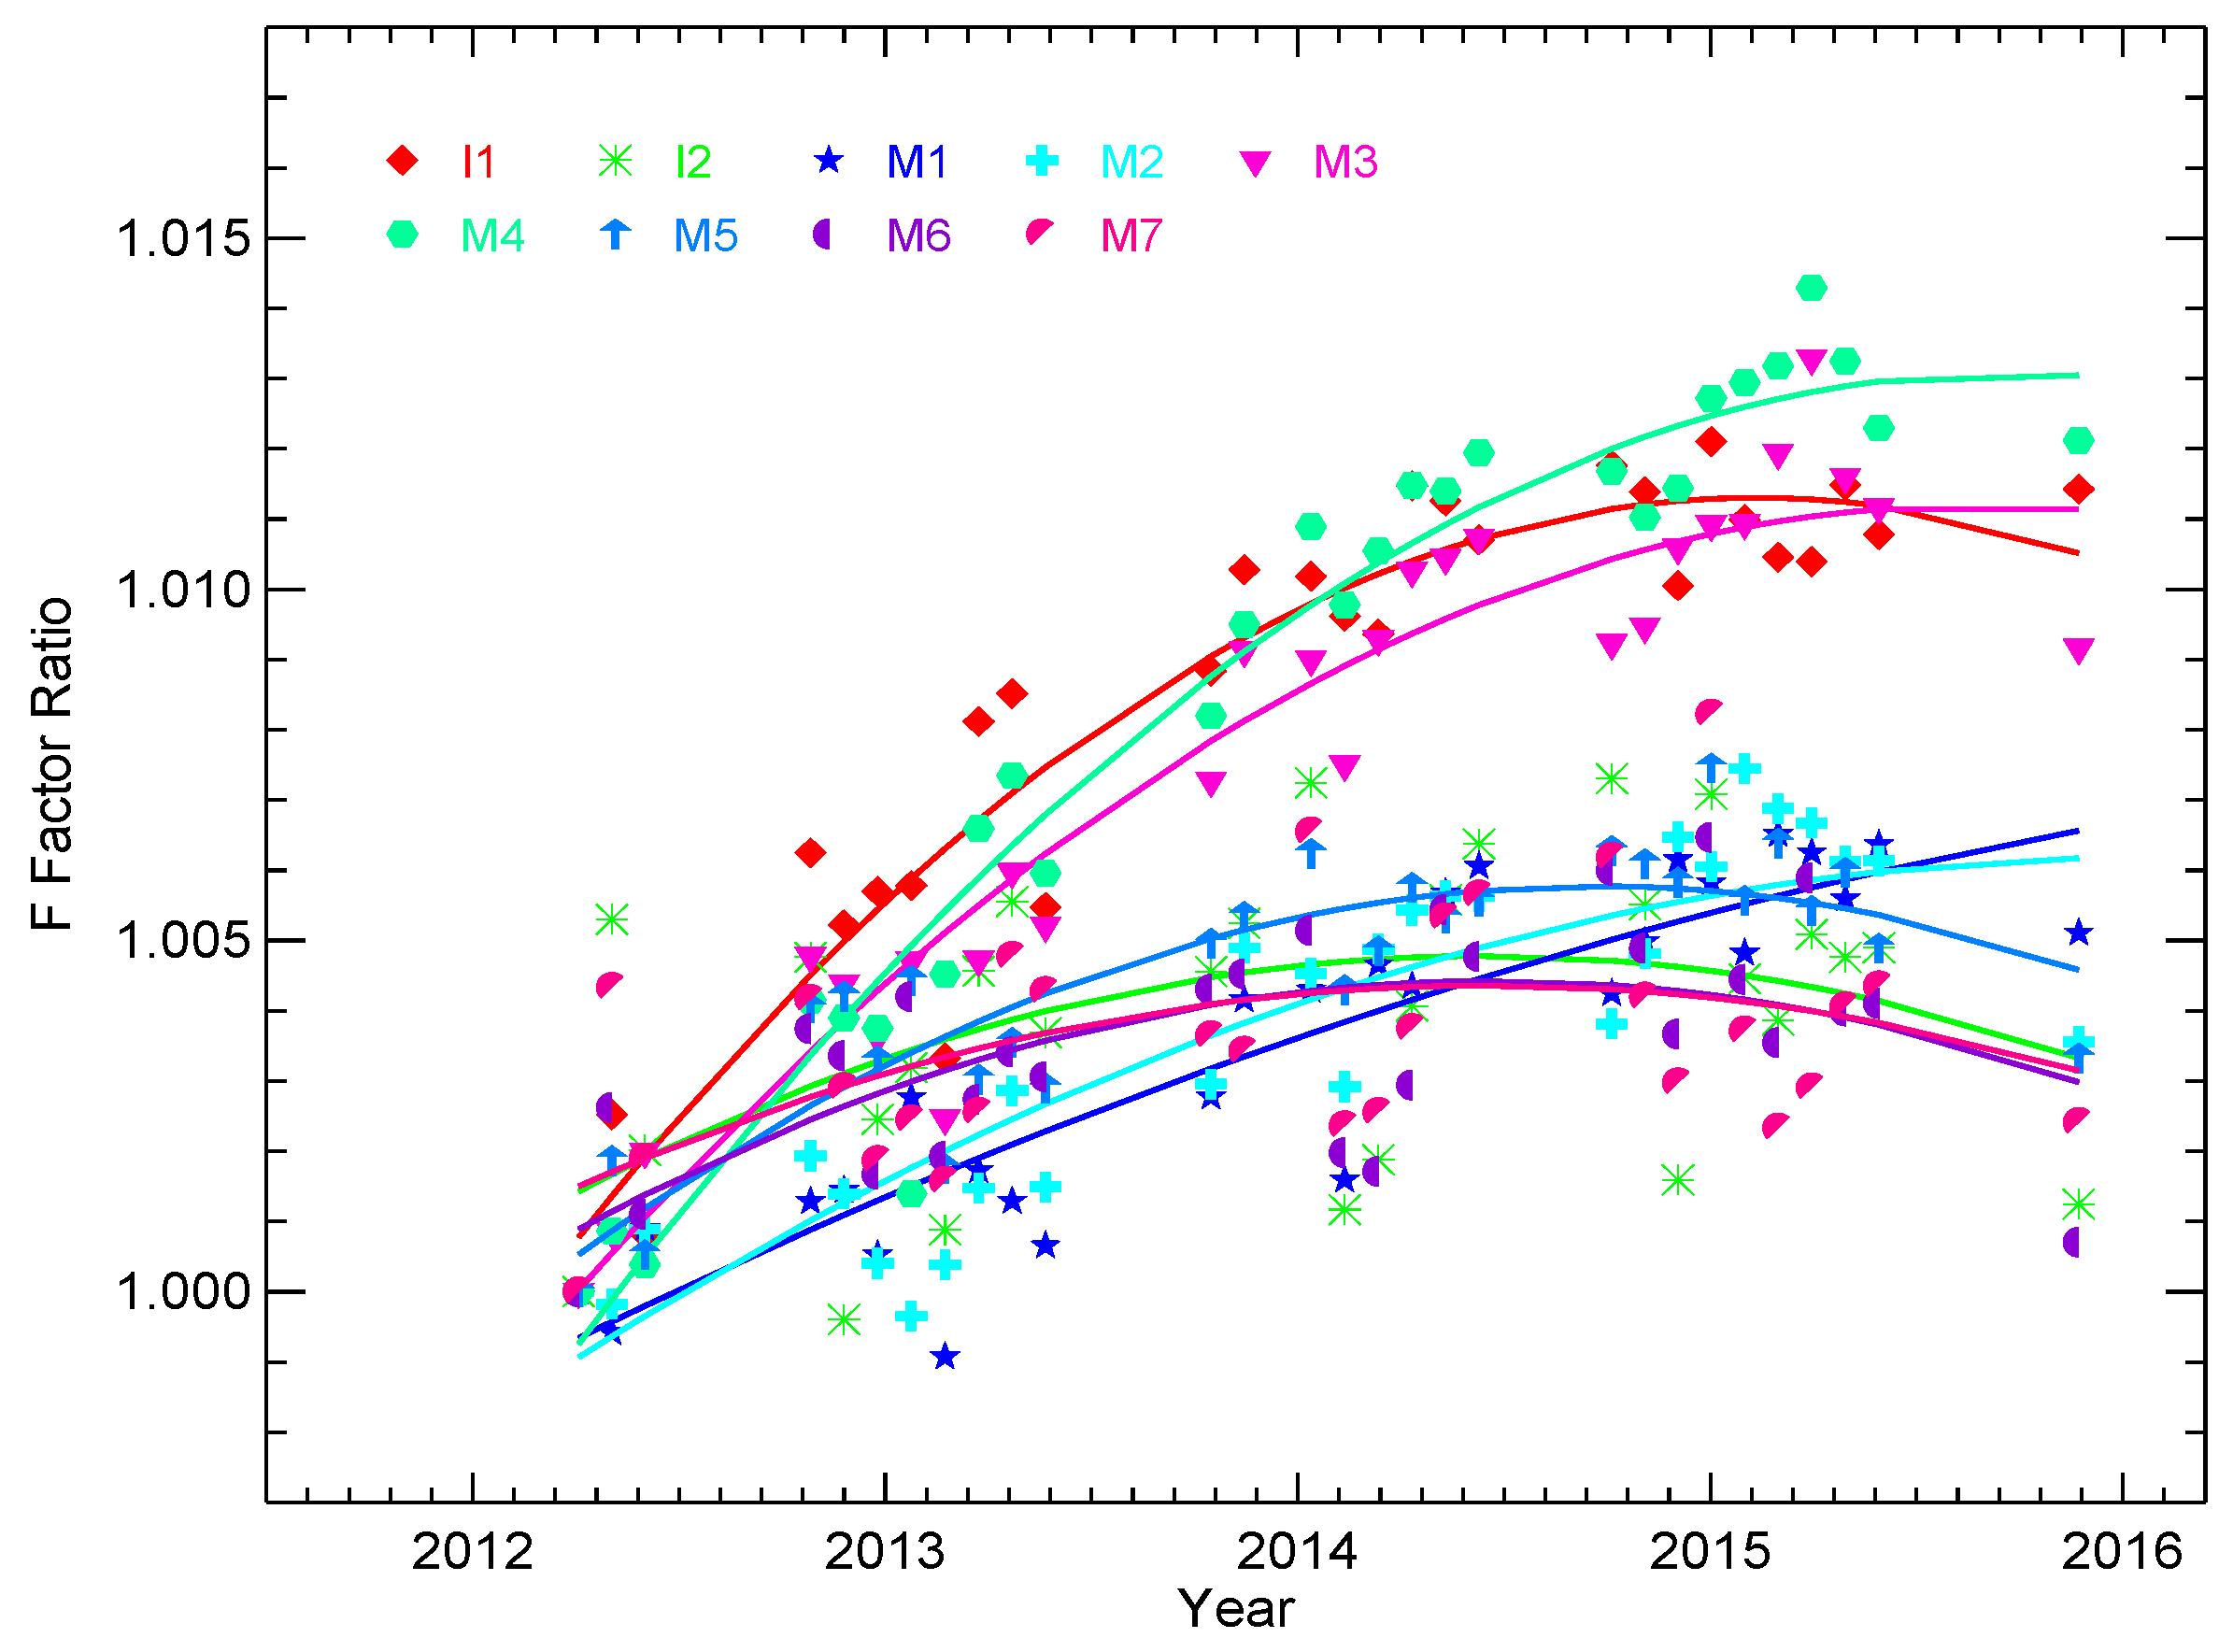
3. RSB Calibration Methodology and Performance

In this section, we review the SD and lunar calibration algorithms and the RSB on-orbit performance. To distinguish the F-factor derived from the SD/SDSM calibration and the F-factors obtained from the lunar calibration, they will be called as SD F-factors and lunar F-factors in this and later sections, respectively. We will discuss the advantages and disadvantages of the approaches. We will also review the hybrid approach methodology and show the hybrid calibration coefficients.

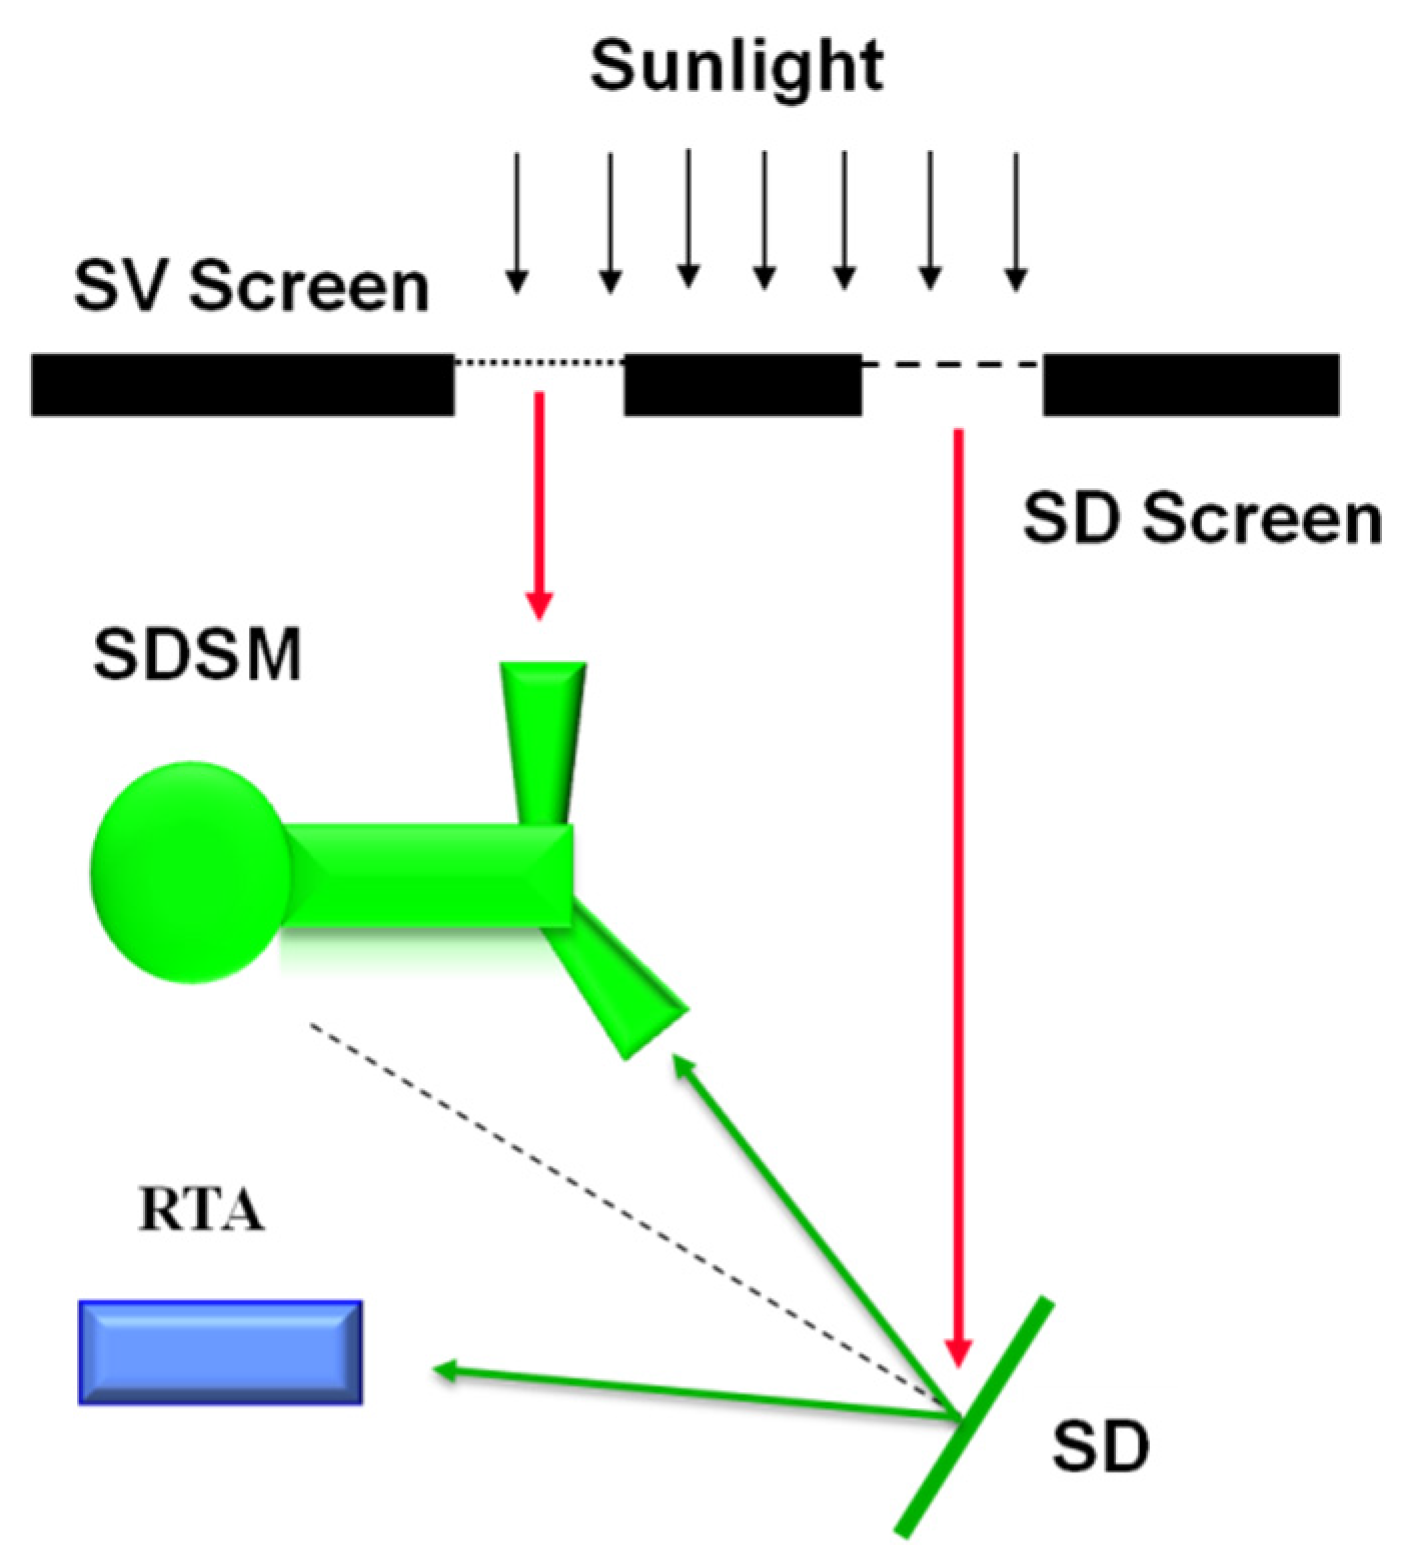
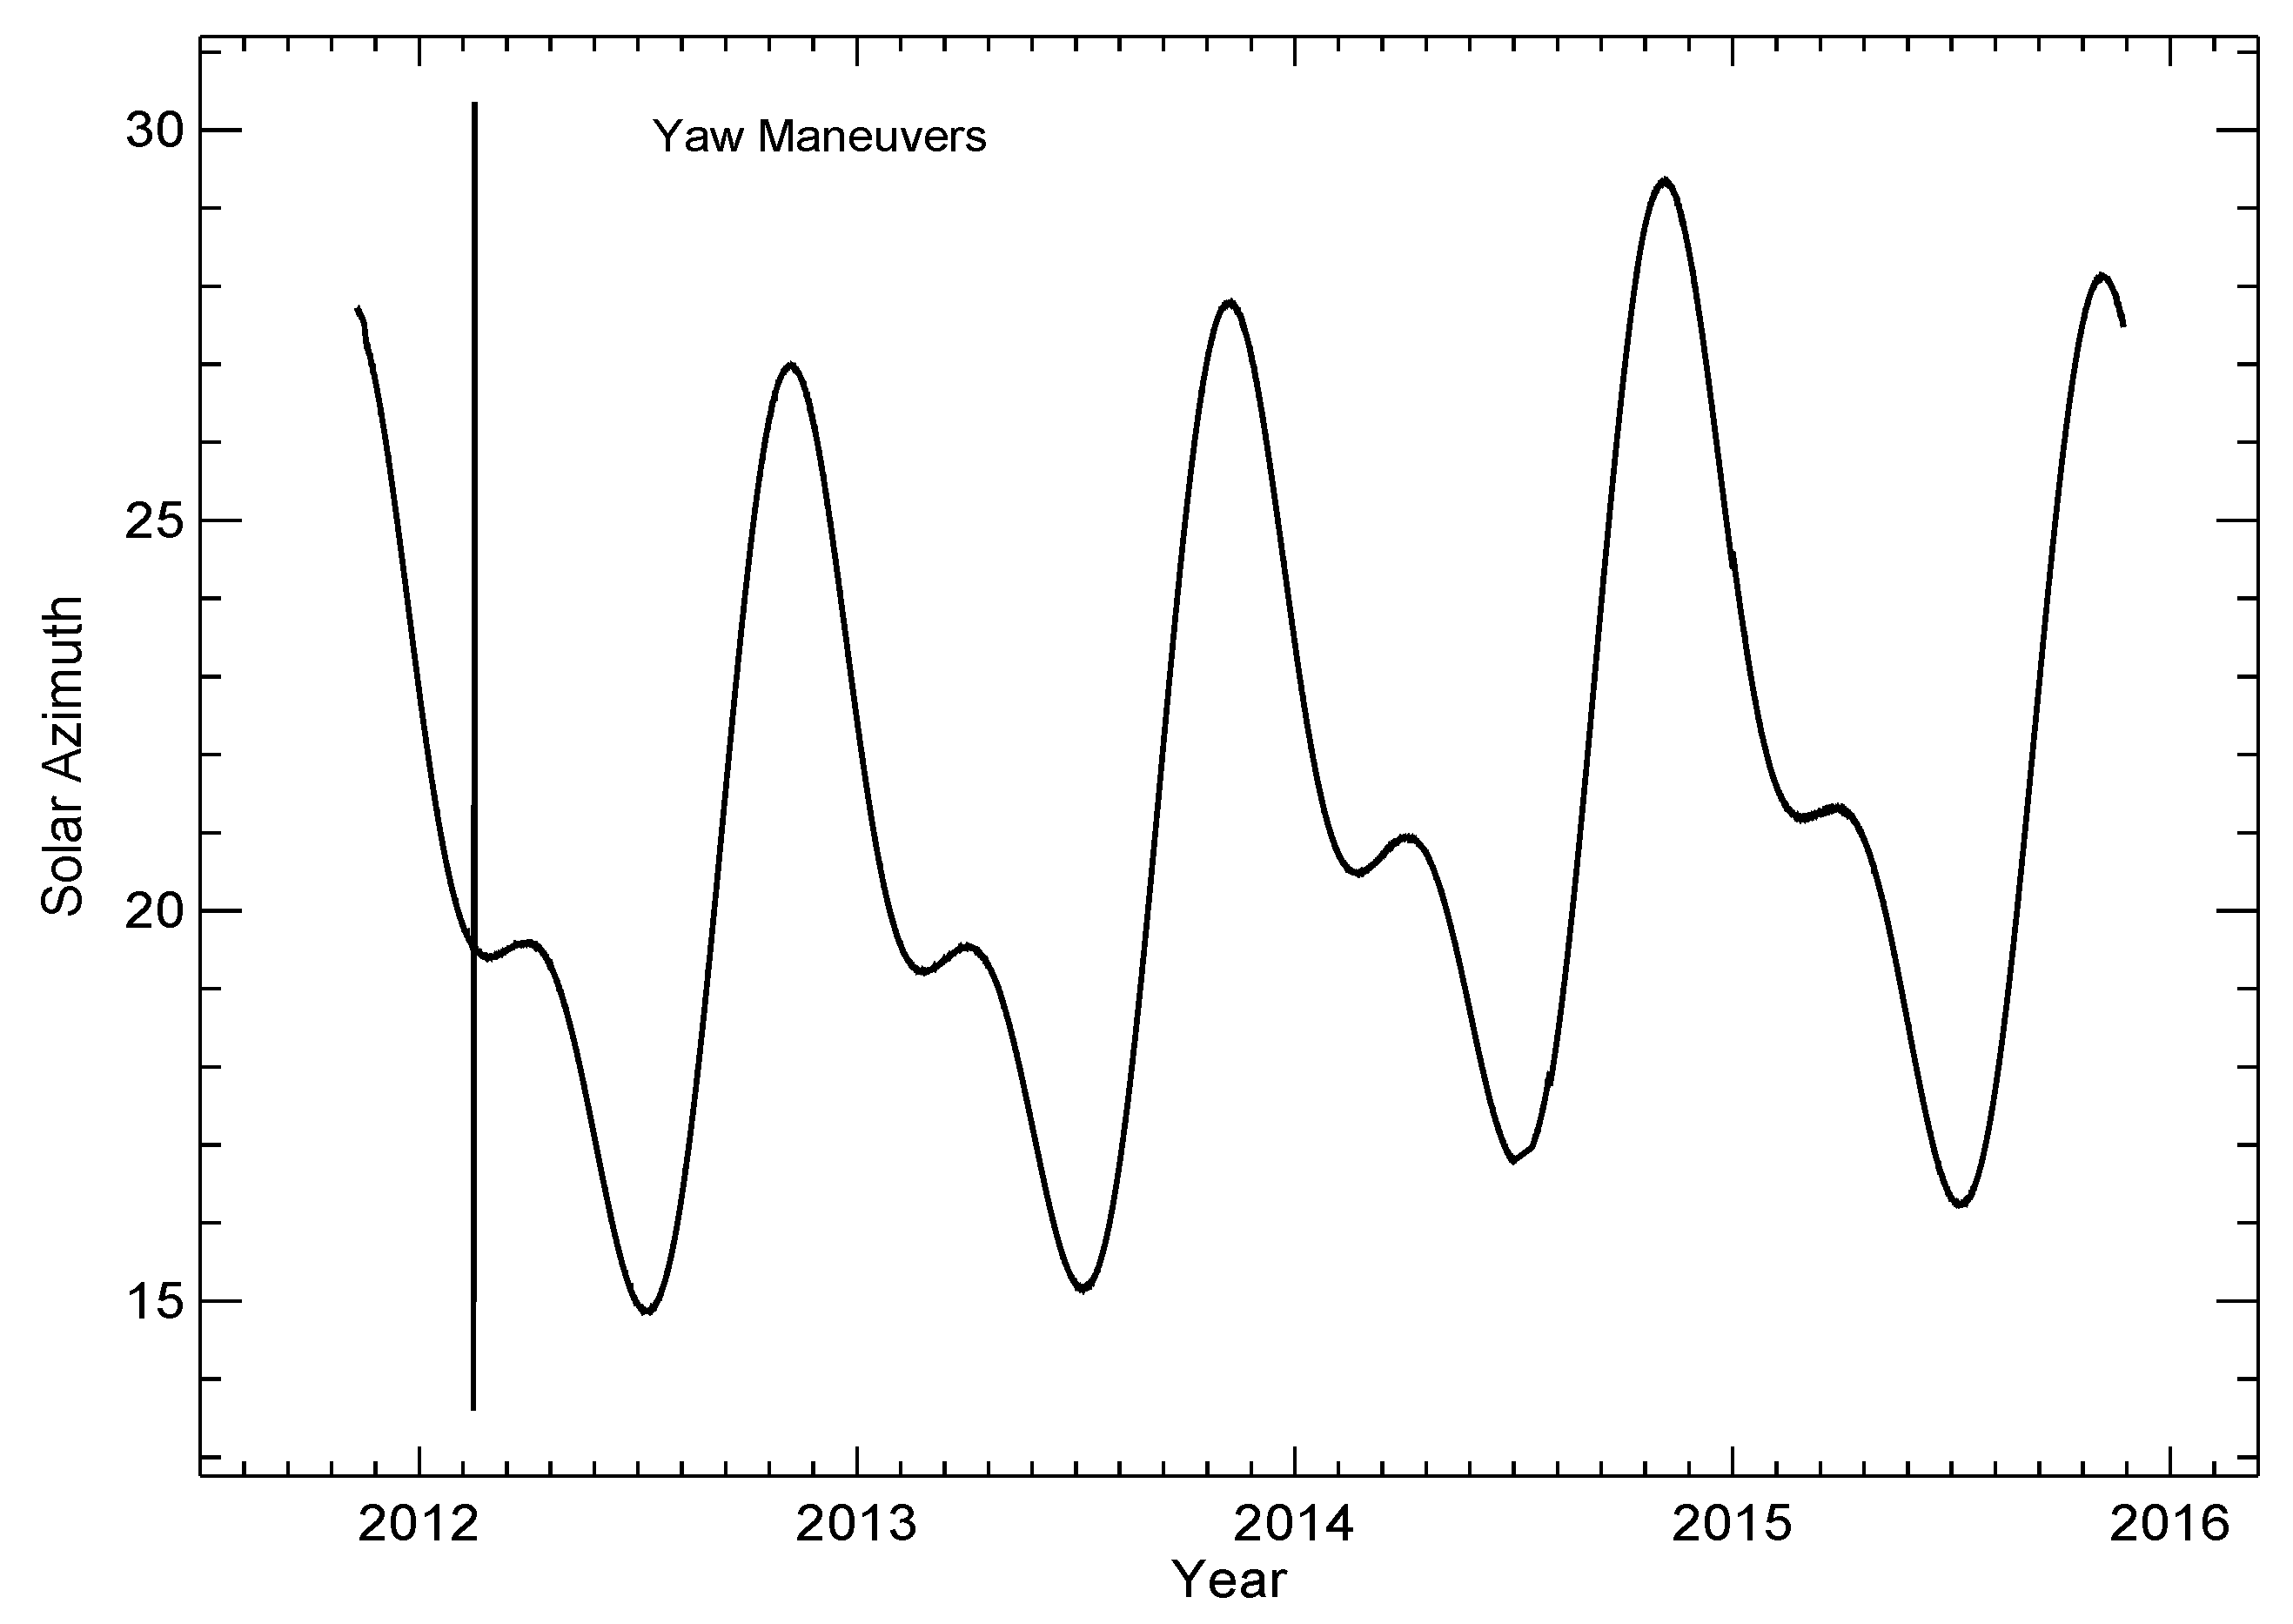
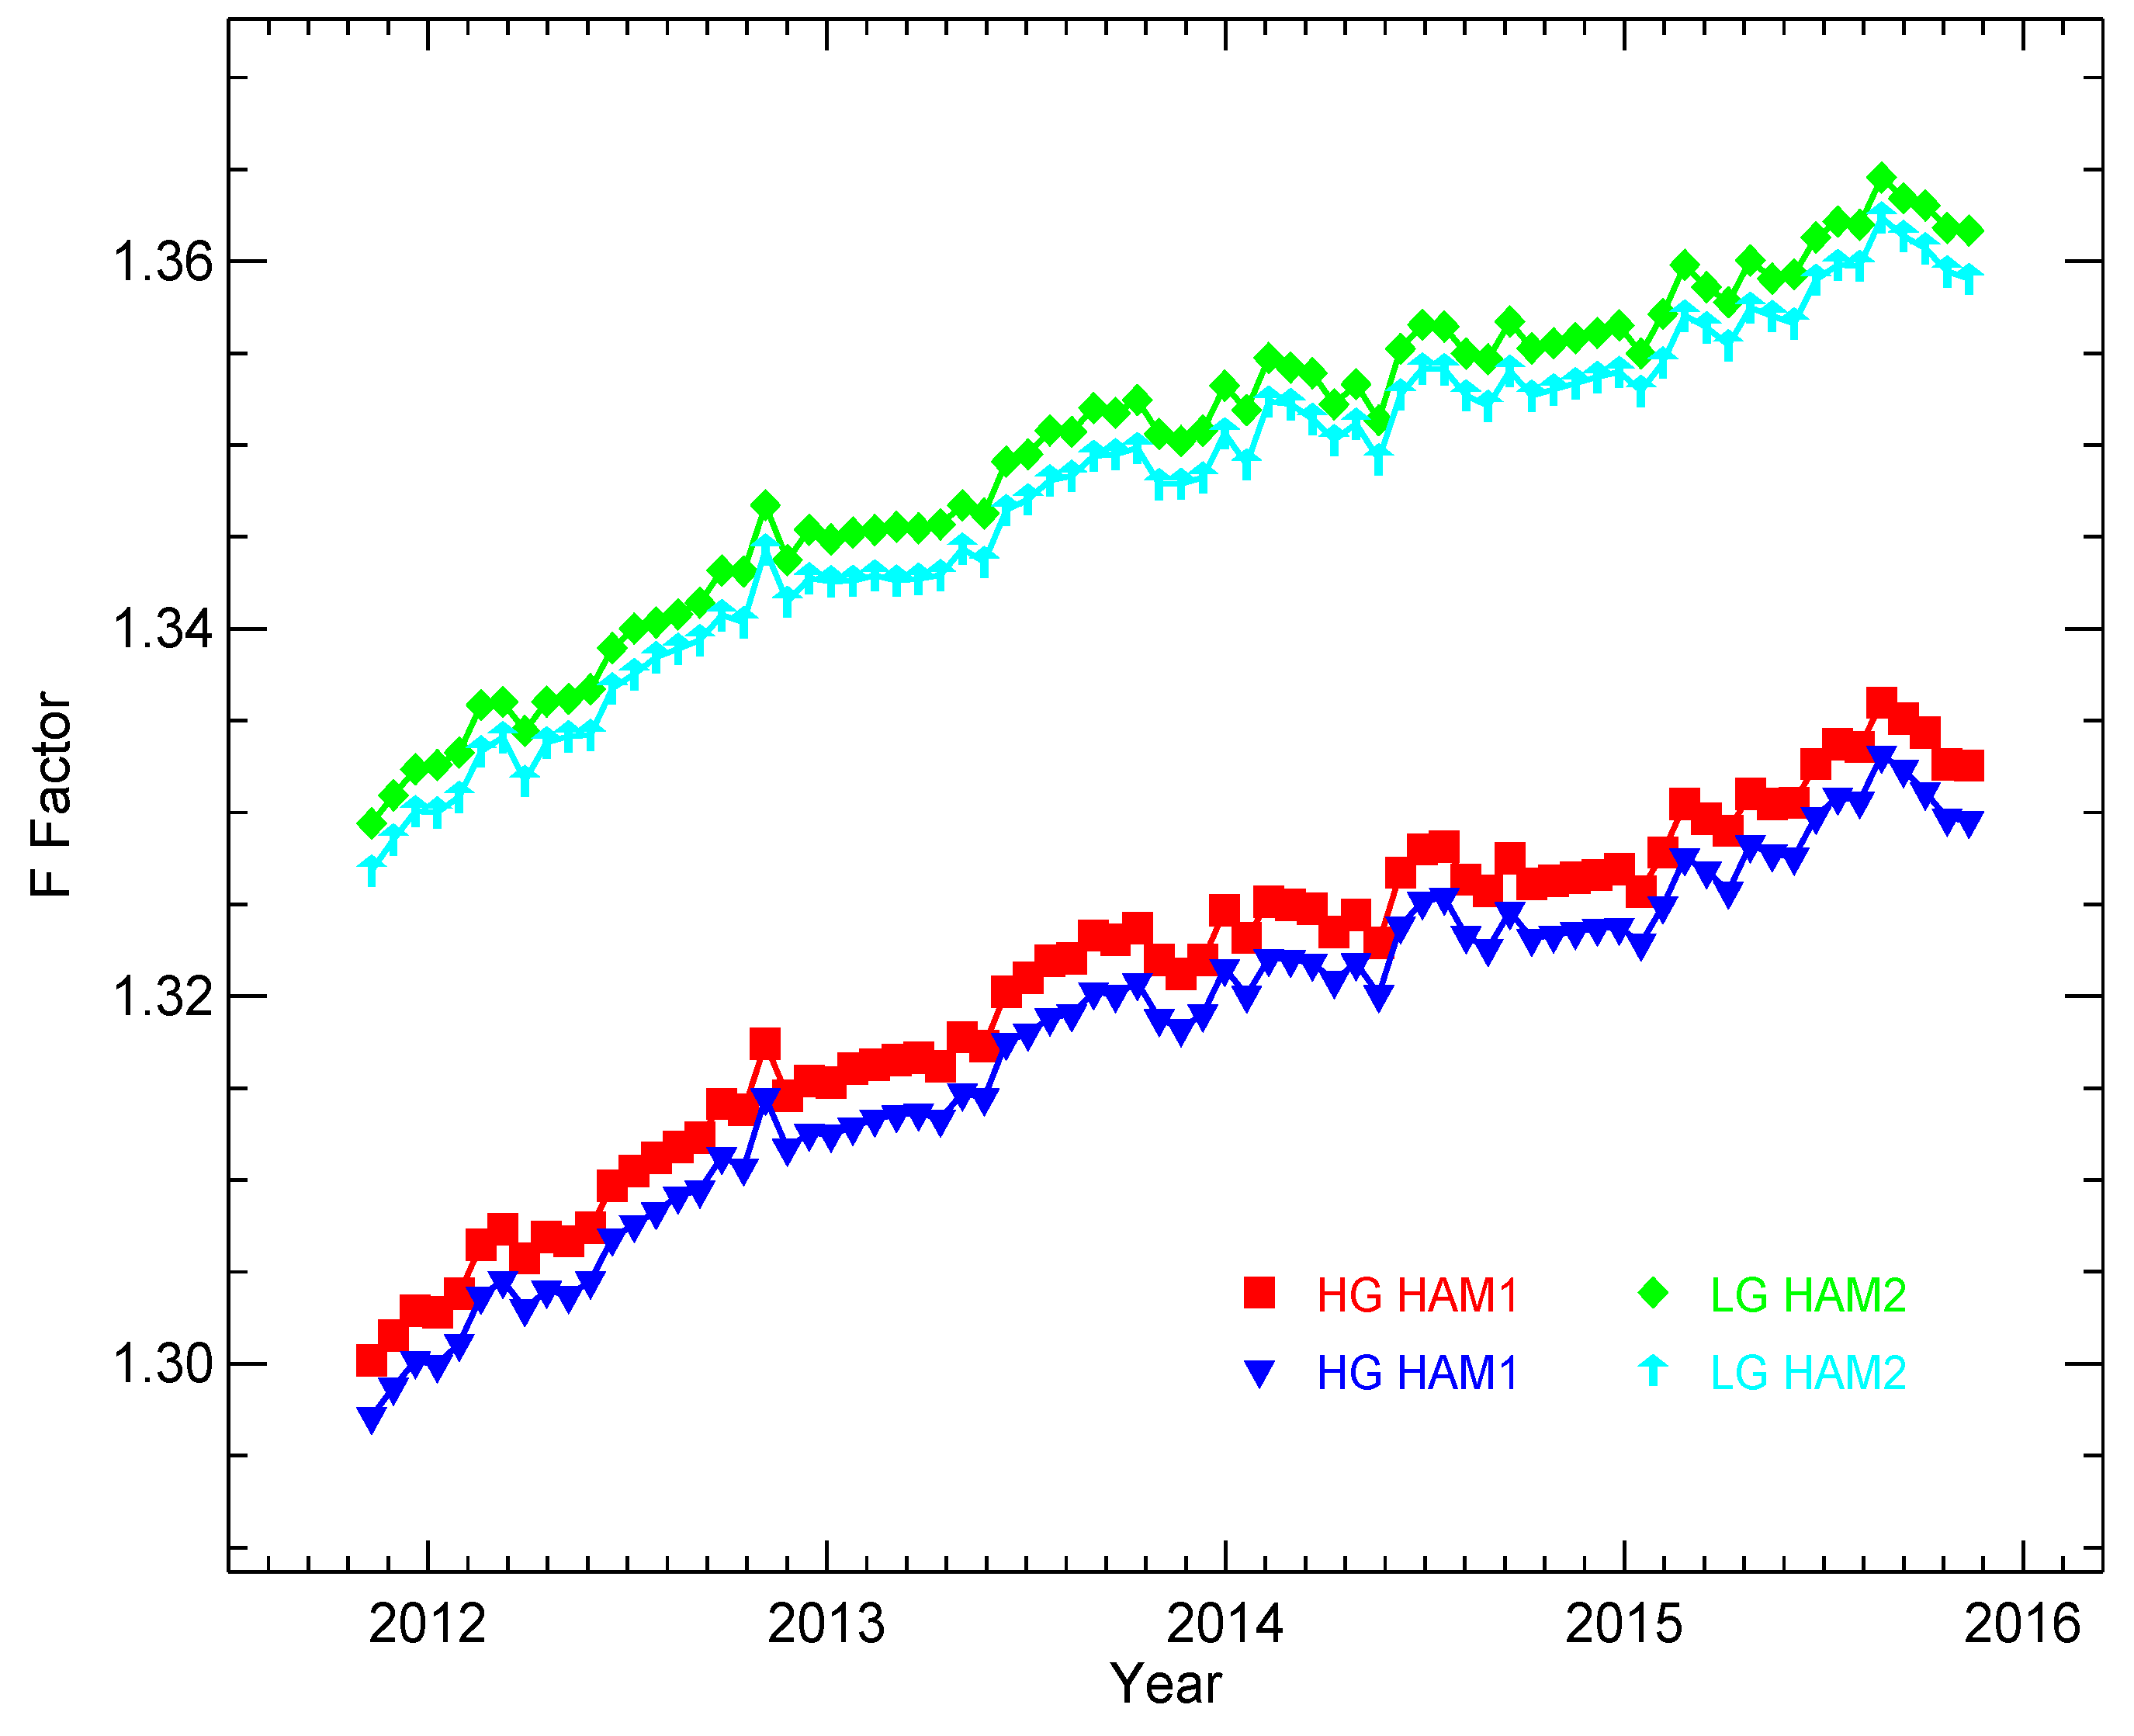
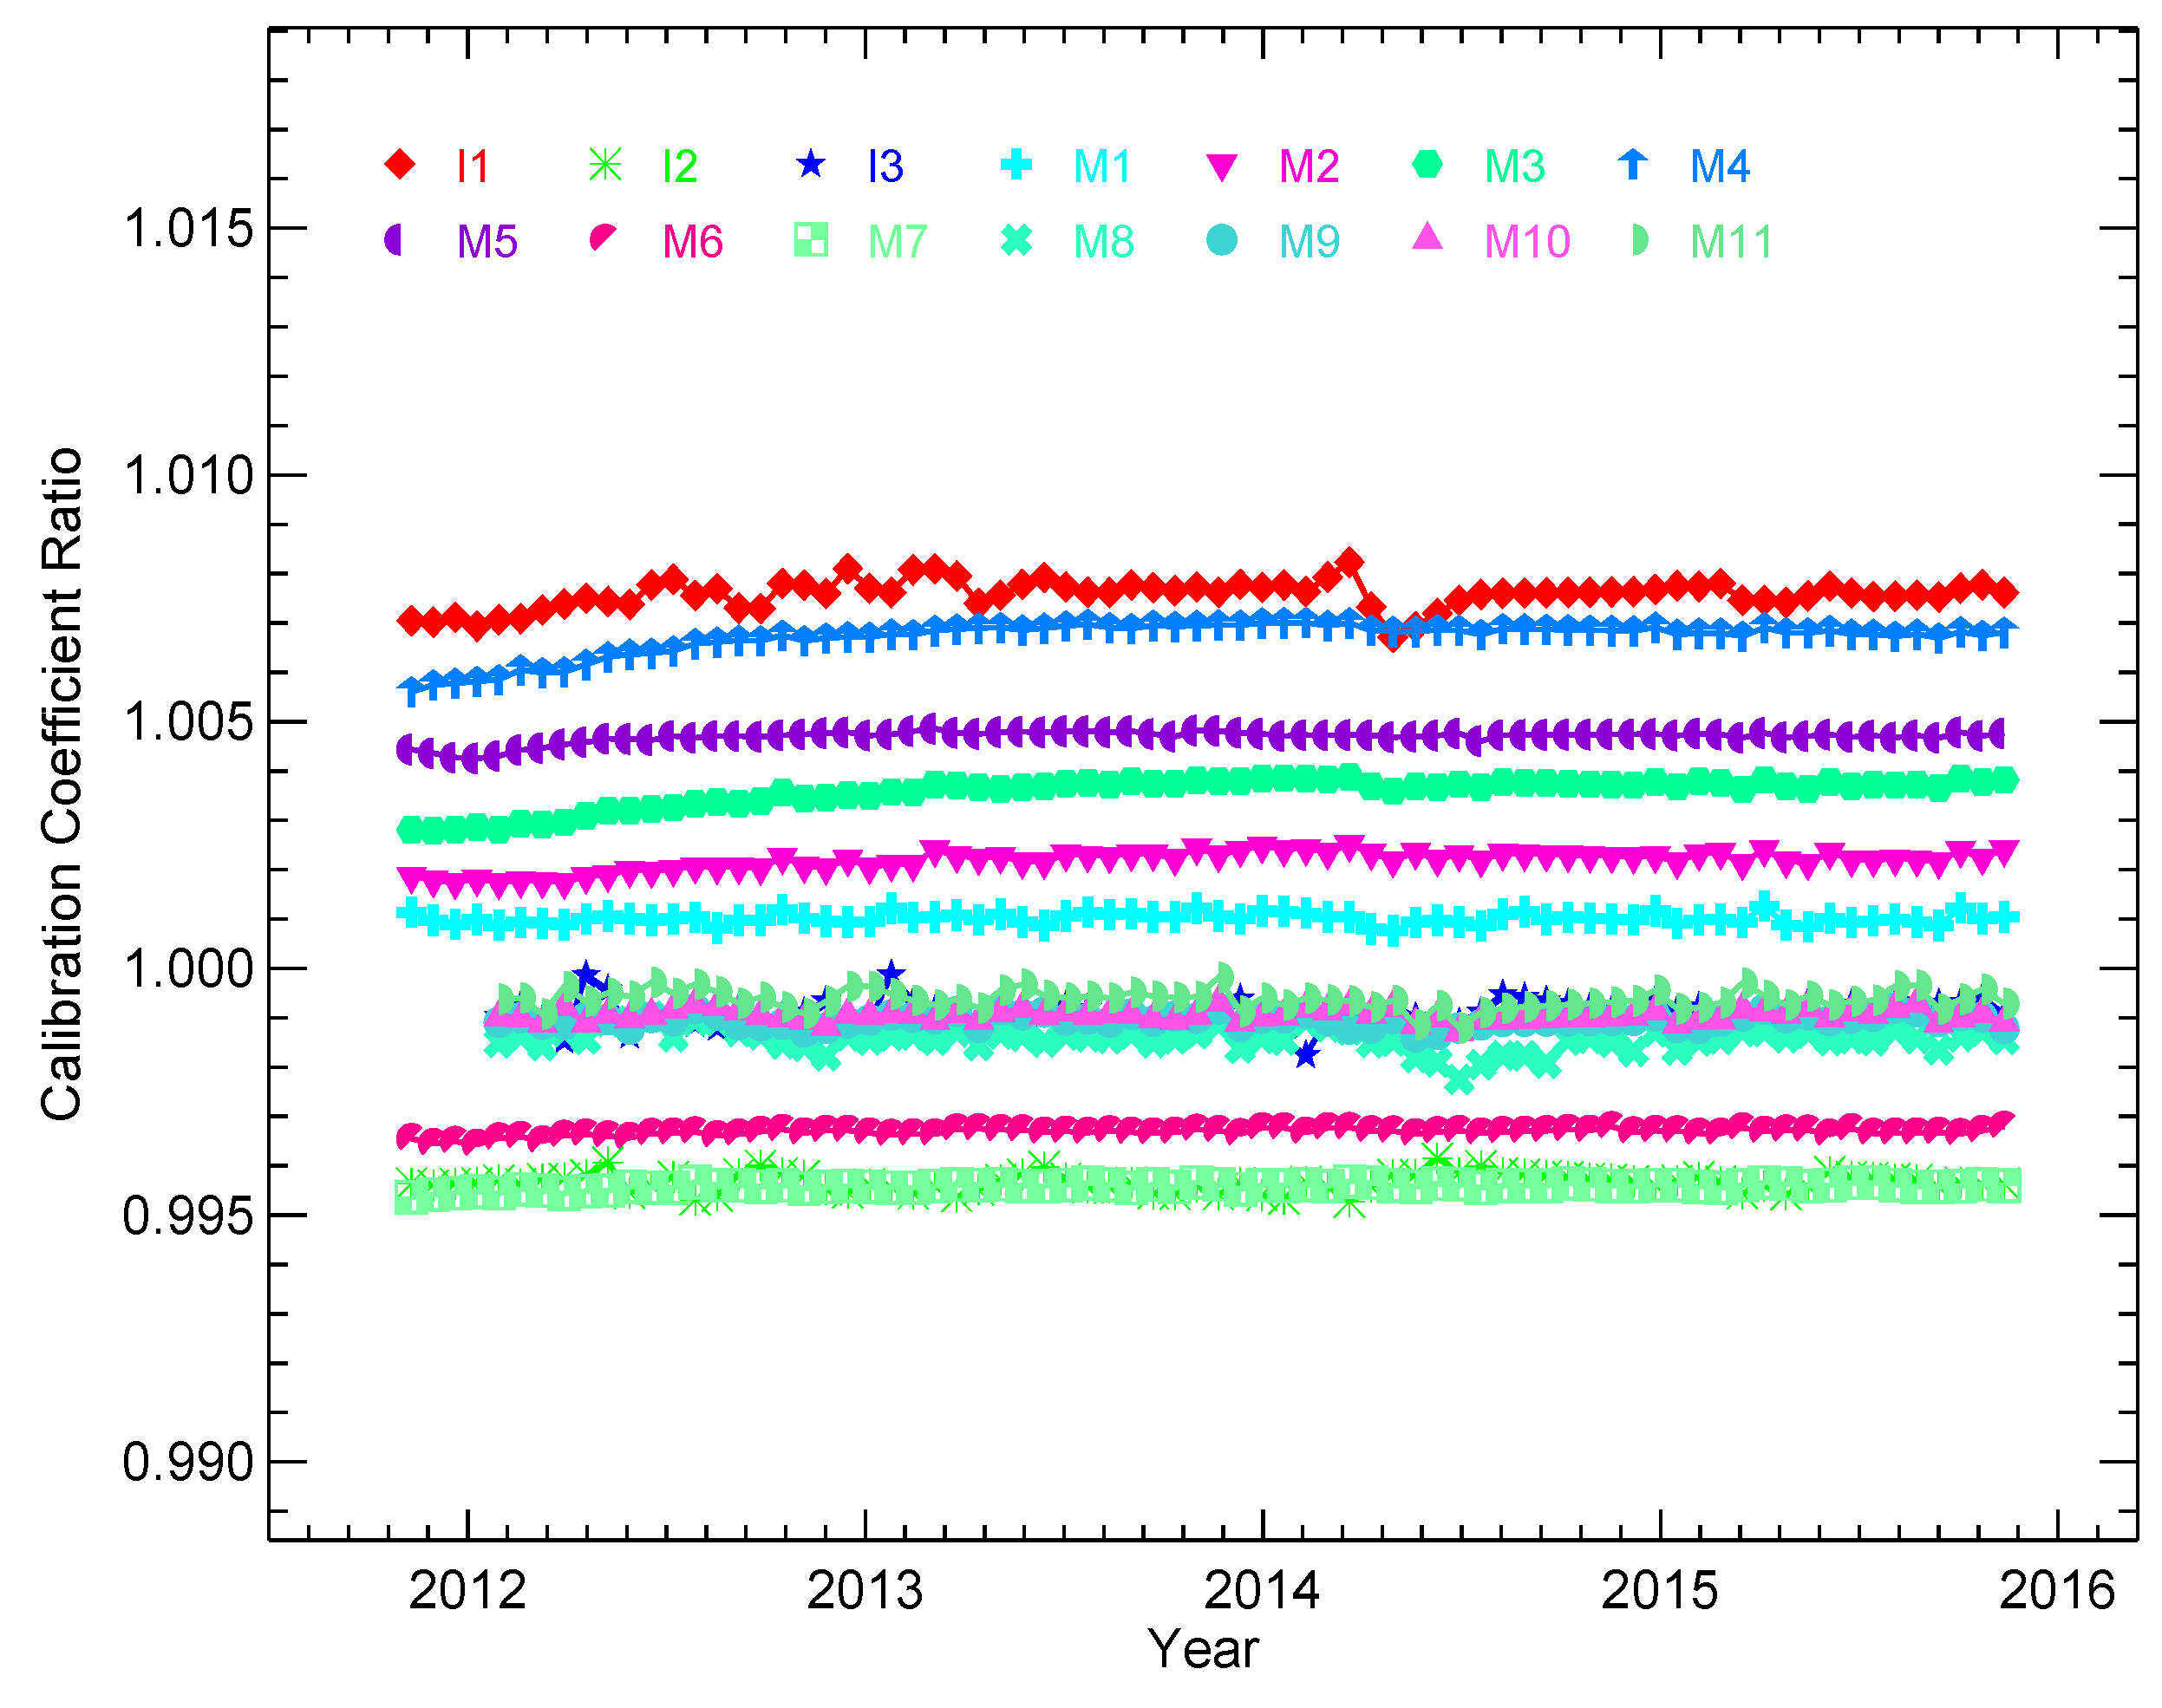
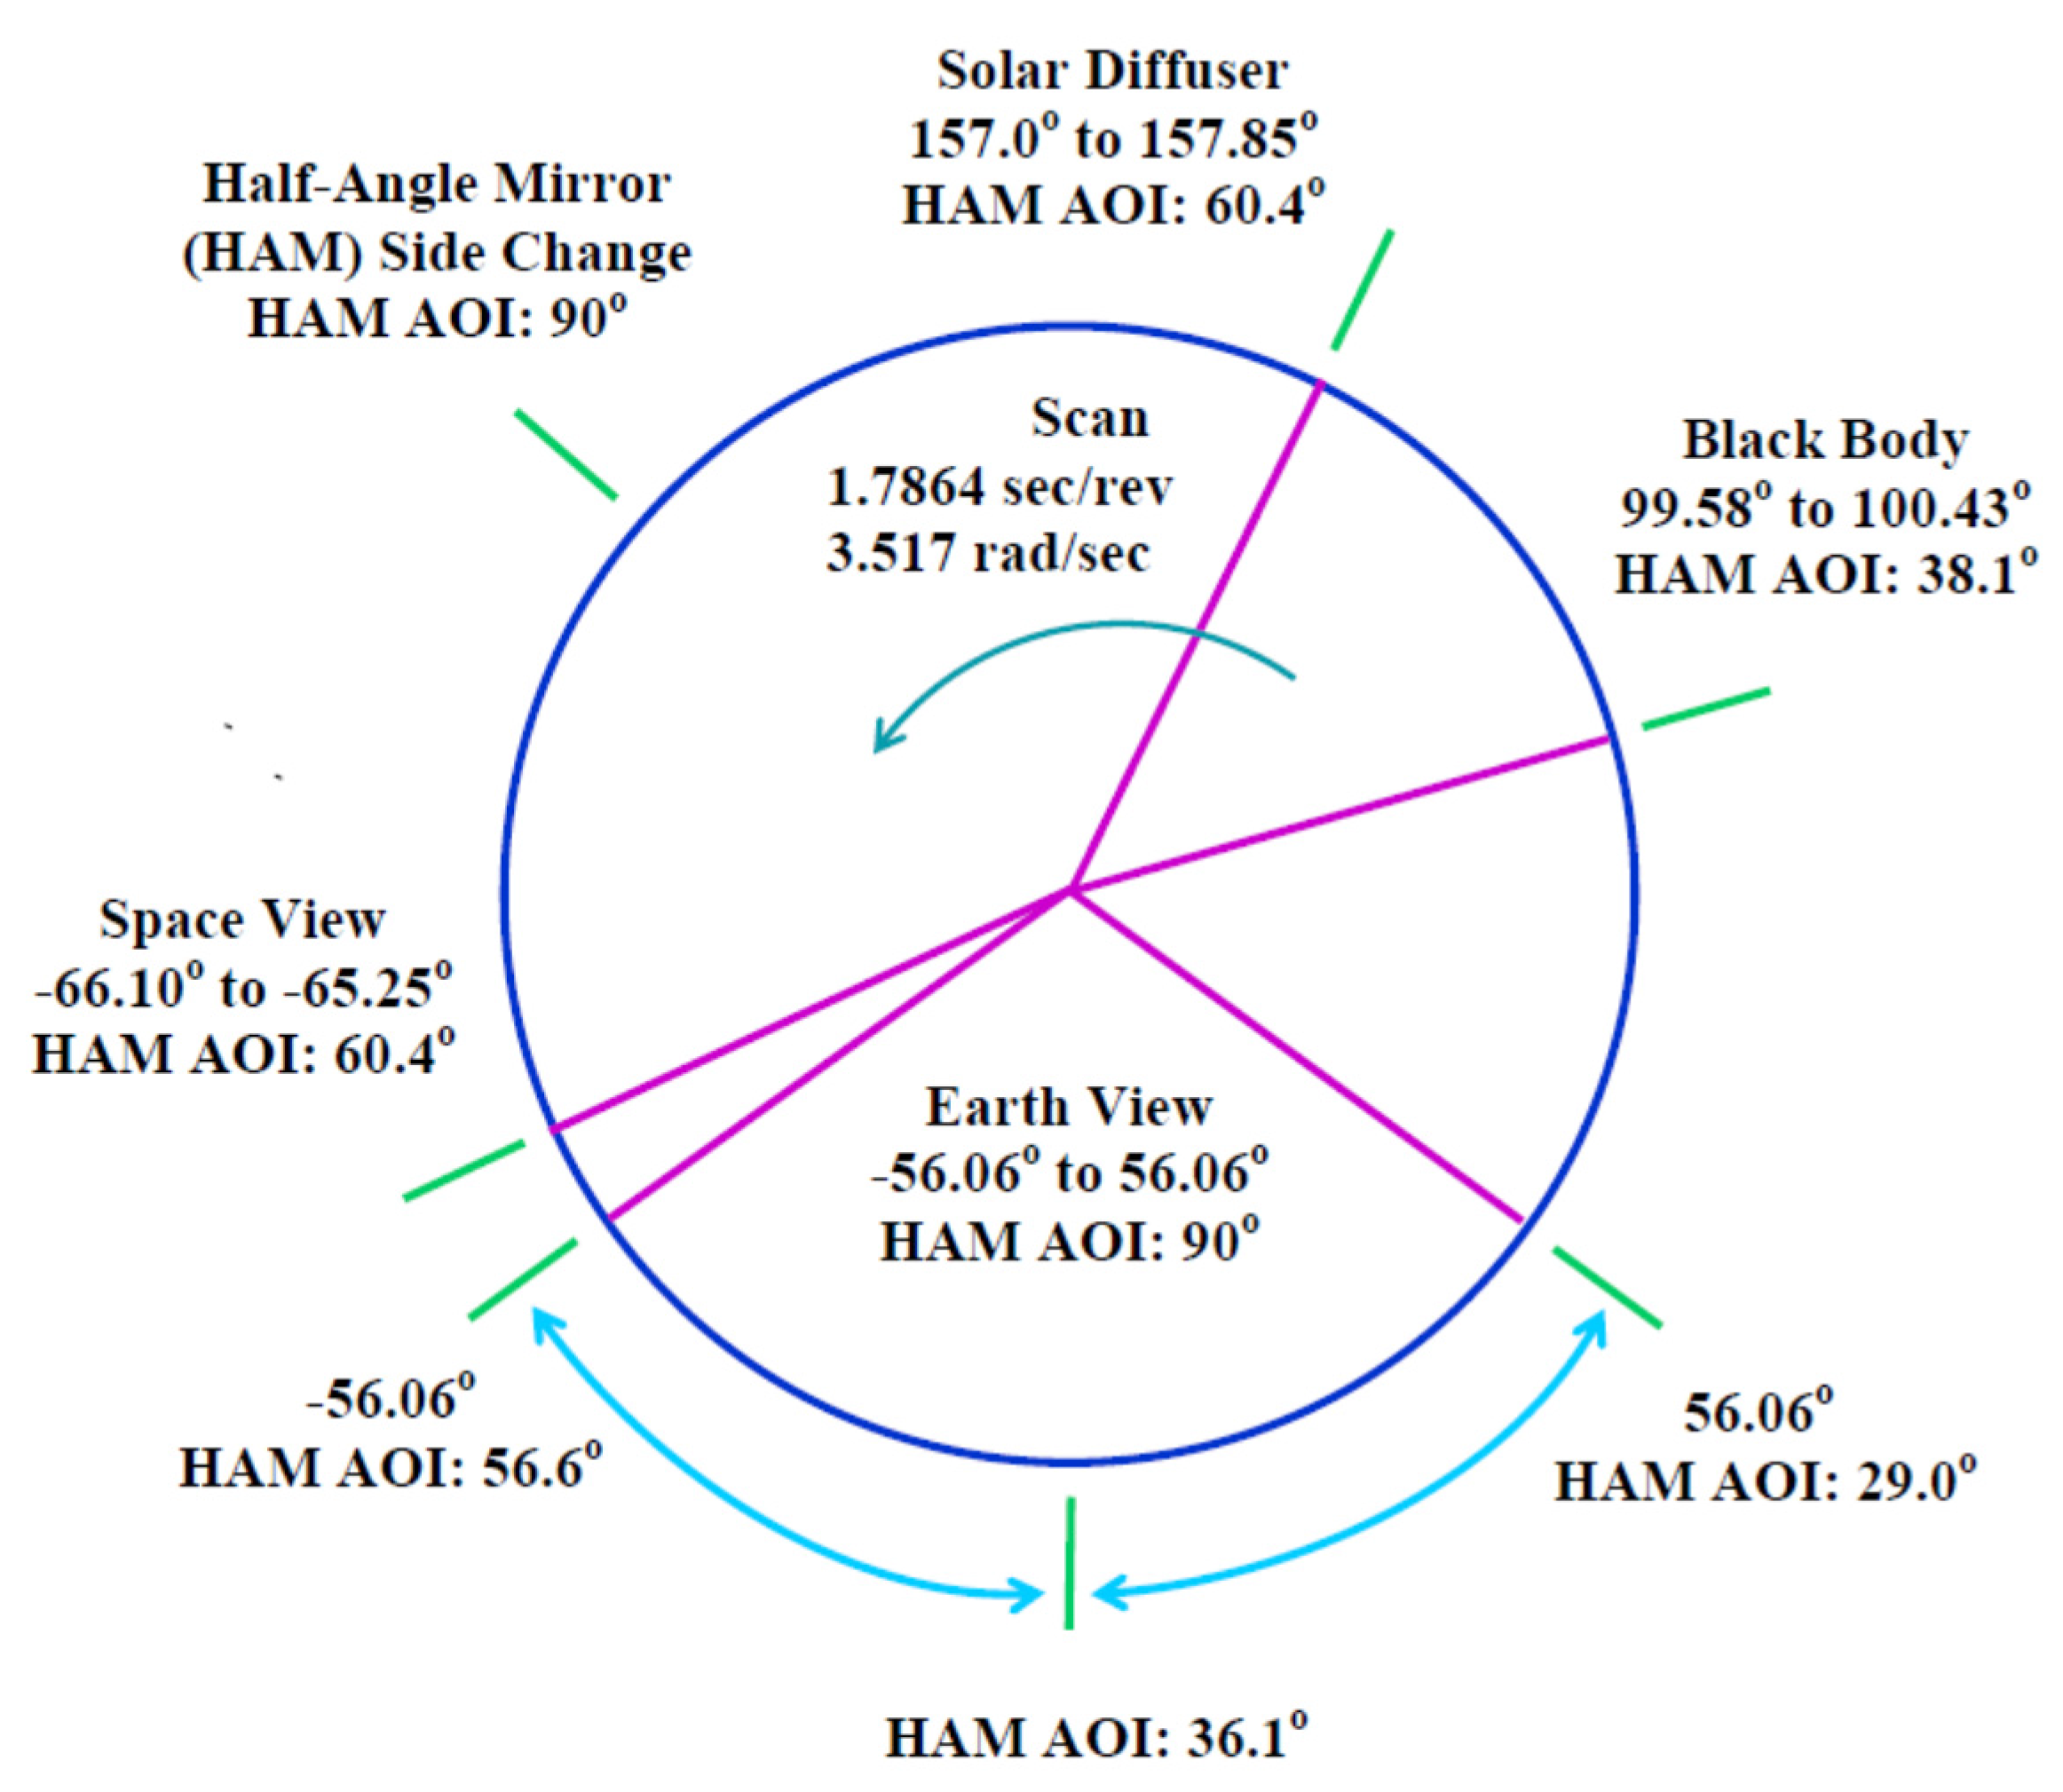
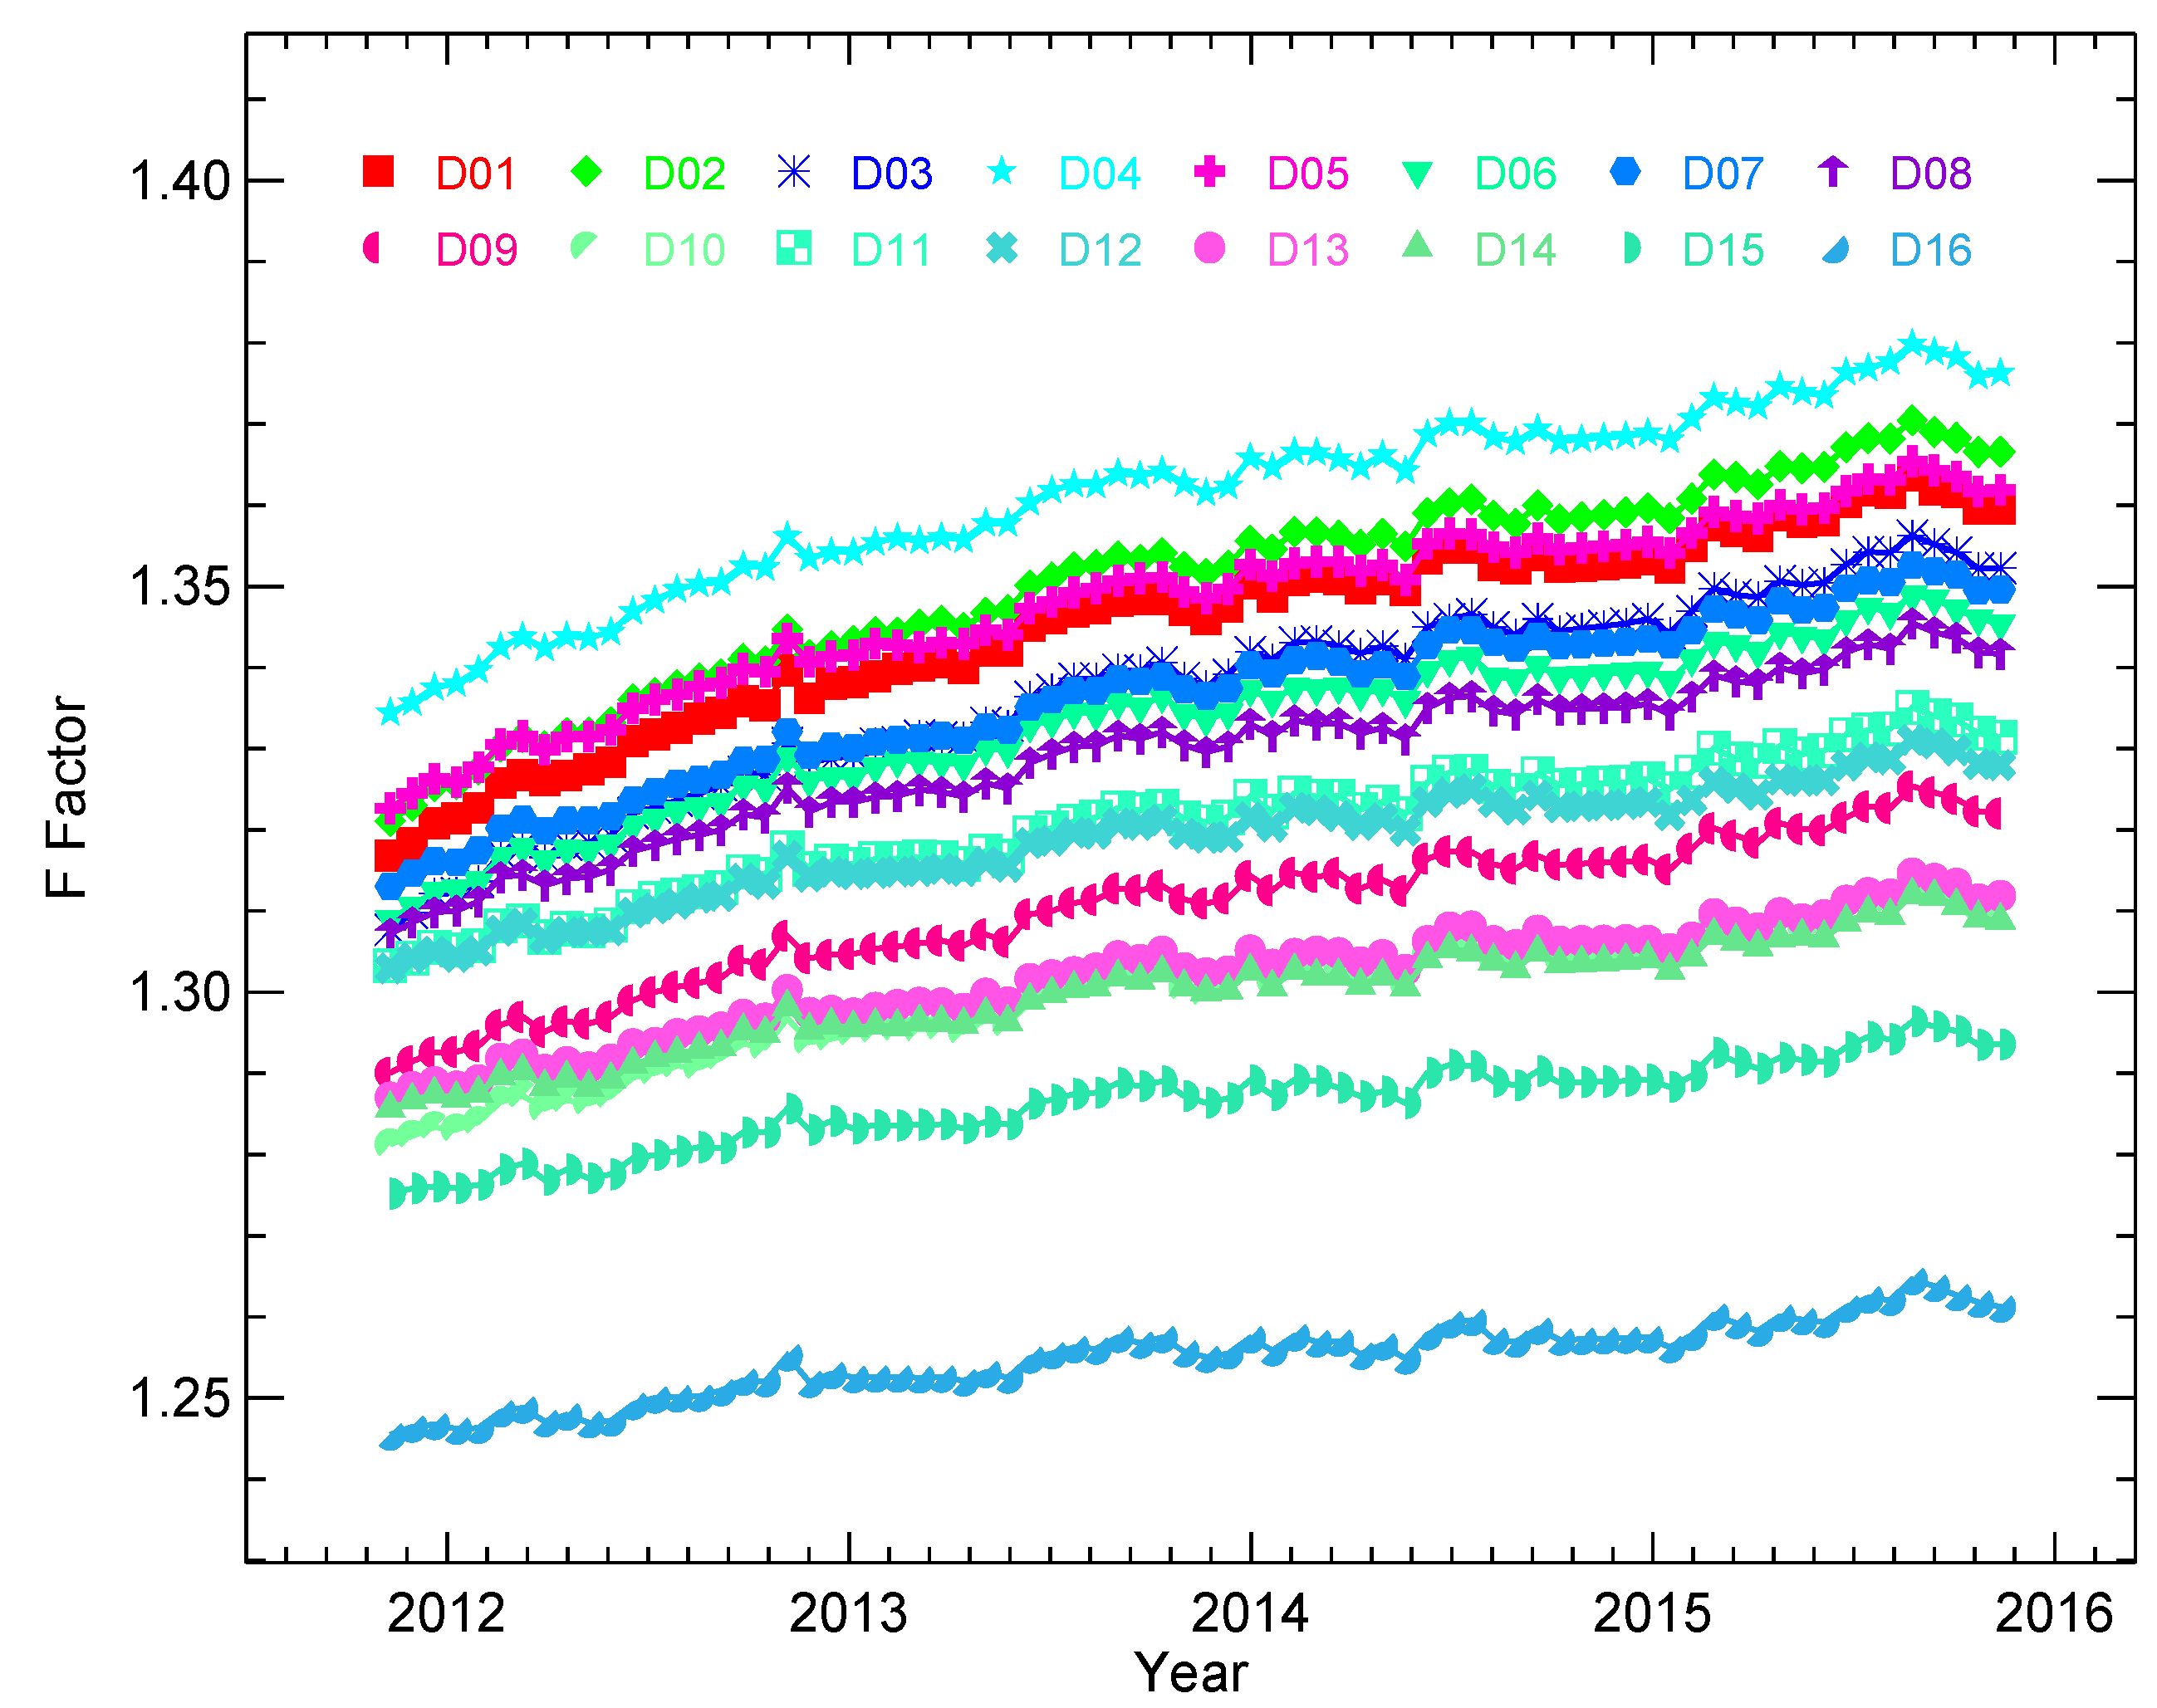
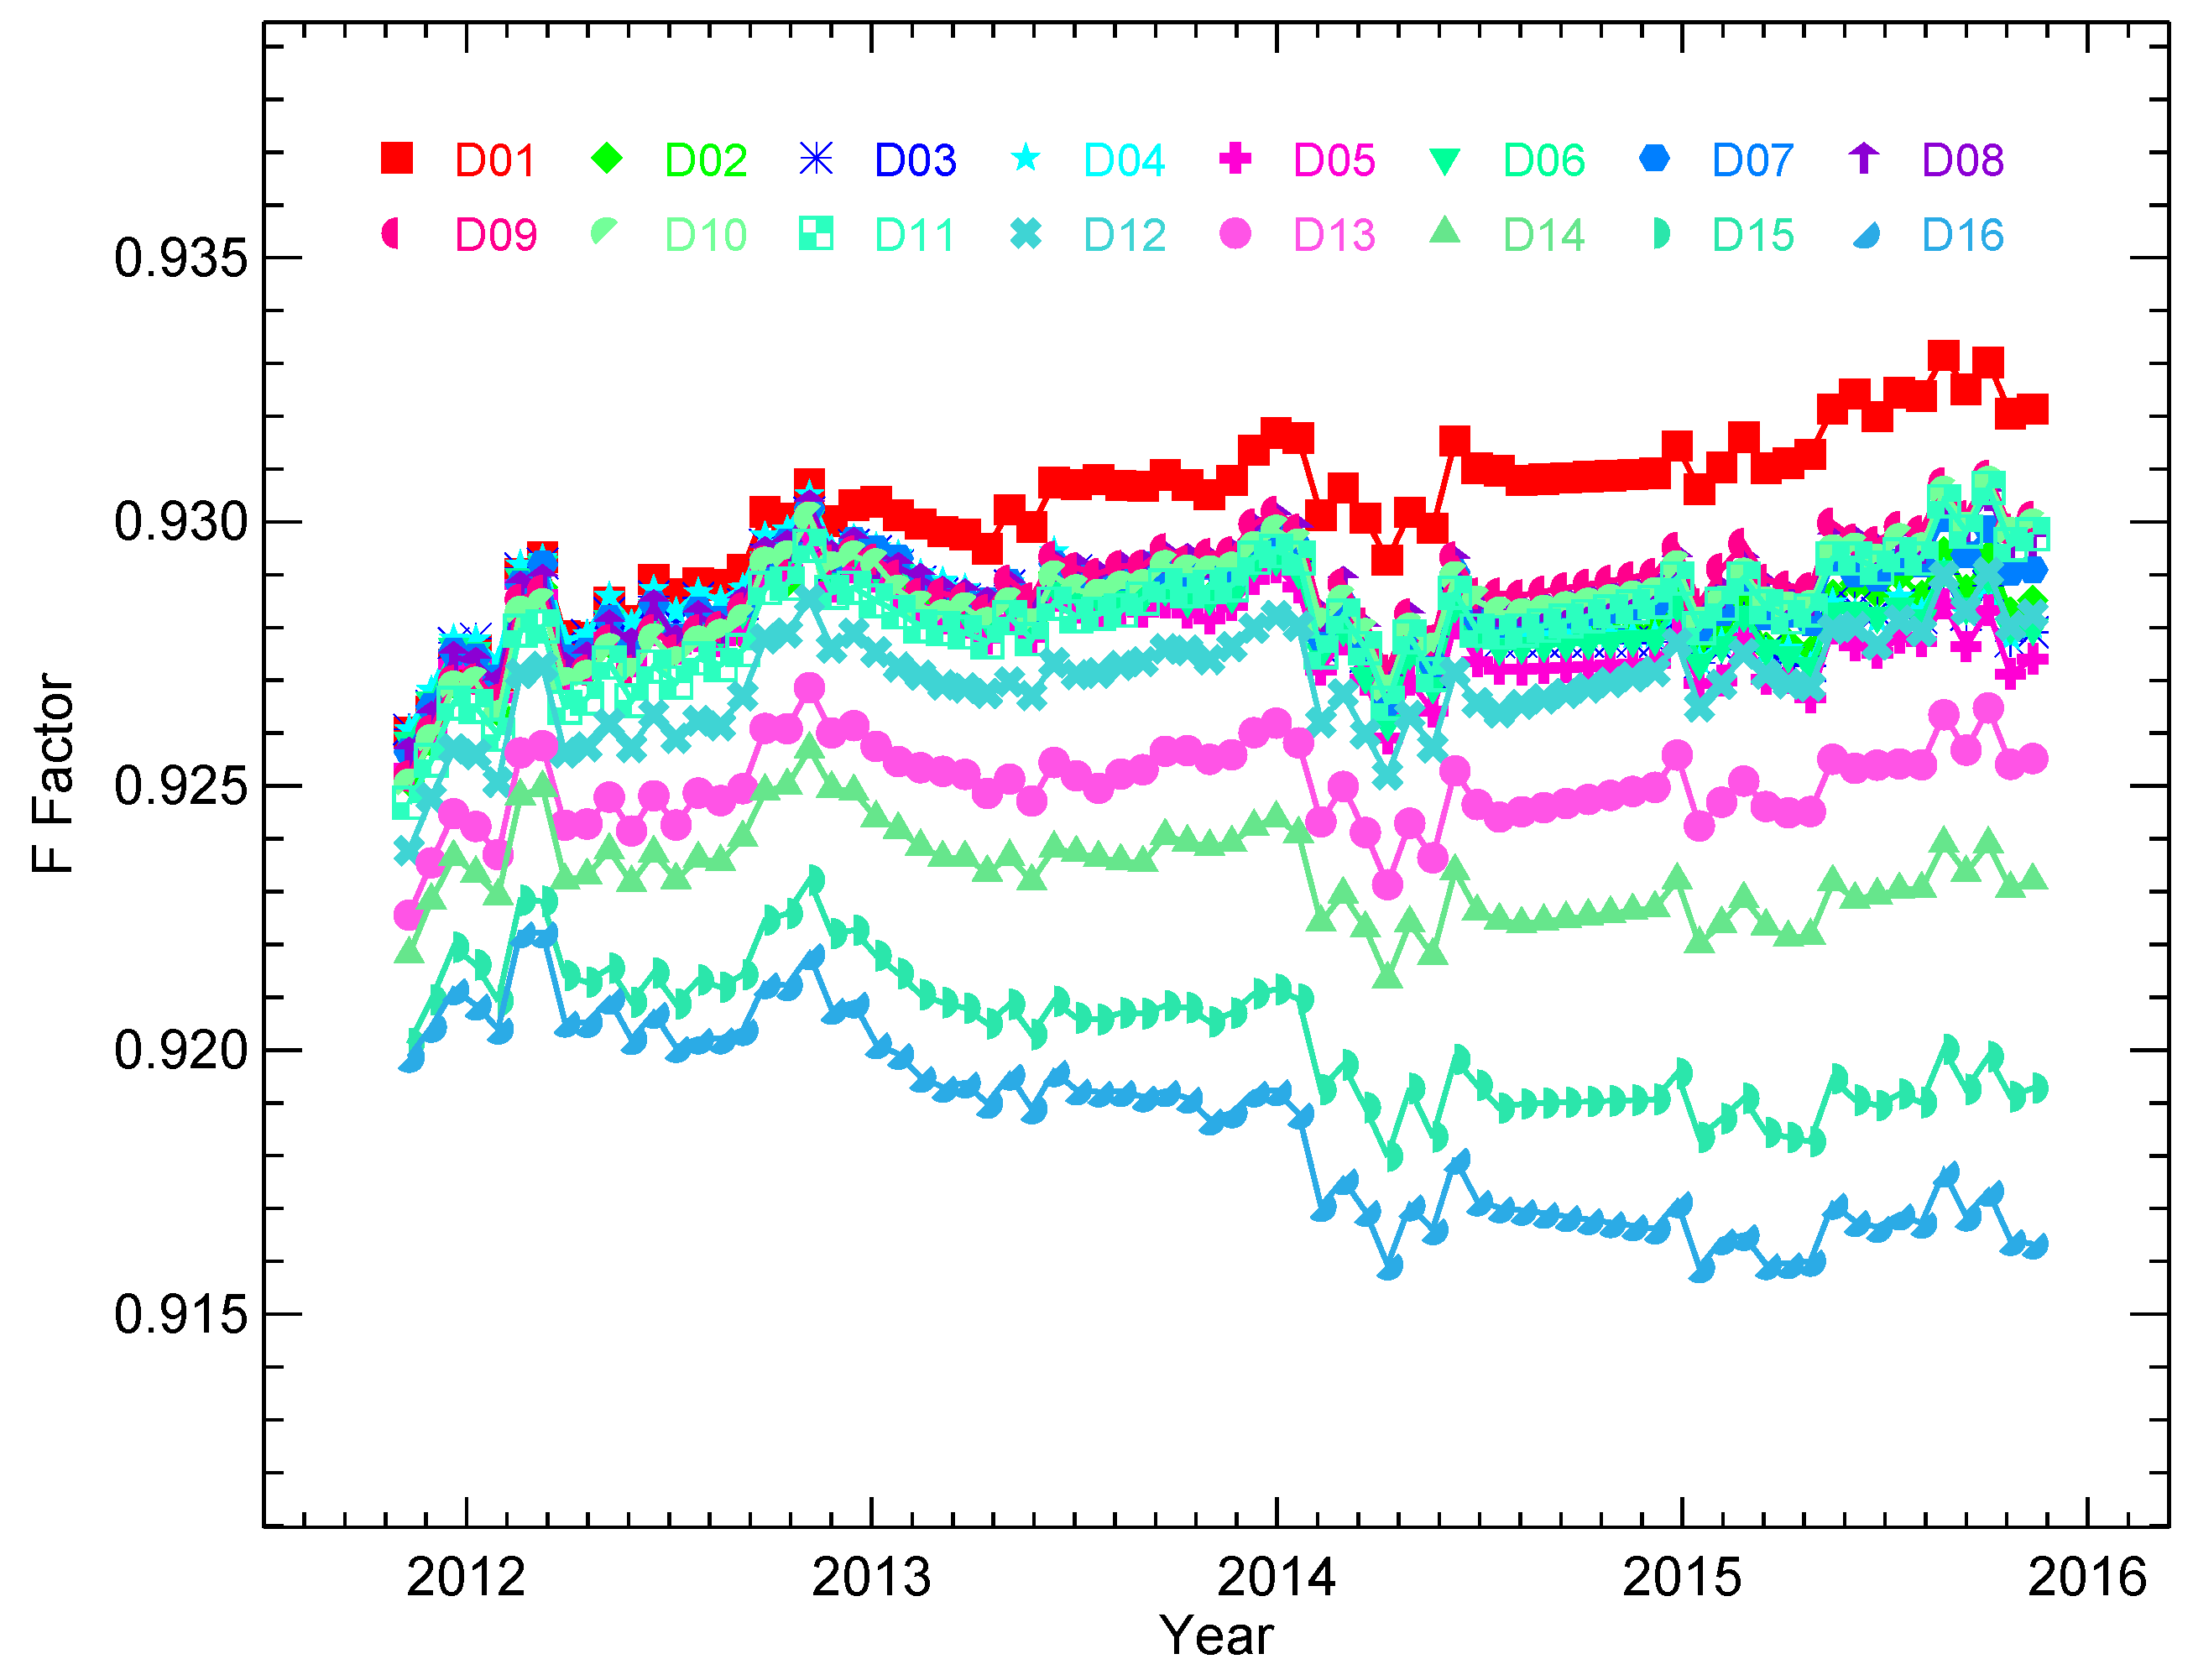
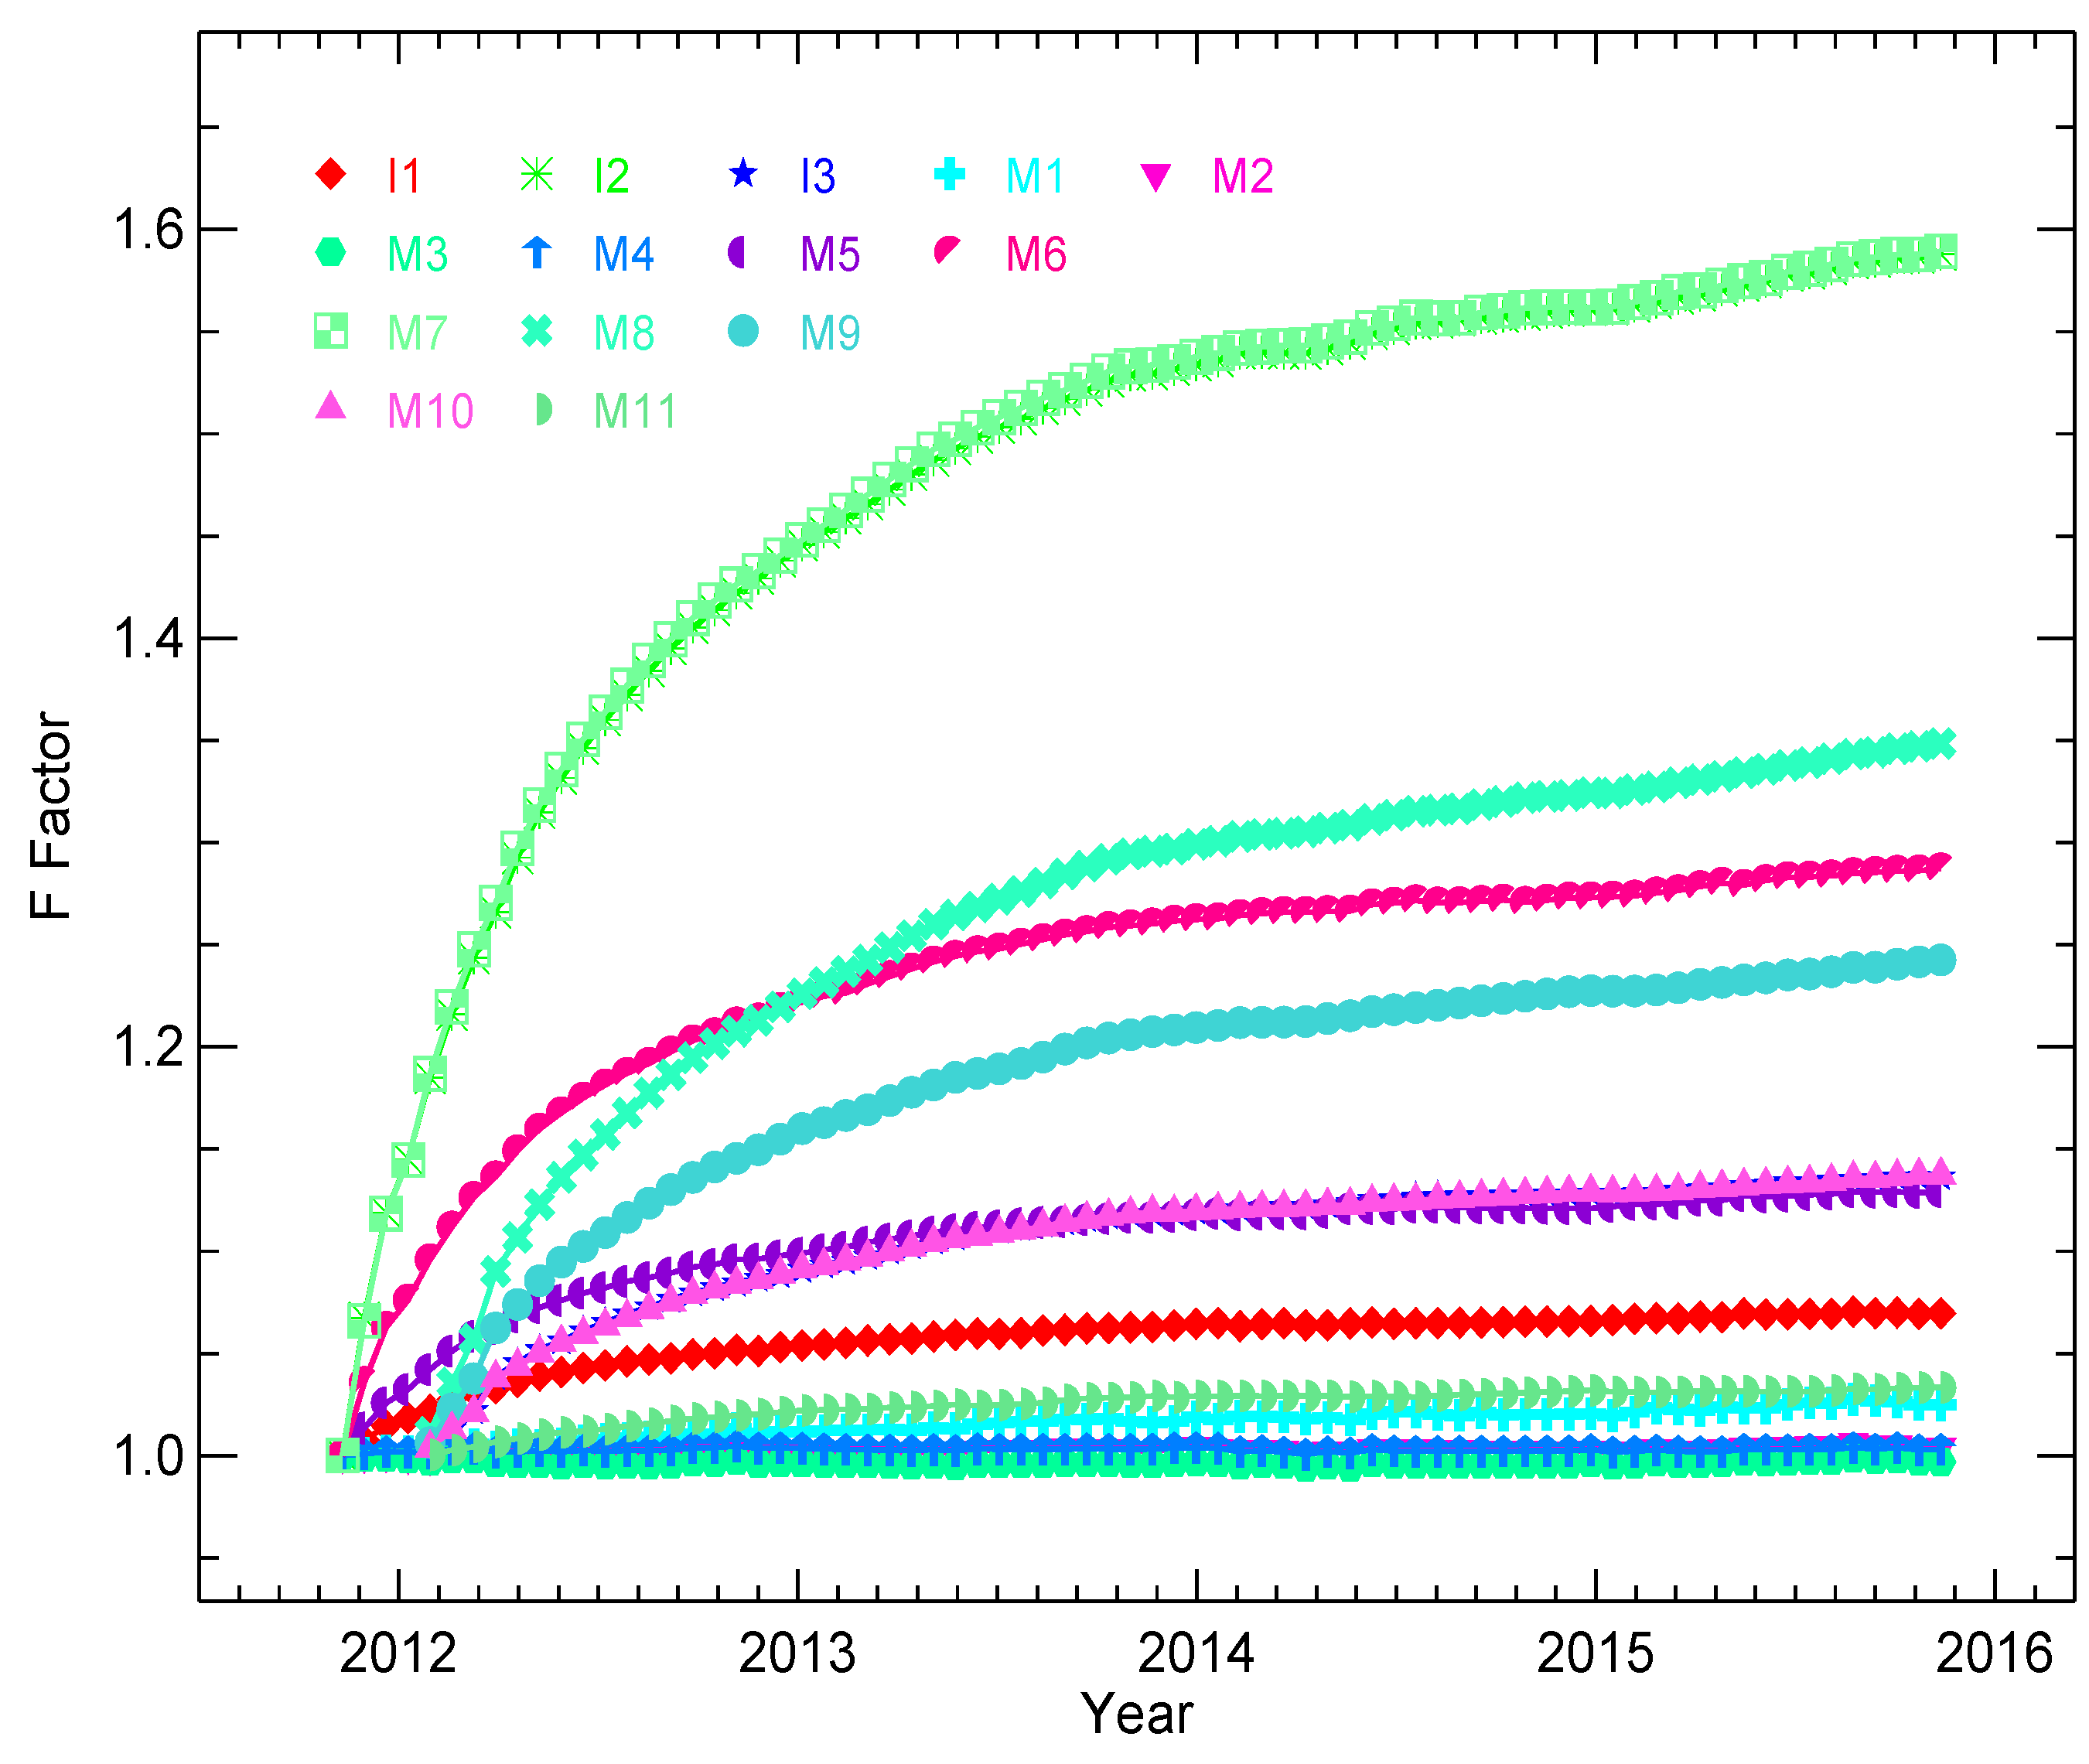
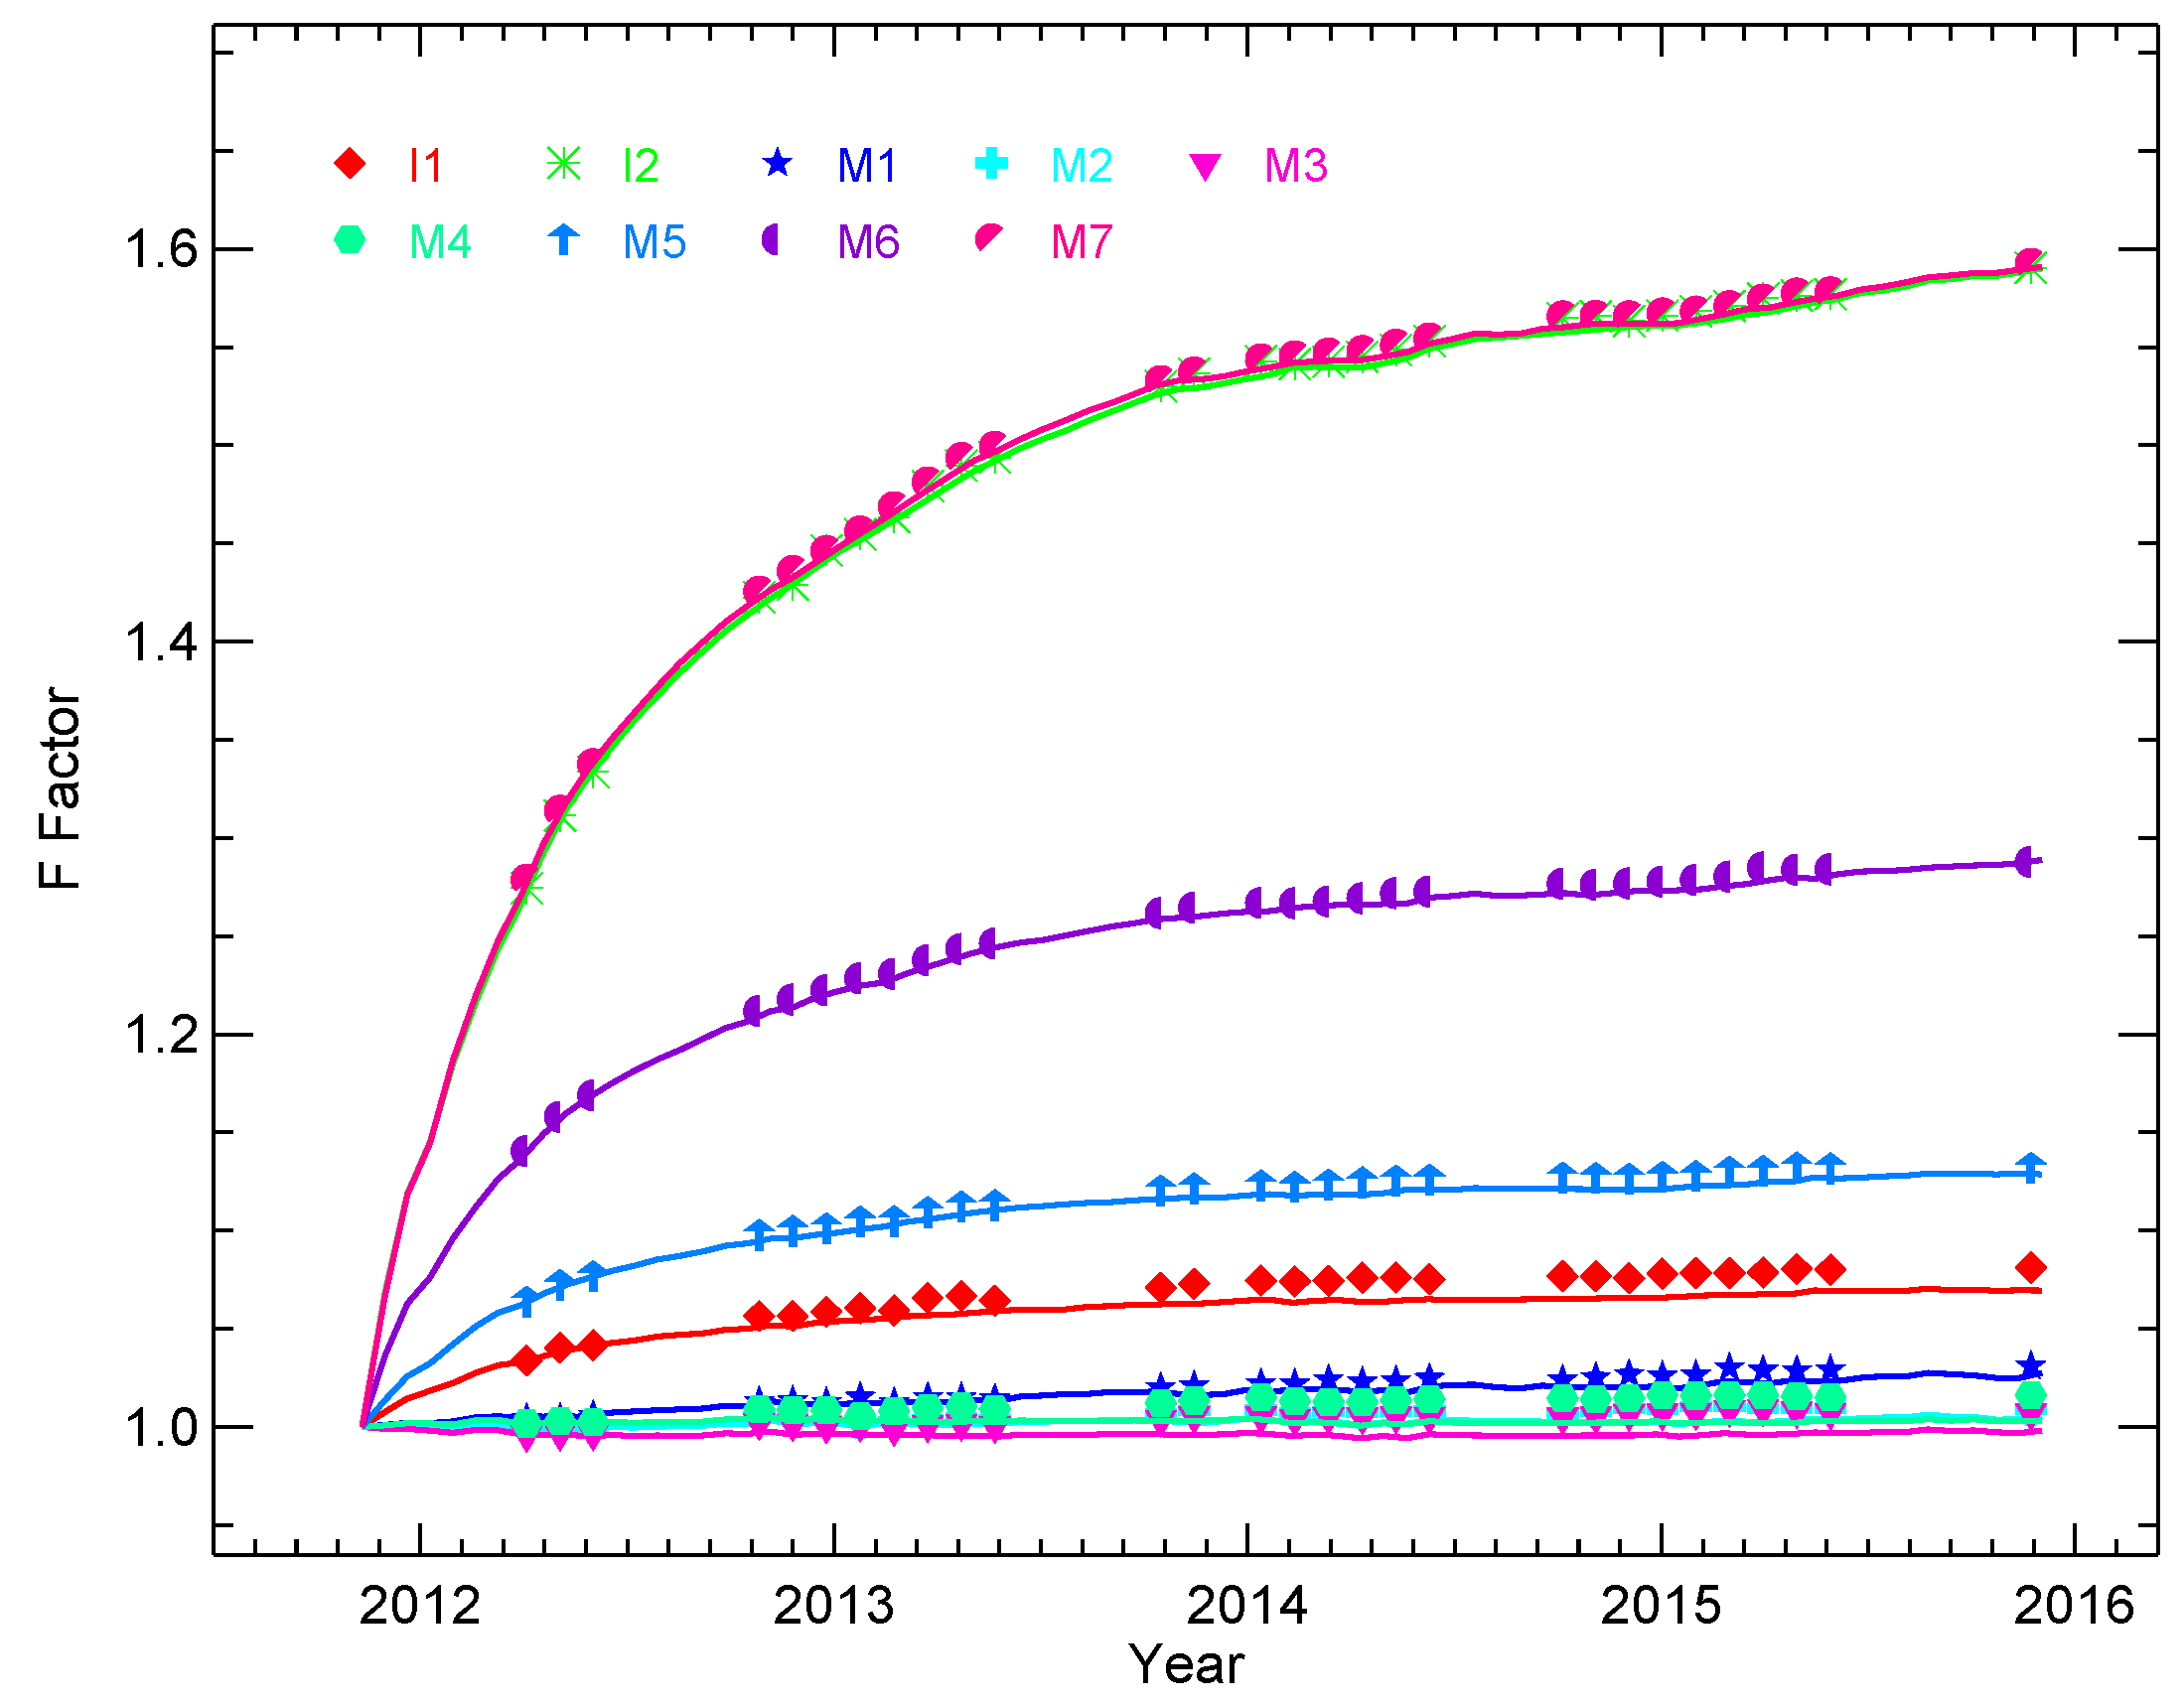
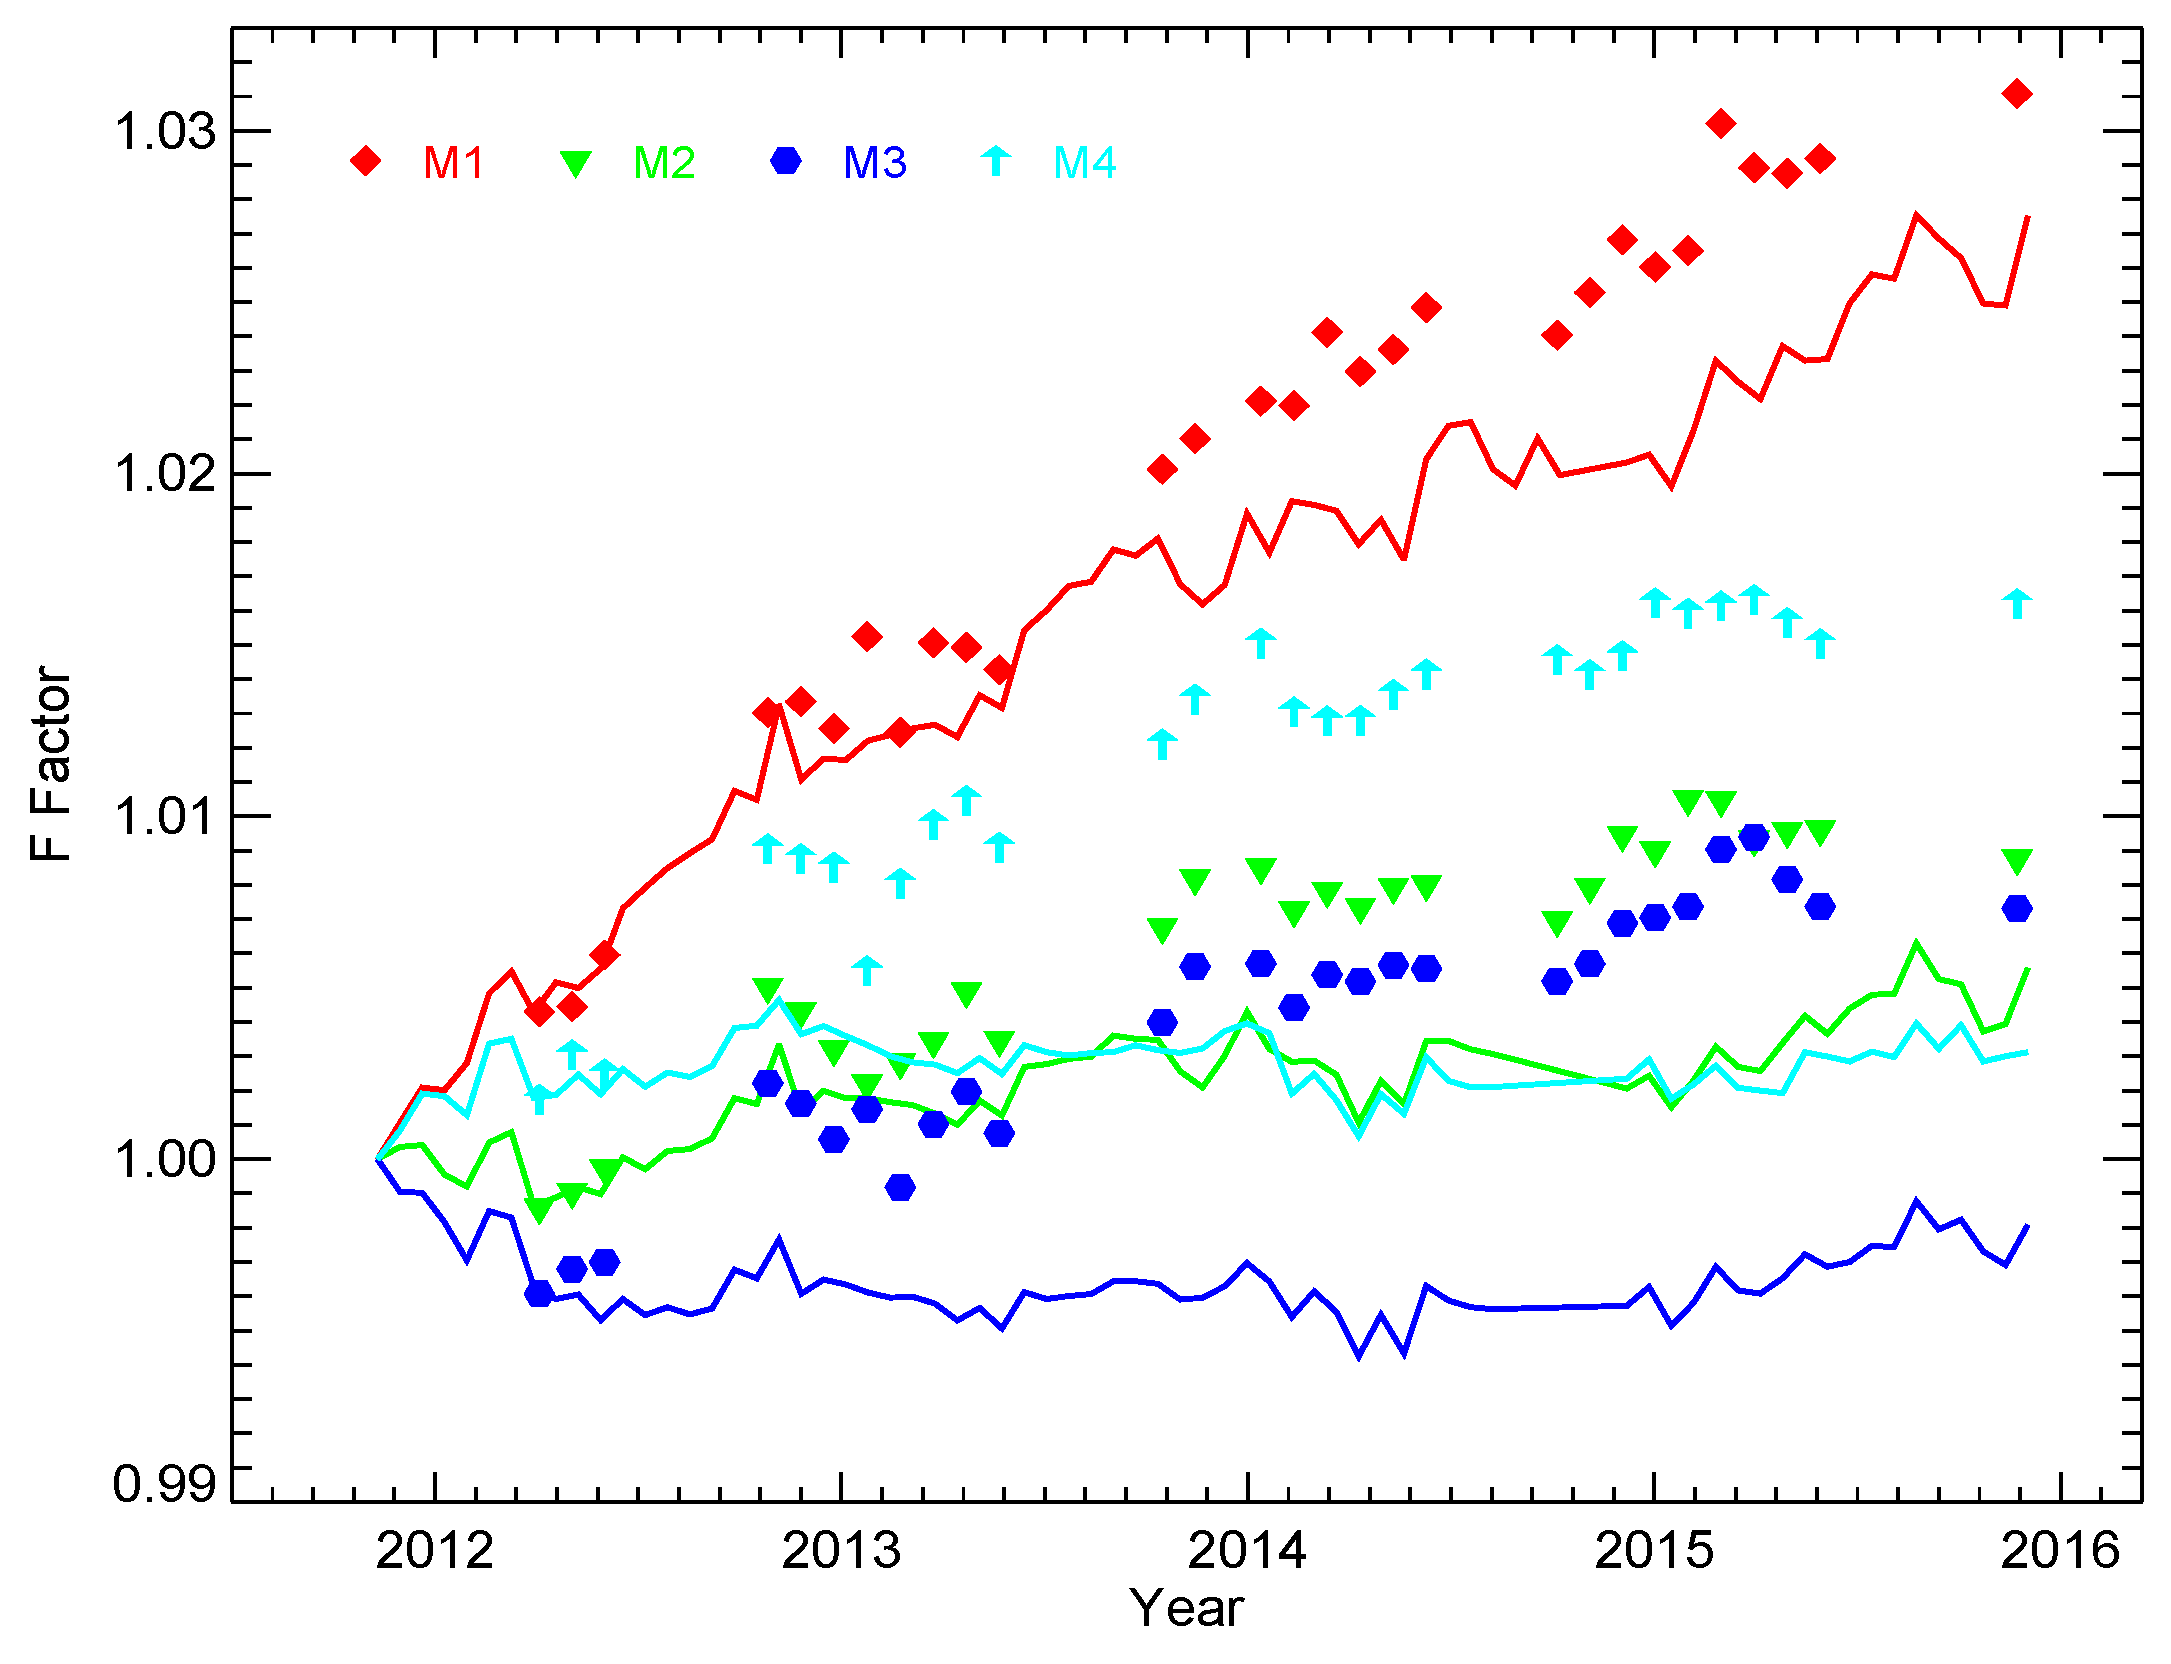
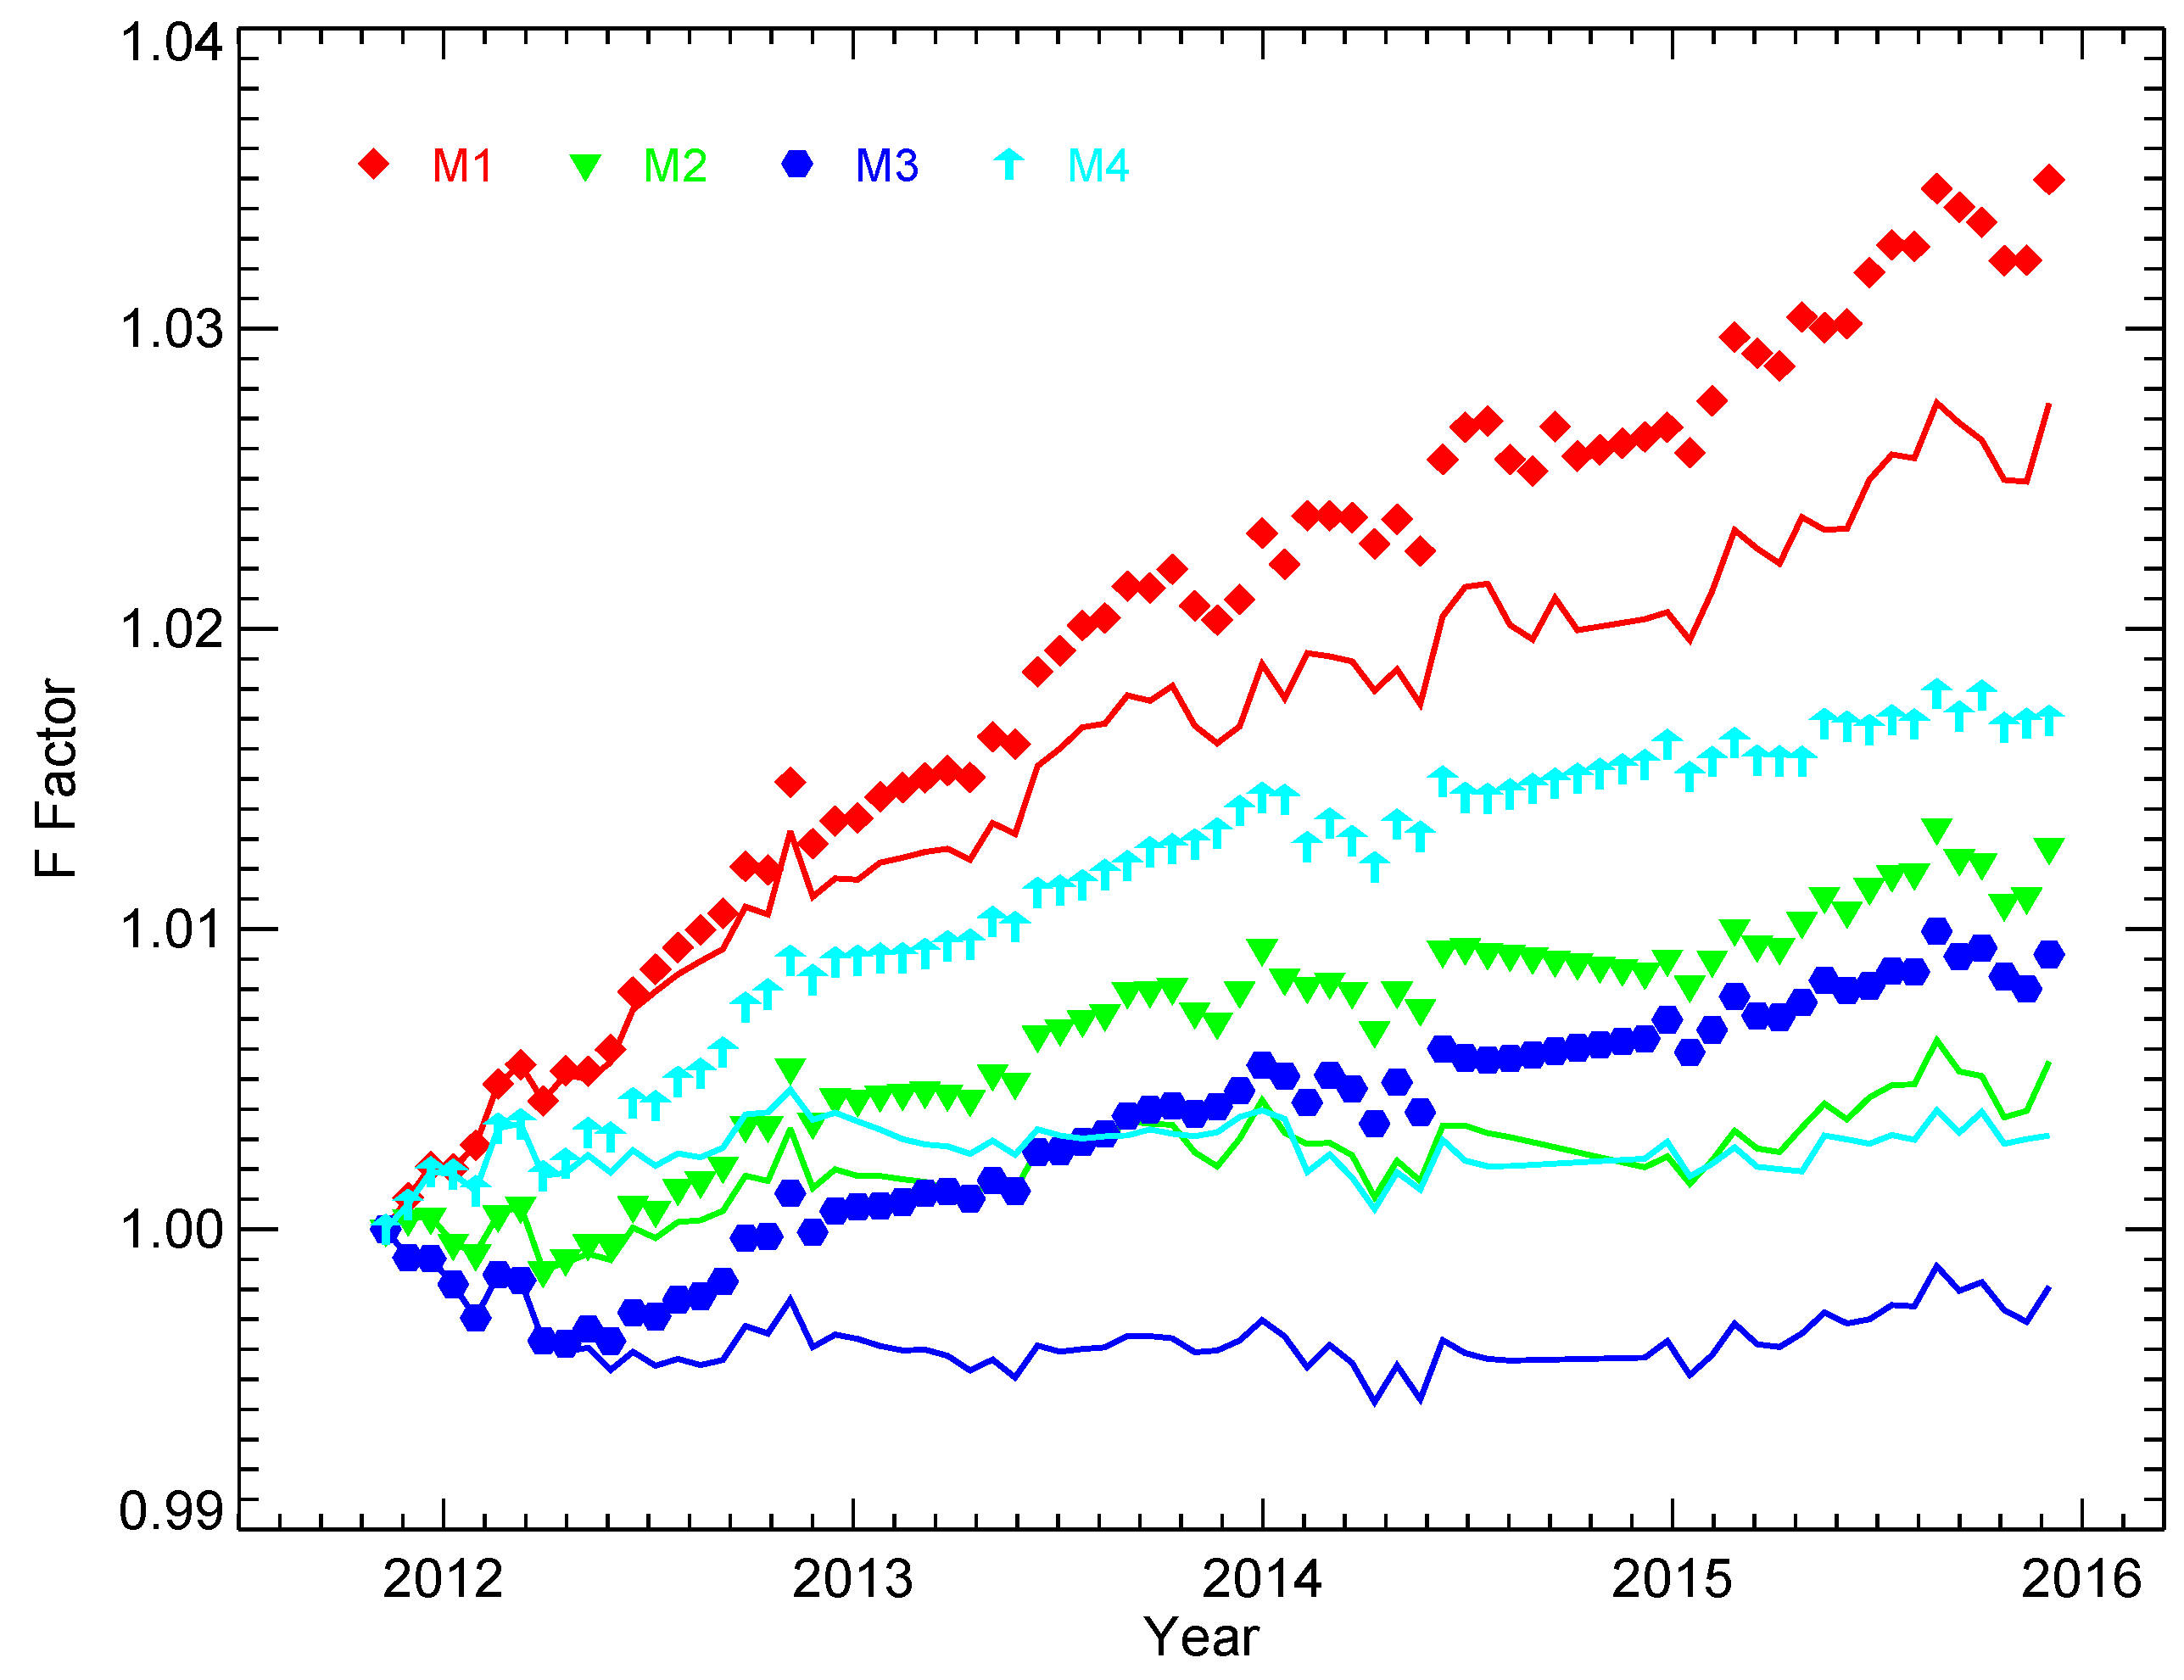
3.1. SD and SDSM Calibration

The SNPP VIIRS SD is a flat panel which is made of Spectralon® and is installed inside the VIIRS instrument. Figure 3 is a schematic diagram for the VIIRS SD/SDSM calibration. The BRF of the SD was measured prelaunch and validated on-orbit using the measurements with yaw maneuvers [9,15,16,32]. The on-orbit degradation of the SD BRF is tracked by an SDSM [6,7,8]. To prevent saturation of the RSB, a screen is placed in the front of the SD port to reduce the intensity of the sunlight. The transmittance of the screen, described by a vignetting function (VF), was also characterized prelaunch and validated on-orbit using the yaw measurements [15,16,33]. For on-orbit calibration, the SD is fully illuminated only in a short window of time in each orbit when the satellite crosses the terminator from the nightside to the dayside of the Earth and only the measurements in this short full-illumination interval can be used to derive the RSB calibration coefficients, or F-factors [3,4,5].
The RSB calibration coefficients, or the F-factors, using the SD (solar diffuser) observation can be calculated by [5]:
F ( B , D , M , G , t ) = R V S ( ϑ S D , B ) R S R B ( λ , t ) L S D ( λ ) d λ [ j = 0 2 c j ( B , D , M , G ) d n B j ( P , S , D ) ] R S R B ( λ , t ) d λ P , S
where θSD is the AOI of the SD, RSRB is relative spectral response of band B, and <…> P,S indicates the average over the selected scans, which will be discussed in more detail later, and pixels in each scan. In Equation (2), LSD(λ) is the radiance of the sunlight reflected by the SD and can be expressed as:
L S D ( λ ) = I S u n ( λ ) B R F R T A ( λ ) τ S D S cos ( θ S D ) h ( λ ) / d V S 2
where ISun is solar irradiance, BRFRTA is the BRF for the outgoing direction of the RTA through which the RSB views the EV, SV, SD, and other on-board calibrators. τSDS is the VF of the SD screen, h(λ) is the on-orbit SD degradation, called H-factors [6,7,8], tracked by the SDSM and is normalized to 28 October 2011, and dVS is the VIIRS-Sun distance.
Both the BRF and the VF vary with the incident direction of the sunlight, which can be described by two independent solar angles. The solar declination and azimuth angles in the instrument coordinate system are usually selected to describe the incident direction. As mentioned previously, the BRF and VF were measured prelaunch [32,33] and their incident direction dependence was validated on-orbit using the on-orbit measurements from the planned yaw maneuvers [9,15,16]. Errors in the obtained BRF or VF induce seasonal oscillations in the derived F-factors, as seen in early literatures [3,4]. We have carefully re-derived BRF and VF from the yaw measurements and demonstrated that the re-derived BRF and VF significantly reduce the seasonal oscillations in the derived F-factors [5,16]. The declination angle changes 360° every orbit and the SD is fully illuminated in a small range of the declination, which corresponds to a short time window just before the instrument passes the south pole from nightside to dayside of the Earth, as mentioned previously [5]. Since the full-illumination interval changes with the seasons, a smaller window, called “sweet spot”, is selected to guarantee that the SD is fully illuminated in the selected window in all seasons, and that only the data in the window are used to derive the F-factors. An improperly selected “sweet spot” may induce seasonal oscillation as well. We have carefully selected the “sweet spot” to be in the declination angle range from 13°–17° for VIIRS SD calibration [5,16]. Our work uses the much-improved BRF and VF as well as the carefully selected “sweet spot”.
Figure 4 shows the actual solar azimuth angle for the full illumination time periods in the last four years since the instrument launch. The vertical line around day 110 corresponds to 15 and 16 February 2012, when the yaw maneuvers were implemented. The solar azimuth angle shows a time-varying annual pattern, as expected. It is also noticeable that the solar azimuth angle has shown a long-term increase, which implies that the SNPP satellite orbit is drifting. From the plot, it is seen that the solar azimuth angle is still within the range covered by the yaw measurement, but it can be a concern that the solar azimuth angle may drift beyond the selected range, after which the BRF and the VF may have larger errors in the range where they are not as well characterized.
The VIIRS SD on-orbit degradation, h(λ), is tracked by the on-board SDSM calibration, as mentioned previously [6,7,8]. VIIRS SDSM calibration was performed for every orbit in the first few months on orbit, and then the operational rate was reduced to once per day, and further reduced to once every two days after 16 May 2014. So far, more than 1730 SDSM measurements have been performed for VIIRS. The SDSM has eight detectors with different center wavelengths tracking the SD degradation at the eight wavelengths [6,7,8]. Figure 5 shows the SD degradation derived from the SDSM measurements in symbols. They change smoothly over time except for those measured by the SDSM detectors D7 and D8, showing more noise [8]. Solid lines in Figure 5 are either the exponential functions of time fitted to the measured data (detectors D7 and D8), or the simply linear connections of the measured data (all other detectors). Both the symbols and solid lines are normalized at the time of launch, 28 October 2011. The solid lines for the SD degradation at eight different wavelengths and their linear interpolations for other wavelengths within the spectral coverage are used in Equation (2) to derive the F-factors [5,8]. As expected, the SD degrades faster at shorter wavelengths. In the past four years since VIIRS first light, the SD has degraded about 31.8%, 25.4%, 19.7%, 11.8%, 5.2%, 3.4%, 1.9%, and 1.3% at wavelengths of 412, 450, 488, 555, 672, 746, 865, and 935 nm, respectively. The SD degradation for the shortwave infrared (SWIR) bands, or wavelengths longer than 935 nm, is beyond the spectral coverage of the SDSM, as seen in Table 1, and typically is assumed to be null for wavelengths beyond this range. The SD may have non-negligible SD degradation at the wavelength of the shortest SWIR band, M8 (1238 nm), and the degradation is estimated to be around 0.5% [8,34,35].
The SD degraded smoothly before February 2014, as expected, but started to behave abnormally since then, especially at short wavelengths. The SD reflectance started to increase in February 2014 for about the next 75 days before reverting back. Furthermore, the subsequent trend did not return to the previously declining pattern expected [8]. The reflectance also started to increase again at about the same time in following years and resulted in an extra seasonal repeating pattern on top of the speculated SD degradations. This unexpected behavior is considered to be a real SD reflectance change according to its impact on the calculated RSB F-factors using the SD calibration [5]. The real physical or chemical phenomena for this behavior are not known yet. Attention needs to be paid to this abnormal behavior and further investigation of the cause of the behavior can be valuable.
As seen in Figure 3, the view directions of the SDSM and the RTA with respect to the SD surface are very different. The SD degradation, h(λ), derived from the SDSM calibration describes the SD degradation for the outgoing direction towards the SDSM view. We have demonstrated that the SD may degrade non-uniformly with respect to incident and outgoing directions [5,8]. This means that the SD degradation observed by the SDSM may differ from the actual degradation of the SD for the outgoing direction towards the RTA view. This issue has been discussed in our previous work and will be discussed further in later sections [5,8,14].
The relative spectral response (RSR) may change on-orbit, especially when the out-of-band (OOB) RSR contribution is large. The RSR on-orbit changes can be induced by the degradation of the instruments’ optical system, the degradation of the detectors and other possible reasons. If the degradation of optical system is the main cause of the on-orbit changes of the SNPP VIIRS RSB, they can be derived from the time-dependent F-factors [14,36]. An iterative approach can be used to calculate both the F-factors and the RSR with the prelaunch-measured RSR. It has been shown that the rate of RSR change is comparatively larger in the early mission but then slows afterward until becoming almost negligible after about August of 2013 [14]. It has also been shown that the on-orbit RSR changes impact most of the RSB at the 0.1% level or less, except for band M1, with 0.14% at its maximum value, and the effect mainly occurs early in the mission [14]. Generally speaking, the impacts of the on-orbit RSR changes on RSB F-factors derived from the SD calibration are not significant. Nevertheless, the F-factors shown in this paper are all calculated with the time-dependent RSR from our iterative calculation.
The SD is fully illuminated whenever the instrument passes the southern pole from the nightside of the Earth to dayside, as mentioned previously, generating about 14 SD calibration events daily, from which 14 sets of RSB calibration coefficients can be derived. The F-factors are calculated for each RSB, detector, gain status, and HAM side using Equation (2). Figure 6 and Figure 7 show the F-factors for bands M1 and M4, respectively, with high gain and HAM side 1, where D1, D2, …, and, D16 denote detector 1, 2, …, and 16, respectively, of each band. For both bands, F-factors are clearly detector- and time-dependent. In the last four years, they have changed about 3% for band M1 and less than ~0.5% for band M4. Compared to those for the corresponding MODIS bands (with similar center wavelengths), their changes are much smaller. The F-factors displayed in Figure 6 and Figure 7 for both bands M1 and M4 are stable and the level of noises or fluctuations in them are within ~0.2%. Figure 8 shows the detector-averaged F-factors for band M1 for four combinations of the gain status and HAM side. The F-factors increase smoothly with noises being within ~0.2% for all four combinations. The differences among the four combinations have maintained at about the same level in the last four years since the VIIRS launch.
The detector-averaged F-factors for all RSB with high-gain status and HAM 1 are displayed in Figure 9. The F-factors for non-SWIR bands are normalized at the first measurement. The SWIR bands were normalized on 20 January 2012 when the temperature of the S/MWIR FPA started to be controlled. The SWIR bands were not stable and usable before 20 January 2012. The F-factors shown in all figures are the calculated values from each individually selected SD measurement without any average over different events. From Figure 9, it is seen that the F-factors of bands I2 and M7 have the largest increase, of about 58.5%. M8 has the second largest F-Factor increase of about 35.0%. The F-factor of band M3 has the least increase and is actually a modest decrease of about 0.3% in the last four years. The F-factor of band M1, which has the shortest wavelength among all RSB, has only increased ~2.6% in the last four years since launch. Since VIIRS on-orbit, the F-factors of bands M2, M4, I1, M5, I3, M6, M9, M10, and M11 have increased about 0.5%, 0.4%, 7.0%, 13.0%, 13.5%, 28.5%, 24.0%, 13.5%, and 3.6%, respectively. The gain of a band is inversely proportional to the F-factor of the band. Thus, the increase of a band’s F-factor means the degradation of the band and a larger increase of the F-factor indicates a larger degradation of the band’s gain. Generally, the NIR and SWIR bands have degraded much faster than VIS bands. The degradation of the NIR and SWIR bands is mainly due to the degradation of the RTA, which has the largest degradation, around a wavelength of 1000 nm [5,37,38,39]. Among bands M1-M3, which have the shortest wavelengths, the band with the shorter wavelength has the larger degradation. The degradations of these bands are mainly due to the degradation of the HAM, which degrades faster at a shorter wavelength [5].
The HAM side differences provide important information about the degradation of the HAM. To examine the HAM side difference, we need the actual calibration coefficients, which are calculated by the multiplication of F-factors and the prelaunch calibration coefficients. The HAM side ratios of the actual calibration coefficients are calculated and shown in Figure 10 for all RSBs. They are very stable and close to 1, within ±0.8%, for all RSBs, which is much smaller than those observed in MODIS instruments [27,28,31]. It is also seen from Figure 10 that the HAM side differences are wavelength-dependent and have had no observable changes in the last four years. The largest HAM side differences occur in bands I1 and M4. This is consistent with the polarization sensitivity on HAM side differences observed in prelaunch measurements only in bands I1 and M4 [40].

3.2. Lunar Calibration

The Moon is known to have a very stable reflectance in the VIS and NIR spectral regions [18] and has been widely used to track the RSB on-orbit gain changes [41,42,43]. Since the lunar surface is not smooth, the lunar irradiance instead of the lunar radiance is used for the RSB calibration. The lunar irradiance strongly depends on the viewing geometry, especially the lunar phase angle. To reduce the calibration uncertainty, the lunar phase angles of all lunar calibration events for a remote sensor are typically kept in a small selected range [9]. To keep the phase angle in the selected small range, an instrument roll maneuver, which increases the lunar observation opportunity, is usually required. For SNPP VIIRS, the phase angle range was selected as (−56°, −55°) early in the mission and then changed to (−51.5°, −50.5°) to minimize the roll angles needed for the lunar observations [10,11]. For the safety of the instrument, the roll angles for the roll maneuvers are required to be in the range of (−14°, 0°), where the angle is defined in the instrument coordinate system [10,11]. SNPP VIIRS always views a waxing Moon with its designed orbit and the confined roll angle range. The phase angle for a SNPP VIIRS lunar observation is negative because the instrument always views a waxing Moon and the phase angle is defined as negative for the Moon [9]. Due to the confinement of the roll angle, the Moon can be observed only in about nine months every year. SNPP VIIRS is scheduled to view the Moon once each month in the nine months. VIIRS views the Moon from the SV port. It was found early in the mission that the scene co-registration was not applied in the SV sector, thus the SV sector cannot provide a full lunar image for all bands [10]. The solution is to apply sector rotation during a lunar observation to store lunar observation data in the EV sector, and this has been done since April 2012.
The lunar irradiance can be calculated for each detector of a RSB, considering the oversampling effect and then the F-factor can be derived from the lunar observation for the detector [42]. However, the F-factors derived from a lunar observation for individual detectors are noisier than those derived from the SD calibration due to the roughness of the lunar surface. For lunar calibration, the detector-averaged F-factors are more reliable and adequate for the need of this analysis. During a lunar observation, the Moon can be seen in many scans and in most of the scans the instrument sees a partial Moon. The RSB F-factors can be derived, using all the scans with correction of the oversampling effect, or using a few scans around the center of the lunar observation in which the instrument sees a full Moon [42]. In this analysis, the latter approach is used. With the approximation that the difference between the detector on-orbit changes is negligible, the detector-averaged lunar F-factor can be expressed as [10]:
F ( B , D , M , G , t ) = g ( B ) N M D , P , S L p l ( B , D , P , S ) δ ( M , M S )
where g(B) corrects the relative geometric effects for band B, NM is the number of scans, with HAM side M. In the summation, Lpl(B,D,P,S) is the lunar irradiance calculated using the prelaunch calibration coefficients, and MS is the mirror side for the scan S. g(B) depends on the lunar view geometry, which is described by Sun-Earth distance, sensor-Moon distance, lunar phase angle, and lunar librations. The impacts of the first two factors can be described analytically and that of the last term is relatively small. The impact of the lunar phase angle is much larger than that of the lunar librations and thus lunar observations are scheduled for phase angles to be as identical as possible [9,10,11]. For SNPP VIIRS, the lunar phase angle, defined as negative for a waxing moon, is confined in (−56°, −55°) in first few months on-orbit and then changed to (−51°, −50°) due to instrument operational safety considerations. The confinement may occasionally be relaxed due to various other considerations. The viewing geometry can never be identical and the geometric effect has to be corrected to get accurate lunar F-factors. The Robotic Lunar Observatory (ROLO) model [18,41] can provide the predicted lunar irradiance, which can be used as g(B) to account for the geometric effect in Equation (4). The absolute uncertainty of the ROLO model can be as large as ~5% for short-wavelength bands and the uncertainty is even larger for the NIR bands. Thus, the lunar calibration cannot provide accurate absolute F-factors for the RSB. It can only be used to track the RSB on-orbit change. However, absolute lunar F-factors can be obtained by normalizing the lunar F-factors to the SD F-factors at the time of the first lunar calibration. The ROLO model uncertainty may vary with the viewing geometry. The relative uncertainty of the irradiance predicted by the ROLO model over the entire view geometry is about 1% [41]. Since the lunar phase angle is confined to a selected and restricted region, as mentioned above [9,10,11], the relative uncertainty of the lunar irradiance predicted by the ROLO model for VIIRS-scheduled lunar observations should be much smaller than ~1%. Thus, the lunar calibration can provide relative F-factors or the on-orbit gain change within ~1% accuracy. The relative uncertainty of the ROLO model prediction induces a seasonal oscillation, which is indeed smaller than 1%, as expected [11], in the derived F-factors. We have introduced a correction based on the viewing geometry to reduce the oscillation pattern and further reduce the uncertainty of geometric effect correction.
The F-factors, derived for SNPP VIIRS VIS and NIR bands from the scheduled lunar observations, are shown in Figure 11 as symbols. Similar to SD F-factors, the lunar F-factors are strongly wavelength-dependent and increase with time [5]. As expected, the largest increase occurs in the F-factors for bands I2 and M7, and changes in those for short wavelength bands are small. Among the three shortest wavelength bands M1-M3, band M1 has had the largest increase in lunar F-factors in the last four years. Compared to those reported in literature [10,11], the lunar F-factors in Figure 11 are much smoother and less noisy. The SD F-factors are also drawn in Figure 11 for VIS and NIR bands with solid lines for comparison. The lunar F-factors are normalized to the SD F-factors corresponding to the April 2012 lunar observation. It can be seen that the F-factors from the two calibrations are in general agreement but with observable differences. The differences between the two sets of F-factors also increase with time. For a more clear demonstration of the differences, Figure 12 shows only the F-factors for bands M1-M4. Among the four bands, the largest difference occurs in the band M4, which is about 1.3%, and band M2 has the second largest difference, which is about 1.0%. The differences for bands M1 and M2 are about 0.6% and 0.7%, respectively. The exact root causes of the differences between the SD/SDSM calibration and the lunar calibration are difficult to identify. However, in our previous works using both SDSM and RSB measurements from SD observations, it has been demonstrated that the SD degrades non-uniformly with respect to incident direction, especially for short wavelength bands [5,8]. This indicates that the SD degradation derived from the SDSM calibration may not be exactly the same as the SD degradation for the RTA view direction, resulting in errors featured as a long-term drift in the SD F-factors. The lunar calibration based on irradiance, however, faces no degradation issue and, in principle, should provide more reliable and accurate long-term RSB gain on-orbit changes. Thus, the non-uniformity of the SD degradation should be one of the main reasons for the discrepancy of the two sets of F-factors and should be the primary one for short wavelength bands.

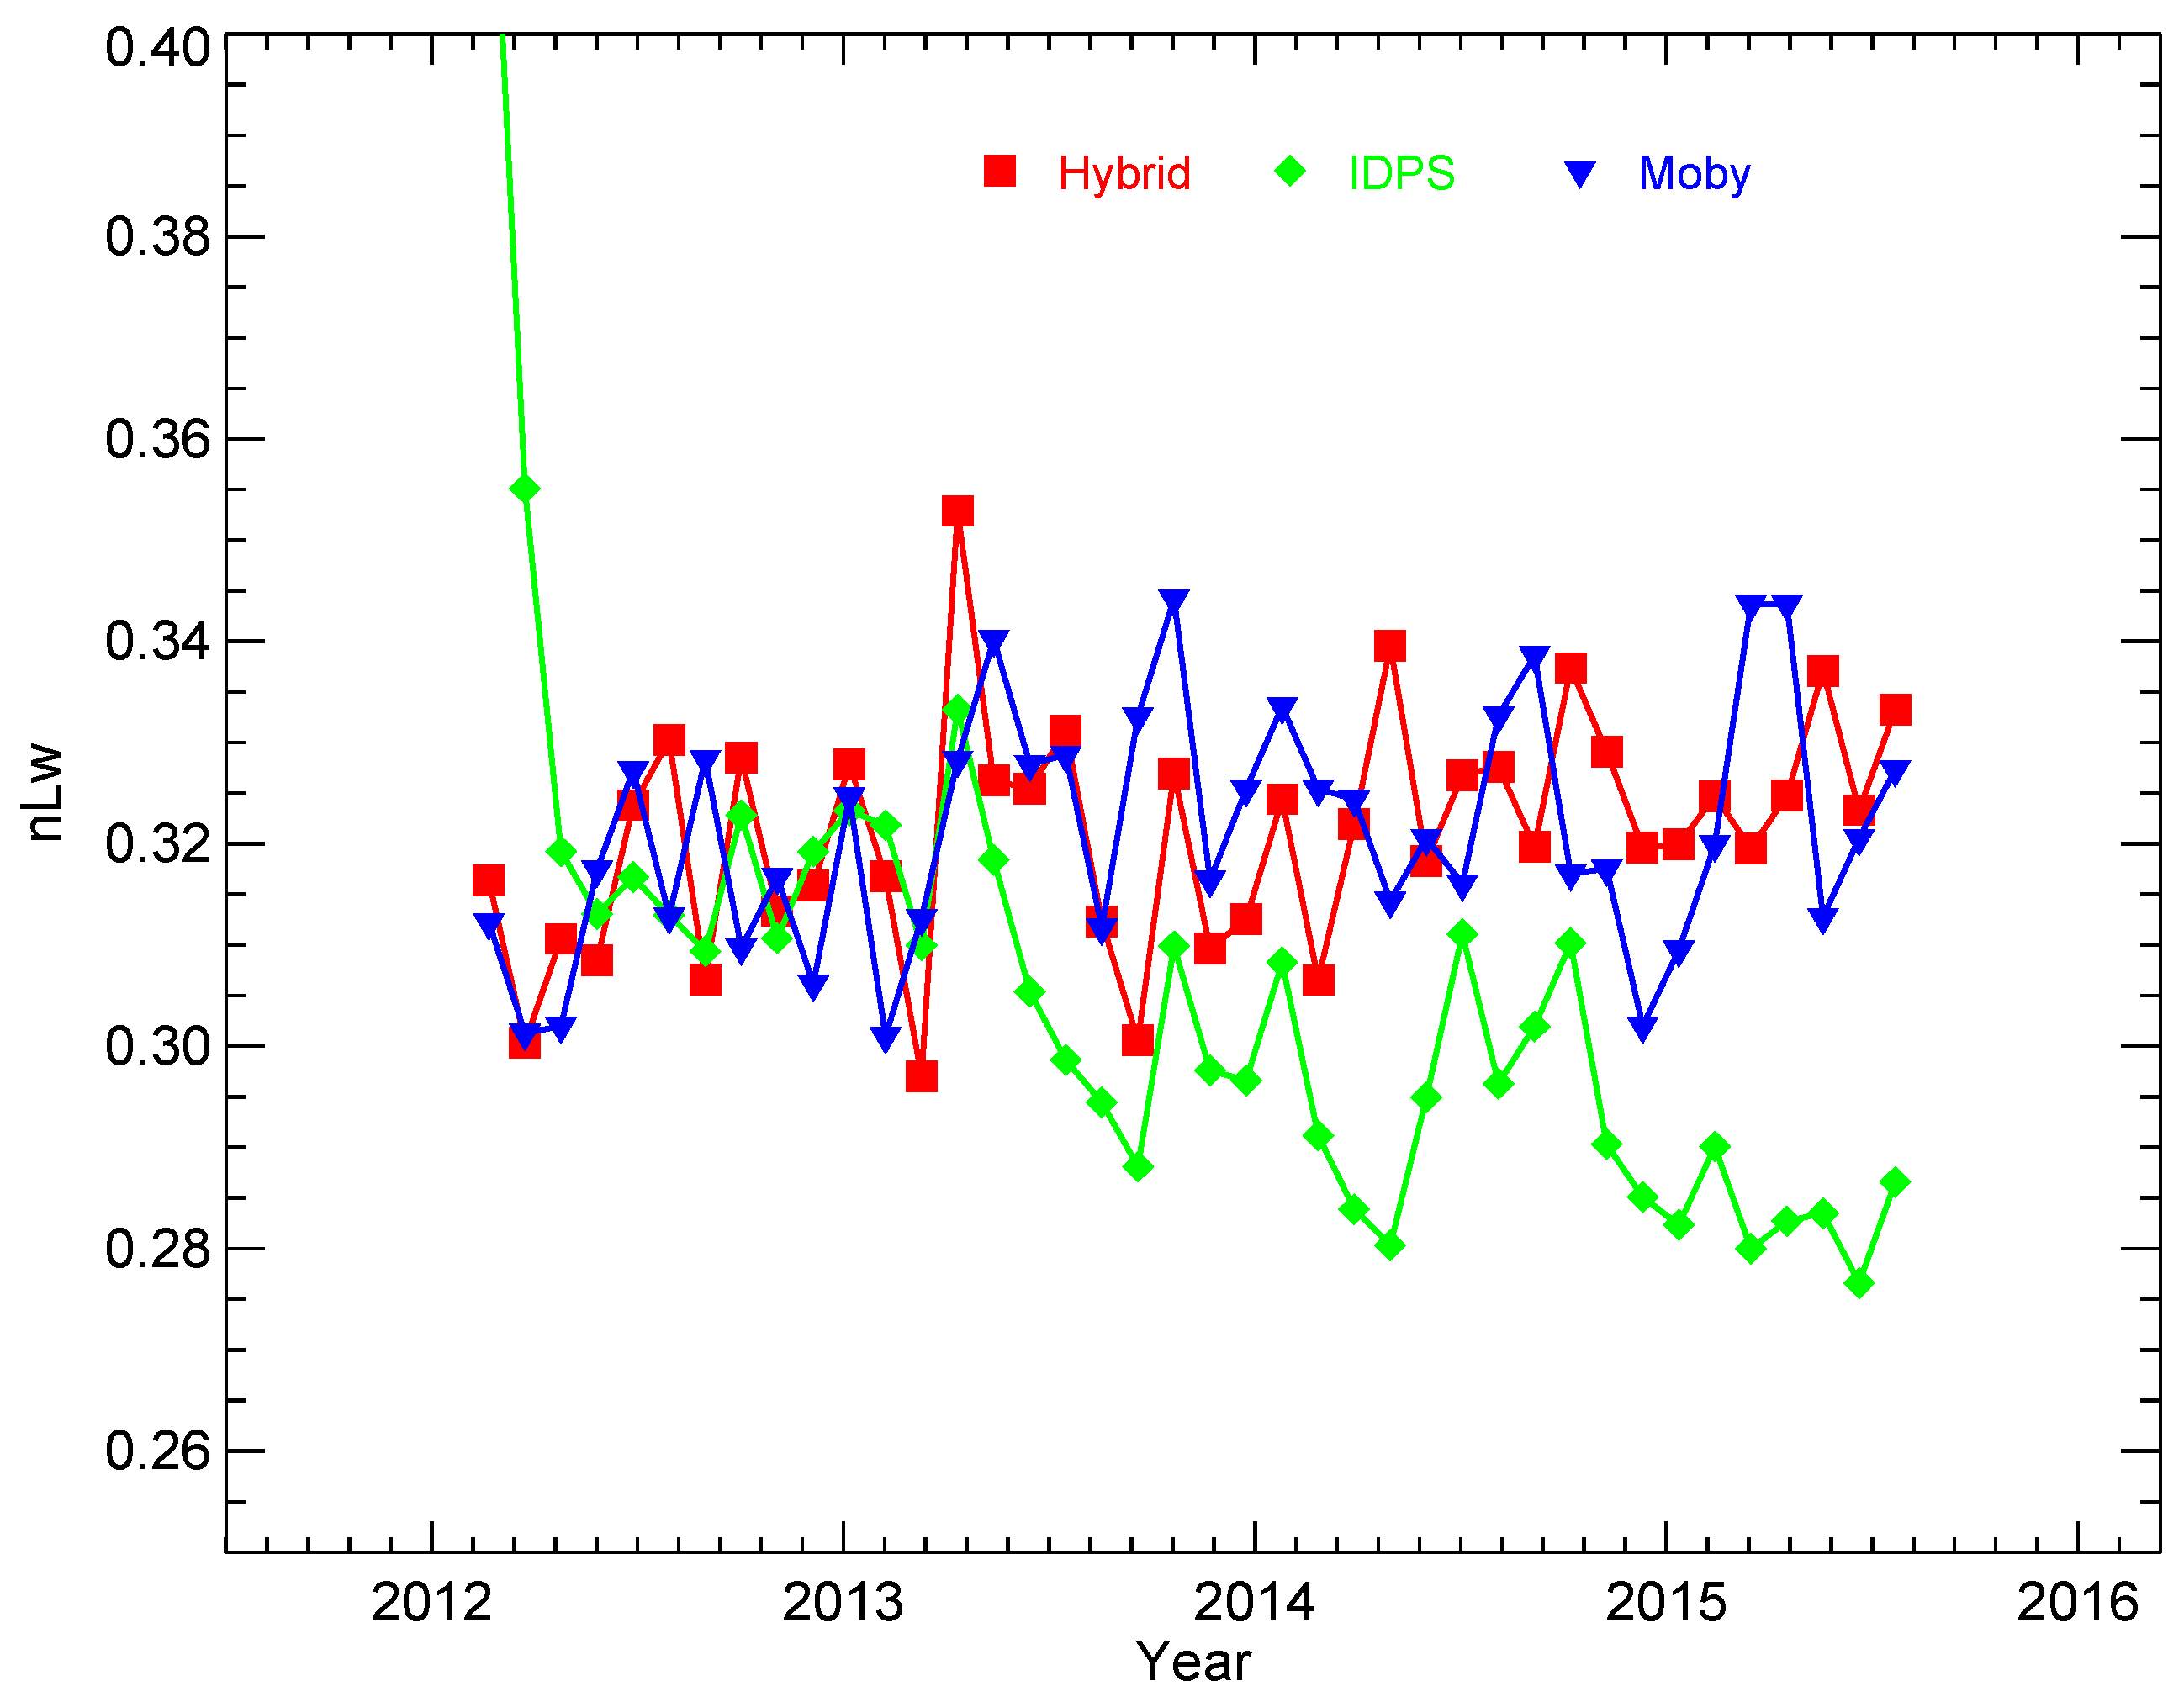
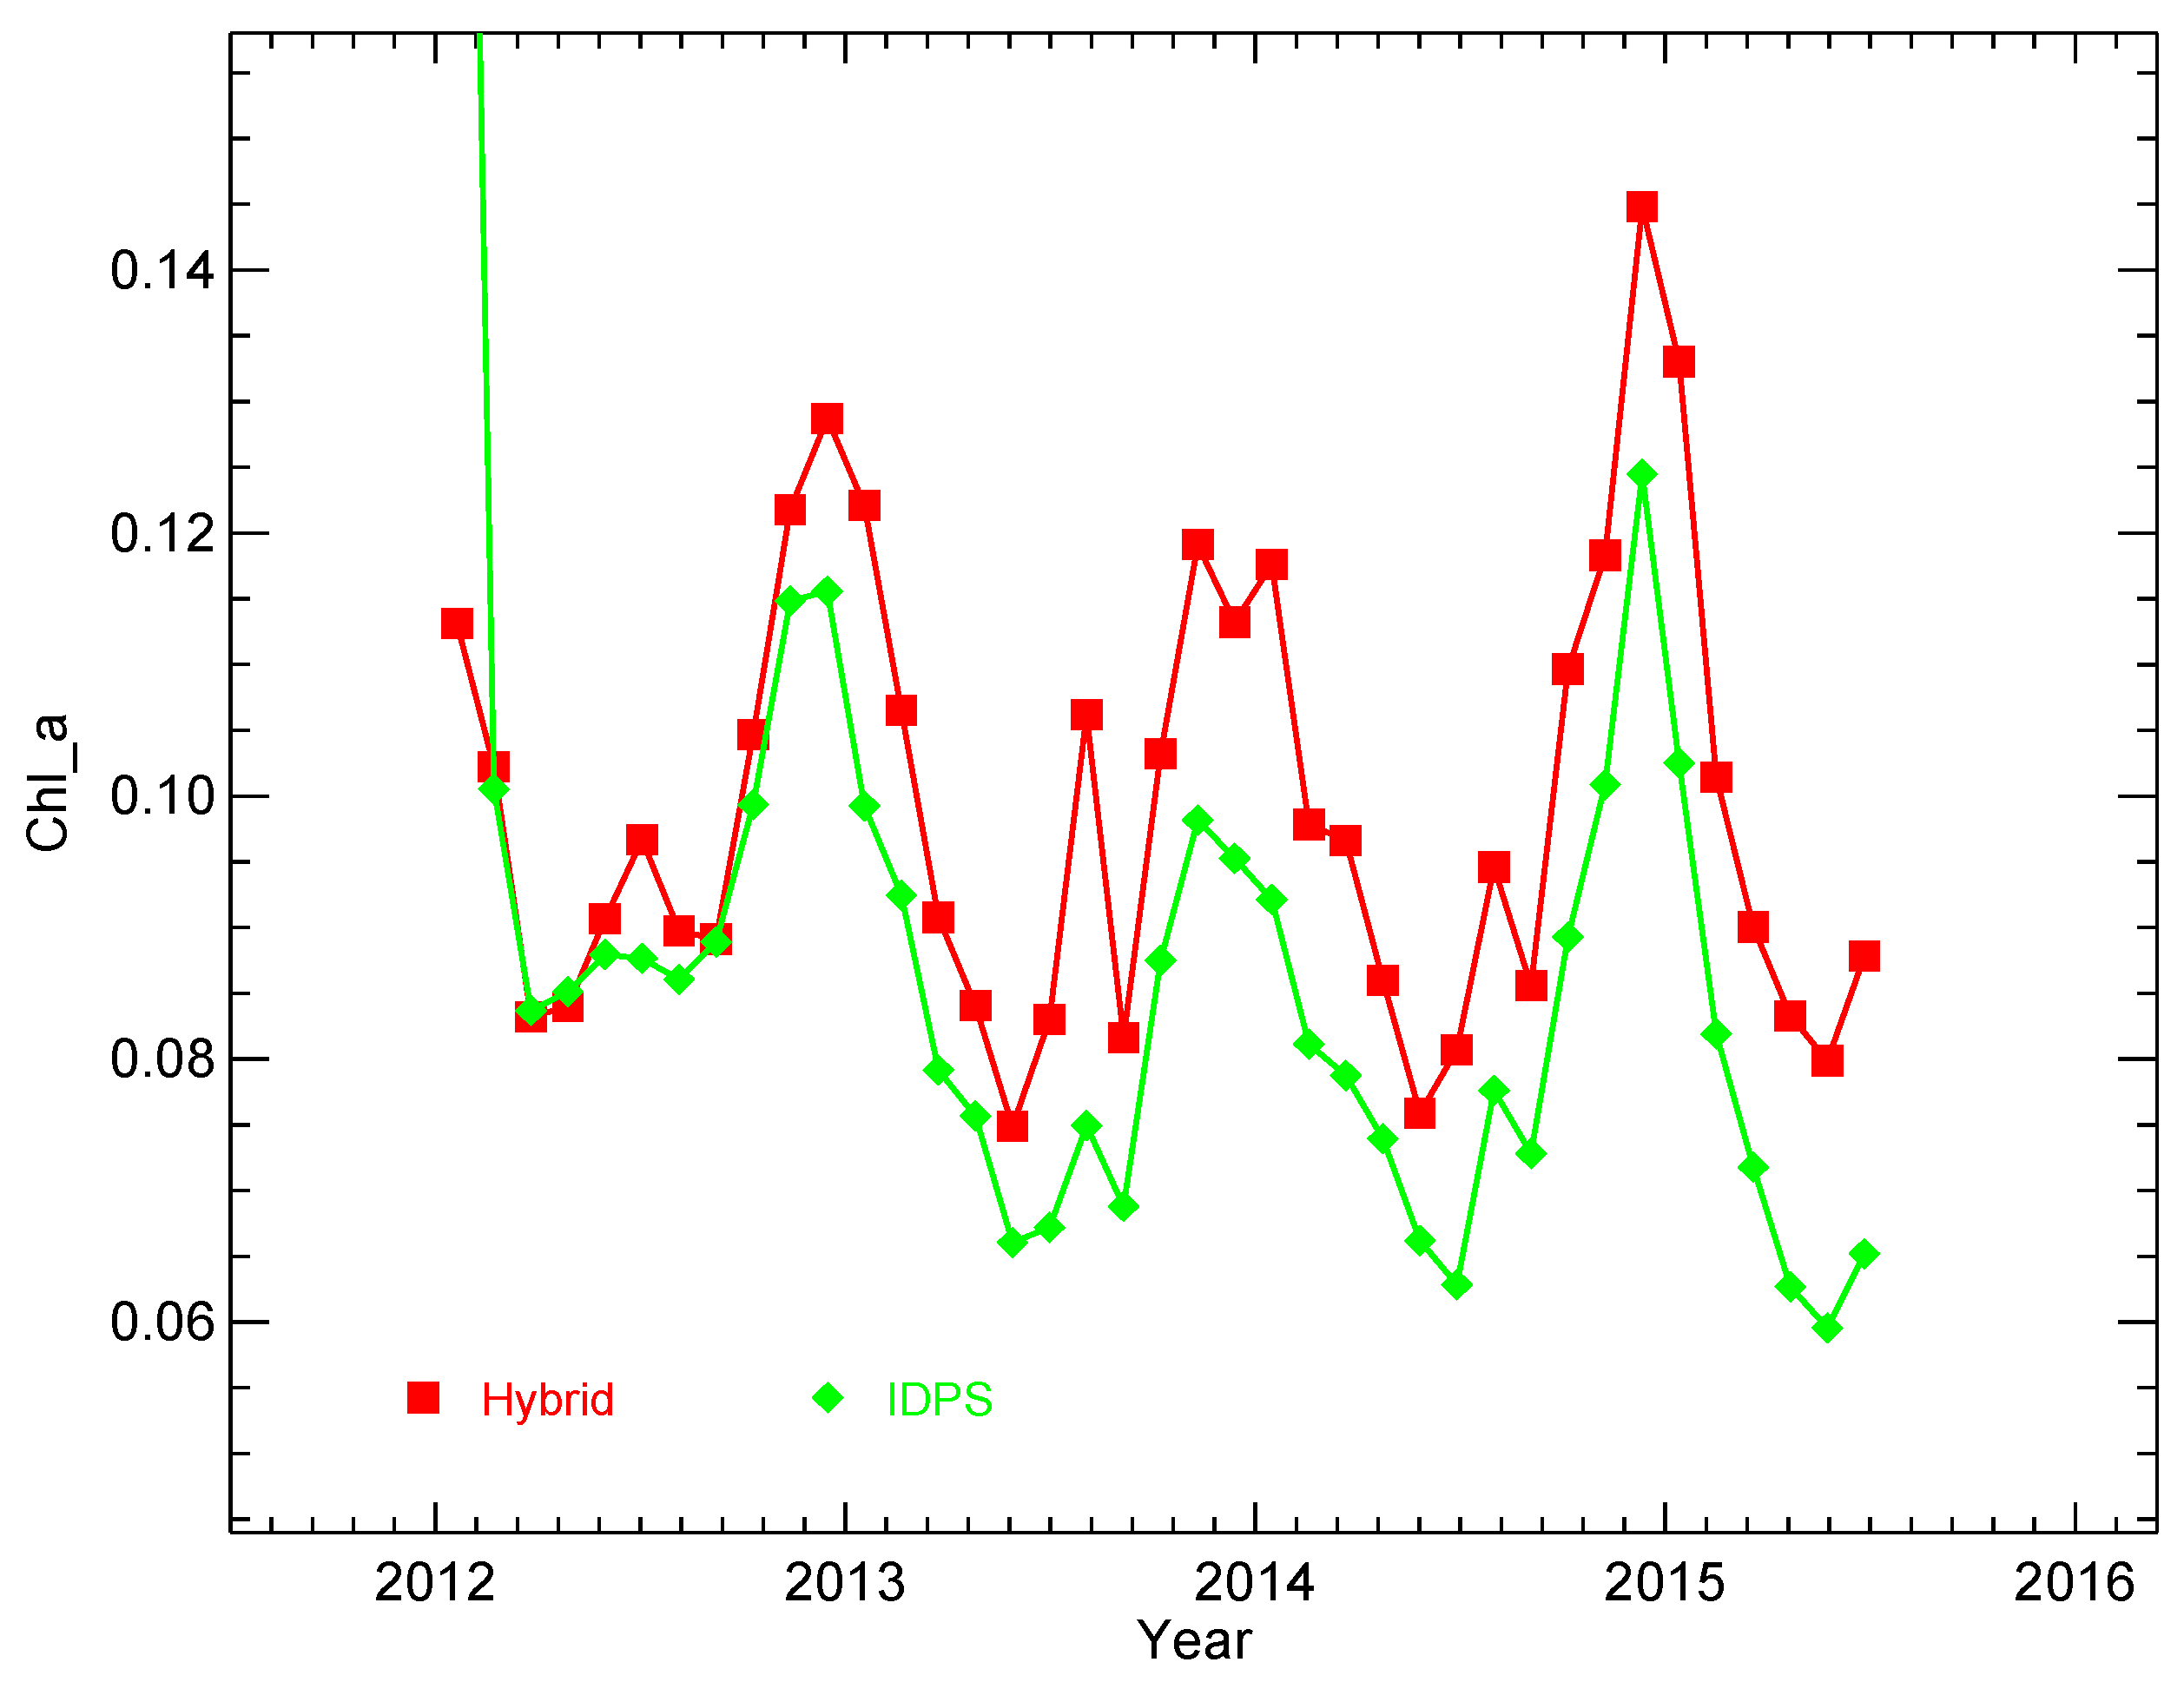
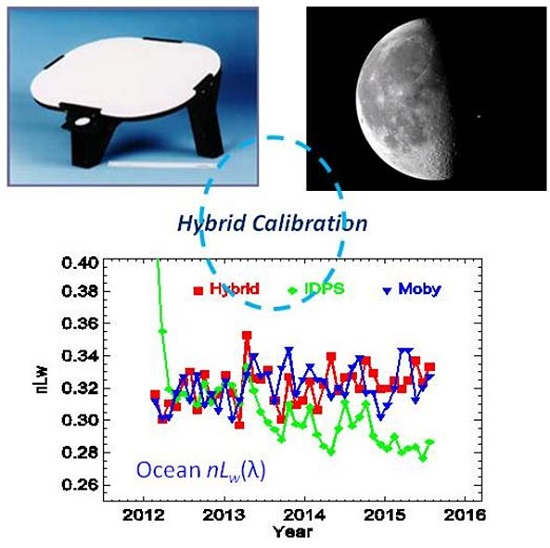
3.3. Hybrid Approach

SD/SDSM or lunar calibration alone has its advantages and disadvantages. Lunar calibration provides more accurate and reliable long-term VIIRS RSB on-orbit gain changes but is less frequent, only about nine times each year, and may have greater measurement uncertainty due to difficulty in accurately correcting the viewing geometry effect on the lunar irradiance. On the other hand, the SD/SDSM calibration can provide VIIRS RSB on-orbit change for each orbit and is smooth and stable in a short time frame, although the derived F-factors demonstrate long-term bias due to the degradation non-uniformity effect [5,8]. A hybrid approach has been proposed and applied to combine the two sets of F-factors by using the lunar F-factors as the long-term baseline and the SD F-factors for short-term gain variation [14].
In the hybrid approach, the ratios of the lunar factors and the SD F-factors for an RSB are calculated first, and then the ratios are fitted to a quadratic form of time. Figure 13 shows the band-averaged ratios of the two sets of F-factors and fitted functions for VIS and NIR bands, where symbols are the measured ratios and solid lines are fitted functions. It is clearly shown that the ratios are band-dependent and increase with time. The non-negligible differences between the SD and lunar F-factors for short wavelength bands are as expected according to the non-uniformity degradation of the SD. It is also noticeable that there are non-negligible differences between the two sets of F-factors for other bands with longer wavelengths. This indicates additional and unknown mechanisms contributing to the differences of the F-factors besides the non-uniformity of the SD degradation. It is also worth noting that the ratios can be approximately classified into two groups, with bands M3, M4, and I1 as one group with larger ratios, and the remaining bands as another. The fitted smooth functions are normalized at the time of the first lunar observation, April 2012, used in this analysis.
The hybrid F-factors are calculated by multiplying the SD F-factors and the quadratic form. The new set of F-factors averts the errors of the SD F-factors caused by the SD degradation non-uniformity effect and other unknown reasons, but keeps the frequency and smoothness of the SD F-factors. Figure 14 displays the band-averaged hybrid F-factors and the SD F-factors. As expected, the hybrid F-factors are larger than the SD F-factors and the differences between the two sets of F-factors increase with time. It is also seen that the differences between the two sets of F-factors for the band M4 are larger than those for the other three bands. This is consistent with the ratios of the lunar and SD F-factors displayed in Figure 14. The hybrid approach is not applied to the time period before April 2012 due to the inaccuracy of the lunar F-factors induced by the partial observations of the lunar surface [10,11].

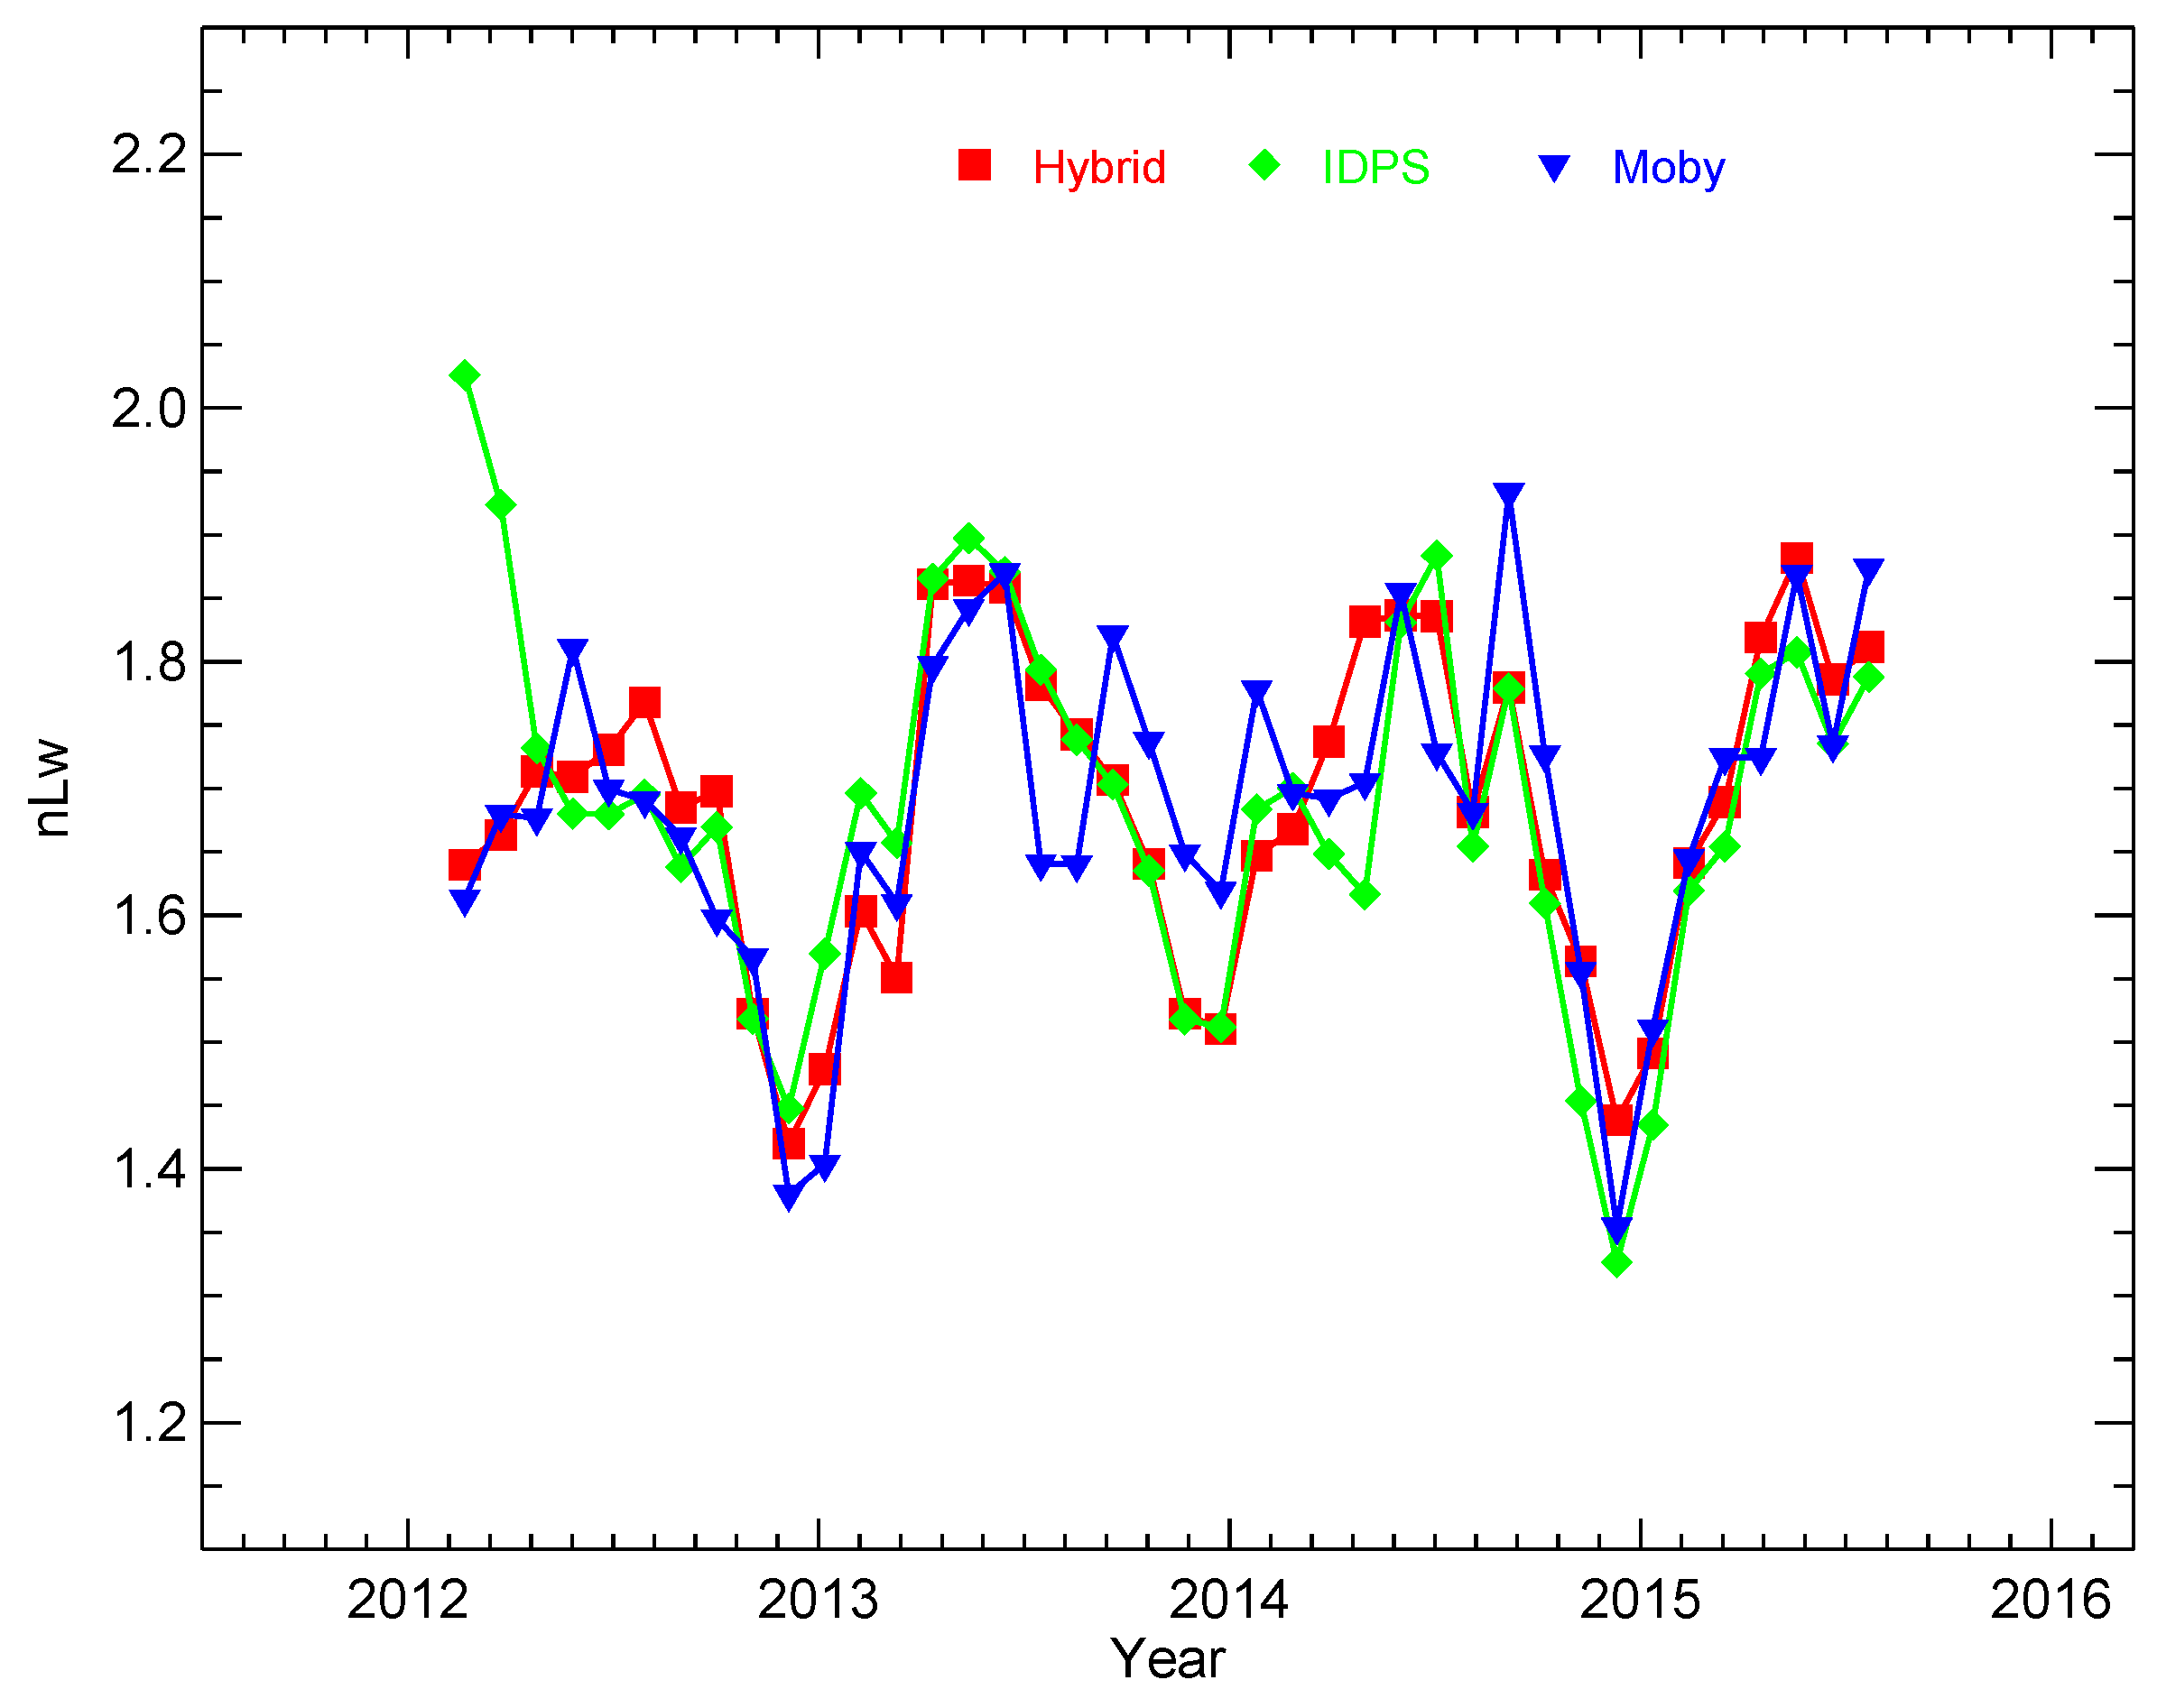
4. Ocean Color EDR Improvements

The main ocean color EDR products are the normalized water-leaving radiance spectra, nLw(λ), which is the radiance that would exit the ocean in the absence of atmosphere and with the Sun at the zenith [20]. It is wavelength-dependent and can be computed for the wavelength of each of the instrument’s ocean bands designed for ocean color applications. From the radiances at the wavelengths of the ocean bands, ocean optical, biological, and biogeochemical properties can be derived. Since the atmosphere and ocean surface radiances contribute about more than 90% in the TOA radiance in the visible wavelength range, water-leaving radiance only contributes about <10% to the TOA [44]. Since the atmosphere and ocean surface contributions to the TOA radiances (i.e., atmospheric correction) are simulated using a theoretical model, all instrument calibration errors are passed on to satellite-derived water-leaving radiance spectra [20,44]. Thus the percentage of the uncertainty in the SDR radiance (or calibration uncertainty) will be amplified approximately by an order of magnitude in the normalized water-leaving radiance (or ocean color EDR products) [20,21,44]. Therefore, the radiometric accuracies of the RSBs are critical to the quality of ocean color products [25]. All other ocean color biological and biogeochemical EDR products are derived from the normalized water-leaving radiance. Chlorophyll-a concentration, Chl-a, is an estimate of the phytoplankton biomass and can be derived from the nLw(λ) at the wavelengths of 443 (or 486) and 551 nm. For VIIRS, they correspond to the center wavelengths of bands M2 (or M3) and M4, respectively.
The NOAA Ocean Color Team has developed a global near real-time VIIRS ocean color data processing system, which automatically downloads global VIIRS RDR (Level-0), SDR (Level-1B), and ancillary data in near real-time, and then processes them into ocean color EDR (Level-2) data [19] using the NOAA Multi-Sensor Level-1 to Level-2 (NOAA-MSL12) software package [44,45,46]. They also routinely generate the global Level-3 binned products (daily, 8-day, monthly, and climatology) for evaluation purposes [25,26]. Using the system, the NOAA Ocean Color Team has been routinely processing and evaluating VIIRS ocean color products from the start of the VIIRS mission using the IDPS SDR products. They have also reprocessed ocean color EDR using the SDR processed with the improved SD F-factors and the hybrid F-factors described in our previous work and also in this analysis. As mentioned previously, they will also routinely process the SDR using the hybrid F-factors and then produce the ocean color science quality EDR with high data quality and accuracy using the improved SDR for forward daily processing, utilizing the previously-mentioned ratio-approach method, which reduces the computational effort by at least two magnitudes [30]. The method can be directly applied in ocean color EDR processing and then the computational effort is further reduced and disk storage space for improved SDR is not needed. In fact, the NOAA Ocean Color Team uses the latter approach for VIIRS ocean color EDR reprocessing and forward daily processing with scientific quality using the hybrid F-factors.
The preliminary evaluation of the reprocessed ocean color EDR using the SDR generated with the hybrid F-factors has been reported in our previous papers [14,26]. The detailed evaluation of the improvements of new hybrid LUTs on ocean color products, as well as improvements of the ocean color algorithms, will be discussed elsewhere. Here we briefly show the improvements of the further updated hybrid F-factors on the VIIRS ocean color products. Figure 15 and Figure 16 show the time series of VIIRS-derived nLw(λ) at wavelengths of 443 nm (M2) and 551 nm (M4), respectively, over the Hawaii region (oligotrophic waters). nLw(λ) spectra derived with the IDPS SDR processed with standard operational F-factors are represented by solid diamonds. The nLw(λ) derived using the SDR reprocessed with our new hybrid F-factors at the two wavelengths are shown by solid squares. The two figures show that nLw(λ) data derived with the IDPS SDR have a large anomaly before 20 April 2012 and a long-term drift for both bands. The newly derived nLw(λ) spectra with hybrid F-factors are much improved and the long-term drifts are significantly reduced. This is also true for 412 nm (M1) and 488 nm (M3). The trend from the Marine Optical Buoy (MOBY) data, the direct in situ measurements of nLw(λ) using a system of buoys [47,48], are also shown in Figure 15 and Figure 16 (in solid triangles). The comparison with the MOBY result further confirms that the SDR using hybrid F-factors significantly elevates the accuracy of the ocean color products. Figure 17 shows VIIRS Chl-a derived from the newly reprocessed SDR with the hybrid F-factors and IDPS SDR in the same region. Chl-a data based on IDPS SDR (solid diamonds) show a clear long-term drift of about 15%, while the new Chl-a results show a clearly reduced long-term trend (solid squares). It is worth mentioning that there is a large spike in the Chl-a shown in Figure 17 at the end of 2014. The spike is mainly due to the big dip of the nLw(λ) at wavelengths of 443 nm (M2) shown in Figure 15 at the same time. The dip was observed by both SNPP VIIRS B2 and the MOBY and therefore it is a real feature of the nLw(λ). This indicates that the aforementioned spike in Figure 17 is the actual performance of the Chl-a.

5. Summary

We have made a significant progress in the calibration of the SNPP VIIRS RSB. All key components in the calibration pipeline have been carefully examined and robustly characterized. This includes the VFs, the BRF, the H-factors, and the F-factors. The newly built hybrid F-factors that incorporate lunar-based calibration results, motivated by the failure of the standard methodology sourced to the effect of the SD degradation non-uniformity, is now the de facto standard. The results are clean, robust, without previously observed artifacts such as seasonal variations, and achieve an accuracy level estimated at ~0.2% and better. The ocean color products, which are sensitively dependent on RSB calibration, demonstrate significant improvement. These investigative efforts have shown that, with proper treatment of the physical or optical effects, such as the SD degradation non-uniformity, in the calibration methodology, the SNPP VIIRS is a splendid instrument functioning as well as can be expected in its first four years on orbit.

Acknowledgments

The work was supported by the Joint Polar Satellite System (JPSS) funding. We thank the MOBY team for providing the in situ data. The views, opinions, and findings contained in this paper are those of the authors and should not be construed as an official NOAA or U.S. Government position, policy, or decision.

Author Contributions

Junqiang Sun is the chief investigator of this topic and is fully responsible for the formulation, technical advancement, and all materials presented in this work. Menghua Wang lead the NOAA VIIRS ocean color effort, provided technical direction and guidance for VIIRS ocean color products, and supported this work.

Conflicts of Interest

The authors declare no conflict of interest.

References

  1. Cao, C.; Deluccia, F.; Xiong, X.; Wolfe, R.; Weng, F. Early on-orbit performance of the Visible Infrared Imaging Radiometer Suite (VIIRS) onboard the Suomi National Polar-orbiting Partnership (S-NPP) satellite. IEEE Trans. Geosci. Remote Sens. 2014, 52, 1142–1156. [Google Scholar] [CrossRef]
  2. Xiong, X.; Butler, J.; Chiang, K.; Efremova, B.; Fulbright, J.; Lei, N.; McIntire, J.; Oudrari, H.; Sun, J.; Wang, Z.; et al. VIIRS on-orbit calibration methodology and performance. J. Geophys. Res. Atmos. 2014, 119, 5065–5078. [Google Scholar] [CrossRef]
  3. Lei, N.; Wang, Z.; Fulbright, J.; Lee, S.; McIntire, J.; Chiang, K.; Xiong, X. Initial on-orbit radiometric calibration of the Suomi NPP VIIRS reflective solar bands. Proc. SPIE 2012, 8510. [Google Scholar] [CrossRef]
  4. Cardema, J.C.; Rausch, K.; Lei, N.; Moyer, D.I.; DeLuccia, F. Operational calibration of VIIRS reflective solar band sensor data records. Proc. SPIE 2012, 8510, 851019. [Google Scholar]
  5. Sun, J.; Wang, M. On-orbit calibration of the Visible Infrared Imaging Radiometer Suite reflective solar bands and its challenges using a solar diffuser. Appl. Opt. 2015, 54, 7210–7223. [Google Scholar] [CrossRef] [PubMed]
  6. Hass, E.; Moyer, D.; DeLuccia, F.; Rausch, K.; Fulbright, J. VIIRS solar diffuser bidirectional reflectance distribution function (BRDF) degradation factor operational trending and update. Proc. SPIE 2012, 8510, 851016. [Google Scholar]
  7. Fulbright, J.; Lei, N.K.; Chiang, K.; Xiong, X. Characterization and performance of the Suomi-NPP VIIRS solar diffuser stability monitor. Proc. SPIE 2012, 8510, 851015. [Google Scholar]
  8. Sun, J.; Wang, M. Visible infrared image radiometer suite solar diffuser calibration and its challenges using solar diffuser stability monitor. Appl. Opt. 2014, 36, 8571–8584. [Google Scholar] [CrossRef] [PubMed]
  9. Sun, J.; Xiong, X. Solar and lunar observation planning for Earth-observing sensor. Proc. SPIE 2011, 8176, 817610. [Google Scholar]
  10. Sun, J.; Xiong, X.; Butler, J. NPP VIIRS on-orbit calibration and characterization using the Moon. Proc. SPIE 2012, 8510, 85101I. [Google Scholar]
  11. Xiong, X.; Sun, J.; Fulbright, J.; Z. Wang, Z.; Butler, J. Lunar Calibration and Performance for S-NPP VIIRS Reflective Solar Bands. IEEE Trans. Geosci. Remote Sens. 2016. [Google Scholar] [CrossRef]
  12. Eplee, R.E., Jr.; Turpie, K.R.; Meister, G.; Patt, F.S.; Franz, B.A.; Bailey, S.W. On-orbit calibration of the Suomi National Polar-Orbiting Partnership Visible Infrared Imaging Radiometer Suite for ocean color applications. Appl. Opt. 2015, 54, 1984–2006. [Google Scholar] [CrossRef] [PubMed]
  13. Baker, N. Joint Polar Satellite System (JPSS) VIIRS Radiometric Calibration Algorithm Theoretical Basis Document (ATBD); Goddard Space Flight Center: Greenbelt, MA, USA, 2013. [Google Scholar]
  14. Sun, J.; Wang, M. Radiometric Calibration of the Visible Infrared Imaging Radiometer Suite Reflective Solar Bands with Robust Characterizations and Hybrid Calibration Coefficients. Appl. Opt. 2015, 54, 9331–9342. [Google Scholar] [CrossRef] [PubMed]
  15. McIntire, J.; Moyer, D.; Efremova, B.; Oudrari, H.; Xiong, X. On-Orbit Characterization of S-NPP VIIRS Transmission Functions. IEEE Trans. Geosci. Remote Sens. 2015, 53, 2354–2365. [Google Scholar] [CrossRef]
  16. Sun, J.; Wang, M. On-orbit characterization of the VIIRS solar diffuser and solar diffuser screen. Appl. Opt. 2015, 54, 236–252. [Google Scholar] [CrossRef] [PubMed]
  17. Kieffer, H.H. Photometric Stability of the Lunar Surface. Icarus 1997, 130, 323–327. [Google Scholar] [CrossRef]
  18. Kieffer, H.H.; Stone, T.C. The Spectral Irradiance of the Moon. Astronom. J. 2005, 129, 2887–2901. [Google Scholar] [CrossRef]
  19. Sun, J.; Wang, M. VIIRS Reflective Solar Bands On-Orbit Calibration and Performance: A Three-Year Update. Proc. SPIE 2014, 9264, 92640L. [Google Scholar]
  20. Gordon, H.R.; Wang, M. Retrieval of water-leaving radiance and aerosol optical thickness over the oceans with SeaWiFS: A Preliminary Algorithm. Appl. Opt. 1994, 33, 443–452. [Google Scholar] [CrossRef] [PubMed]
  21. Wang, M. Remote sensing of the ocean contributions from ultraviolet to near-infrared using the shortwave infrared bands: Simulations. Appl. Opt. 2007, 46, 1535–1547. [Google Scholar] [CrossRef] [PubMed]
  22. Wang, M.; Shi, W. The NIR-SWIR combined atmospheric correction approach for MODIS ocean color data processing. Opt. Express 2007, 15, 15722–15733. [Google Scholar] [CrossRef] [PubMed]
  23. Wang, M.; Tang, J.; Shi, W. MODIS-derived ocean color products along the China east coastal region. Geophys. Res. Lett. 2007, 34, L06611. [Google Scholar] [CrossRef]
  24. Wang, M.; Shi, W.; Tang, J. Water property monitoring and assessment for China’s inland Lake Taihu from MODIS-Aqua measurements. Remote Sens. Environ. 2011, 115, 841–845. [Google Scholar] [CrossRef]
  25. Wang, M.; Liu, X.; Tan, L.; Jiang, L.; Son, S.; Shi, W.; Rausch, K.; Voss, K. Impact of VIIRS SDR performance on ocean color products. J. Geophys. Res. Atmos. 2013, 118, 10347–10360. [Google Scholar] [CrossRef]
  26. Wang, M.; Liu, X.; Jiang, L.; Son, S.; Sun, J.; Shi, W.; Tan, L.; Naik, P.; Mikelsons, K.; Wang, X.; Lance, V. Evaluation of VIIRS ocean color products. Proc. SPIE 2014, 9261, 92610E. [Google Scholar]
  27. Xiong, X.; Sun, J.; Barnes, W.; Salomonson, V.; Esposito, J.; Erives, H.; Guenther, B. Multiyear on-orbit calibration and performance of Terra MODIS reflective solar bands. IEEE Trans. Geosci. Remote Sens. 2007, 45, 879–889. [Google Scholar] [CrossRef]
  28. Xiong, X.; Sun, J.; Xie, X.; Barnes, W.L.; Salomonson, V.V. On-orbit calibration and performance of Aqua MODIS reflective solar bands. IEEE Trans. Geosci. Remote Sens. 2010, 48, 535–545. [Google Scholar] [CrossRef]
  29. Oudrari, H.; McIntire, J.; Xiong, X.; Butler, J.; Lee, S.; Lei, N.; Schwarting, T.; Sun, J. Prelaunch radiometric characterization and calibration of THE S-NPP VIIRS sensor. IEEE Trans. Geosci. Remote Sens. 2015, 53, 2195–2210. [Google Scholar] [CrossRef]
  30. Sun, J.; Wang, M.; Tan, L.; Jiang, L. An Efficient Approach for VIIRS RDR to SDR Data Processing. IEEE. Trans. Geosci. Remote Sens. Lett. 2014, 11, 2037–2041. [Google Scholar]
  31. Sun, J.; Xiong, X.; Angal, A.; Chen, H.; Wu, A.; Geng, X. Time dependent response versus scan angle for MODIS reflective solar bands. IEEE Trans. Geosci. Remote Sens. 2014, 52, 3159–3174. [Google Scholar] [CrossRef]
  32. Lessel, K.; McClain, S. Low uncertainty measurements of bidirectional reflectance factor on the NPOESS/VIIRS solar diffuser. Proc. SPIE 2007, 6677, 66771O. [Google Scholar]
  33. JPSS. Joint Polar Satellite System (JPSS) VIIRS Reflective Solar Bands—Performance Verification Report (PVR); NASA Goddard Space Flight Center: Greenbelt, MD, USA, 2011. [Google Scholar]
  34. Lei, N.; Xiong, X. Determination of the SNPP VIIRS solar diffuser BRDF degradation factor over wavelengths longer than 1 µm. Proc. SPIE 2015, 9607, 96071W. [Google Scholar]
  35. Xiong, X.; Angal, A.; Fulbright, J.; Lei, N.; Mu, Q.; Wang, Z.; Wu, A. Calibration improvements for MODIS and VIIRS SWIR spectral bands. Proc. SPIE 2015, 9607, 96071Z. [Google Scholar]
  36. Lei, N.; Guenther, B.; Wang, Z.; Xiong, X. Modeling SNPP VIIRS reflective solar bands optical throughput degradation and its impacts on the relative spectral response. Proc. SPIE 2013, 8866, 88661H. [Google Scholar]
  37. De Luccia, F.; Moyer, D.; Johnson, E.; Rausch, K.; Lei, N.; Chiang, K.; Xiong, X.; Fulbright, J.; Haas, E.; Iona, G. Discovery and characterization of on-orbit degradation of the Visible Infrared Imaging Radiometer Suite (VIIRS) Rotating Telescope Assembly (RTA). Proc. SPIE 2012, 8510, 85101A. [Google Scholar]
  38. Barrie, J.D.; Fugua, P.D.; Meshishnek, M.J.; Ciofalo, M.R.; Chu, C.T.; Chaney, J.A.; Moision, R.M.; Graziani, L. Root cause determination of on-orbit degradation of the VIIRS rotating telescope assembly. Proc. SPIE 2012, 8510, 8510B. [Google Scholar]
  39. Iona, G.; Butler, J.; Guenther, B.; Graziani, L.; Johnson, E.; Kenedy, B.; Kent, C.; Lambeck, R.; Waluschka, E.; Xiong, X. VIIRS on-orbit optical anomaly—Investigation, analysis, root cause determination and lessons learned. Proc. SPIE 2014, 8510, 85101C. [Google Scholar]
  40. Sun, J. Sigma Space Corporation: Lanham, MD, USA, Unpublished; 2010.
  41. Stone, T.C.; Kieffer, H.H. Assessment of Uncertainty in ROLO Lunar Irradiance for On-orbit Calibration. Proc. SPIE 2004, 5542, 300–310. [Google Scholar]
  42. Sun, J.; Xiong, X.; Barnes, W.L.; Guenther, B. MODIS Reflective Solar Bands On-Orbit Lunar Calibration. IEEE Trans. Geosci. Remote Sens. 2007, 43, 2383–2393. [Google Scholar] [CrossRef]
  43. Barnes, R.A.; Eplee, R.E., Jr.; Patt, F.S.; McClain, C.R. Changes in the radiometric stability of SeaWiFS determined from lunar and solar measurements. Appl. Opt. 1999, 38, 4649–4664. [Google Scholar] [CrossRef] [PubMed]
  44. Wang, M. A sensitivity study of SeaWiFS atmospheric correction algorithm: Effects of Spectral Band Variations. Remote Sens. Environ. 1999, 67, 348–359. [Google Scholar] [CrossRef]
  45. Wang, M.; Franz, B.A. Comparing the ocean color measurements between MOS and SeaWiFS: A Vicarious Intercalibration Approach for MOS. IEEE Trans. Geosci. Remote Sens. 2000, 38, 184–197. [Google Scholar] [CrossRef]
  46. Wang, M.; Isaacman, A.; Franz, A.B.; McClain, C.R. Ocean color optical property data derived from the Japanese Ocean Color and Temperature Scanner and the French Polarization and Directionality of the Earth’s Reflectances: A Comparison Study. Appl. Opt. 2002, 41, 974–990. [Google Scholar] [CrossRef] [PubMed]
  47. Clark, D.; Gordon, H.; Voss, K.; Broenkow, W.; Trees, C. Validation of atmospheric correction over the oceans. J. Geophys. Res. 1997, 102, 17209–17217. [Google Scholar] [CrossRef]
  48. Clark, D.; Yarbrough, M.; Feinholz, M.; Flora, S.; Broenkow, W.; Kim, Y.S.; Johnson, B.C.; Brown, S.W.; Yuen, M.; Mueller, J.W. MOBY, A Radiometric Buoy for Performance Monitoring and Vicarious Calibration of Satellite Ocean Color Sensors: Measurement and Data Analysis Protocols. In Ocean. Optics Protocols for Satellite Ocean Color Sensor Validation; Mueller, J., Fargion, G., McClain, C., Eds.; National Aeronautics and Space Administration Goddard Space Flight Center: Greenbelt, MD, USA, 2003; pp. 3–34. [Google Scholar]
Figure 1. VIIRS instrument and its on-board calibrators.
Remotesensing 08 00194 g001
Figure 2. Scan angles of VIIRS view sectors and their corresponding AOIs on the HAM.
Remotesensing 08 00194 g002
Figure 3. Schematic diagram for SD/SDSM calibration.
Remotesensing 08 00194 g003
Figure 4. SNPP VIIRS solar-azimuth angle. The vertical line indicates the yaw maneuvers.
Remotesensing 08 00194 g004
Figure 5. SD degradation derived from the SDSM measurements.
Remotesensing 08 00194 g005
Figure 6. VIIRS band M1 HAM 1 HG SD F-factors.
Remotesensing 08 00194 g006
Figure 7. VIIRS band M4 HAM 1 HG SD F-factors.
Remotesensing 08 00194 g007
Figure 8. VIIRS band M1 detector-averaged SD F-factors.
Remotesensing 08 00194 g008
Figure 9. VIIRS RSB HAM 1 HG detector-averaged SD F-factors.
Remotesensing 08 00194 g009
Figure 10. VIIRS RSB calibration coefficients mirror side ratios.
Remotesensing 08 00194 g010
Figure 11. SNPP VIIRS RSB SD F-factors (lines) and lunar F-factors (symbols).
Remotesensing 08 00194 g011
Figure 12. SNPP VIIRS RSB SD F-factors (lines) and lunar F-factors (symbols).
Remotesensing 08 00194 g012
Figure 13. Ratios of lunar F-factors over SD F-factors.
Remotesensing 08 00194 g013
Figure 14. Band-averaged hybrid F-factors (symbols) and band-averaged SD F-factors (lines).
Remotesensing 08 00194 g014
Figure 15. Ocean nLw(λ) trending for the band M2 along with MOBY in situ data.
Remotesensing 08 00194 g015
Figure 16. Ocean nLw(λ) trending for the band M4 along with MOBY in situ data.
Remotesensing 08 00194 g016
Figure 17. Ocean Chl-a trending.
Remotesensing 08 00194 g017
Table 1. VIIRS RSB and SDSM Specification.
SDSMVIIRS RSB
DetectorCW (nm)BandCW (nm)BW(nm)Gain
D1412M141020DG
D2450M244318DG
D3488M348620DG
D4555M455120DG
NANAI164080SG
D5672M567120DG
D6746M674515SG
D7865M786239DG
D7865I286239SG
D8935NANANANA
NANAM8123820SG
NANAM9137815SG
NANAM10161060SG
NANAI3161060SG
NANAM11225050SG
CW: Center Wavelength; BW: Bandwidth; DG: Dual Gain; SG: Single Gain.

