
A 3D Shape Descriptor Based on Contour Clusters for Damaged Roof Detection Using Airborne LiDAR Point Clouds

 , ,
, ,
Abstract
:
1. Introduction
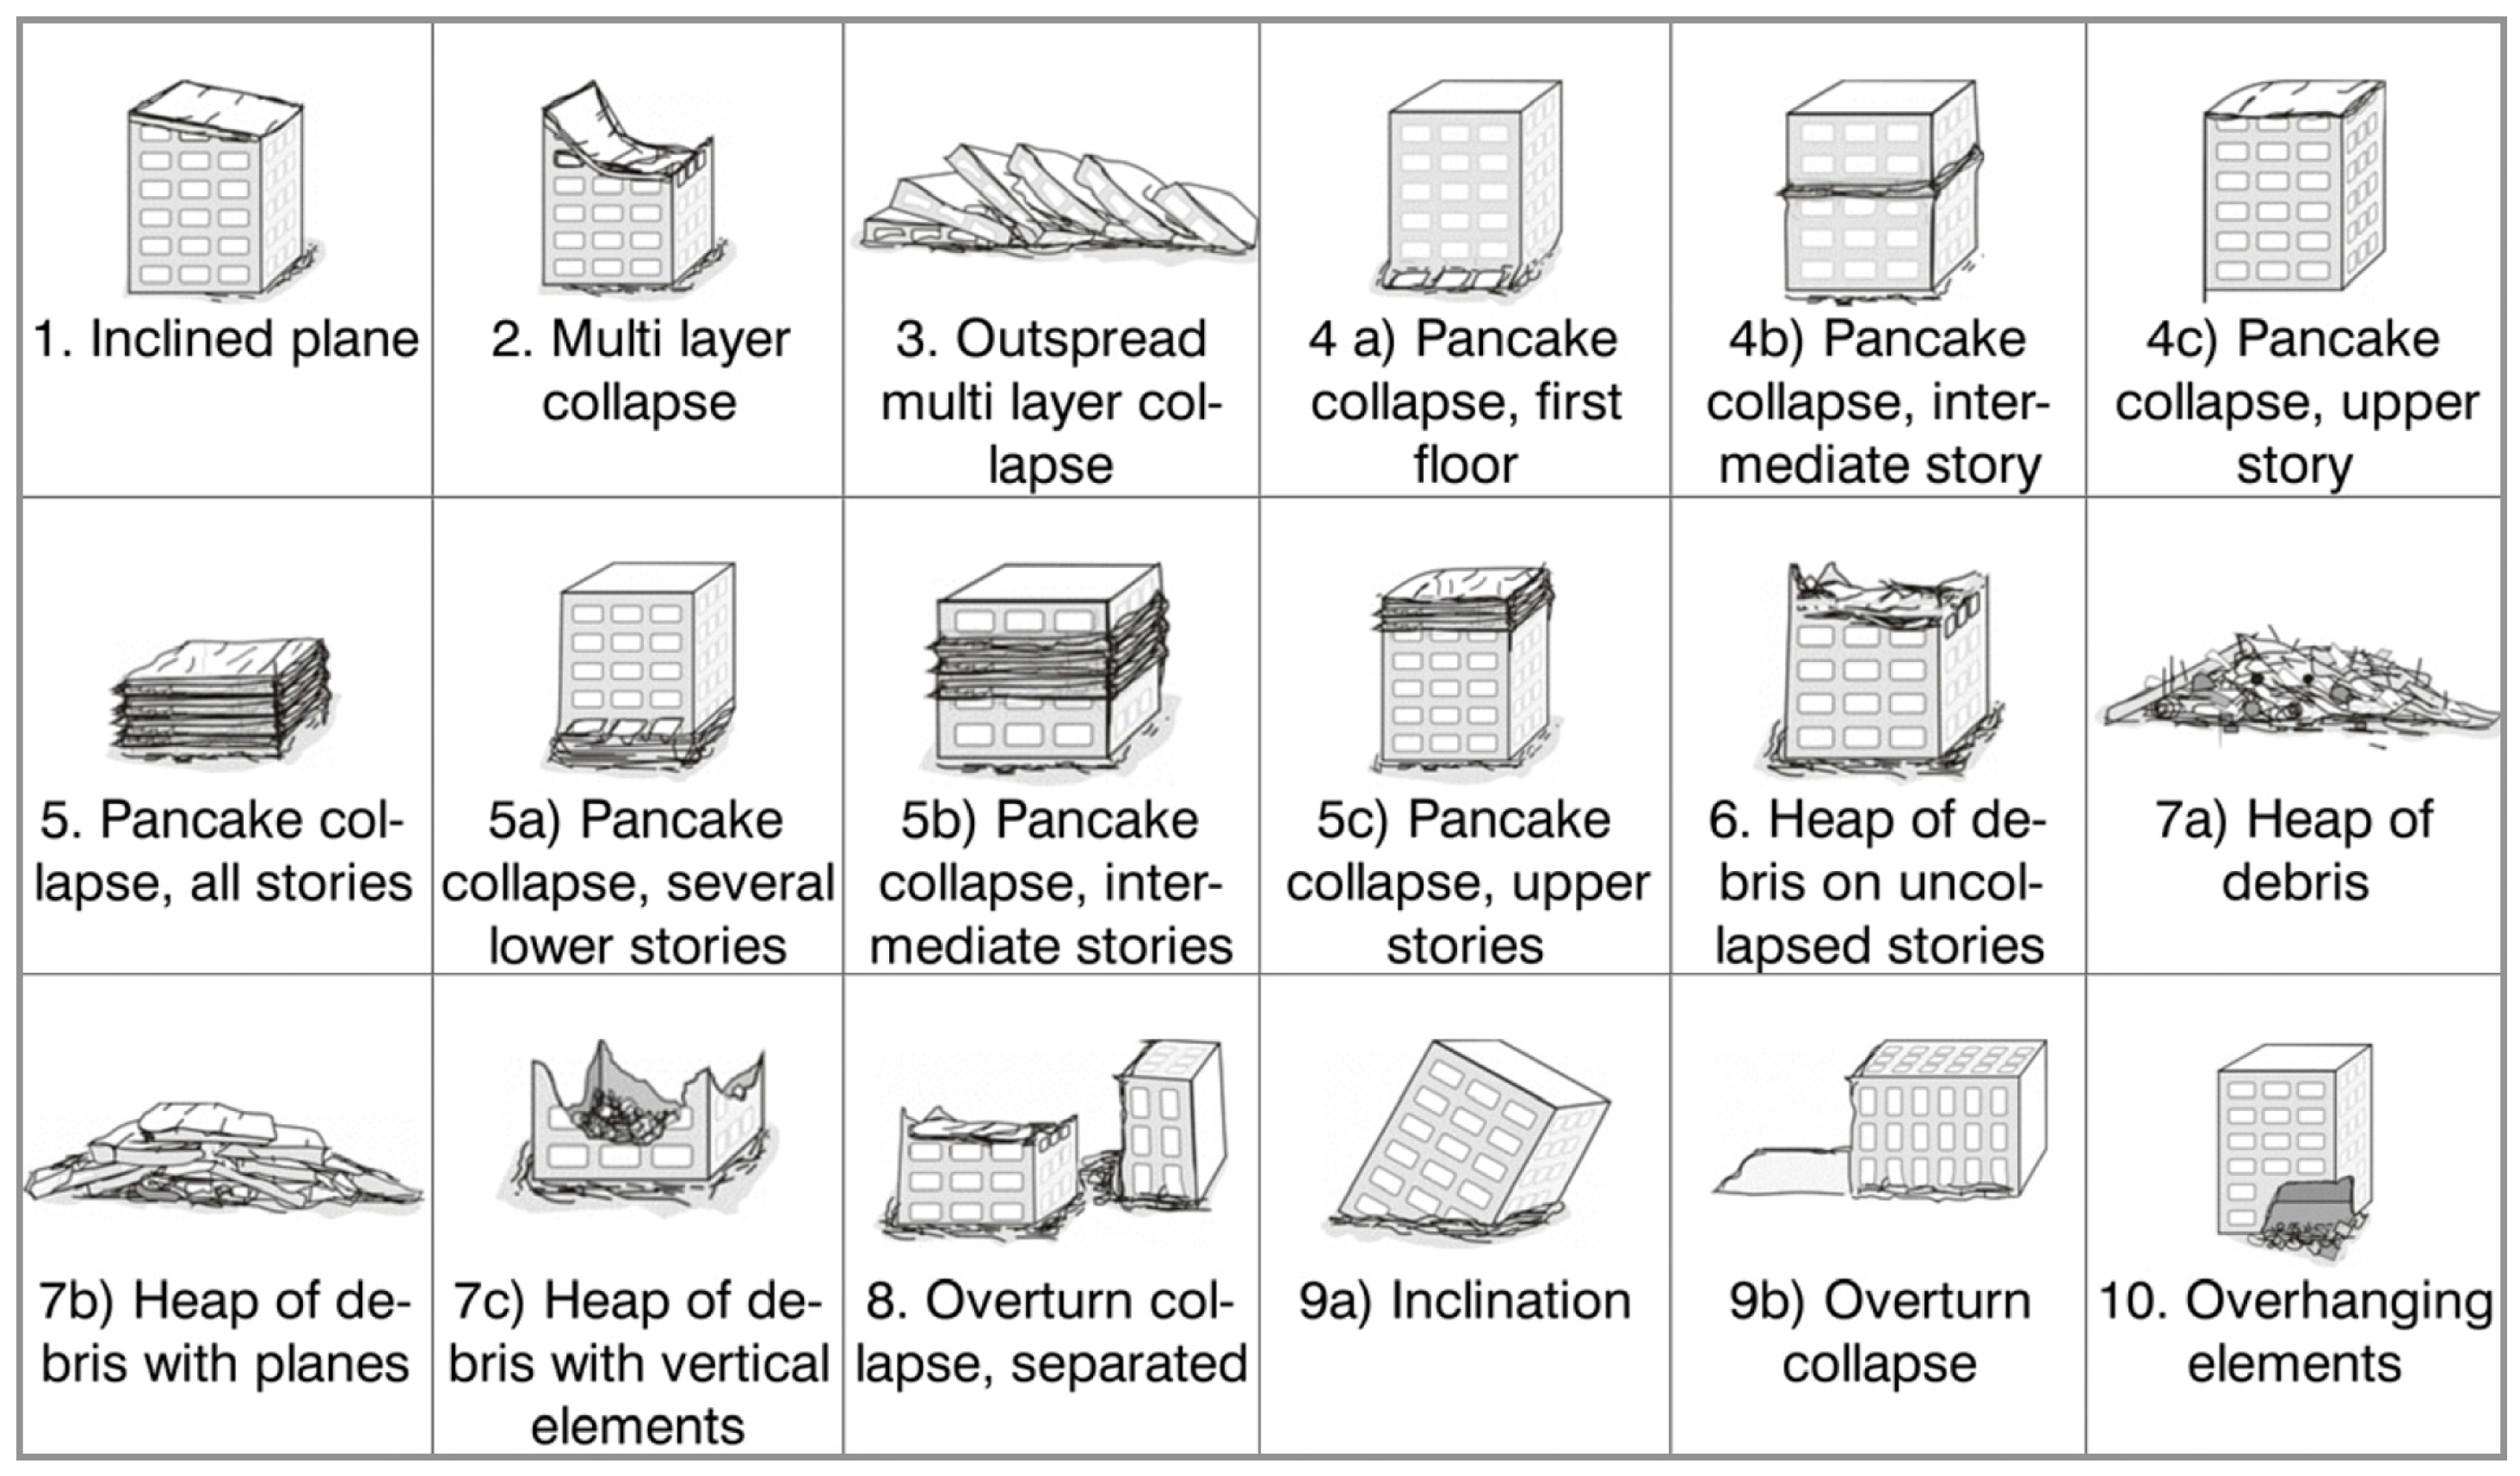
1.1. Damage Types
1.2. Building Damage Detection Approaches
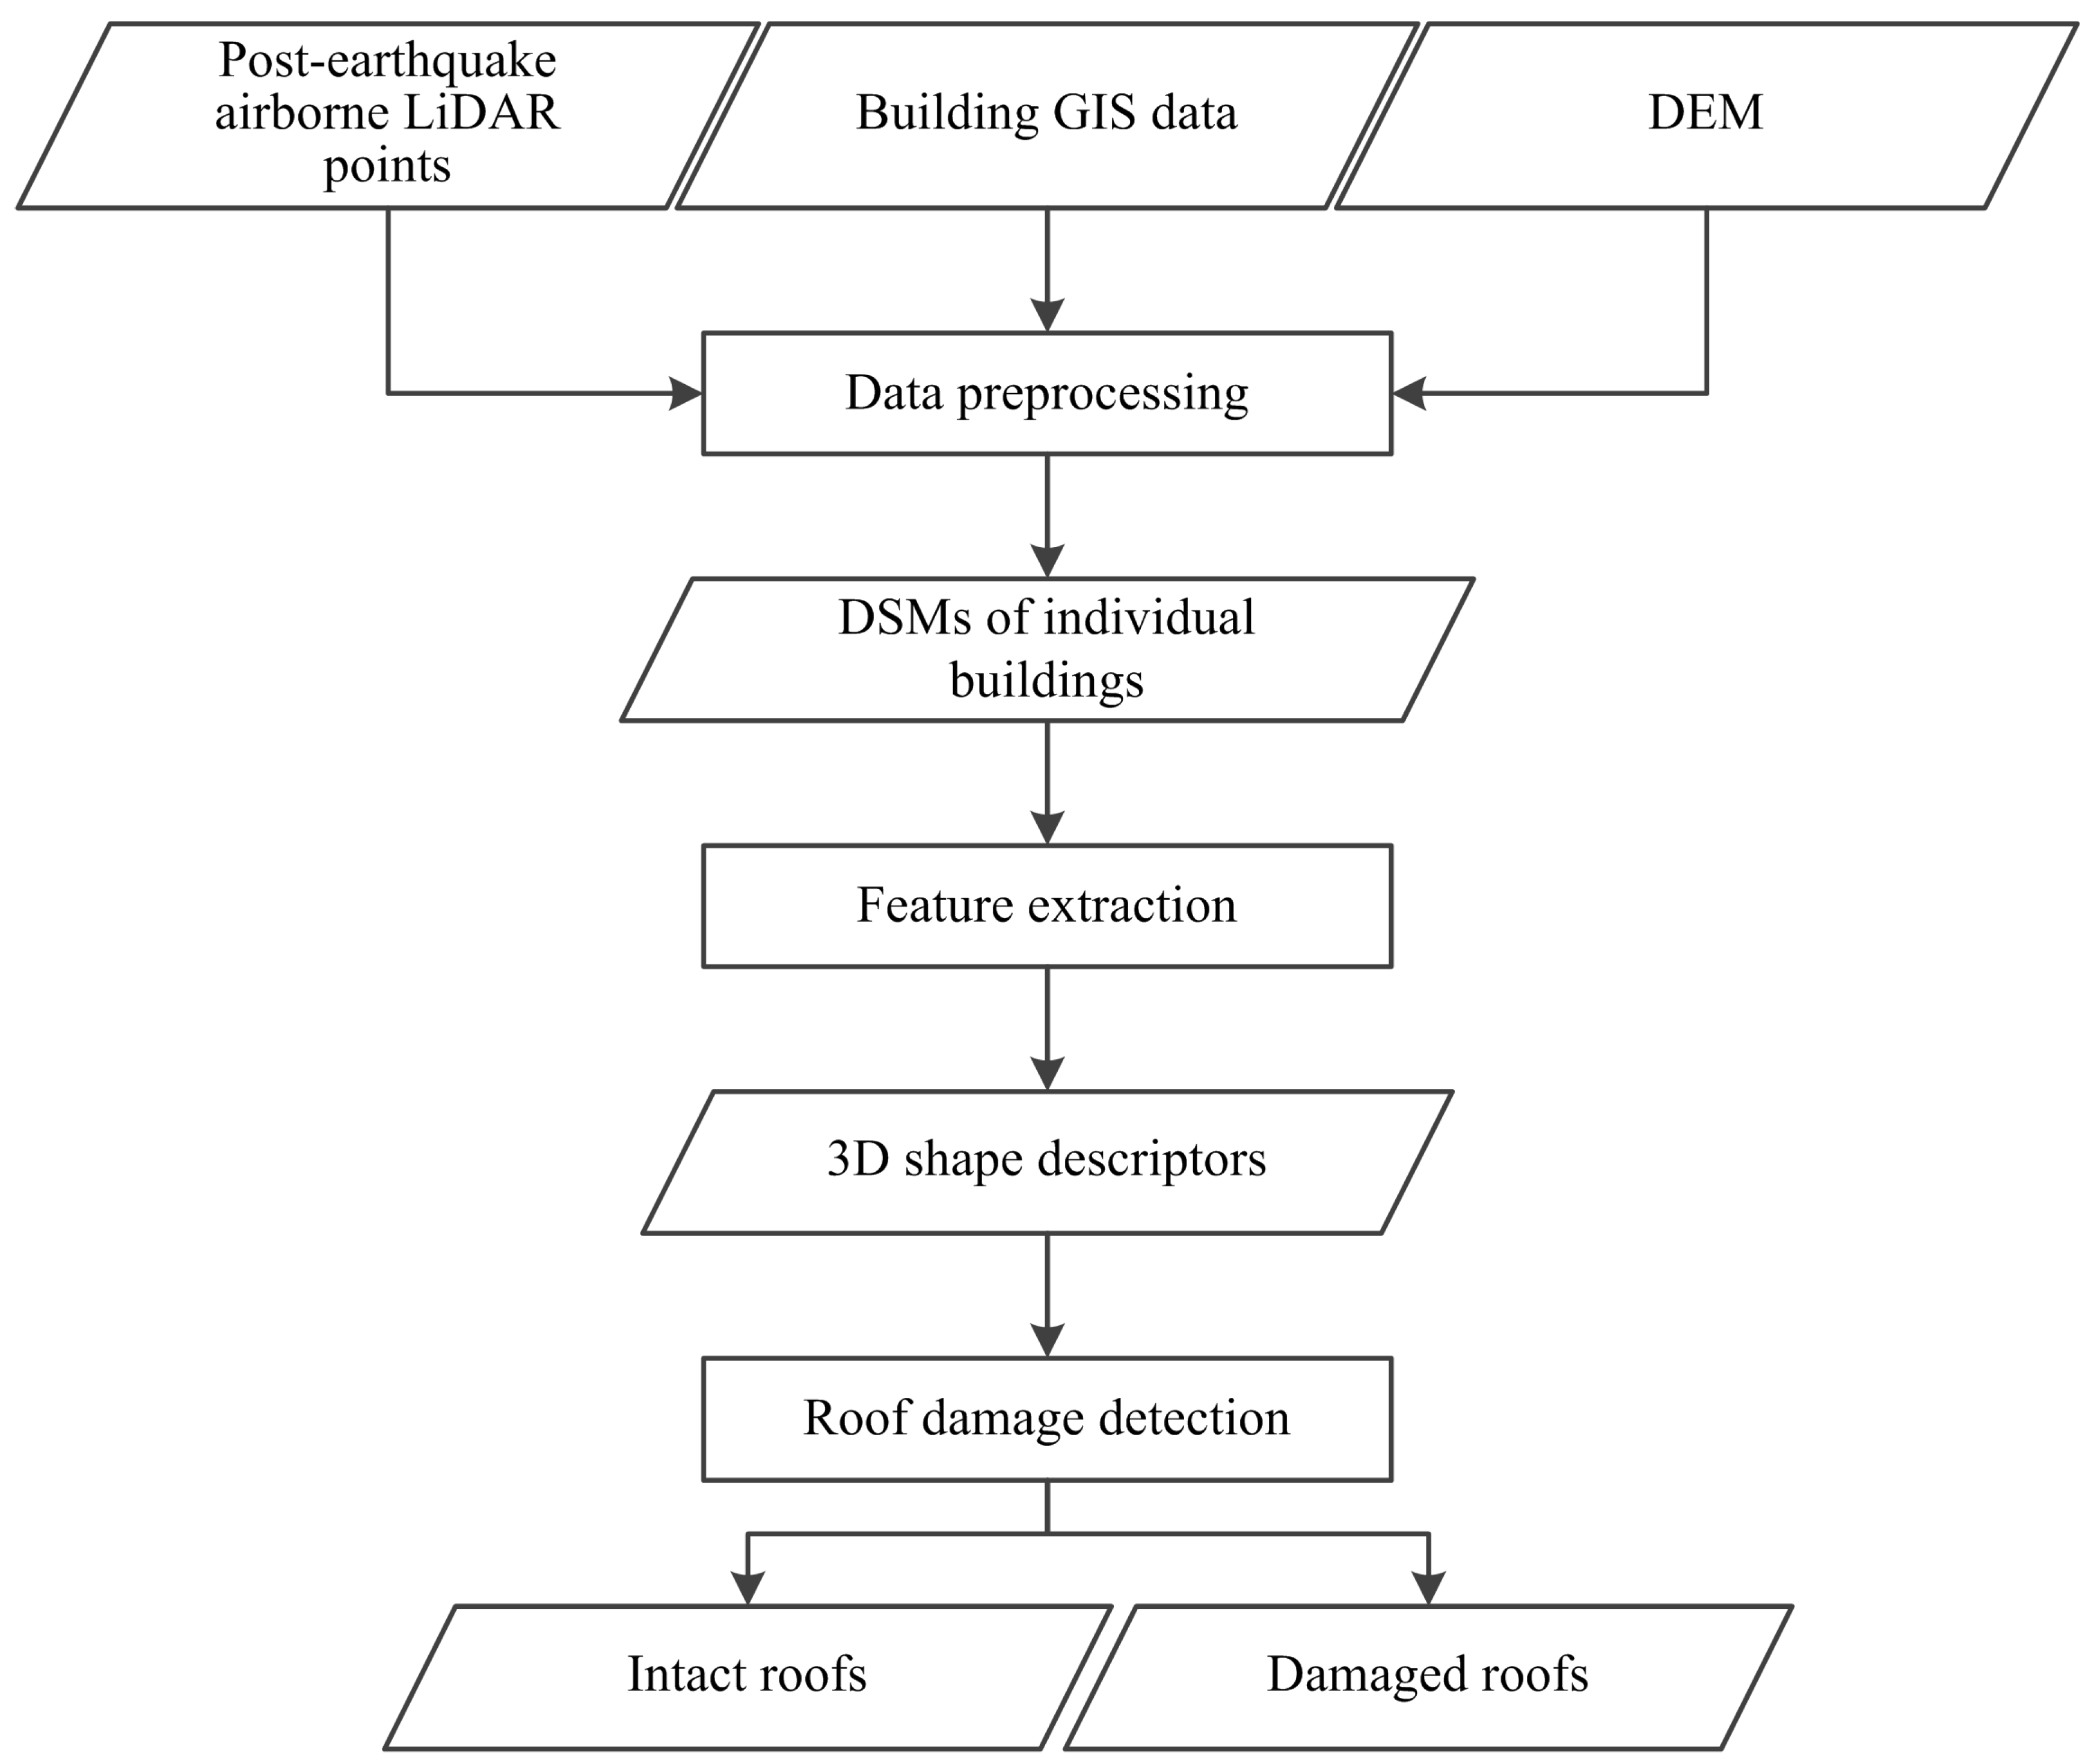
2. Methodology
2.1. Data Preprocessing
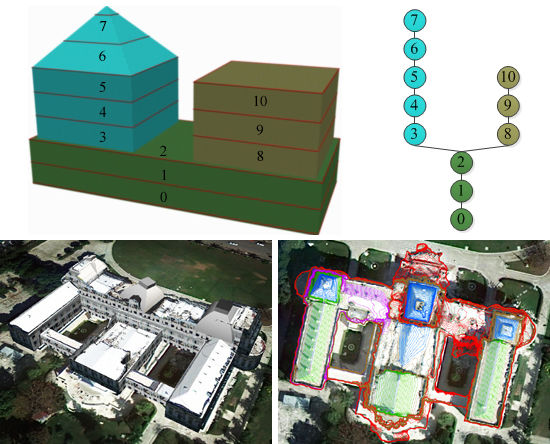
2.2. Feature Extraction
2.2.1. Feature Definition
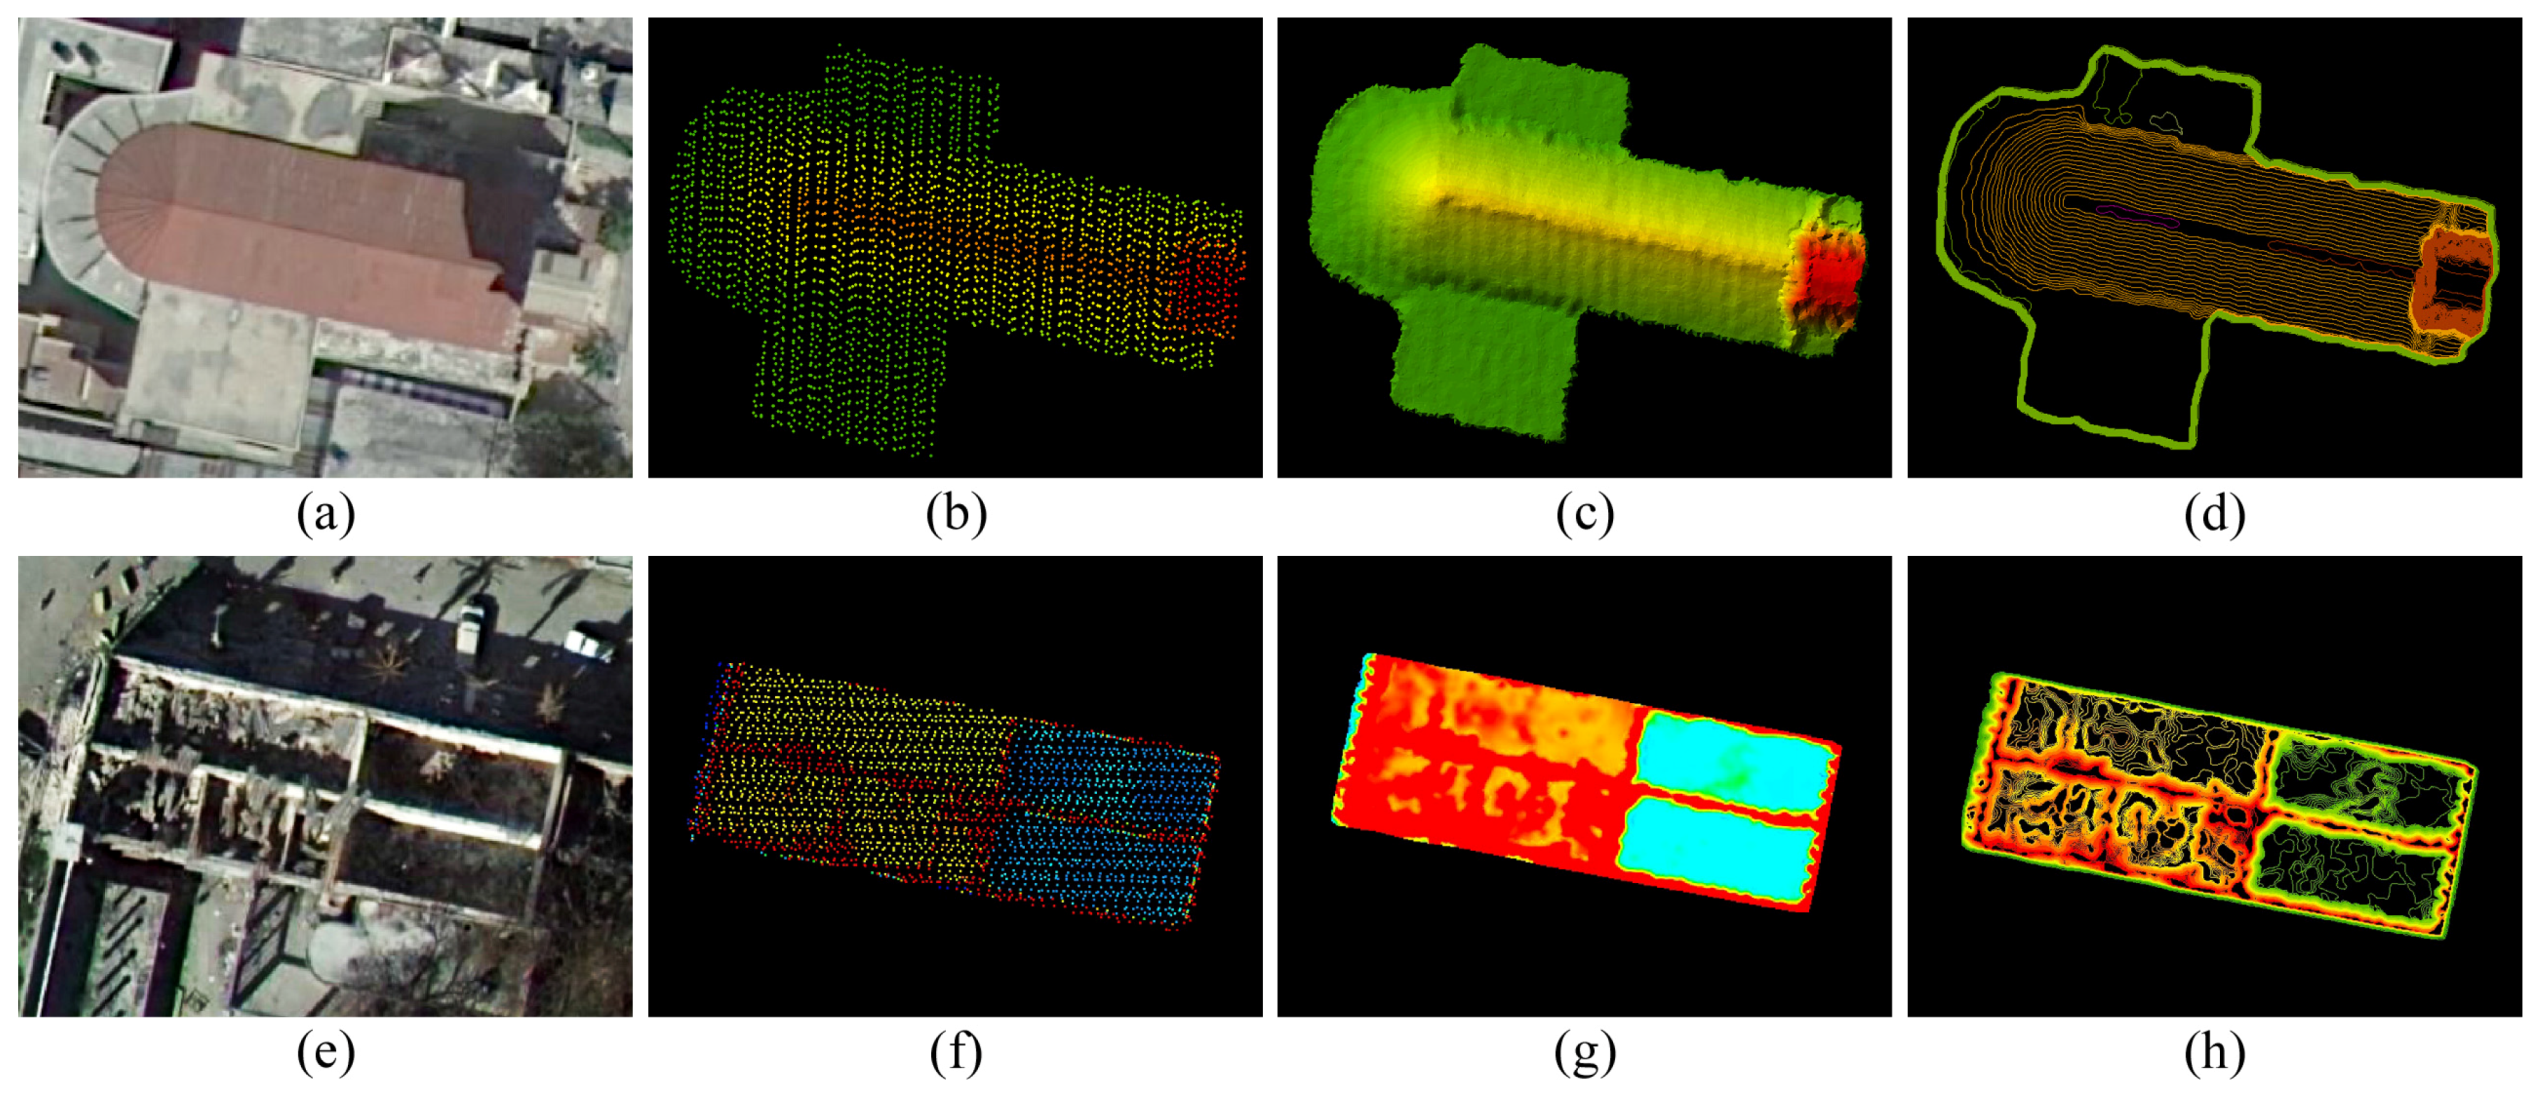
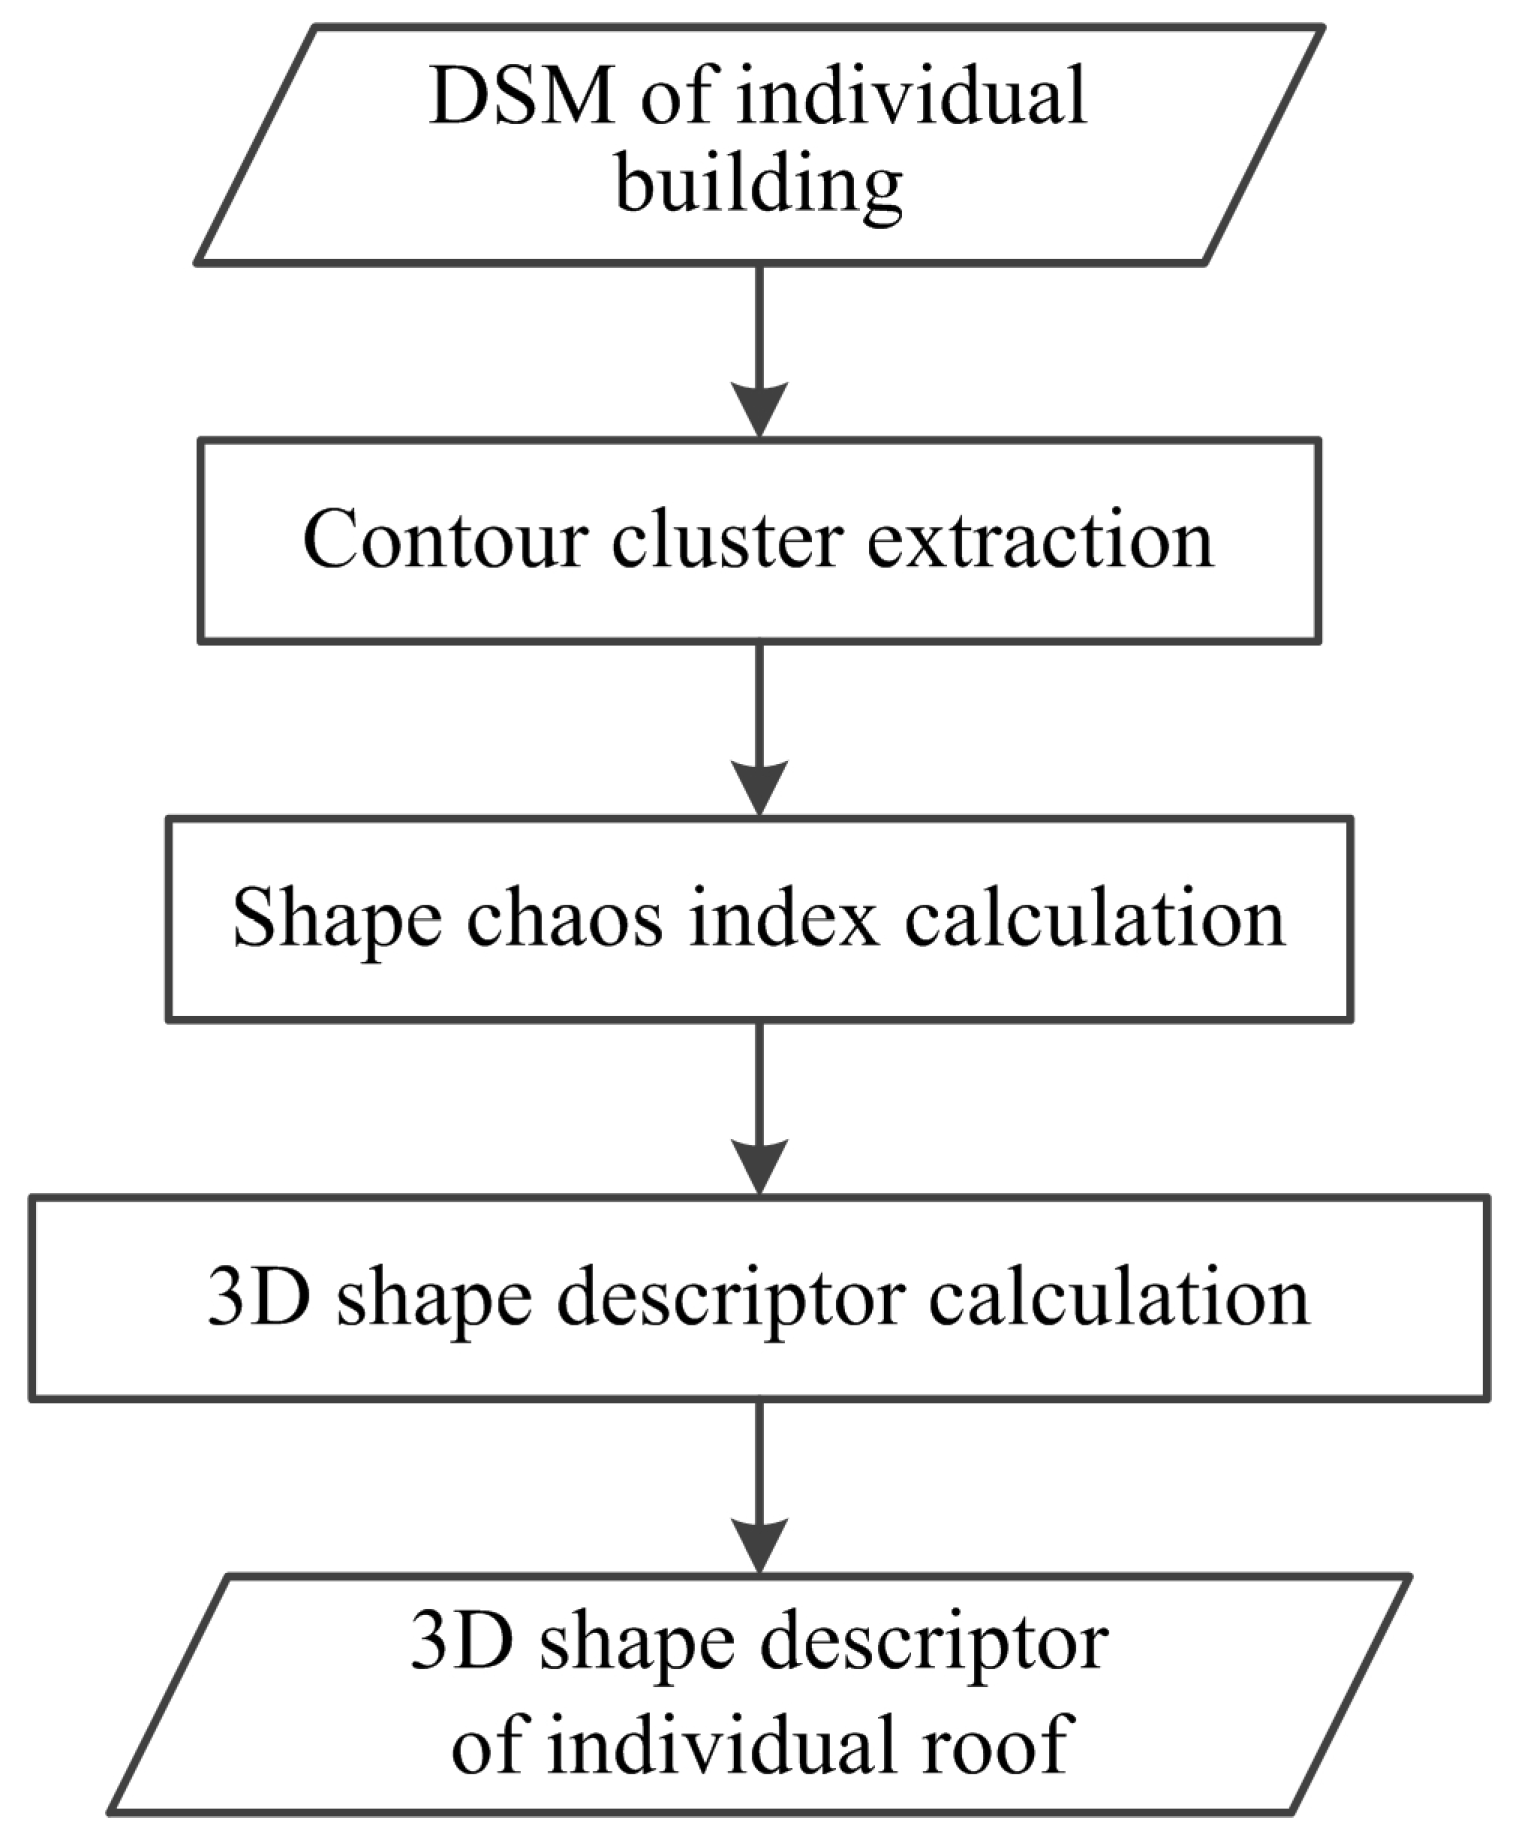
2.2.2. Feature Extraction Algorithm
- (1)
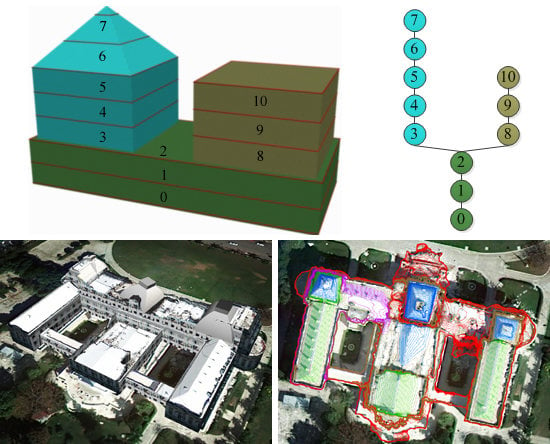
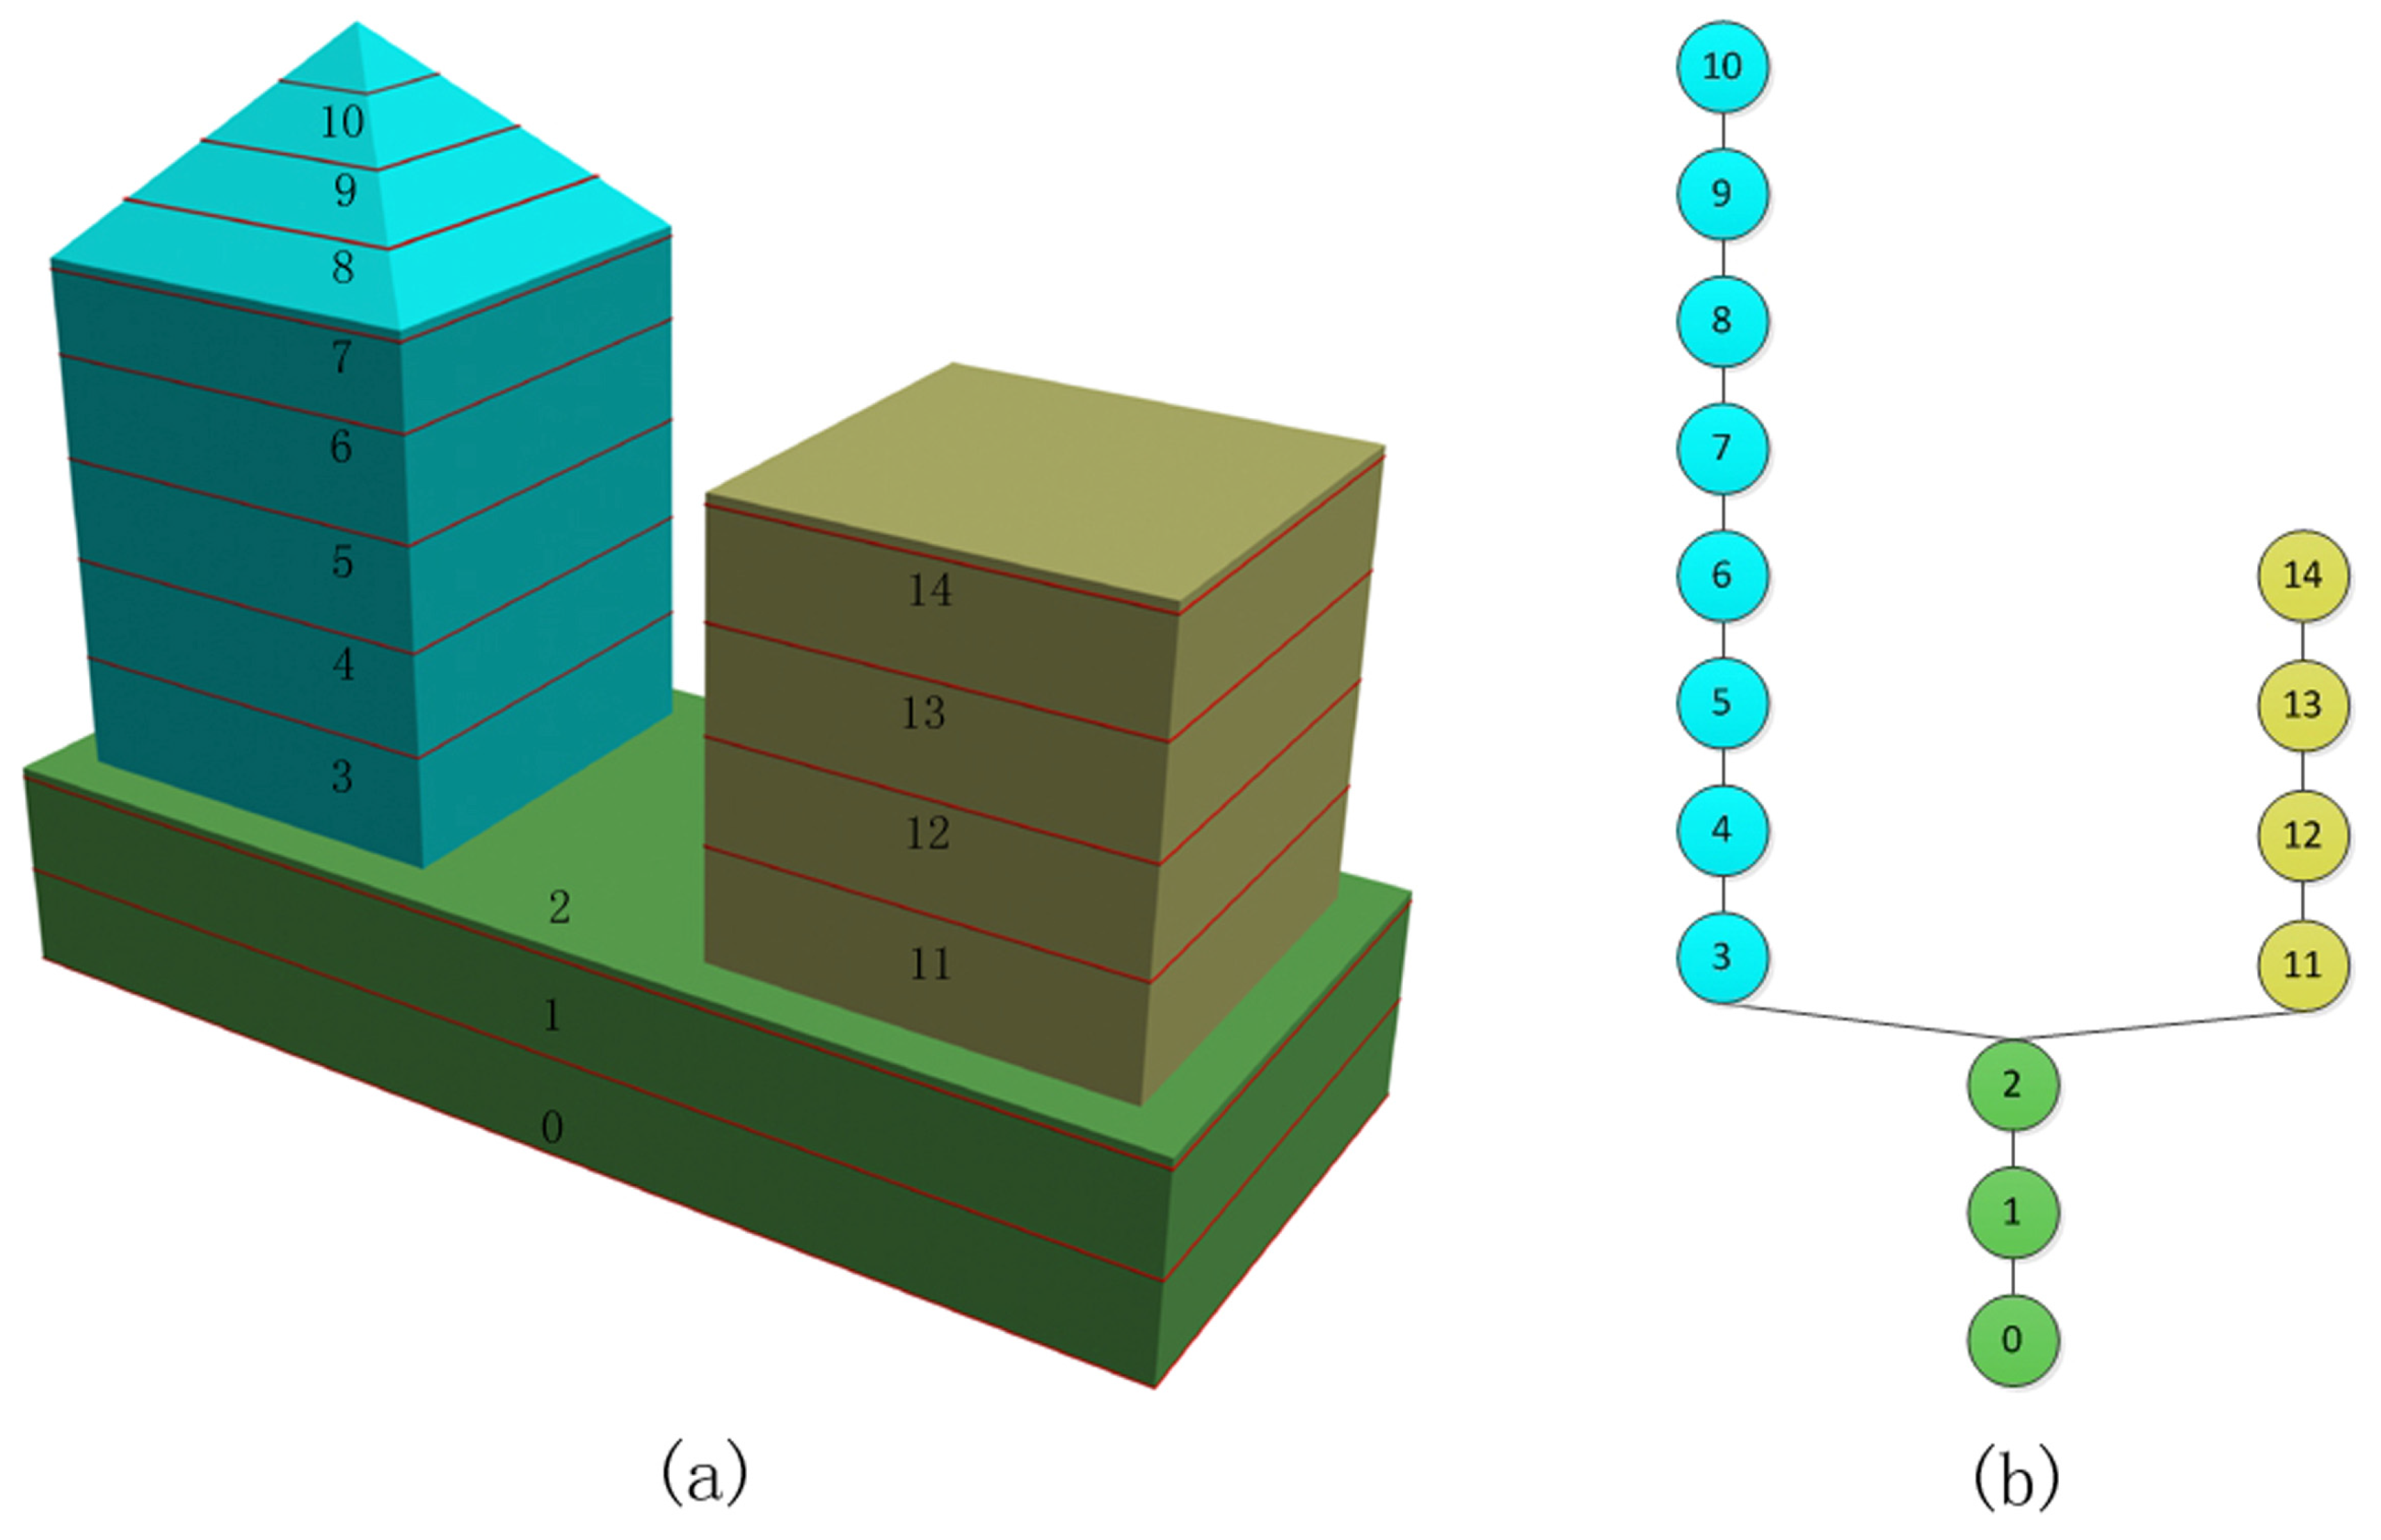
- Contour Cluster Extraction
- (2)
- Shape Chaos Index Calculation
- (3)
- 3D Shape Descriptor Calculation
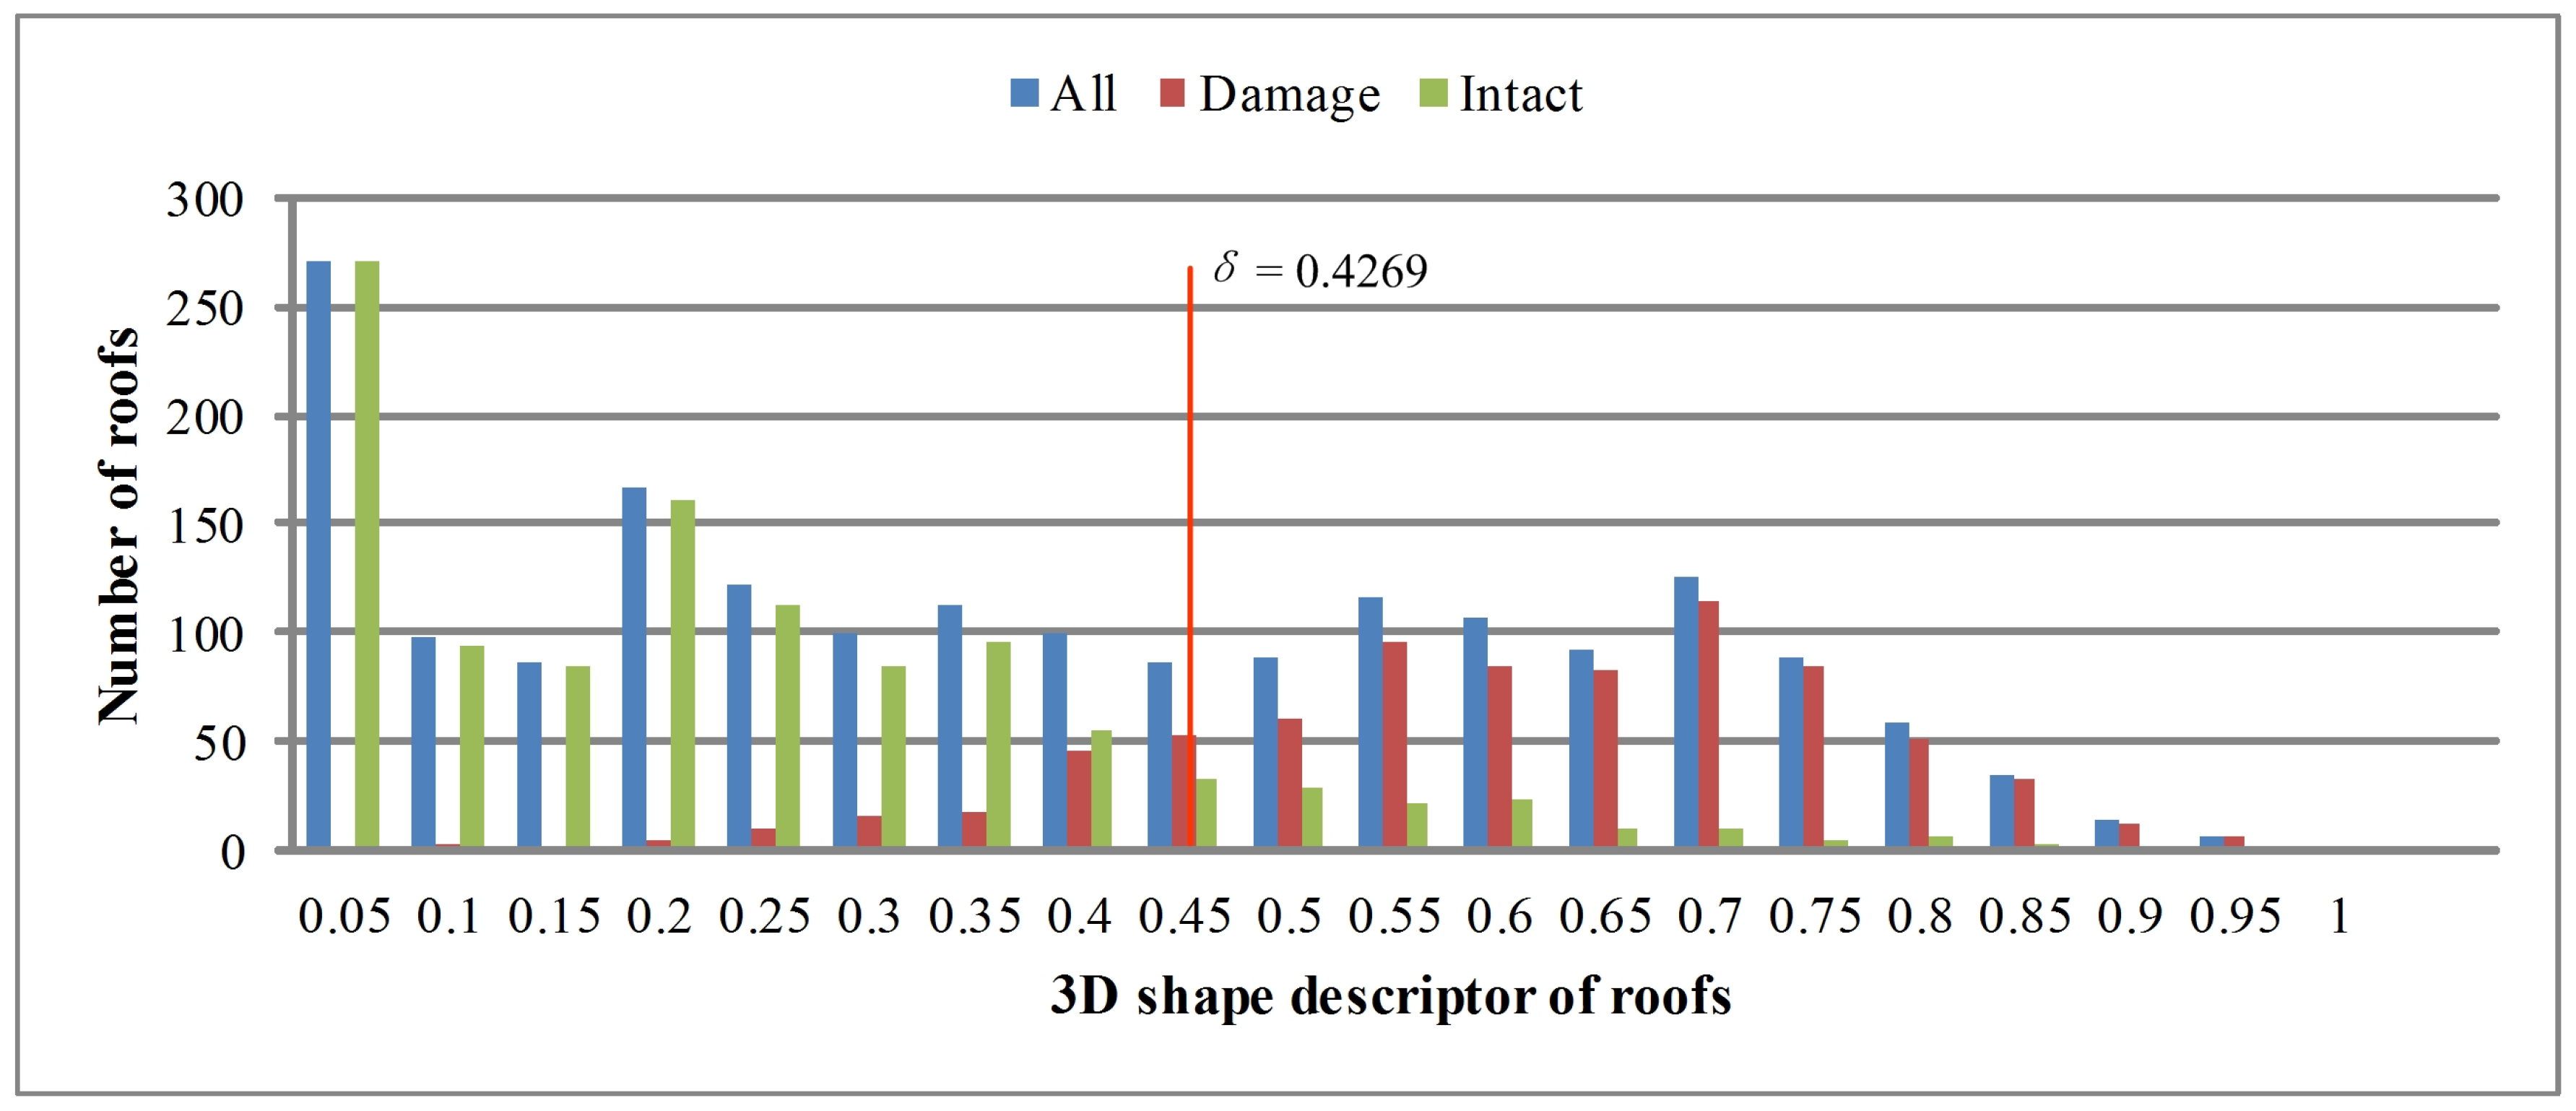
2.3. Damaged Roof Detection
3. Study Area and Data
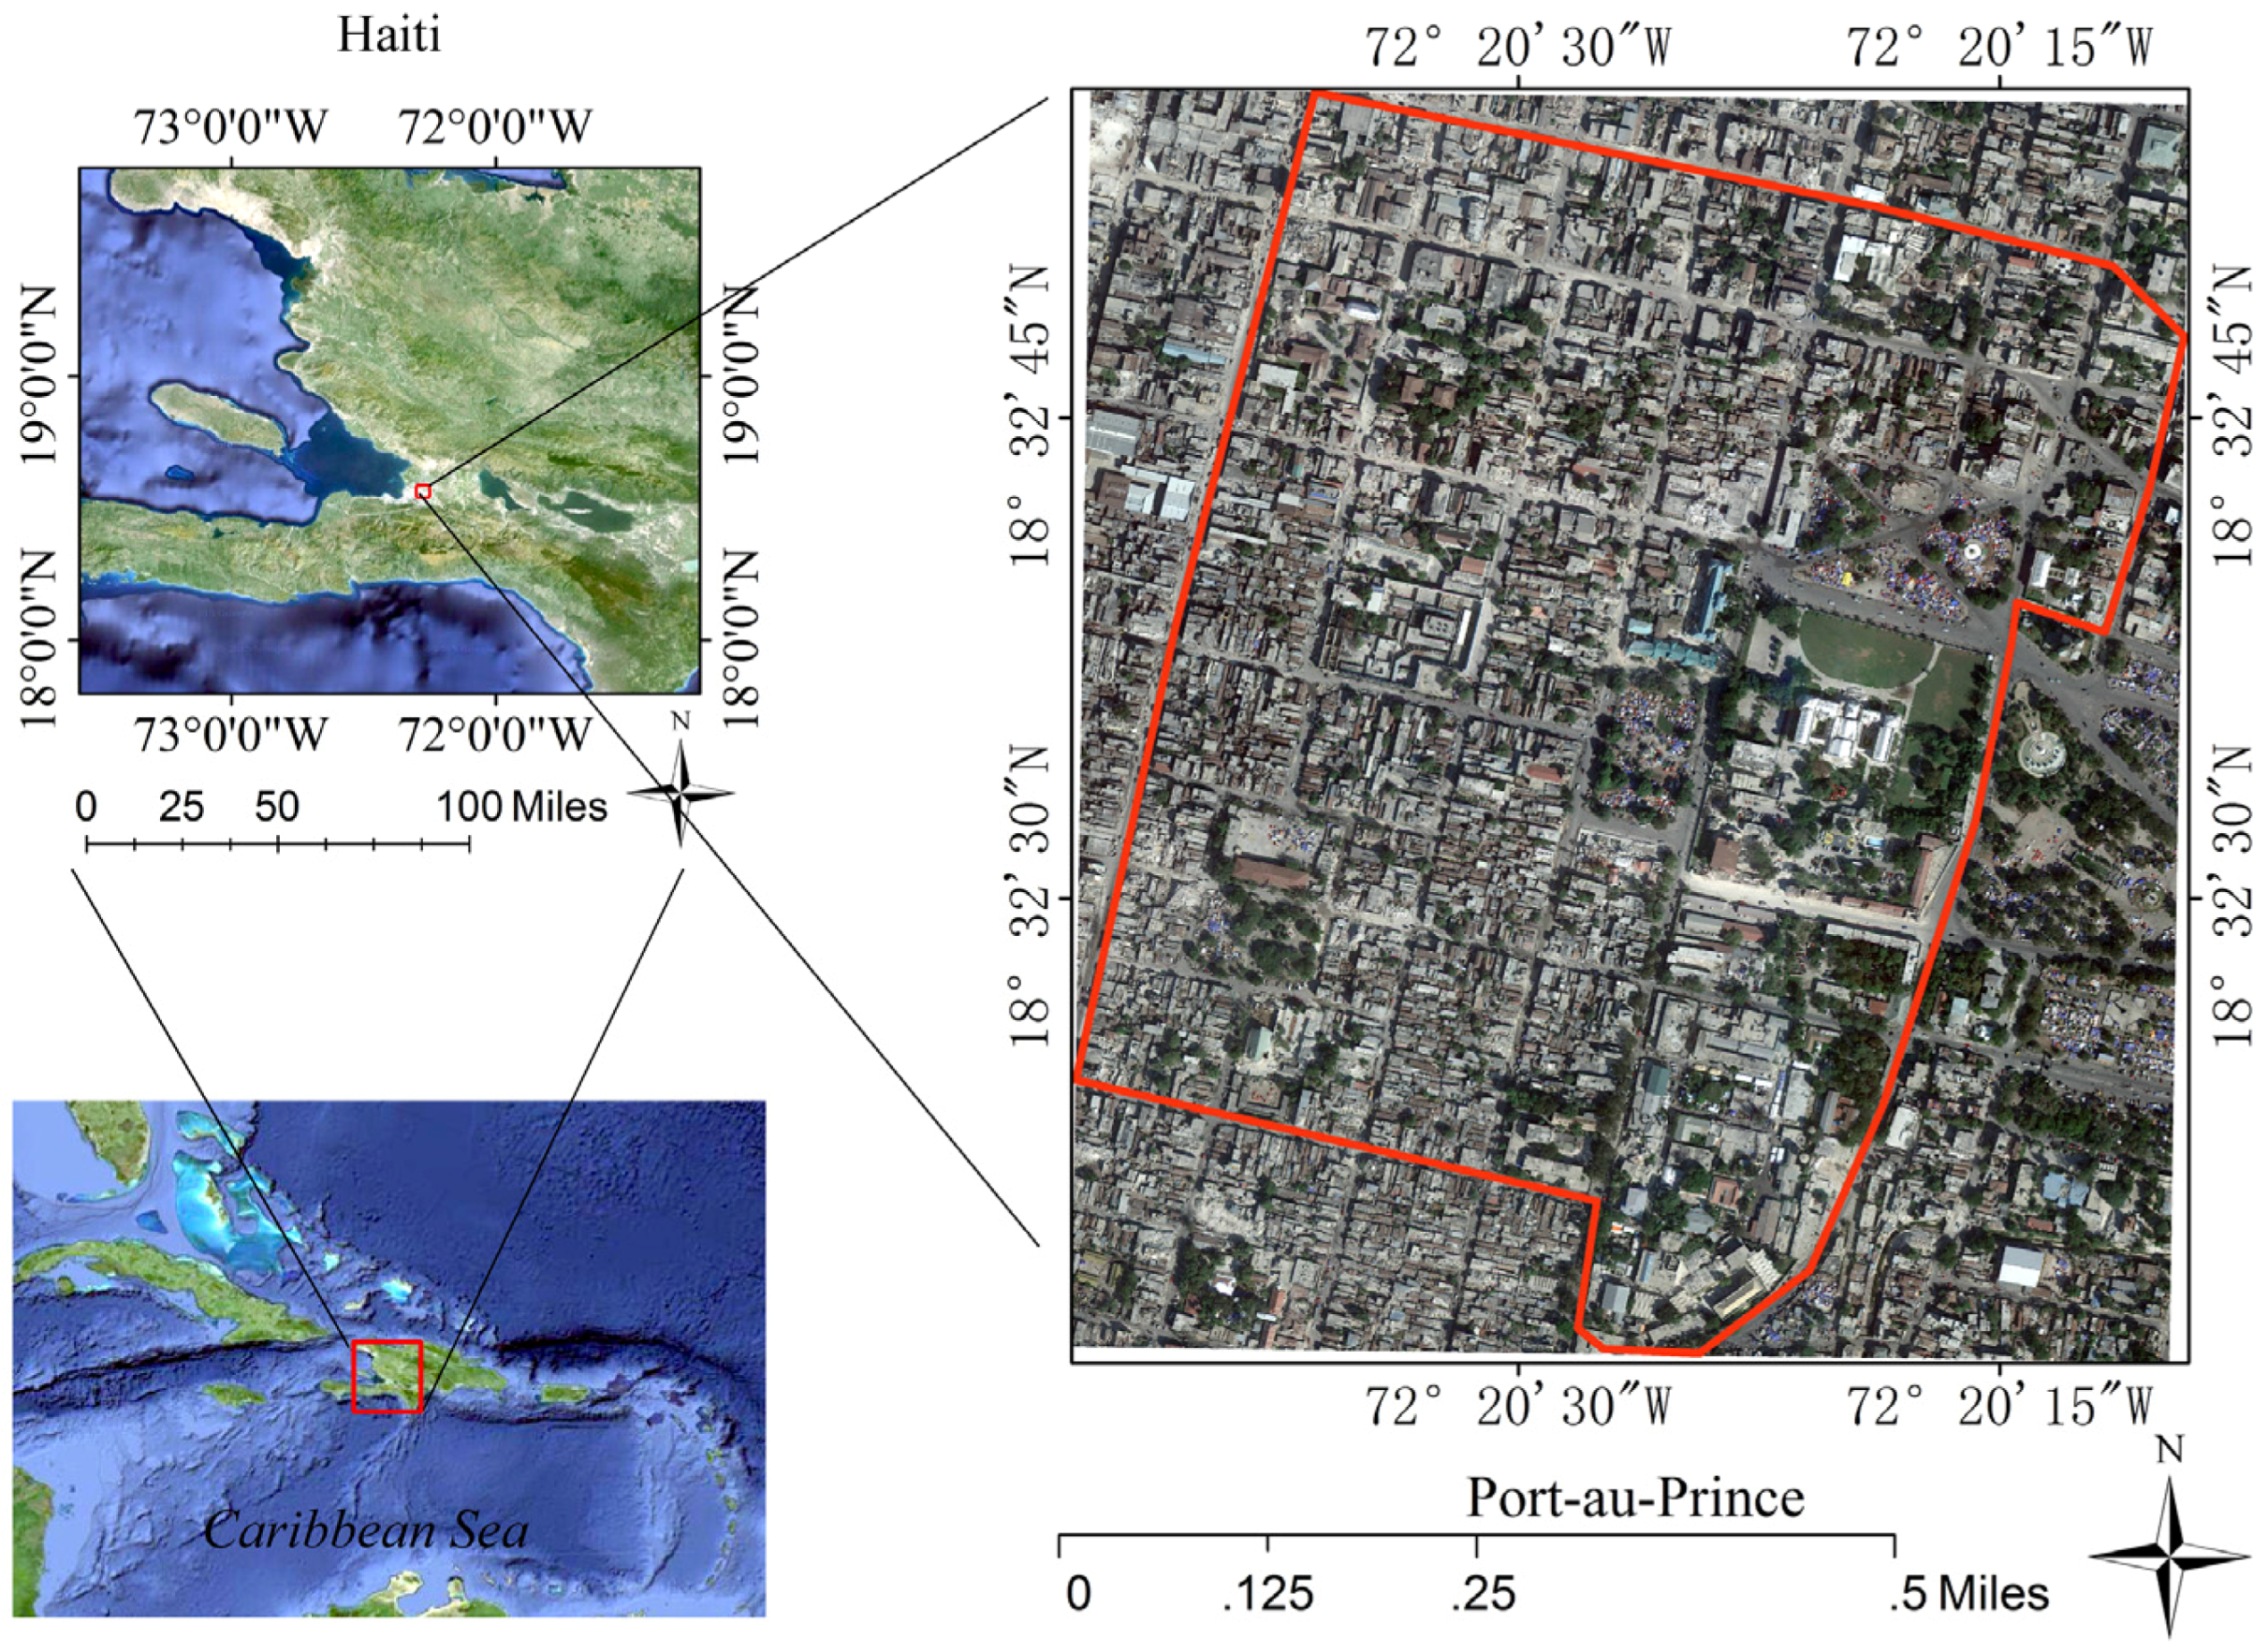
3.1. Study Area
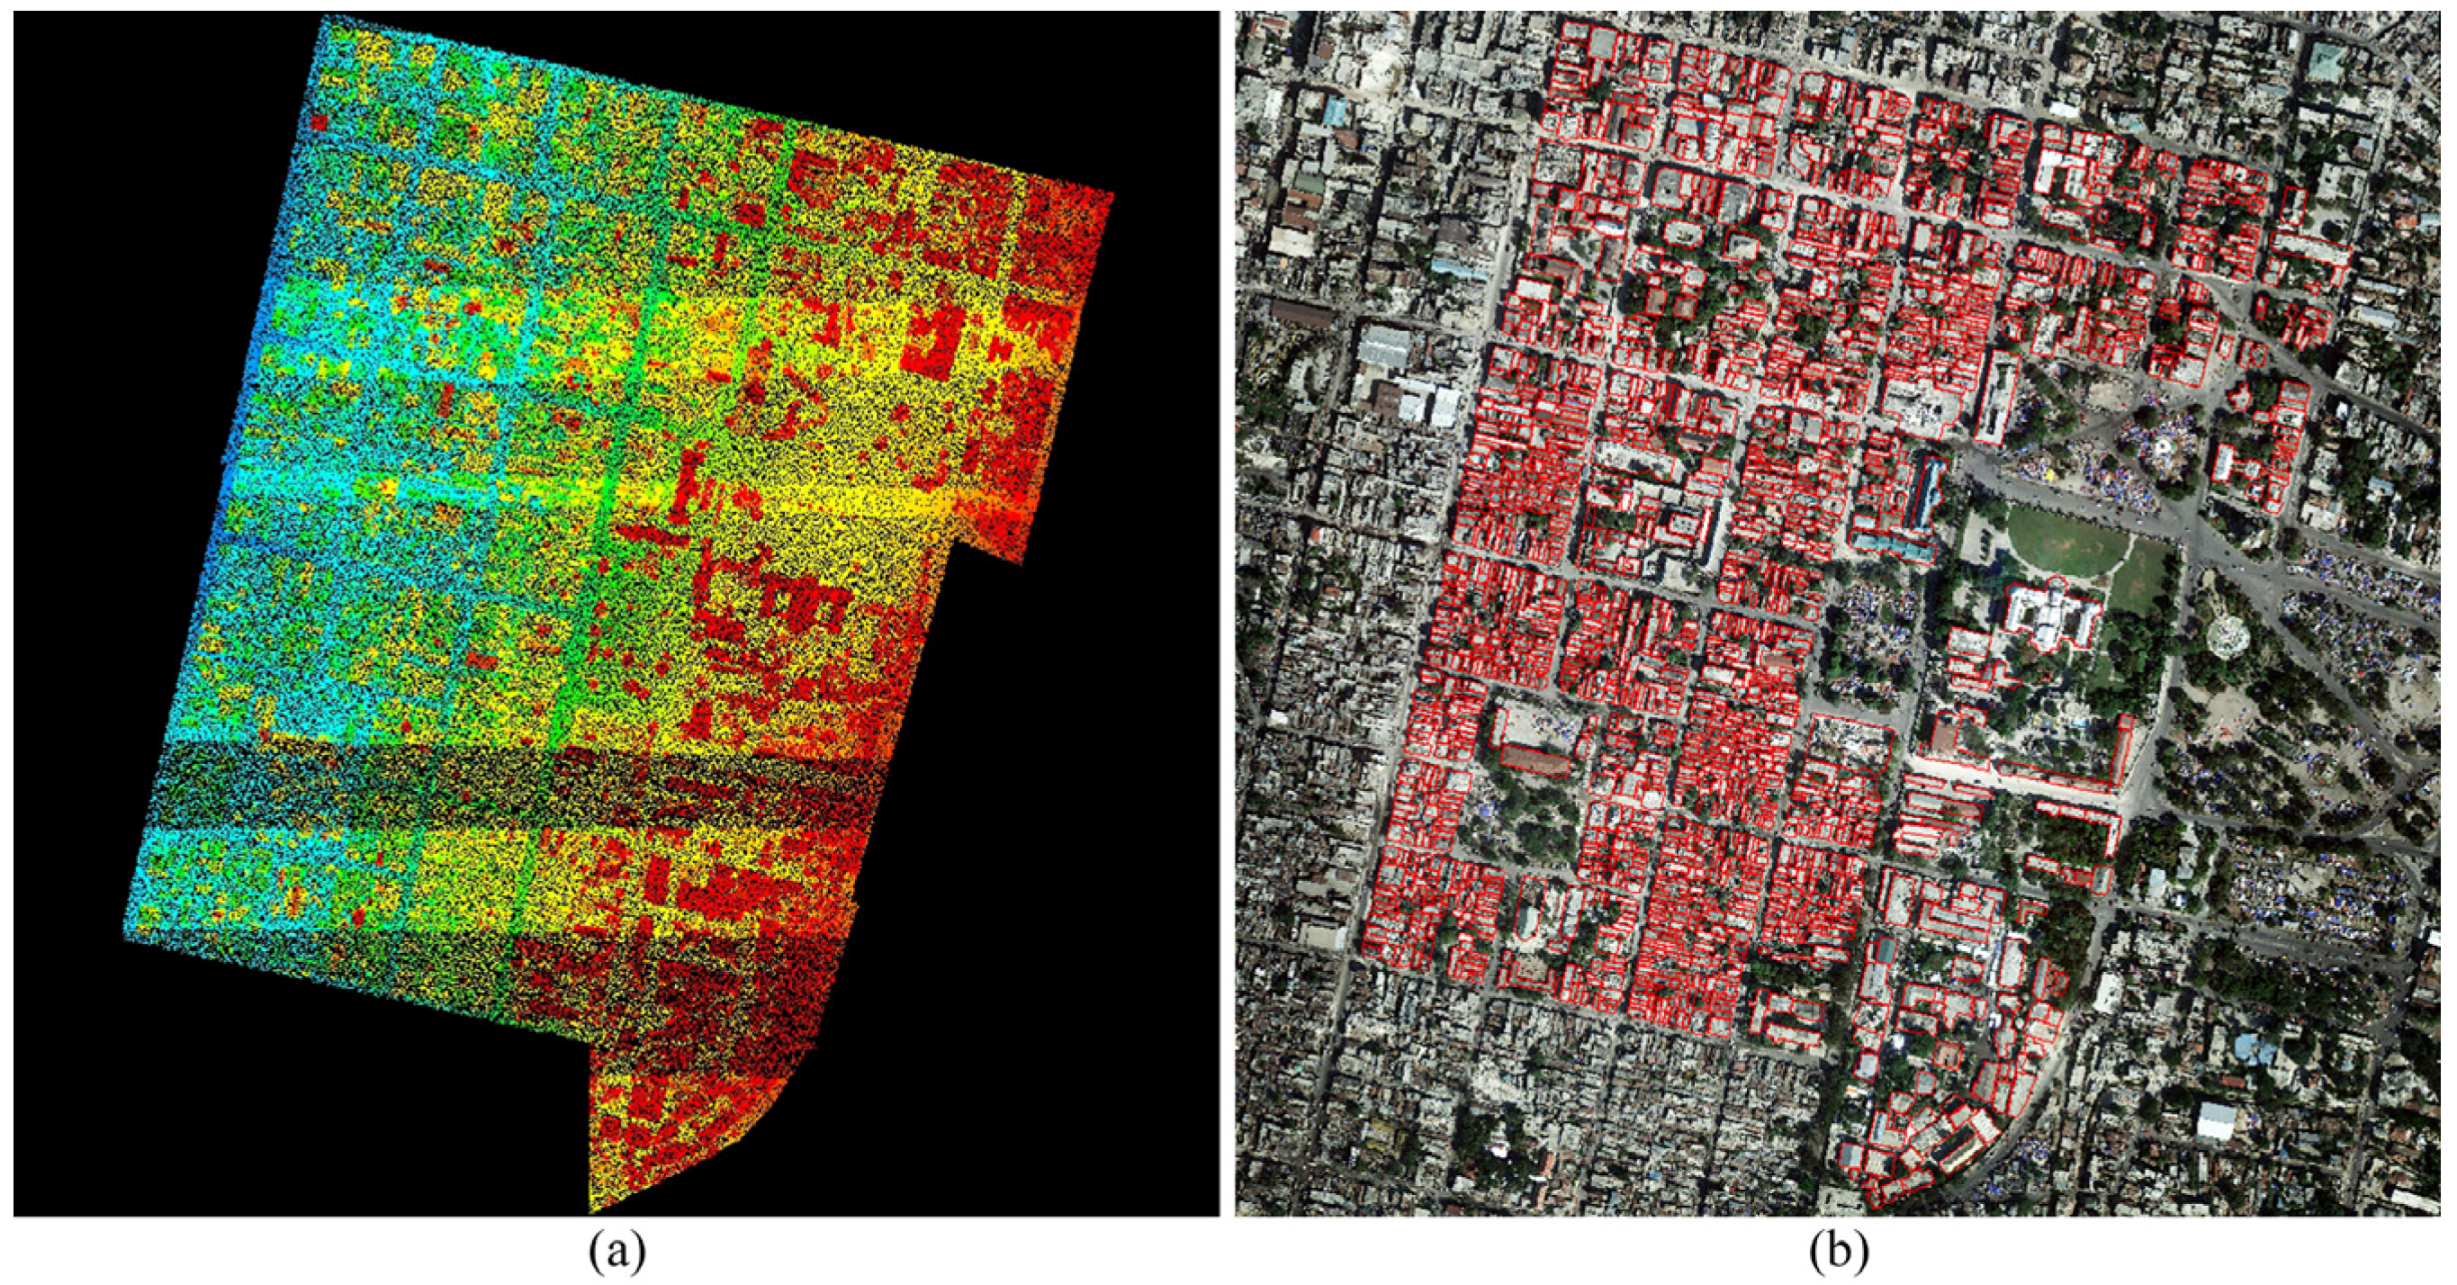
3.2. Data Source
4. Results and Discussion
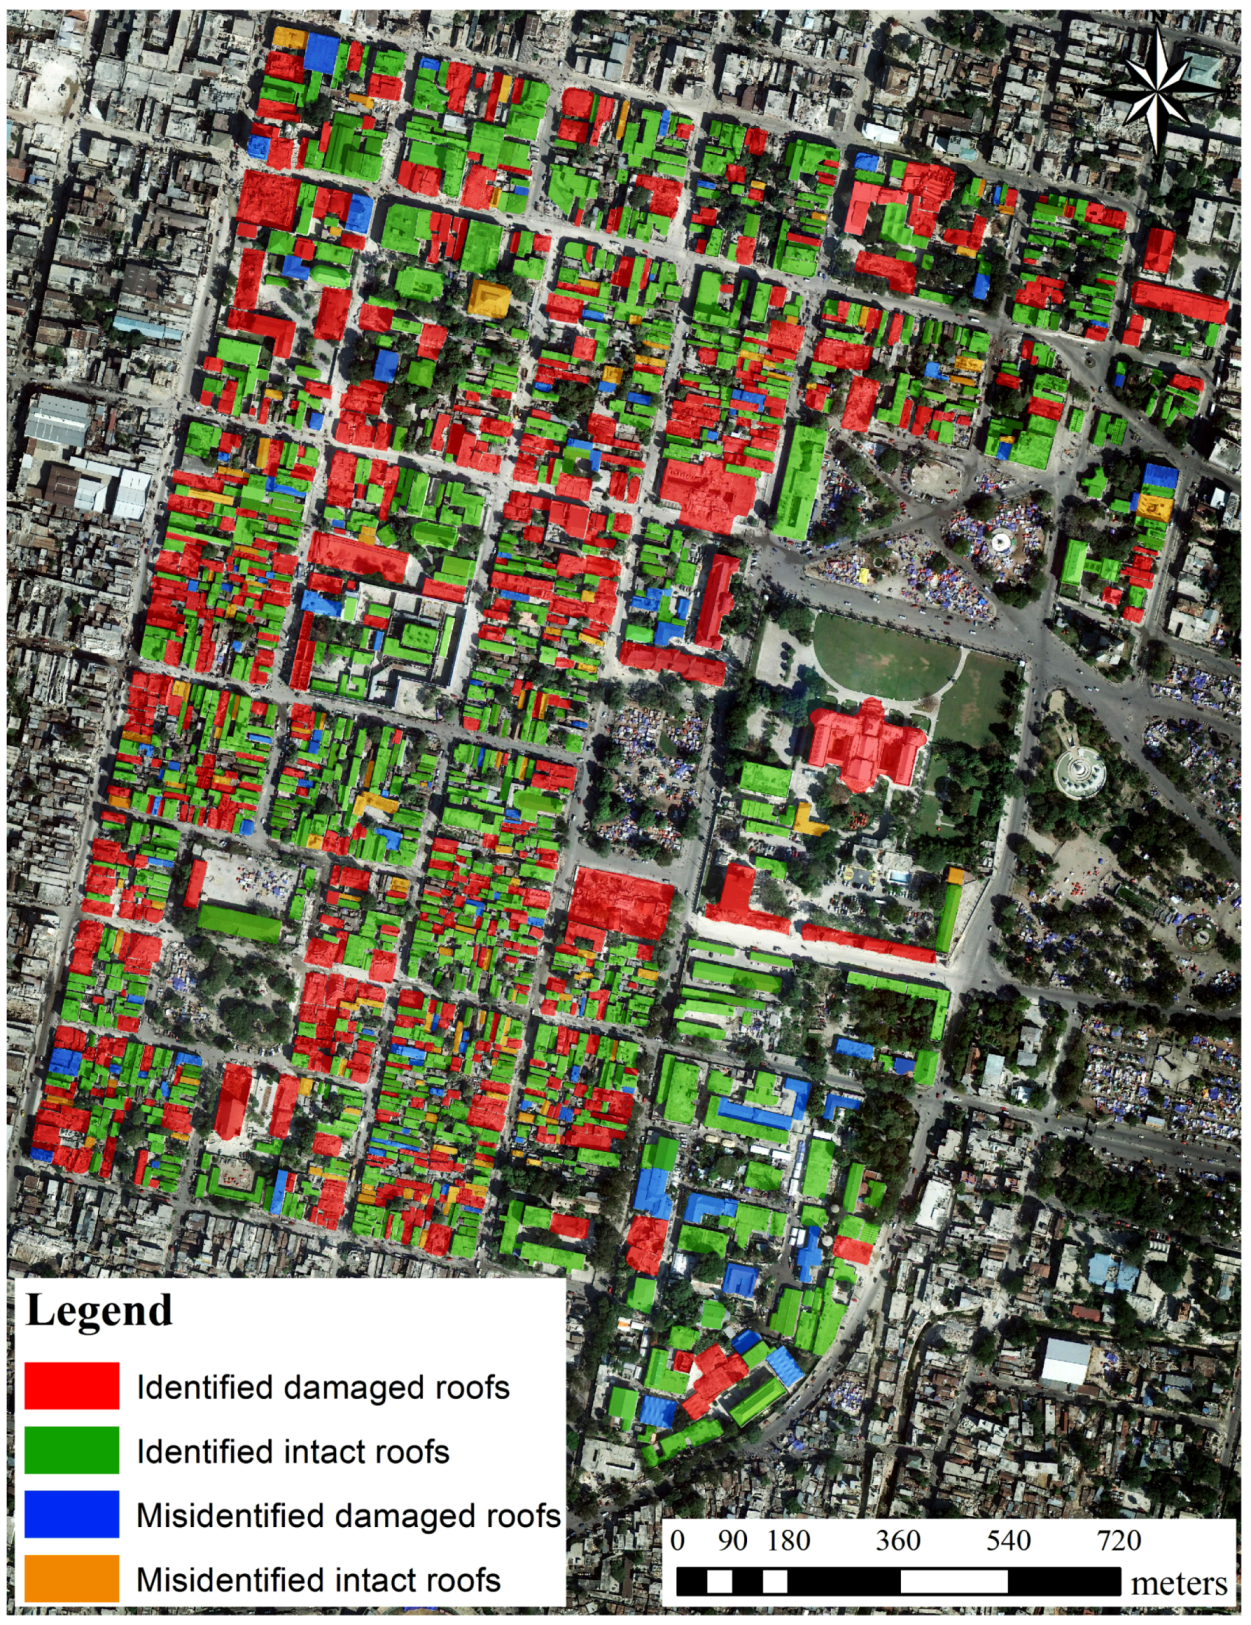
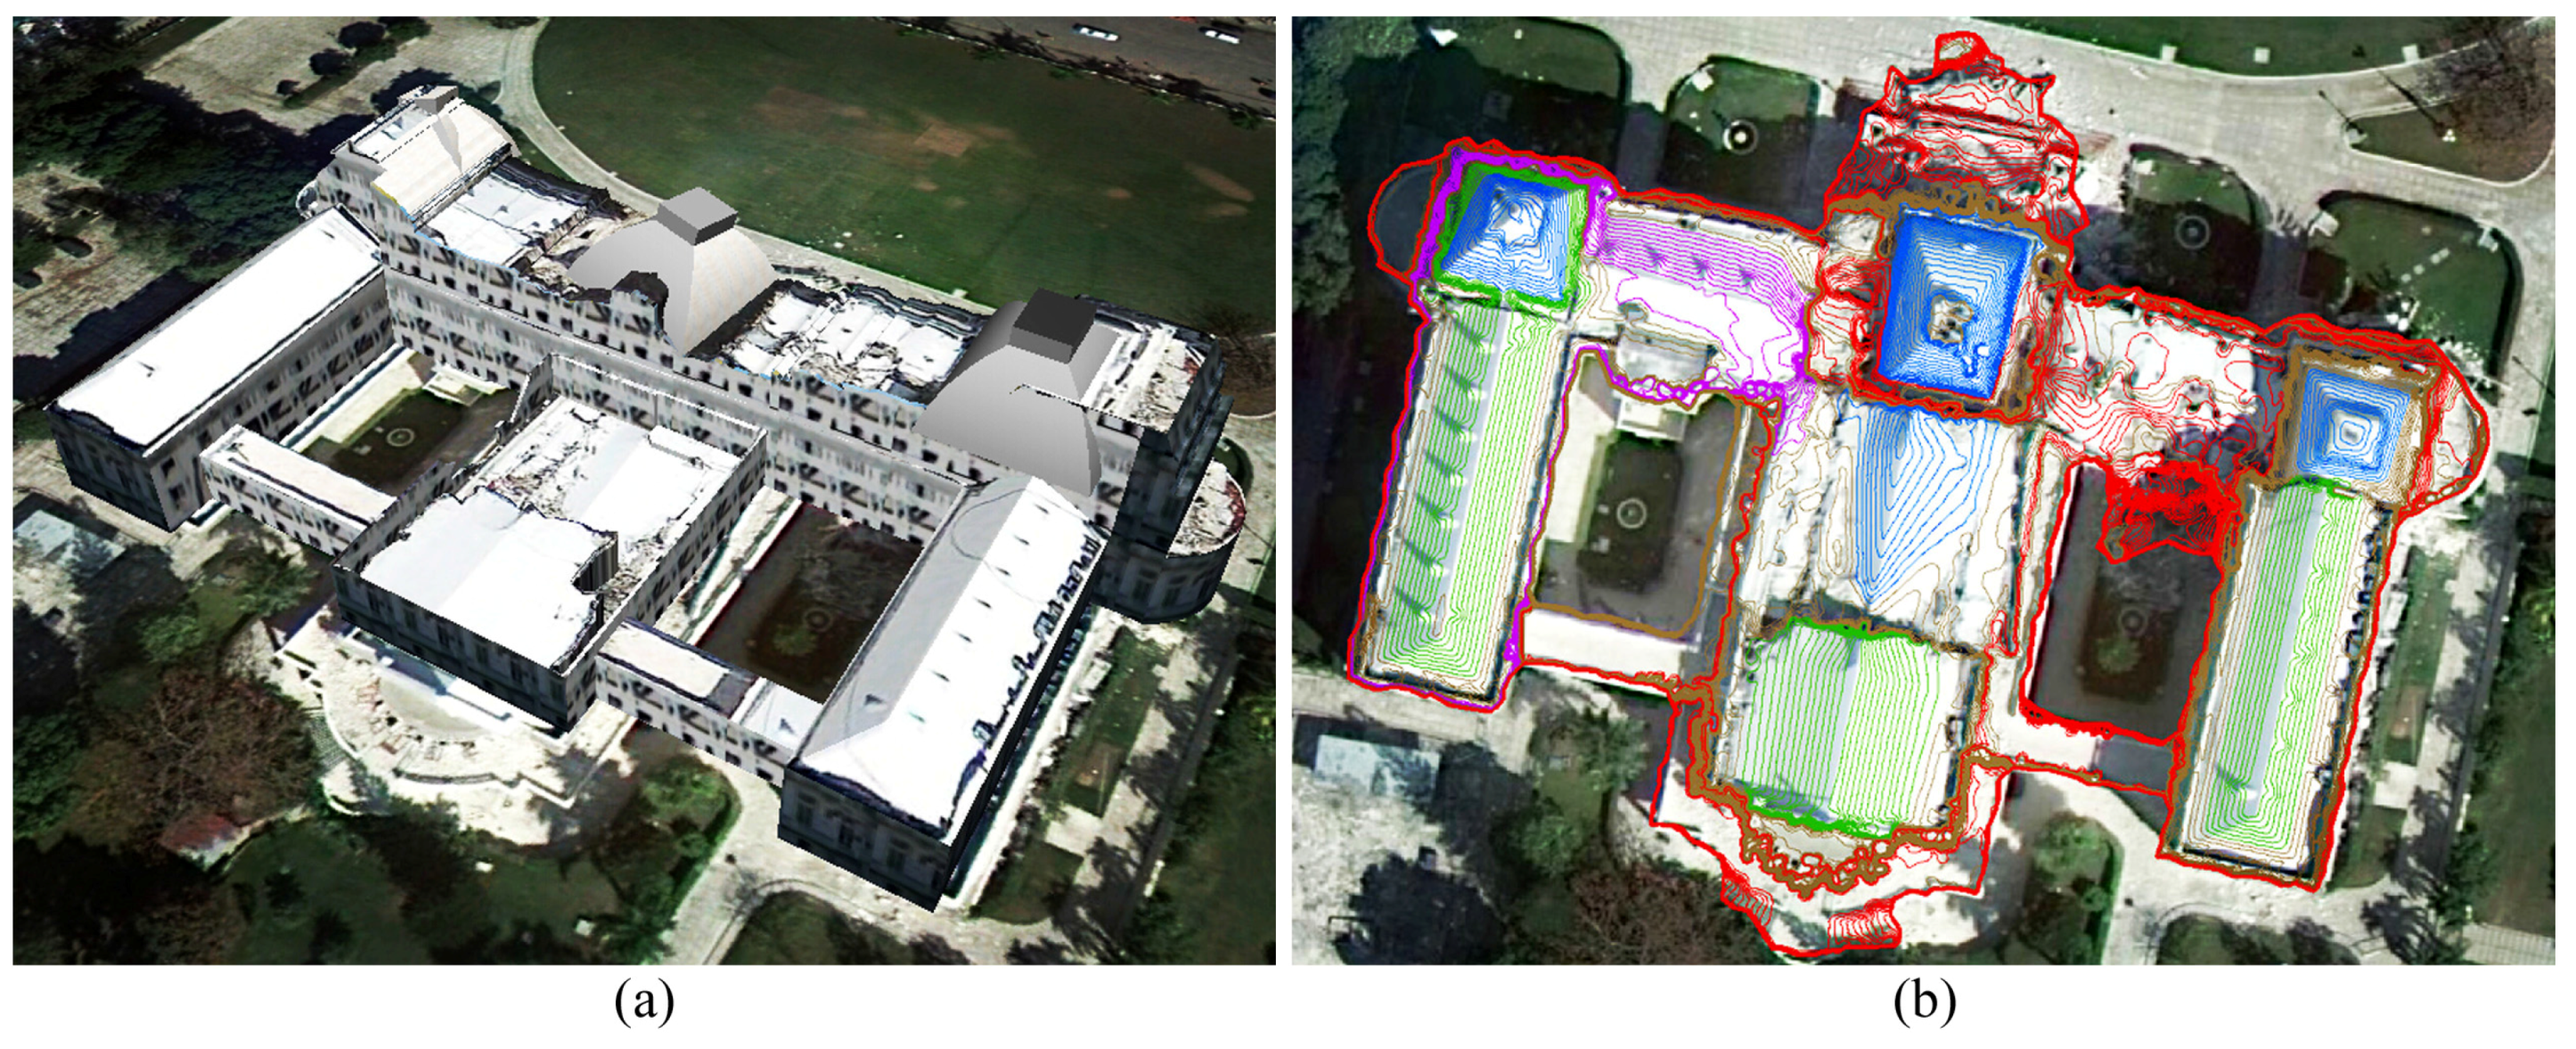
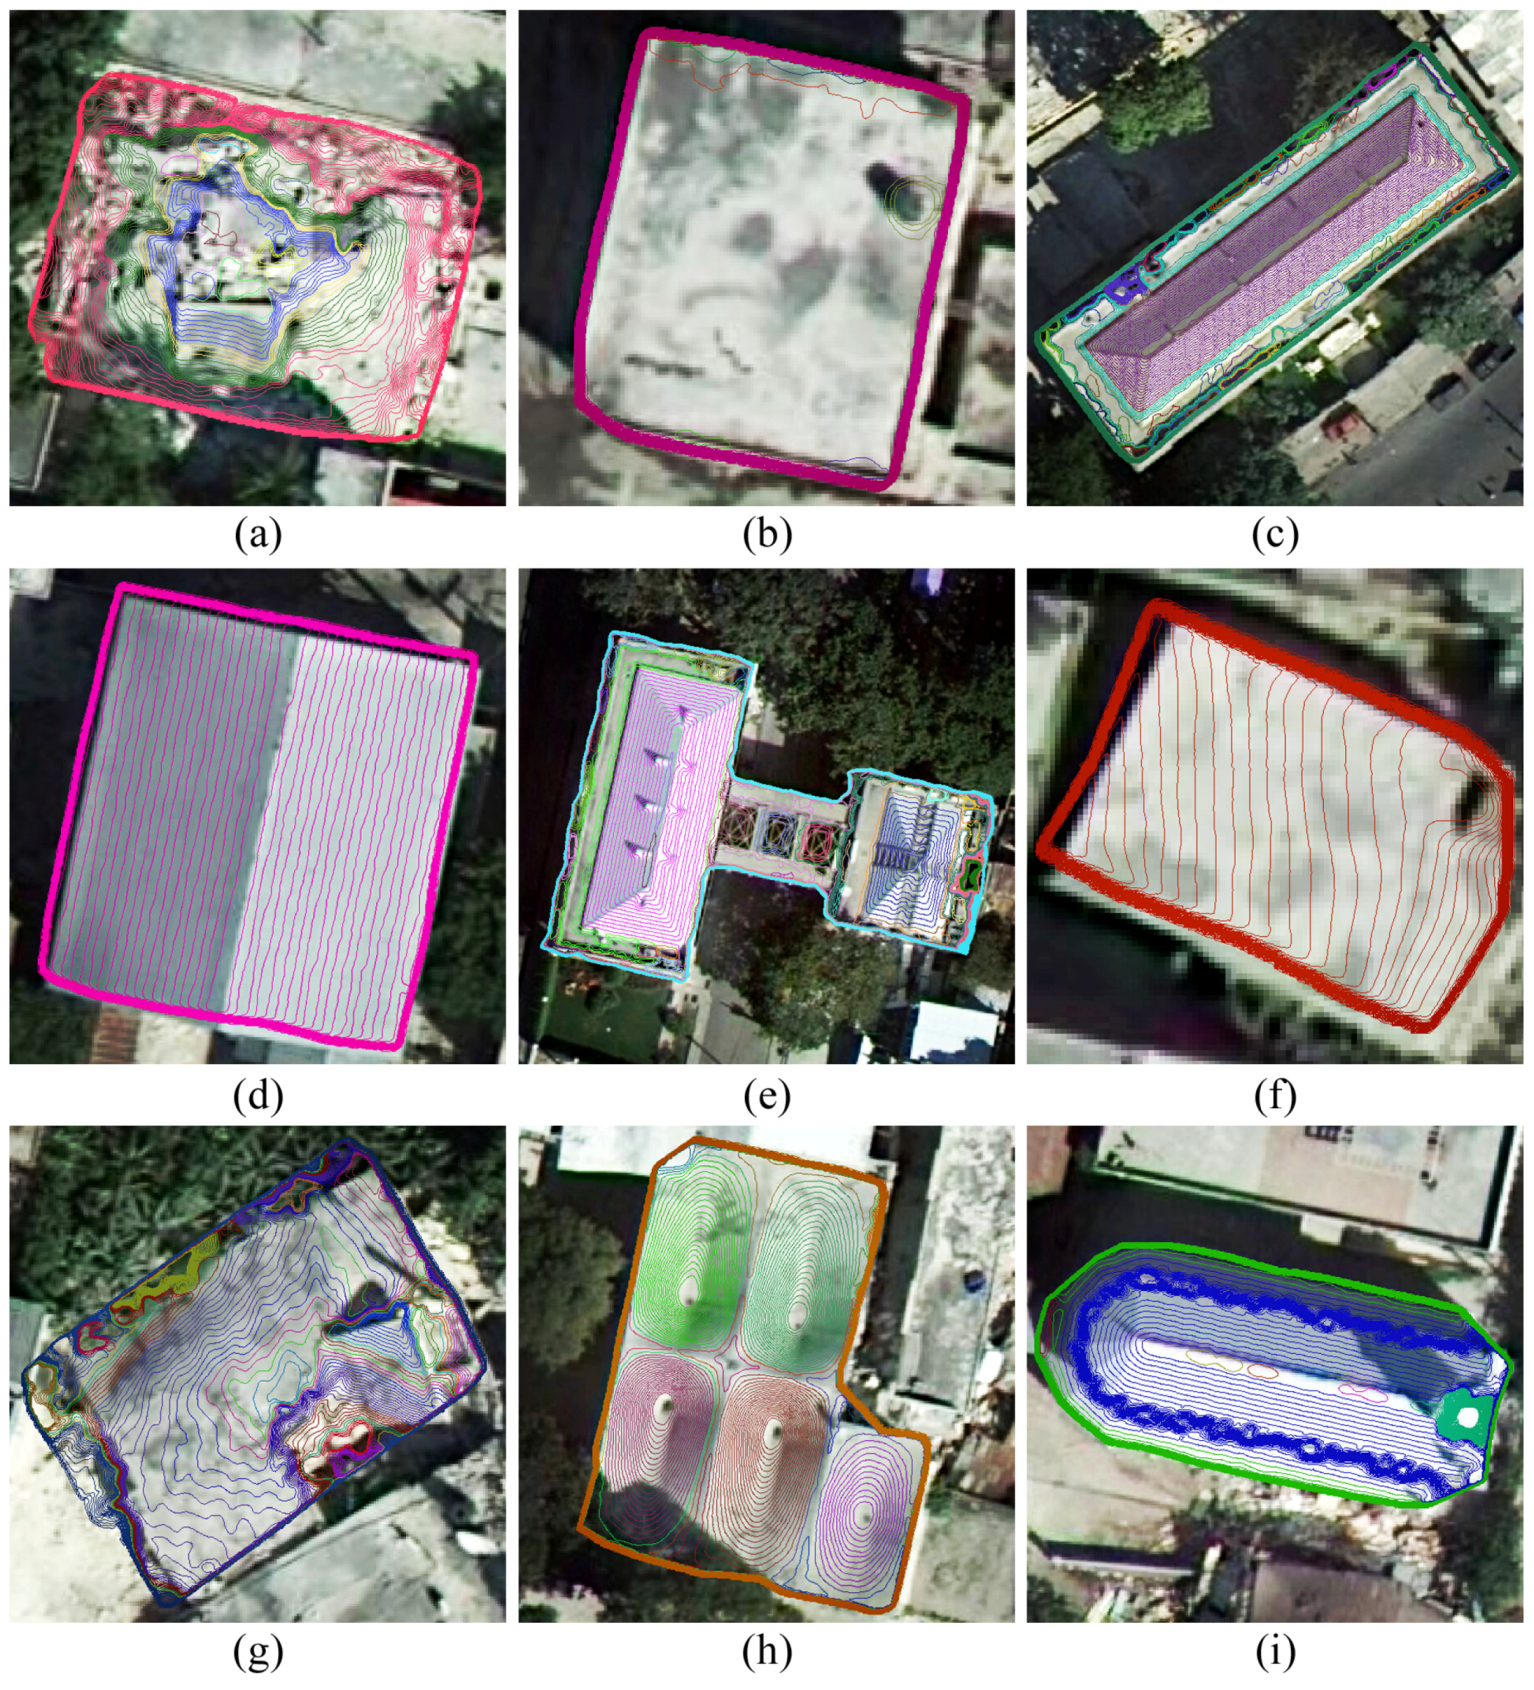
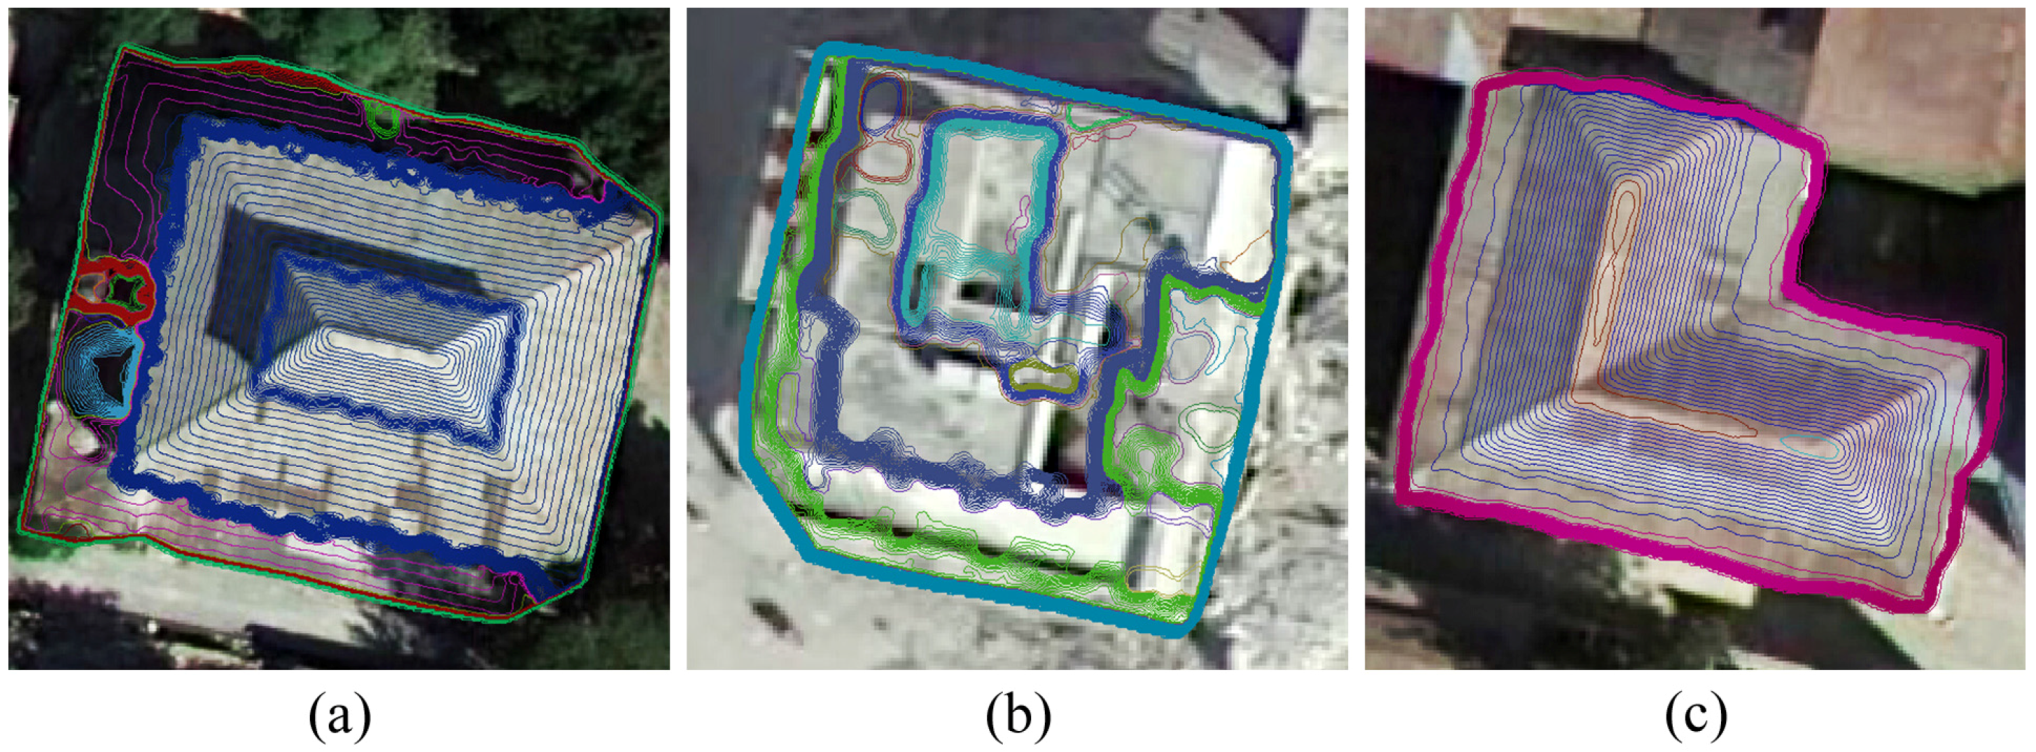
4.1. Damaged Roof Detection
4.2. Accuracy Evaluation
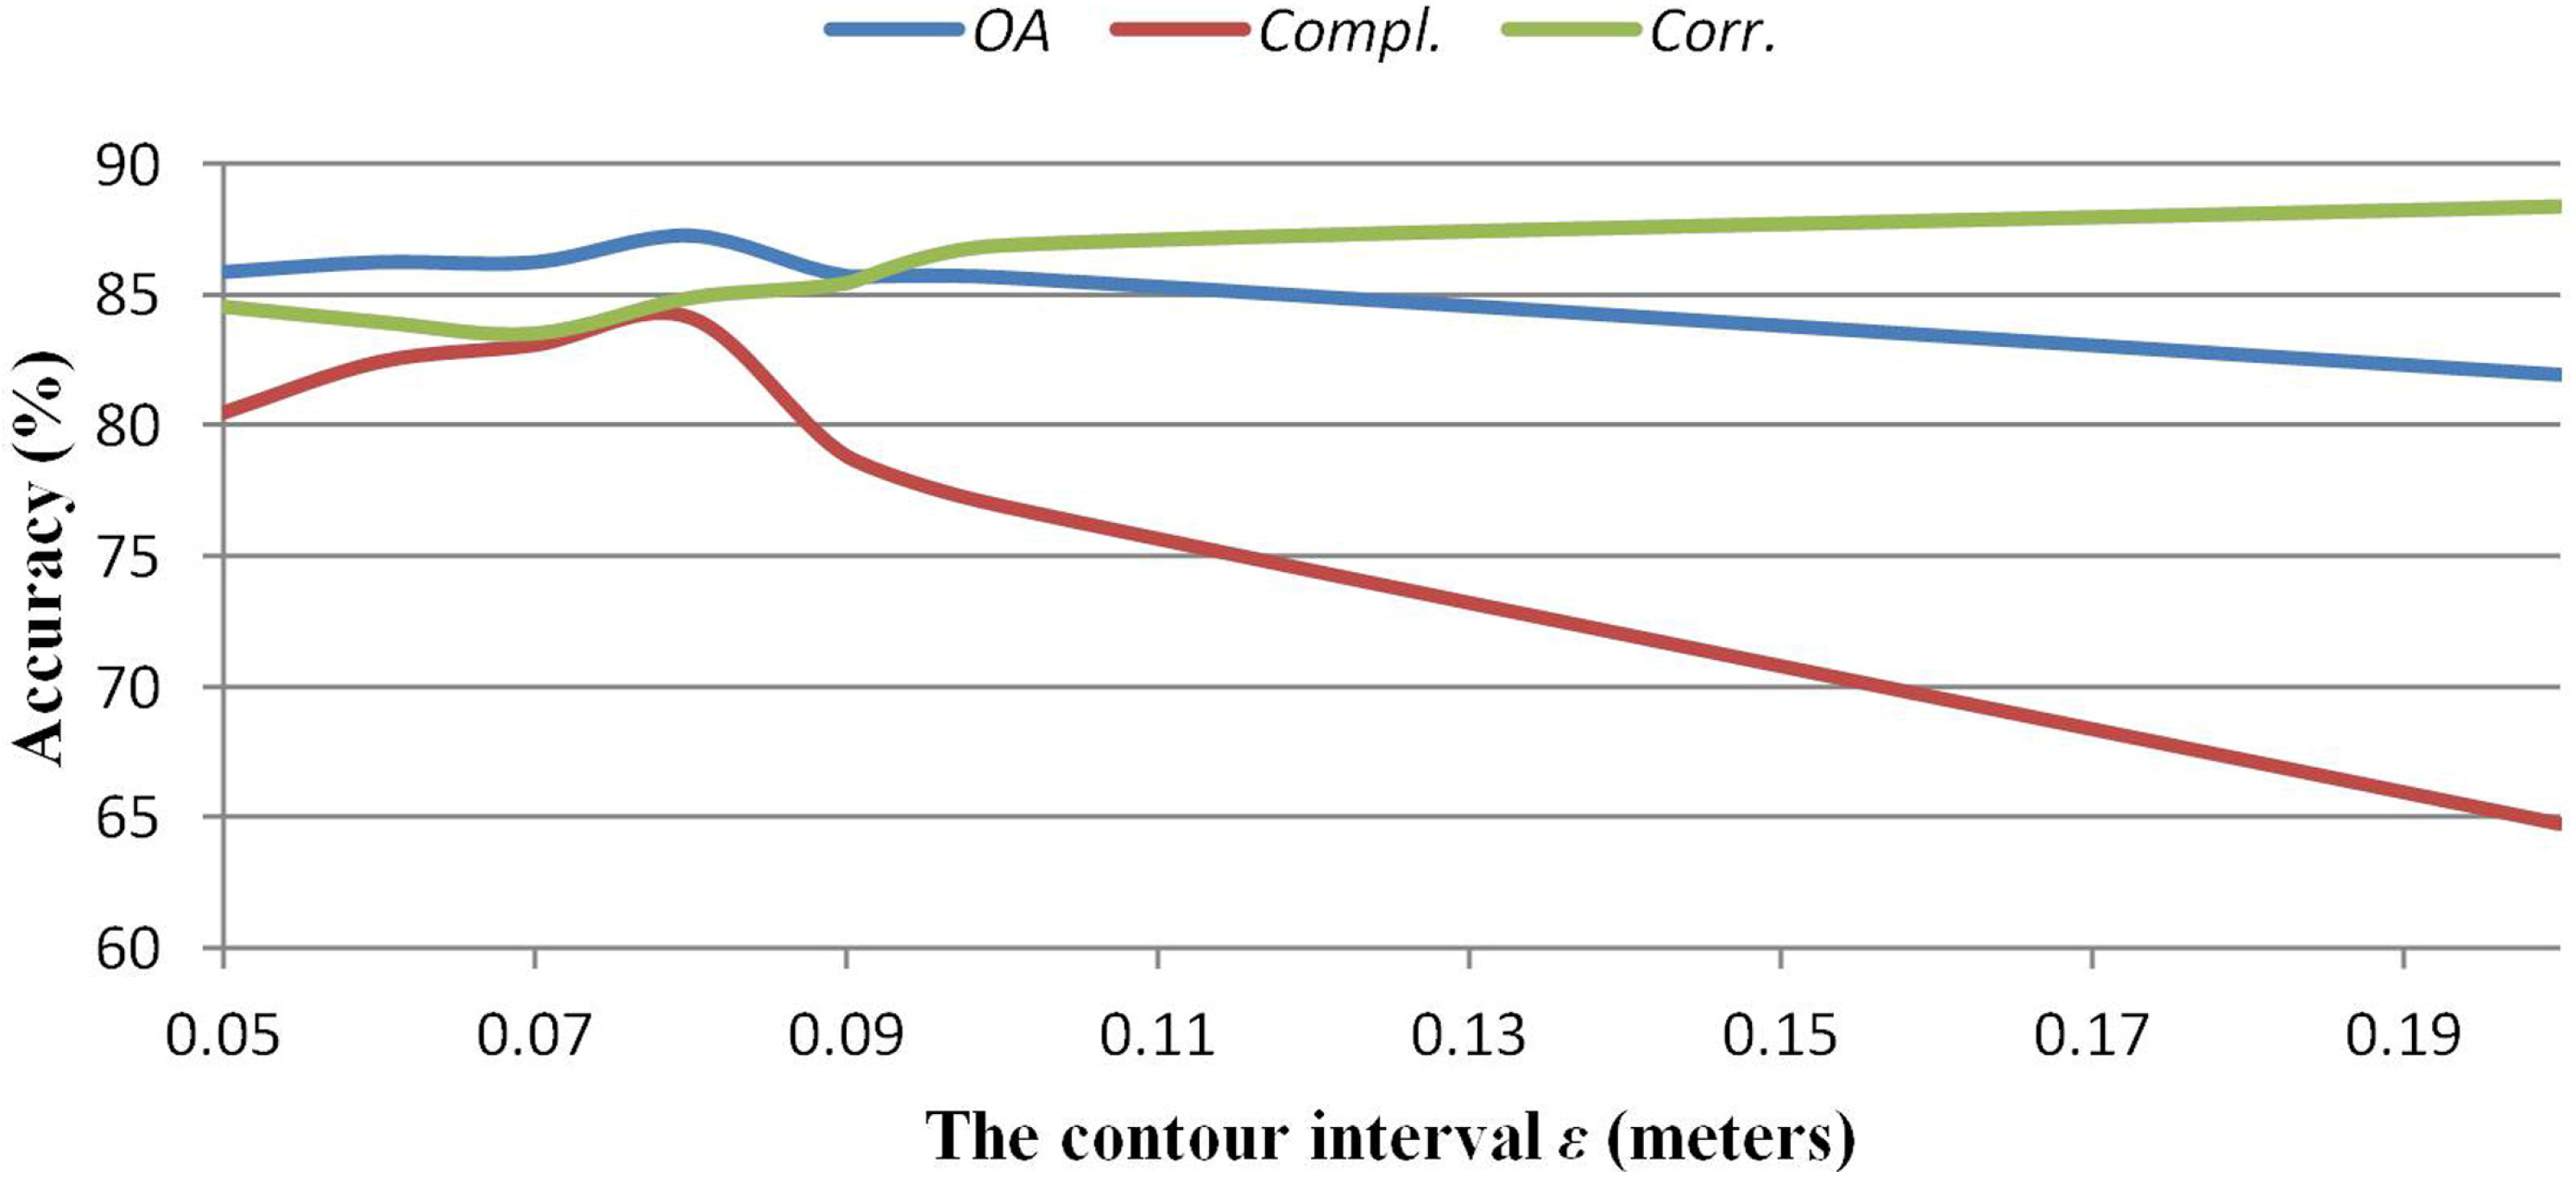
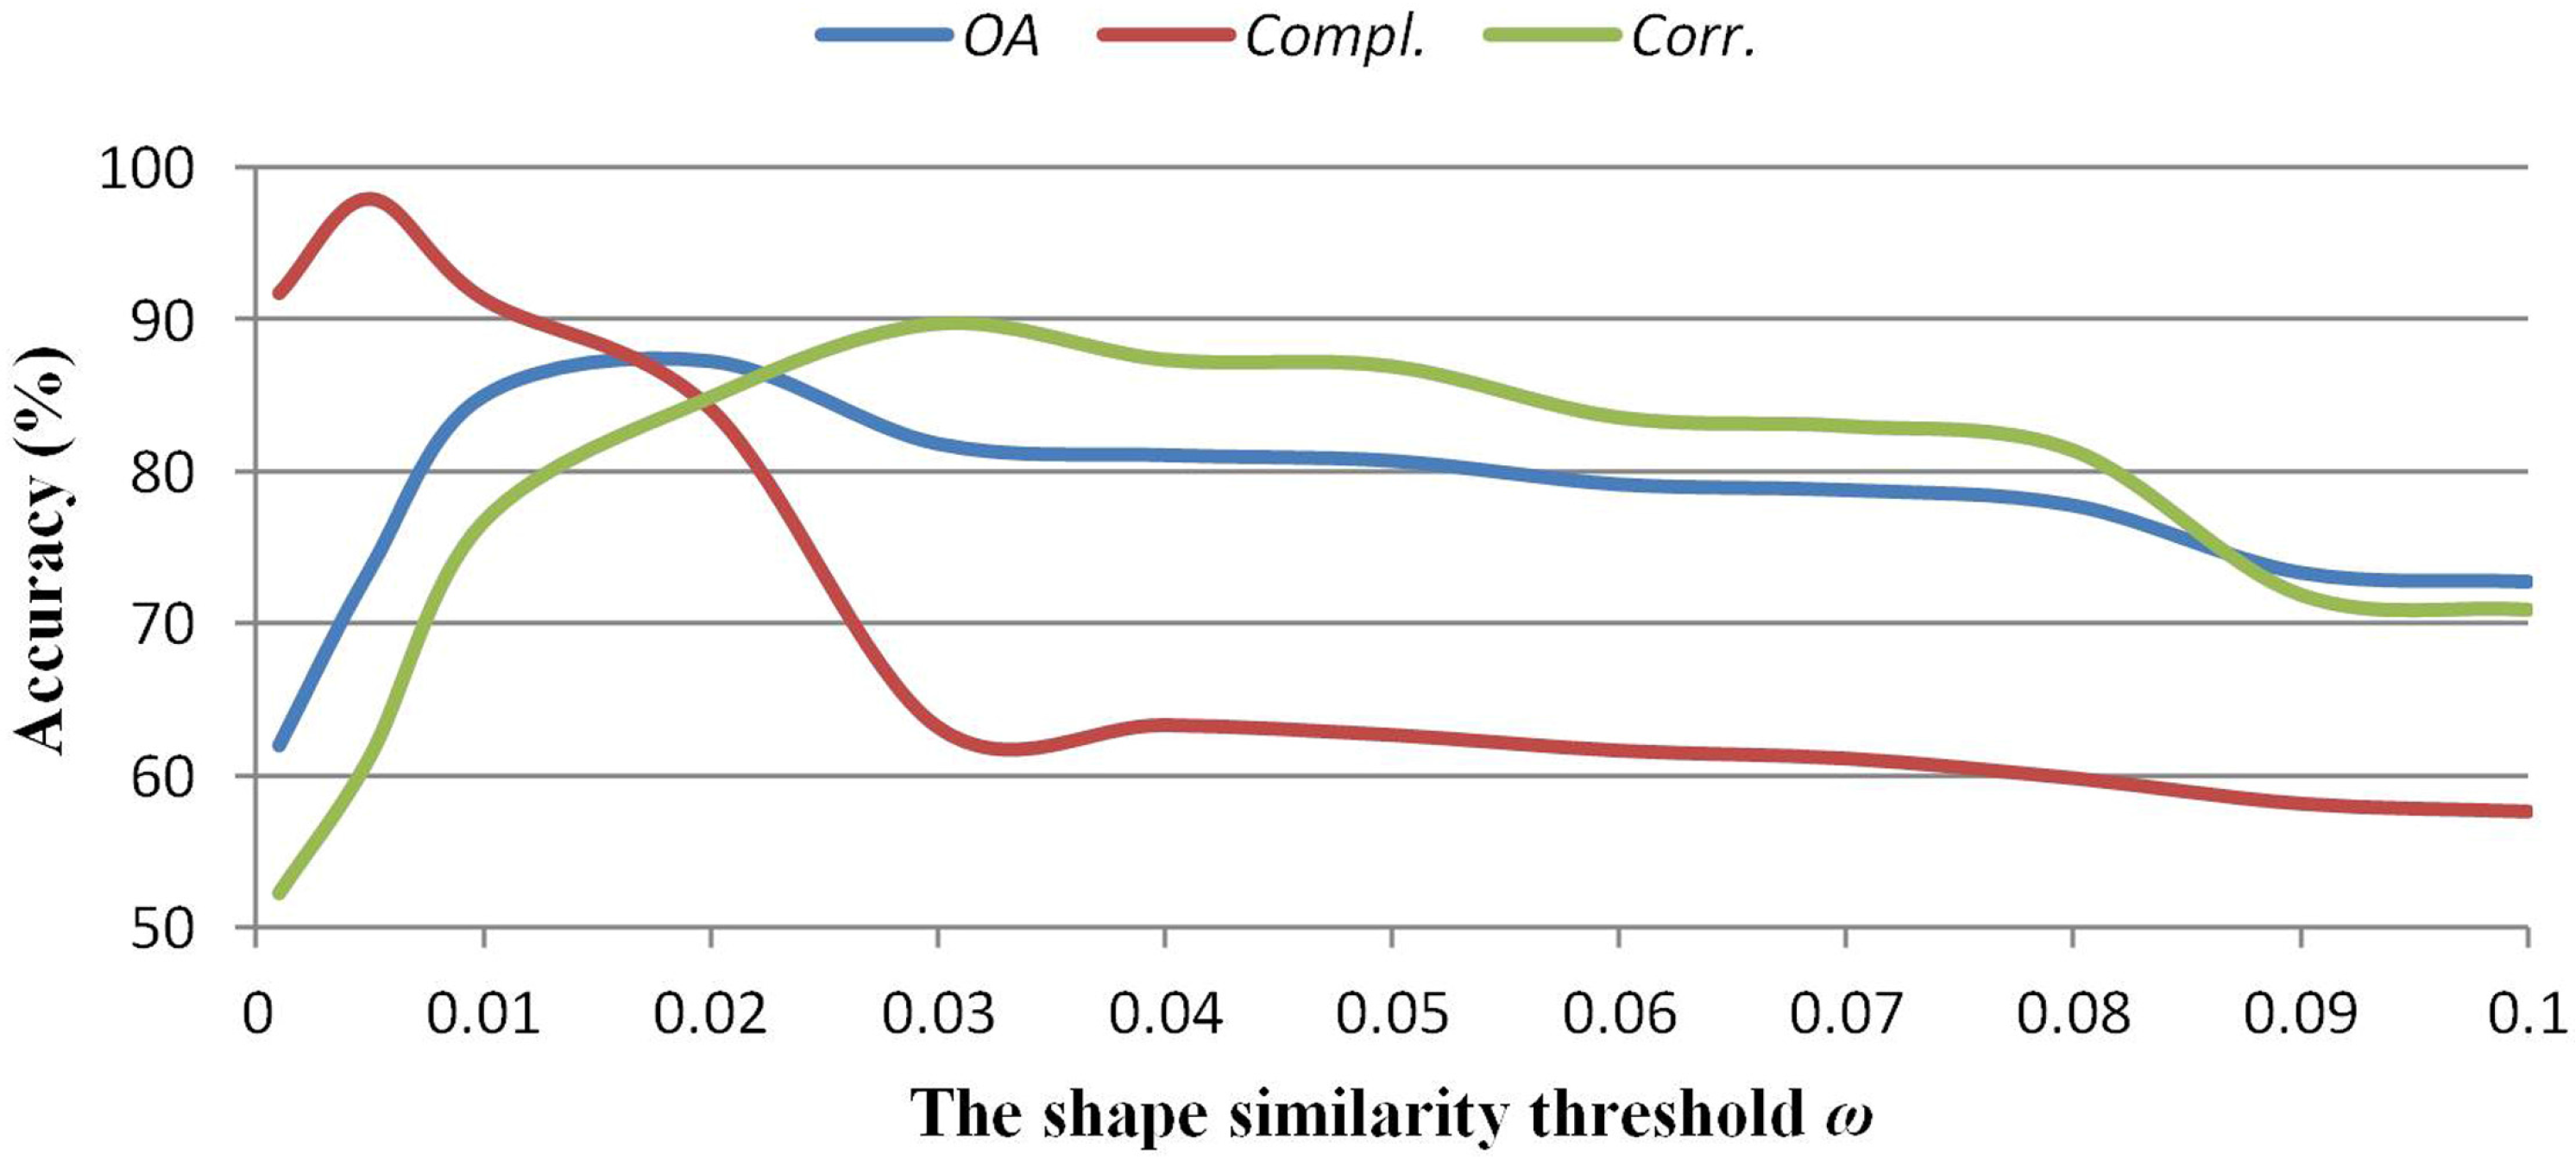
4.3. Parameter Selection and Sensitivity Analysis
4.4. Comparison
5. Conclusions
Acknowledgments
Author Contributions
Conflicts of Interest
References
- Lu, H.; Kohiyama, M.; Horie, K.; Maki, N.; Hayashi, H.; Tanaka, S. Building damage and casualties after an earthquake. Nat. Hazards 2003, 29, 387–403. [Google Scholar]
- Ghosh, S.; Huyck, C.K.; Greene, M.; Gill, S.P.; Bevington, J.; Svekla, W.; DesRoches, R.; Eguchi, R.T. Crowdsourcing for rapid damage assessment: The Global Earth Observation Catastrophe Assessment Network (Geo-Can). Earthq. Spectra 2011, 27, S179–S198. [Google Scholar] [CrossRef]
- Erdik, M.; Şeşetyan, K.; Demircioğlu, M.B.; Hancılar, U.; Zülfikar, C. Rapid earthquake loss assessment after damaging earthquakes. Soil Dyn. Earthq. Eng. 2011, 31, 247–266. [Google Scholar] [CrossRef]
- Fernandez Galarreta, J.; Kerle, N.; Gerke, M. UVA-based urban structural damage assessment using object-based image analysis and semantic reasoning. Nat. Hazard. Earth Syst. 2015, 15, 1087–1101. [Google Scholar] [CrossRef]
- Ehrlich, D.; Guo, H.D.; Molch, K.; Ma, J.W.; Pesaresi, M. Identifying damage caused by the 2008 Wenchuan earthquake from VHR remote sensing data. Int. J. Digit. Earth 2009, 2, 309–326. [Google Scholar]
- Corbane, C.; Saito, K.; Dell’Oro, L.; Bjorgo, E.; Gill, S.P.D.; Piard, E.B.; Huyck, C.K.; Kemper, T.; Lemoine, G.; Spence, R.J.S.; et al. A comprehensive analysis of building damage in the 12 January 2010 Mw7 Haiti earthquake using high-resolution satellite and aerial imagery. Photogramm. Eng. Remote Sens. 2011, 77, 997–1009. [Google Scholar] [CrossRef]
- Dong, P.; Guo, H. A framework for automated assessment of post-earthquake building damage using geospatial data. Int. J. Remote Sens. 2012, 33, 81–100. [Google Scholar] [CrossRef]
- Turker, M.; Sumer, E. Building-based damage detection due to earthquake using the watershed segmentation of the post-event aerial images. Int. J. Remote Sens. 2008, 29, 3073–3089. [Google Scholar] [CrossRef]
- Matsuoka, M.; Yamazaki, F. Use of satellite SAR intensity imagery for detecting building areas damaged due to earthquakes. Earthq. Spectra 2004, 20, 975–994. [Google Scholar] [CrossRef]
- Vu, T.T.; Matsuoka, M.; Yamazaki, F. Detection and animation of damage using very high-resolution satellite data following the 2003 Bam, Iran, earthquake. Earthq. Spectra 2005, 21, 319–327. [Google Scholar] [CrossRef]
- Rathje, E.M.; Kyu-Seok, W.; Crawford, M.; Neuenschwander, A. Earthquake damage identification using multi-temporal high-resolution optical satellite imagery. In Proceedings of the IEEE International Geoscience and Remote Sensing Symposium, Seoul, Korea, 25–29 July 2005; pp. 5045–5048.
- Hoffmann, J. Mapping damage during the Bam (Iran) earthquake using interferometric coherence. Int. J. Remote Sens. 2007, 28, 1199–1216. [Google Scholar] [CrossRef]
- Chini, M.; Bignami, C.; Stramondo, S.; Pierdicca, N. Uplift and subsidence due to the 26 December 2004 Indonesian earthquake detected by SAR data. Int. J. Remote Sens. 2008, 29, 3891–3910. [Google Scholar] [CrossRef]
- Guo, H.; Lu, L.; Ma, J.; Pesaresi, M.; Yuan, F. An improved automatic detection method for earthquake-collapsed buildings from ADS40 image. Chin. Sci. Bull. 2009, 54, 3303–3307. [Google Scholar] [CrossRef]
- Chini, M.; Cinti, F.R.; Stramondo, S. Co-seismic surface effects from very high resolution panchromatic images: The case of the 2005 Kashmir (Pakistan) earthquake. Nat. Hazard. Earth Syst. 2011, 11, 931–943. [Google Scholar] [CrossRef] [Green Version]
- Li, X.; Yang, W.; Ao, T.; Li, H.; Chen, W. An improved approach of information extraction for earthquake-damaged buildings using high-resolution imagery. J. Earthq. Tsunami 2011, 5, 389–399. [Google Scholar] [CrossRef]
- Ma, J.; Qin, S. Automatic depicting algorithm of earthquake collapsed buildings with airborne high resolution image. In Proceedings of the IEEE International Geoscience and Remote Sensing Symposium (IGARSS), Munich, Germany, 22–27 July 2012; IEEE: Munich, Germany, 2012; pp. 939–942. [Google Scholar]
- Dong, L.; Shan, J. A comprehensive review of earthquake-induced building damage detection with remote sensing techniques. ISPRS J. Photogramm. Remote Sens. 2013, 84, 85–99. [Google Scholar] [CrossRef]
- Wehr, A.; Lohr, U. Airborne laser scanning—An introduction and overview. ISPRS J. Photogramm. Remote Sens. 1999, 54, 68–82. [Google Scholar] [CrossRef]
- Schweier, C.; Markus, M.; Steinle, E.; Weidner, U. Casualty scenarios based on laser scanning data. In Proceedings of the 250th Anniversary of 1755 Lisbon Earthquake, Lisbon, Portugal, 1–4 November 2005.
- Stilla, U.; Soergel, U.; Thoennessen, U. Potential and limits of InSAR data for building reconstruction in built-up areas. ISPRS J. Photogramm. Remote Sens. 2003, 58, 113–123. [Google Scholar] [CrossRef]
- Plank, S. Rapid damage assessment by means of multi-temporal SAR—A comprehensive review and outlook to Sentinel-1. Remote Sens. 2014, 6, 4870–4906. [Google Scholar] [CrossRef]
- Dell’Acqua, F.; Gamba, P. Remote sensing and earthquake damage assessment: Experiences, limits, and perspectives. Proc. IEEE 2012, 100, 2876–2890. [Google Scholar] [CrossRef]
- Awrangjeb, M. Effective generation and update of a building map database through automatic building change detection from LiDAR point cloud data. Remote Sens. 2015, 7, 14119–14150. [Google Scholar] [CrossRef]
- Olsen, M.J.; Chen, Z.; Hutchinson, T.; Kuester, F. Optical techniques for multiscale damage assessment. Geomat. Nat. Hazards Risk 2013, 4, 49–70. [Google Scholar] [CrossRef]
- Yamazaki, F.; Matsuoka, M. Remote sensing technologies in post-disaster damage assessment. J. Earthq. Tsunami 2007, 1, 193–210. [Google Scholar] [CrossRef]
- Li, L.; Zhang, B.; Wu, Y. Fusing spectral and texture information for collapsed buildings detection in airborne image. In Proceedings of the 2012 IEEE International Geoscience and Remote Sensing Symposium (IGARSS), Munich, Germany, 22–27 July 2012; pp. 186–189.
- Radhika, S.; Tamura, Y.; Matsui, M. Use of post-storm images for automated tornado-borne debris path identification using texture-wavelet analysis. J. Wind Eng. Ind. Aerodyn. 2012, 107–108, 202–213. [Google Scholar] [CrossRef]
- Vetrivel, A.; Gerke, M.; Kerle, N.; Vosselman, G. Identification of damage in buildings based on gaps in 3D point clouds from very high resolution oblique airborne images. ISPRS J. Photogramm. Remote Sens. 2015, 105, 61–78. [Google Scholar] [CrossRef]
- Rehor, M.; Bähr, H.; Tarsha-Kurdi, F.; Landes, T.; Grussenmeyer, P. Improvement of building damage detection and classification based on laser scanning data by integrating spectral information. Int. Arch. Photogramm. Spat. Inf. Sci. 2008, 37, 1599–1605. [Google Scholar]
- Shen, Y.; Wu, L.; Wang, Z. Identification of inclined buildings from aerial LiDAR data for disaster management. In Proceedings of the 2010 18th International Conference on Geoinformatics, Beijing, China, 18–20 June 2010; Institute of Electrical and Electronics Engineers: Beijing, China, 2010; pp. 1–5. [Google Scholar]
- Gerke, M.; Kerle, N. Graph matching in 3D space for structural seismic damage assessment. In Proceedings of the 2011 IEEE International Conference on Computer Vision Workshops (ICCV Workshops), Barcelona, Spain, 6–13 November 2011; Institute of Electrical and Electronics Engineers: Barcelona, Spain, 2011; pp. 204–211. [Google Scholar]
- Gerke, M.; Kerle, N. Automatic structural seismic damage assessment with airborne oblique pictometry @ imagery. Photogramm. Eng. Remote Sens. 2011, 77, 885–898. [Google Scholar] [CrossRef]
- Schweier, C.; Markus, M. Classification of collapsed buildings for fast damage and loss assessment. Bull. Earthq. Eng. 2006, 4, 177–192. [Google Scholar] [CrossRef]
- Schweier, C.; Markus, M. Assessment of the search and rescue demand for individual buildings. In Proceedings of the 13th World Conference on Earthquake Engineering, Vancouver, BC, Canada, 1–6 August 2004.
- Rehor, M. Classification of building damage based on laser scanning data. Int. Arch. Photogramm. Spat. Inf. Sci. 2007, 20, 54–63. [Google Scholar]
- Khoshelham, K.; Nardinocchi, C.; Frontoni, E.; Mancini, A.; Zingaretti, P. Performance evaluation of automated approaches to building detection in multi-source aerial data. ISPRS J. Photogramm. Remote Sens. 2010, 65, 123–133. [Google Scholar] [CrossRef]
- Van der Sande, C.; Soudarissanane, S.; Khoshelham, K. Assessment of relative accuracy of AHN-2 laser scanning data using planar features. Sensors 2010, 10, 8198–8214. [Google Scholar] [CrossRef] [PubMed]
- Vosselman, G.; Gorte, B.G.; Sithole, G.; Rabbani, T. Recognising structure in laser scanner point clouds. Int. Arch. Photogramm. Spat. Inf. Sci. 2004, 46, 33–38. [Google Scholar]
- Rehor, M.; Bähr, H.P. Segmentation of damaged buildings from laser scanning data. Int. Arch. Photogramm. Spat. Inf. Sci. 2006, 36, 67–72. [Google Scholar]
- Rehor, M.; Bähr, H.; Tarsha-Kurdi, F.; Landes, T.; Grussenmeyer, P. Contribution of two plane detection algorithms to recognition of intact and damaged buildings in LiDAR data. Photogramm. Rec. 2008, 23, 441–456. [Google Scholar] [CrossRef]
- Labiak, R.C.; Van Aardt, J.A.; Bespalov, D.; Eychner, D.; Wirch, E.; Bischof, H.-P. Automated method for detection and quantification of building damage and debris using post-disaster LiDAR data. SPIE 8037 2011. [Google Scholar] [CrossRef]
- Khoshelham, K.; Oude Elberink, S.; Sudan, X. Segment-based classification of damaged building roofs in aerial laser scanning data. IEEE Geosci. Remote Sens. Lett. 2013, 10, 1258–1262. [Google Scholar] [CrossRef]
- Oude Elberink, S.; Shoko, M.A.; Fathi, S.A.; Rutzinger, M. Detection of collapsed buildings by classifying segmented airborne laser scanner data. Int. Arch. Photogramm. Spat. Inf. Sci. 2012, 38, 307–312. [Google Scholar] [CrossRef]
- Khoshelham, K.; Oude Elberink, S. Role of dimensionality reduction in segment-based classification of damaged building roofs in airborne laser scanning data. In Proceedings of the International Conference on Geographic Object Based Image Analysis, Rio de Janeiro, Brazil, 7–9 May 2012; pp. 372–377.
- Engels, J.; Arefi, H.; Hahn, M. Generation of roof topologies using plane fitting with RANSAC. ISPRS J. Photogramm. Remote Sens. 2008, 37, 119–126. [Google Scholar]
- Oude Elberink, S.; Vosselman, G. Quality analysis on 3D building models reconstructed from airborne laser scanning data. ISPRS J. Photogramm. Remote Sens. 2011, 66, 157–165. [Google Scholar] [CrossRef]
- Li, Y.; Ma, H.; Wu, J. Planar segmentation and topological reconstruction for urban buildings with LiDAR point clouds. Proc. SPIE 2011, 8286. [Google Scholar] [CrossRef]
- Song, J.; Wu, J.; Jiang, Y. Extraction and reconstruction of curved surface buildings by contour clustering using airborne LiDAR data. Optik 2015, 126, 513–521. [Google Scholar] [CrossRef]
- Ren, Z.; Cen, M.; Zhang, T. Building extraction from LiDAR data based on shape analysis of contours. J. Southwest 2009, 44, 83–88. [Google Scholar]
- Ren, Z. Building and Road Extraction from Lidar Data Based on Contour Feature Analysis. Ph.D. Thesis, Southwest Jiaotong University, Chengdu, China, 2009. [Google Scholar]
- Zhang, J.; Li, L.; Lu, Q.; Jiang, W. Contour clustering analysis for building reconstruction from LiDAR data. In Proceedings of the International Archives of the Photogrammetry, Remote Sensing and Spatial Information Sciences, Beijing, China, 18 May 2008; pp. 355–360.
- He, M.; Zhu, Q.; Du, Z.; Zhang, Y.; Hu, H.; Lin, Y.; Qi, H. Contour cluster shape analysis for building damage detection from post-earthquake airborne LiDAR. Acta Geod. Cartogr. Sin. 2015, 44, 407–413. [Google Scholar]
- Mongus, D.; Žalik, B. Parameter-free ground filtering of LiDAR data for automatic DTM generation. ISPRS J. Photogramm. Remote Sens. 2012, 67, 1–12. [Google Scholar] [CrossRef]
- Hu, H.; Ding, Y.; Zhu, Q.; Wu, B.; Lin, H.; Du, Z.; Zhang, Y.; Zhang, Y. An adaptive surface filter for airborne laser scanning point clouds by means of regularization and bending energy. ISPRS J. Photogramm. Remote Sens. 2014, 92, 98–111. [Google Scholar] [CrossRef]
- Guilbert, E. Multi-level representation of terrain features on a contour map. Geoinformatica 2013, 17, 301–324. [Google Scholar] [CrossRef]
- Shannon, C.E. A mathematical theory of communication. Bell Syst. Tech. J. 1948, 27, 379–423. [Google Scholar] [CrossRef]
- Chang, C.I.; Du, Y.; Wang, J.; Guo, S.M.; Thouin, P.D. Survey and comparative analysis of entropy and relative entropy thresholding techniques. IEE Proc. Vis. Image Signal Process. 2006, 153, 837–850. [Google Scholar] [CrossRef]
- Li, Z.; Huang, P. Quantitative measures for spatial information of maps. Int. J. Geogr. Inf. Sci. 2002, 16, 699–709. [Google Scholar] [CrossRef]
- Jones, N.L.; Kennard, M.J.; Zundel, A.K. Fast algorithm for generating sorted contour strings. Comput. Geosci. 2000, 26, 831–837. [Google Scholar] [CrossRef]
- Wang, T. An algorithm for extracting contour lines based on interval tree from grid DEM. Geospat. Inf. Sci. 2008, 11, 103–106. [Google Scholar] [CrossRef]
- Kweon, I.S.; Kanade, T. Extracting topographic terrain features from elevation maps. CVGIP Image Underst. 1994, 59, 171–182. [Google Scholar] [CrossRef]
- Cronin, T. Automated reasoning with contour maps. Comput. Geosci. 1995, 21, 609–618. [Google Scholar] [CrossRef]
- Folkers, A.; Samet, H. Content-based image retrieval using Fourier descriptors on a logo database. In Proceedings of the 16th International Conference on Pattern Recognition, Quebec, QC, Canada, 11–15 August 2002; pp. 521–524.
- Zhang, D.; Lu, G. Review of shape representation and description techniques. Pattern Recognit. 2004, 37, 1–19. [Google Scholar] [CrossRef]
- Wong, W.; Shih, F.Y.; Liu, J. Shape-based image retrieval using support vector machines, Fourier descriptors and self-organizing maps. Inform. Sci. 2007, 177, 1878–1891. [Google Scholar] [CrossRef]
- Duan, W.; Kuester, F.; Gaudiot, J.; Hammami, O. Automatic object and image alignment using Fourier descriptors. Image Vis. Comput. 2008, 26, 1196–1206. [Google Scholar] [CrossRef]
- Pun, T. A new method for grey-level picture thresholding using the entropy of the histogram. Signal Process. 1980, 2, 223–237. [Google Scholar] [CrossRef]
- Kapur, J.N.; Sahoo, P.K.; Wong, A.K.C. A new method for gray-level picture thresholding using the entropy of the histogram. Comput. Vis. Graph. Image Process. 1985, 29, 273–285. [Google Scholar] [CrossRef]
- Yimit, A.; Hagihara, Y.; Miyoshi, T.; Hagihara, Y. 2-D direction histogram based entropic thresholding. Neurocomputing 2013, 120, 287–297. [Google Scholar] [CrossRef]
- M7.0—Haiti Region. Available online: http://earthquake.usgs.gov/earthquakes/eventpage/usp000h60h#general_summary (accessed on 10 October 2015).
- World Bank—Imagecat Inc. Rit Haiti Earthquake LiDAR Dataset. Available online: http://opentopo.sdsc.edu.gridsphere/gridsphere?cid=geonlidarframeportlet&gs_action=lidarDataset&opentopoID=OTLAS.072010.32618.1 (accessed on 10 October 2015).
- Haiti Earthquake 2010: Remote Sensing Based Building Damage Assessment Data. Available online: http://www.unitar.org/unosat/haiti-earthquake-2010-remote-sensing-based-building-damage-assessment-data (accessed on 10 October 2015).
- Bevington, J.; Adams, B.; Eguchi, R. Geo-Can debuts to map Haiti damage. Imaging Notes 2010, 25, 26–30. [Google Scholar]
- Kerle, N.; Hoffman, R.R. Collaborative damage mapping for emergency response: The role of cognitive systems engineering. Nat. Hazards Earth Syst. 2013, 13, 97–113. [Google Scholar] [CrossRef]
- Ziadat, F.M. Effect of contour intervals and grid cell size on the accuracy of DEMs and slope derivatives. Trans. GIS 2007, 11, 67–81. [Google Scholar] [CrossRef]


| Procedure | Symbol | Value | Set Mode | Description |
|---|---|---|---|---|
| Data preprocessing | λ | 0.1 m | Experimentally | The grid cell size of DSM |
| Feature extraction | ε | 0.08 m | Experimentally | The contour interval |
| ω | 0.02 | Experimentally | The shape similarity threshold | |
| Damaged roof detection | ϕ | 0.05 | Experimentally | The bin width of the histogram |
| δ | 0.4269 | Automatically | The threshold of the 3D shape descriptor |
| Roof Status | Reference Data | |||
|---|---|---|---|---|
| Intact | Damage | Row Total | Corr. | |
| Intact | 985 | 123 | 1108 | 88.90% |
| Damage | 115 | 652 | 767 | 85.01% |
| Column Total | 1100 | 775 | 1875 | |
| Compl. | 89.55% | 84.13% | ||
| OA | 87.31% | |||
| KA | 73.79% | |||
| Methods | Damage Types | ||||||
|---|---|---|---|---|---|---|---|
| Surface Damages | Structure Damages | ||||||
| Multilayer Collapse (2) | Top story Pancake Collapse (4c, 5, 5c) | Heap of Debris (6, 7a, 7c) | Heap of Debris with Planes (3, 7b) | Inclined Plane (1) | Middle or Lower Story Pancake Collapse (4a, 4b, 5a, 5b) | Inclination (9a) | |
| Rehor et al. [40] | √ | √ | √ | √ | ╳ | ╳ | ╳ |
| Rehor et al. [41] | √ | √ | √ | √ | ╳ | ╳ | ╳ |
| Labiak et al. [42] | √ | √ | √ | √ | ╳ | ╳ | ╳ |
| Oude Elberink et al. [44] | √ | √ | √ | √ | ╳ | ╳ | ╳ |
| Shen et al. [31] | ╳ | ╳ | ╳ | ╳ | √ | √ | √ |
| Gerke and Kerle [32] | √ | √ | √ | √ | ╳ | ╳ | √ |
| Vetrivel et al. [29] | ╳ | ╳ | ╳ | ╳ | ╳ | ╳ | ╳ |
| Fernandez Galarreta et al. [4] | √ | √ | √ | √ | √ | √ | √ |
| The proposed method | √ | √ | √ | √ | √ | √ | √ |
© 2016 by the authors; licensee MDPI, Basel, Switzerland. This article is an open access article distributed under the terms and conditions of the Creative Commons by Attribution (CC-BY) license (http://creativecommons.org/licenses/by/4.0/).
Share and Cite
He, M.; Zhu, Q.; Du, Z.; Hu, H.; Ding, Y.; Chen, M. A 3D Shape Descriptor Based on Contour Clusters for Damaged Roof Detection Using Airborne LiDAR Point Clouds. Remote Sens. 2016, 8, 189. https://doi.org/10.3390/rs8030189
He M, Zhu Q, Du Z, Hu H, Ding Y, Chen M. A 3D Shape Descriptor Based on Contour Clusters for Damaged Roof Detection Using Airborne LiDAR Point Clouds. Remote Sensing. 2016; 8(3):189. https://doi.org/10.3390/rs8030189
Chicago/Turabian StyleHe, Meizhang, Qing Zhu, Zhiqiang Du, Han Hu, Yulin Ding, and Min Chen. 2016. "A 3D Shape Descriptor Based on Contour Clusters for Damaged Roof Detection Using Airborne LiDAR Point Clouds" Remote Sensing 8, no. 3: 189. https://doi.org/10.3390/rs8030189