Article

Global and Regional Variability and Change in Terrestrial Ecosystems Net Primary Production and NDVI: A Model-Data Comparison

1
Joint Global Change Research Institute, Pacific Northwest National Lab, College Park, MD 20740, USA
2
Department of Atmospheric and Oceanic Sciences, University of Maryland, College Park, MD 20740, USA
3
Potsdam Institute for Climate Impact Research, Telegraphenberg, 14412 Potsdam, Germany
4
Remote Sensing Laboratories, Department of Geography, University of Zurich, Winterthurerstrasse 190, 8057 Zurich, Switzerland
*
Author to whom correspondence should be addressed.
Remote Sens. 2016, 8(3), 177; https://doi.org/10.3390/rs8030177
Submission received: 16 November 2015 / Revised: 27 January 2016 / Accepted: 14 February 2016 / Published: 25 February 2016
(This article belongs to the Special Issue Remote Sensing of Vegetation Structure and Dynamics)

Abstract

:
The net primary productivity (NPP) is commonly used for understanding the dynamics of terrestrial ecosystems and their role in carbon cycle. We used a combination of the most recent NDVI and model-based NPP estimates (from five models of the TRENDY project) for the period 1982–2012, to study the role of terrestrial ecosystems in carbon cycle under the prevailing climate conditions. We found that 80% and 67% of the global land area showed positive NPP and NDVI values, respectively, for this period. The global NPP was estimated to be about 63 Pg C·y−1, with an increase of 0.214 Pg C·y−1·y−1. Similarly, the global mean NDVI was estimated to be 0.33, with an increasing trend of 0.00041 y−1. The spatial patterns of NPP and NDVI demonstrated substantial variability, especially at the regional level, for most part of the globe. However, on temporal scale, both global NPP and NDVI showed a corresponding pattern of increase (decrease) for the duration of this study except for few years (e.g., 1990 and 1995–1998). Generally, the Northern Hemisphere showed stronger NDVI and NPP increasing trends over time compared to the Southern Hemisphere; however, NDVI showed larger trends in Temperate regions while NPP showed larger trends in Boreal regions. Among the five models, the maximum and minimum NPP were produced by JULES (72.4 Pg C·y−1) and LPJ (53.72 Pg C·y−1) models, respectively. At latitudinal level, the NDVI and NPP ranges were ~0.035 y−1 to ~−0.016 y−1 and ~0.10 Pg C·y−1·y−1 to ~−0.047 Pg C·y−1·y−1, respectively. Overall, the results of this study suggest that the modeled NPP generally correspond to the NDVI trends in the temporal dimension. The significant variability in spatial patterns of NPP and NDVI trends points to a need for research to understand the causes of these discrepancies between molded and observed ecosystem dynamics, and the carbon cycle.

Graphical Abstract

1. Introduction

Terrestrial ecosystems play a major role in the global carbon cycle and Earth’s climate system through regulating the atmospheric carbon dioxide (CO2) concentrations [1]. The terrestrial ecosystems net primary production (NPP) relates to the carbon flux by plant photosynthesis and is used for understanding the dynamics of terrestrial ecosystems and their contribution to carbon cycle. The inherent variability of global NPP over space and time cannot be directly observed, therefore, satellite based observations of Normalized Difference Vegetation Index (NDVI) and other proxy measures are commonly used to monitor spatial and temporal changes in land productivity [2,3,4].
Understanding the spatial and inter-annual variability of vegetation activity using NDVI assumes that changes in NDVI present evidences about the vegetation’s response to climate [5]. However, the response signal of vegetation canopy reflectance is delicate and influenced by non-vegetation effects (e.g., atmospheric conditions, satellite drift and zonal zenith angle). Despite this complexity, the NDVI relationship with ecosystems photosynthetic capacity has proven to be a robust signal under a wide range of environmental conditions, and a reliable observation for studying terrestrial ecosystems. For example, Fang et al. [3] and Zhou et al. [4] reported NDVI as a proxy to examine the inter-annual and spatial vegetation activities in China and Northern high latitudes, respectively. Similarly, Higginbottom and Symeonakis [6] used NDVI as a mean to quantify the land degradation and desertification associated with vegetation distribution and activities. In another study, de Jong et al. [7] used vegetation indices to examine the relationship between climate constraints (temperature, precipitation and radiation) and vegetation activity. Even though these studies have illustrated the relationship between NDVI and NPP; detailed understanding of their spatial and temporal trends is still lacking [4,8,9].
The NPP, i.e., the net amount of dry organic matter produced by plants, largely reflects the ability of plants to absorb atmospheric CO2 and to convert it to biomass through photosynthesis [10]. Thus, understanding the spatial and temporal variations of NPP are of great interest for obtaining reliable estimates of terrestrial ecosystem capacity to serve as a major reservoir for carbon. Spatial variations of global NPP are mainly controlled by climate conditions, vegetation types and their spatial distribution, and factors that contribute to change this distribution such as land-use practices [11,12]. Similarly, the temporal variations of NPP are mainly controlled by the seasonal phenology of vegetation, and climate conditions [11,12].
During the last few decades, ecosystem models have become a major tool for studying the NPP dynamics under different climate conditions/scenarios. These models have been repeatedly evaluated for a variety of conditions to test their robustness in capturing the spatial and temporal patterns of change in ecosystems’ attributes such as NPP [8,10,13]. However, there is significant variability among these models’ results due to differences in formulation of ecosystem processes, underlying assumptions for their formulation in these models, and the uncertainties associated with observations used in understanding these processes [14,15]. For assessing NPP and its spatial and temporal trends, quite often a combination of models and observational proxies (e.g., NDVI) are used [16,17] to ensure the reliability of the results.
The NDVI is largely influenced by both biophysical (e.g., vegetation cover, biomass, plant and soil moisture) and other (satellite drift, calibration uncertainties, atmospheric conditions and volcanic eruptions) factors [18], thus the NDVI trends do not present a monotonic behavior and can change in response to environmental conditions e.g., temperature and precipitation [9]. Peak NDVI value gives an integrated view of ecosystems’ photosynthetic activity influenced by the prevailing environmental conditions [19,20]. Therefore, the spatial and temporal changes in NDVI can be used as an observational proxy to study the global, regional and temporal changes in NPP.
In this study, we used a combination of observed NDVI from multi-decadal satellite observations together with modeled NPP for the period 1982–2012, to study the role of terrestrial ecosystems in the carbon cycle under the prevailing climate conditions. Our main objectives were: (1) to evaluate the spatial (i.e., global and regional) pattern in modeled NPP trends against observed NDVI; (2) to examine the temporal changes in modeled NPP against observed NDVI; and (3) study the latitudinal changes in modeled NPP with respect to observed NDVI, to understand the response of terrestrial ecosystems to prevailing climate conditions and the potential perturbation to the carbon cycle due to these changes.

2 Methods

2.1. NDVI Dataset

The NDVI is the normalized difference between red and near infrared reflected radiation from the Earth’s surface as measured by the space-borne sensors, and it represents the plants/ecosystems photosynthetic activity [3,21]. Furthermore, seasonal rise and fall in NDVI represent changes in the growing season in response to environmental and biophysical conditions [22]. The National Oceanographic and Atmospheric Administration (NOAA) polar orbiting environmental satellites have acquired more than three decades of Earth observations using the advanced very high-resolution radiometer (AVHRR) sensors [23]. This data set has been updated periodically at different temporal and spatial resolutions since 1982. It is processed consistently to develop a long-term record by the Global Inventory Monitoring and Modeling System (GIMMS) project at the NASA Goddard Space Flight Center [24]. The spatial and temporal resolution of GIMMS data is 8 km × 8 km and 15 days, respectively.

2.2. Ecosystem Models

We used five terrestrial ecosystem models: VEGAS (Vegetation Global Atmosphere Soils), OCN (Organizing Carbon and Hydrology In Dynamic Ecosystems (Orchidee)-Carbon Nitrogen), LPJ (Lund-Potsdam-Jena), JULES (Joint UK Land Environment Simulator) and CLM4.5 (Community Land Model Version 4.5), from the TRENDY (Trends and drivers of the regional scale sources and sinks of carbon dioxide) project [25]. Description of these models and the TRENDY dataset are given in Table 1. Although the chosen five models contain different dynamic vegetation sub-models, there are fundamental commonalities in their carbon cycle representation. In all five models, plants are generally categorized into different plant functional types (PFTs). Some models show higher number of PFTs (e.g., OCN with 12 PFTs) than others (e.g., JULES with 5 PFTs). Across the models, the processes of photosynthesis (P), maintenance respiration (MR) and growth respiration (GR) are broadly similar for each PFT. However, their specific parameters and conditions may differ from model to model [26]. The sum of MR and GR is categorized as the autotrophic respiration (AR). In each model, gross primary productivity (GPP) is a measure of carbon absorption by plants per unit time (T) and space. NPP is determined as the difference between GPP and AR. Mathematically, NPP = GPP − AR = GPP − MR − GR.
We used primarily the simulated NPP estimates from these five models for the period of 1982 to 2012. The models’ simulations were performed using the protocol established by the TRENDY project, including time variant CO2 concentrations, climate, and land use change. The CRU (Climate Research Unit) at the University of East Anglia, United Kingdom, and NCEP (U.S. National Center for Environmental Predictions) climate forcing data for the period of 1901 to 2010 was used in these simulations. The global atmospheric CO2 for the period of 1860 to 2012 was assembled at annual time steps from ice-cores and other sources by NOAA. The land-use change data for the S3 case (constant crops and pasture distribution since 1860) scenario of TRENDY simulations was obtained from the Hyde (History Database of the Global Environment) database. Further detail about models simulations can be found at http://dgvm.ceh.ac.uk/node/9.

2.3. Analysis

The observed NDVI and simulated NPP data were aggregated (areal mean) to the same spatial resolution of 0.5° (unless specified otherwise). In cases where NDVI values were lower than the 0.05 threshold value, they were set equal to 0.05 (following [27]). The bimonthly NDVI data were aggregated to monthly values. The temporal and spatial trends in both NDVI and NPP data were estimated using well established and commonly used linear method [9], at the probability level of 0.05 significance. Model evaluation against NDVI was carried out both for individual models, and for their ensemble (MME). For spatial analysis, the fraction of NDVI and NPP were used to estimate the fractional vegetation cover. Similarly, for temporal analysis, the NPP and NDVI values were examined for Boreal (50°N to 90°N), Temperate (25°N to 50°N), Tropics (25°S to 25°N), and Extra Tropics (25°S to 90°S) regions. Both NDVI and NPP trends were presented as the percent increase over the year, and benchmarked to the base-year of 1982. For latitudinal trends, both NPP and NDVI were first aggregated to 2.5 degree resolution. Then, the aggregated NPP and NDVI values were summed and averaged over 2.5 degree bands, respectively to derive the latitudinal trends. Our analysis considers the whole year data from 1 January to 31 December of each year.

3. Results

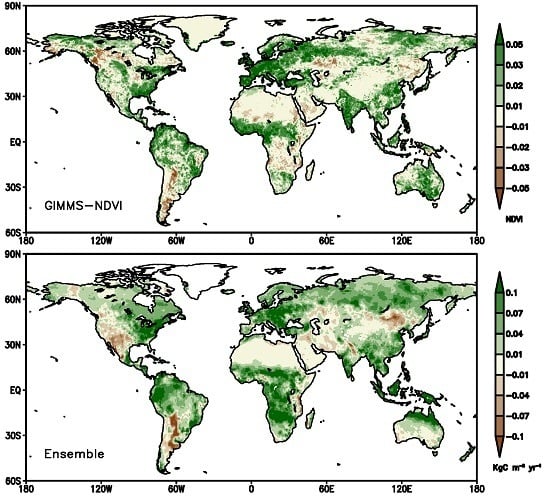
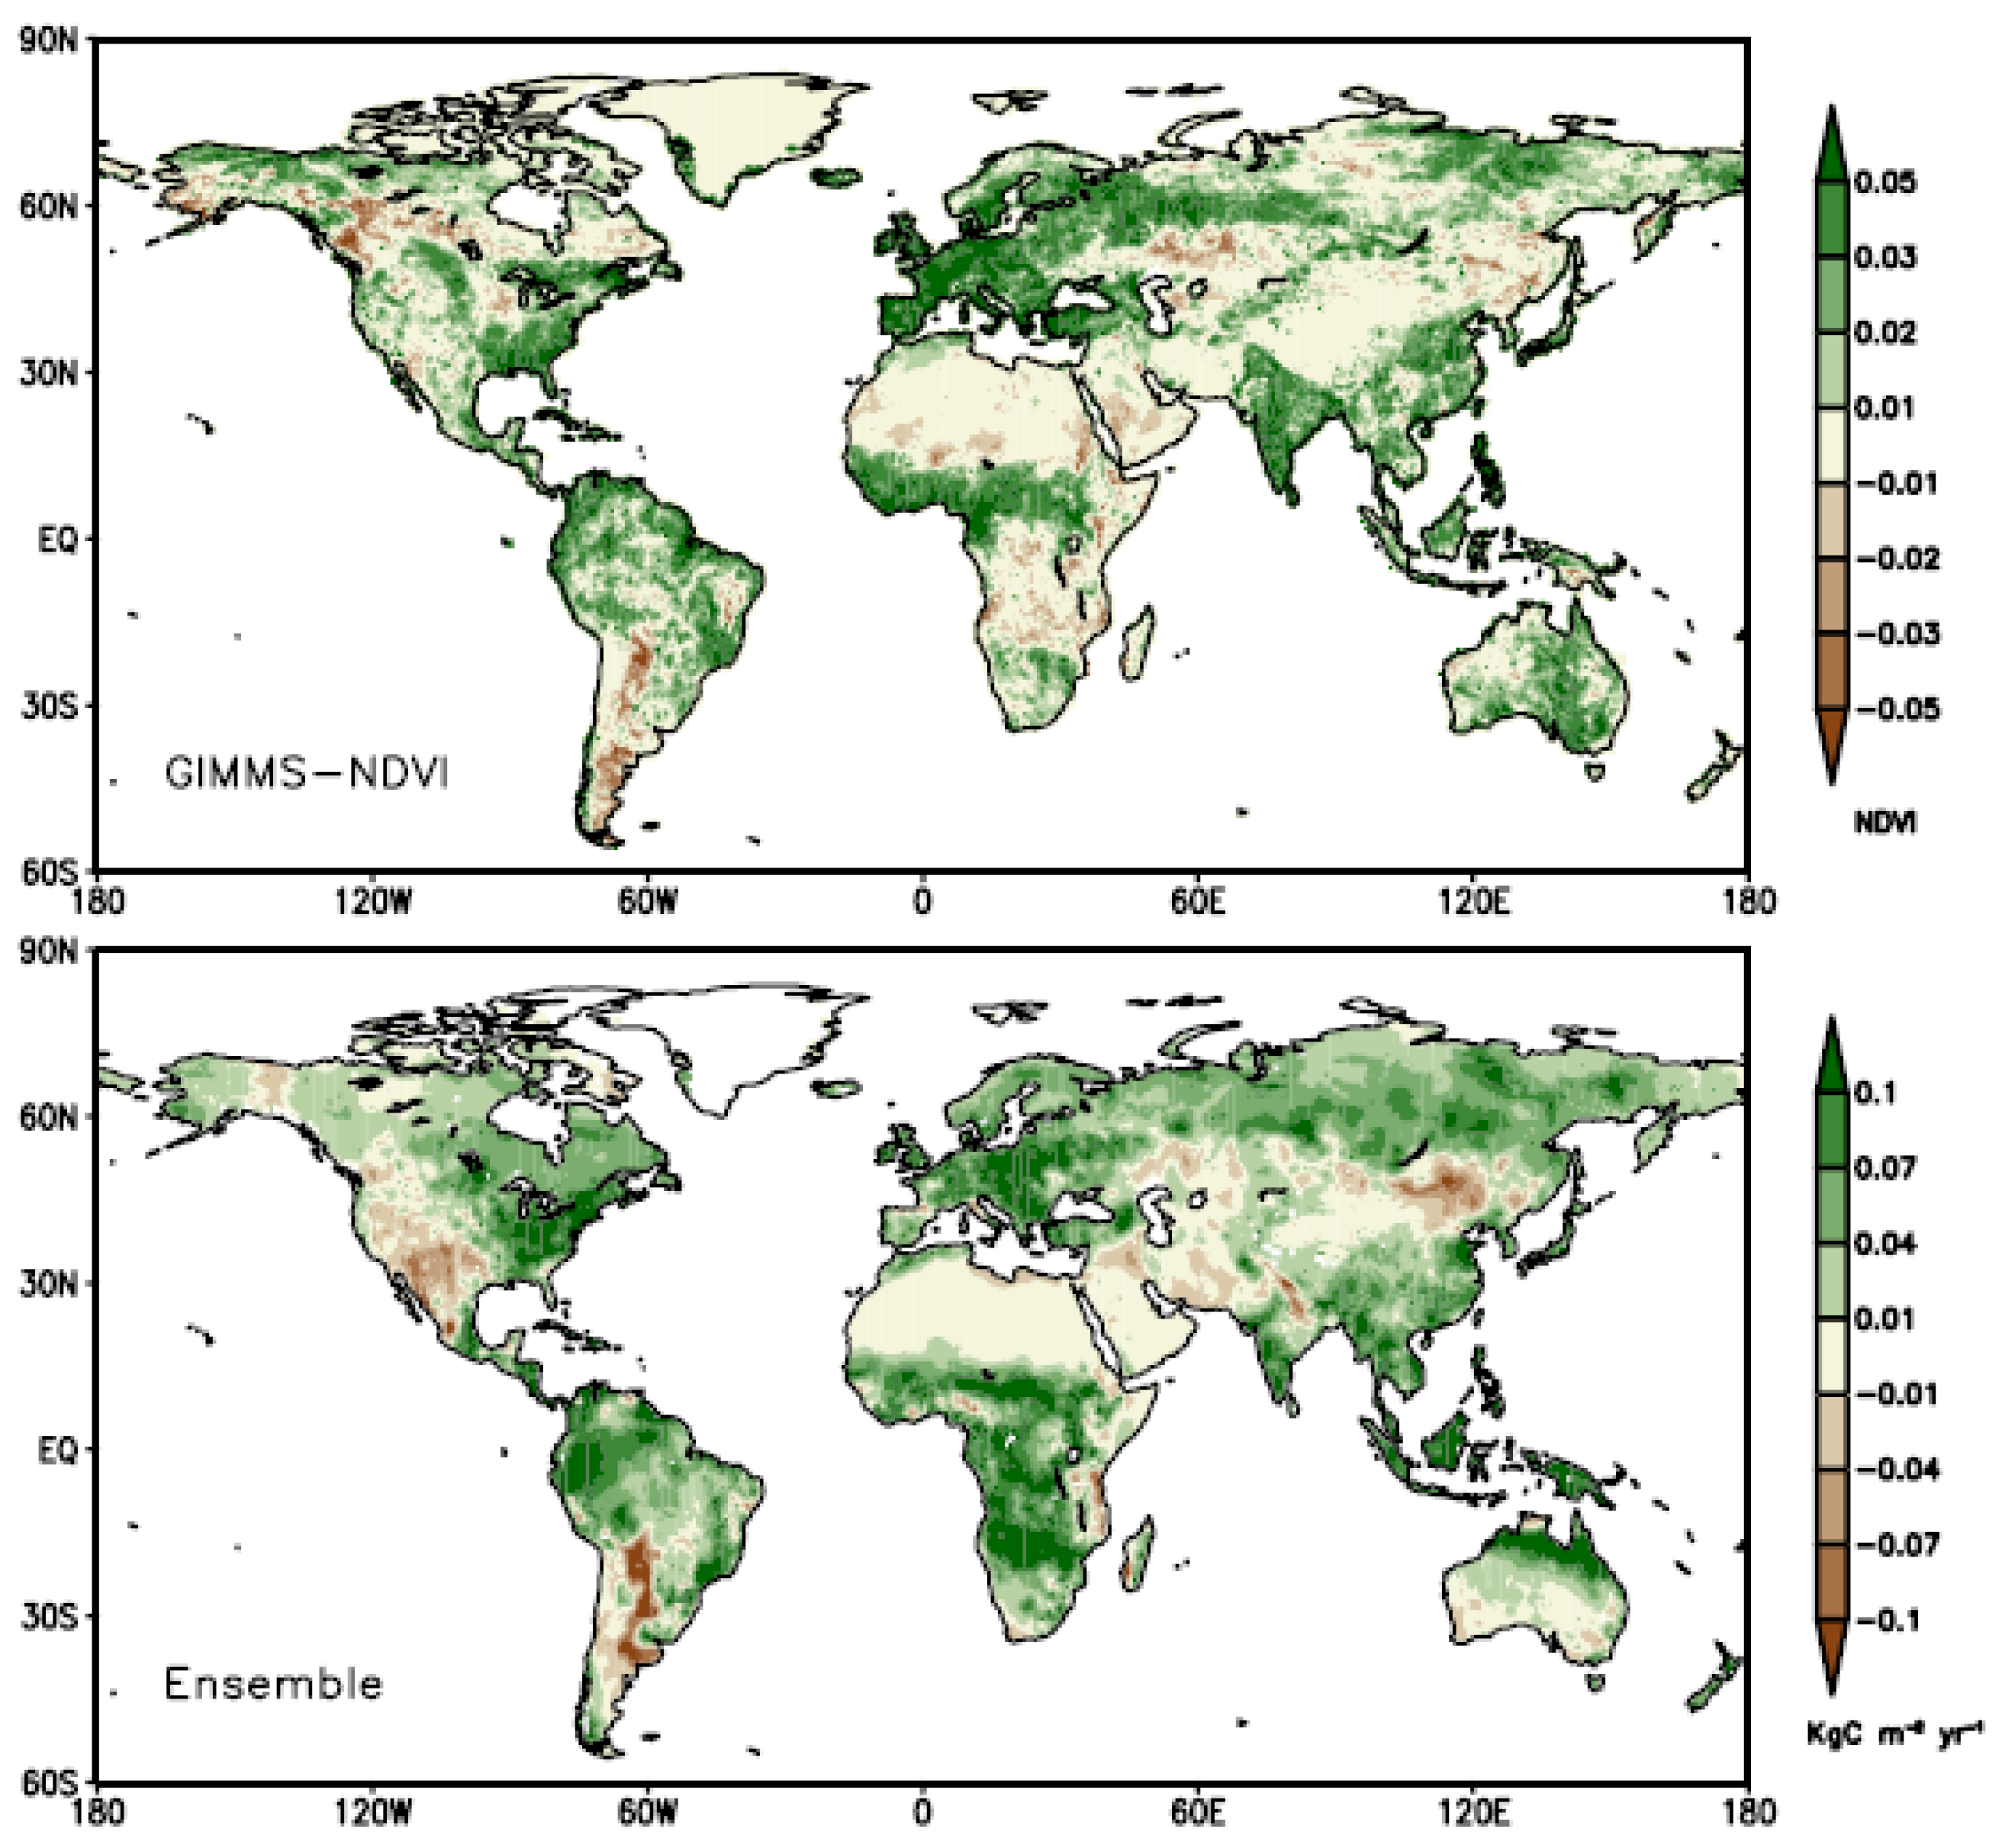
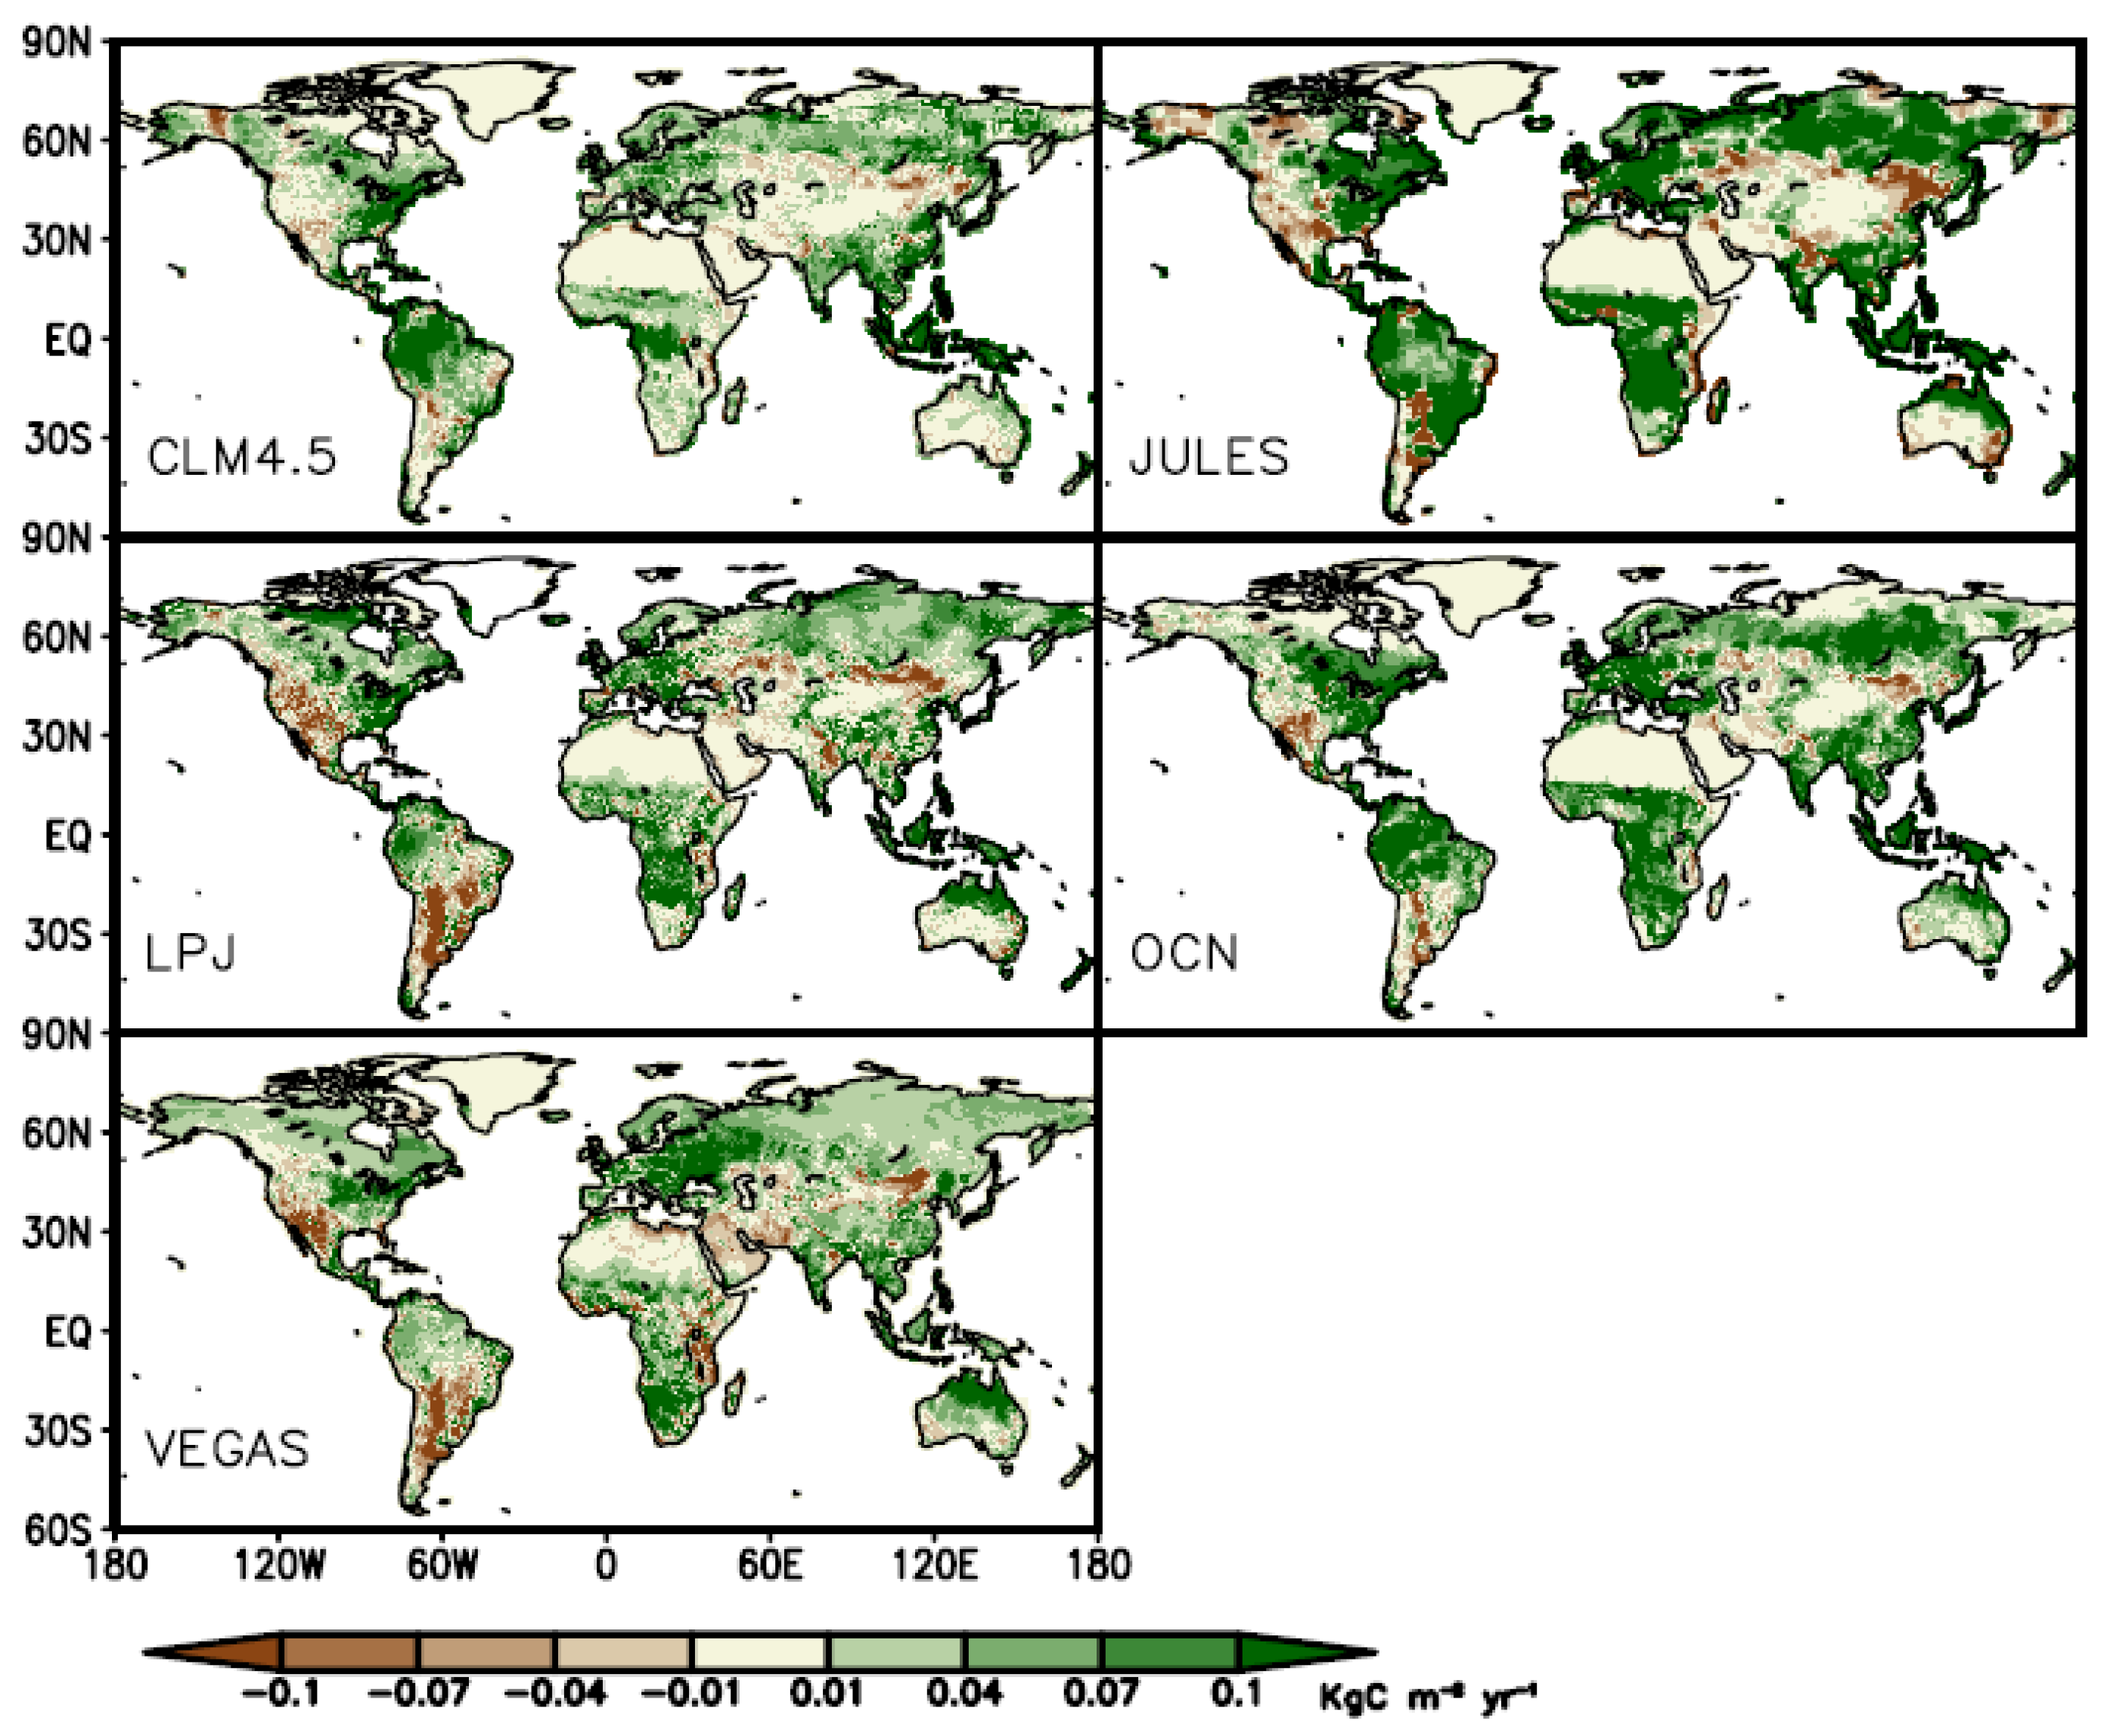
3.1. Spatial Trends of Observed NDVI and Modeled NPP

We used a combination of global and regional estimates of terrestrial ecosystems’ NPP based on five land-surface models [28] and GIMMS version 3g NDVI data [23] for the period 1982–2012 in this study. The TRENDY models captured the spatial pattern of input climate data in simulated NPP, and global trend of NPP is consistent with previously reported NDVI for the same period [7]. We found about 67% of the global land regions having positive NDVI values with a maximum increasing trend of 0.028 y−1. Similarly, about 80% of the global land regions had positive NPP values based on the models’ ensemble, with a maximum increasing trend of 0.012 Pg C·y−1·y−1; however, we found differences among the five models (not shown). The JULES simulations resulted in about 68% of global land area with positive NPP values of >0, which corresponds closely to the 67% land area with positive NDVI values. The % of statistically significant pixels is shown in Table 2, where, VEGAS showed the highest number of significant pixels followed by MME and OCN.
The spatial distribution of the NDVI trends for the study period is presented in Figure 1. The regions with greatest increase in NDVI are predominantly located in the Northern Hemisphere (e.g., Western Europe, India, China and Sahel region), followed by those in the Southern Hemisphere (e.g., Amazonian region and Eastern Australia). Despite these general increasing trends, some regions of Northern Hemisphere also showed significant decrease in NDVI, mainly in the Boreal region of North America and Northern China. The major decrease in the Southern Hemisphere was found in South America (e.g., Argentina, and Chile).
Generally, the global NPP spatial trends based on models’ ensemble did not consistently follow the spatial trends of NDVI (Figure 1). This became obvious in some parts of the globe including Alaska, Africa, Angola, Zambia and Congo, and Oceania. Similarly, we did not find a consistent corresponding decreasing trend between the NPP and NDVI, except for a few regions (e.g., South America and Boreal region of North America). The main regions showing consistent deceasing trends were Eurasia, Sahel region of Africa, India, and China.
Some similar inconsistencies were found between NDVI trends and individual TRENDY simulations (Figure 2). Across all the models, the trend of NPP (both magnitude and spatial pattern) was different than the NDVI trend, particularly in the Amazon, Africa, Oceania and Eurasia. In general, NPP trends simulated by some models were in better agreement with NDVI trends than others. For example, the modeled NPP trend by LPJ was in closer agreement to NDVI trend as compared with other four models. In contrast, JULES showed significantly higher NPP trends for the Eurasia and Africa regions when compared with NDVI trends for these regions. Two of the five models, namely VEGAS and CLM4.5, did not show any trend in NPP they simulated for major parts of the globe. Overall, the mismatch between TRENDY models’ NPP and NDVI values were also evident from their spatial correlations (Figure 3).

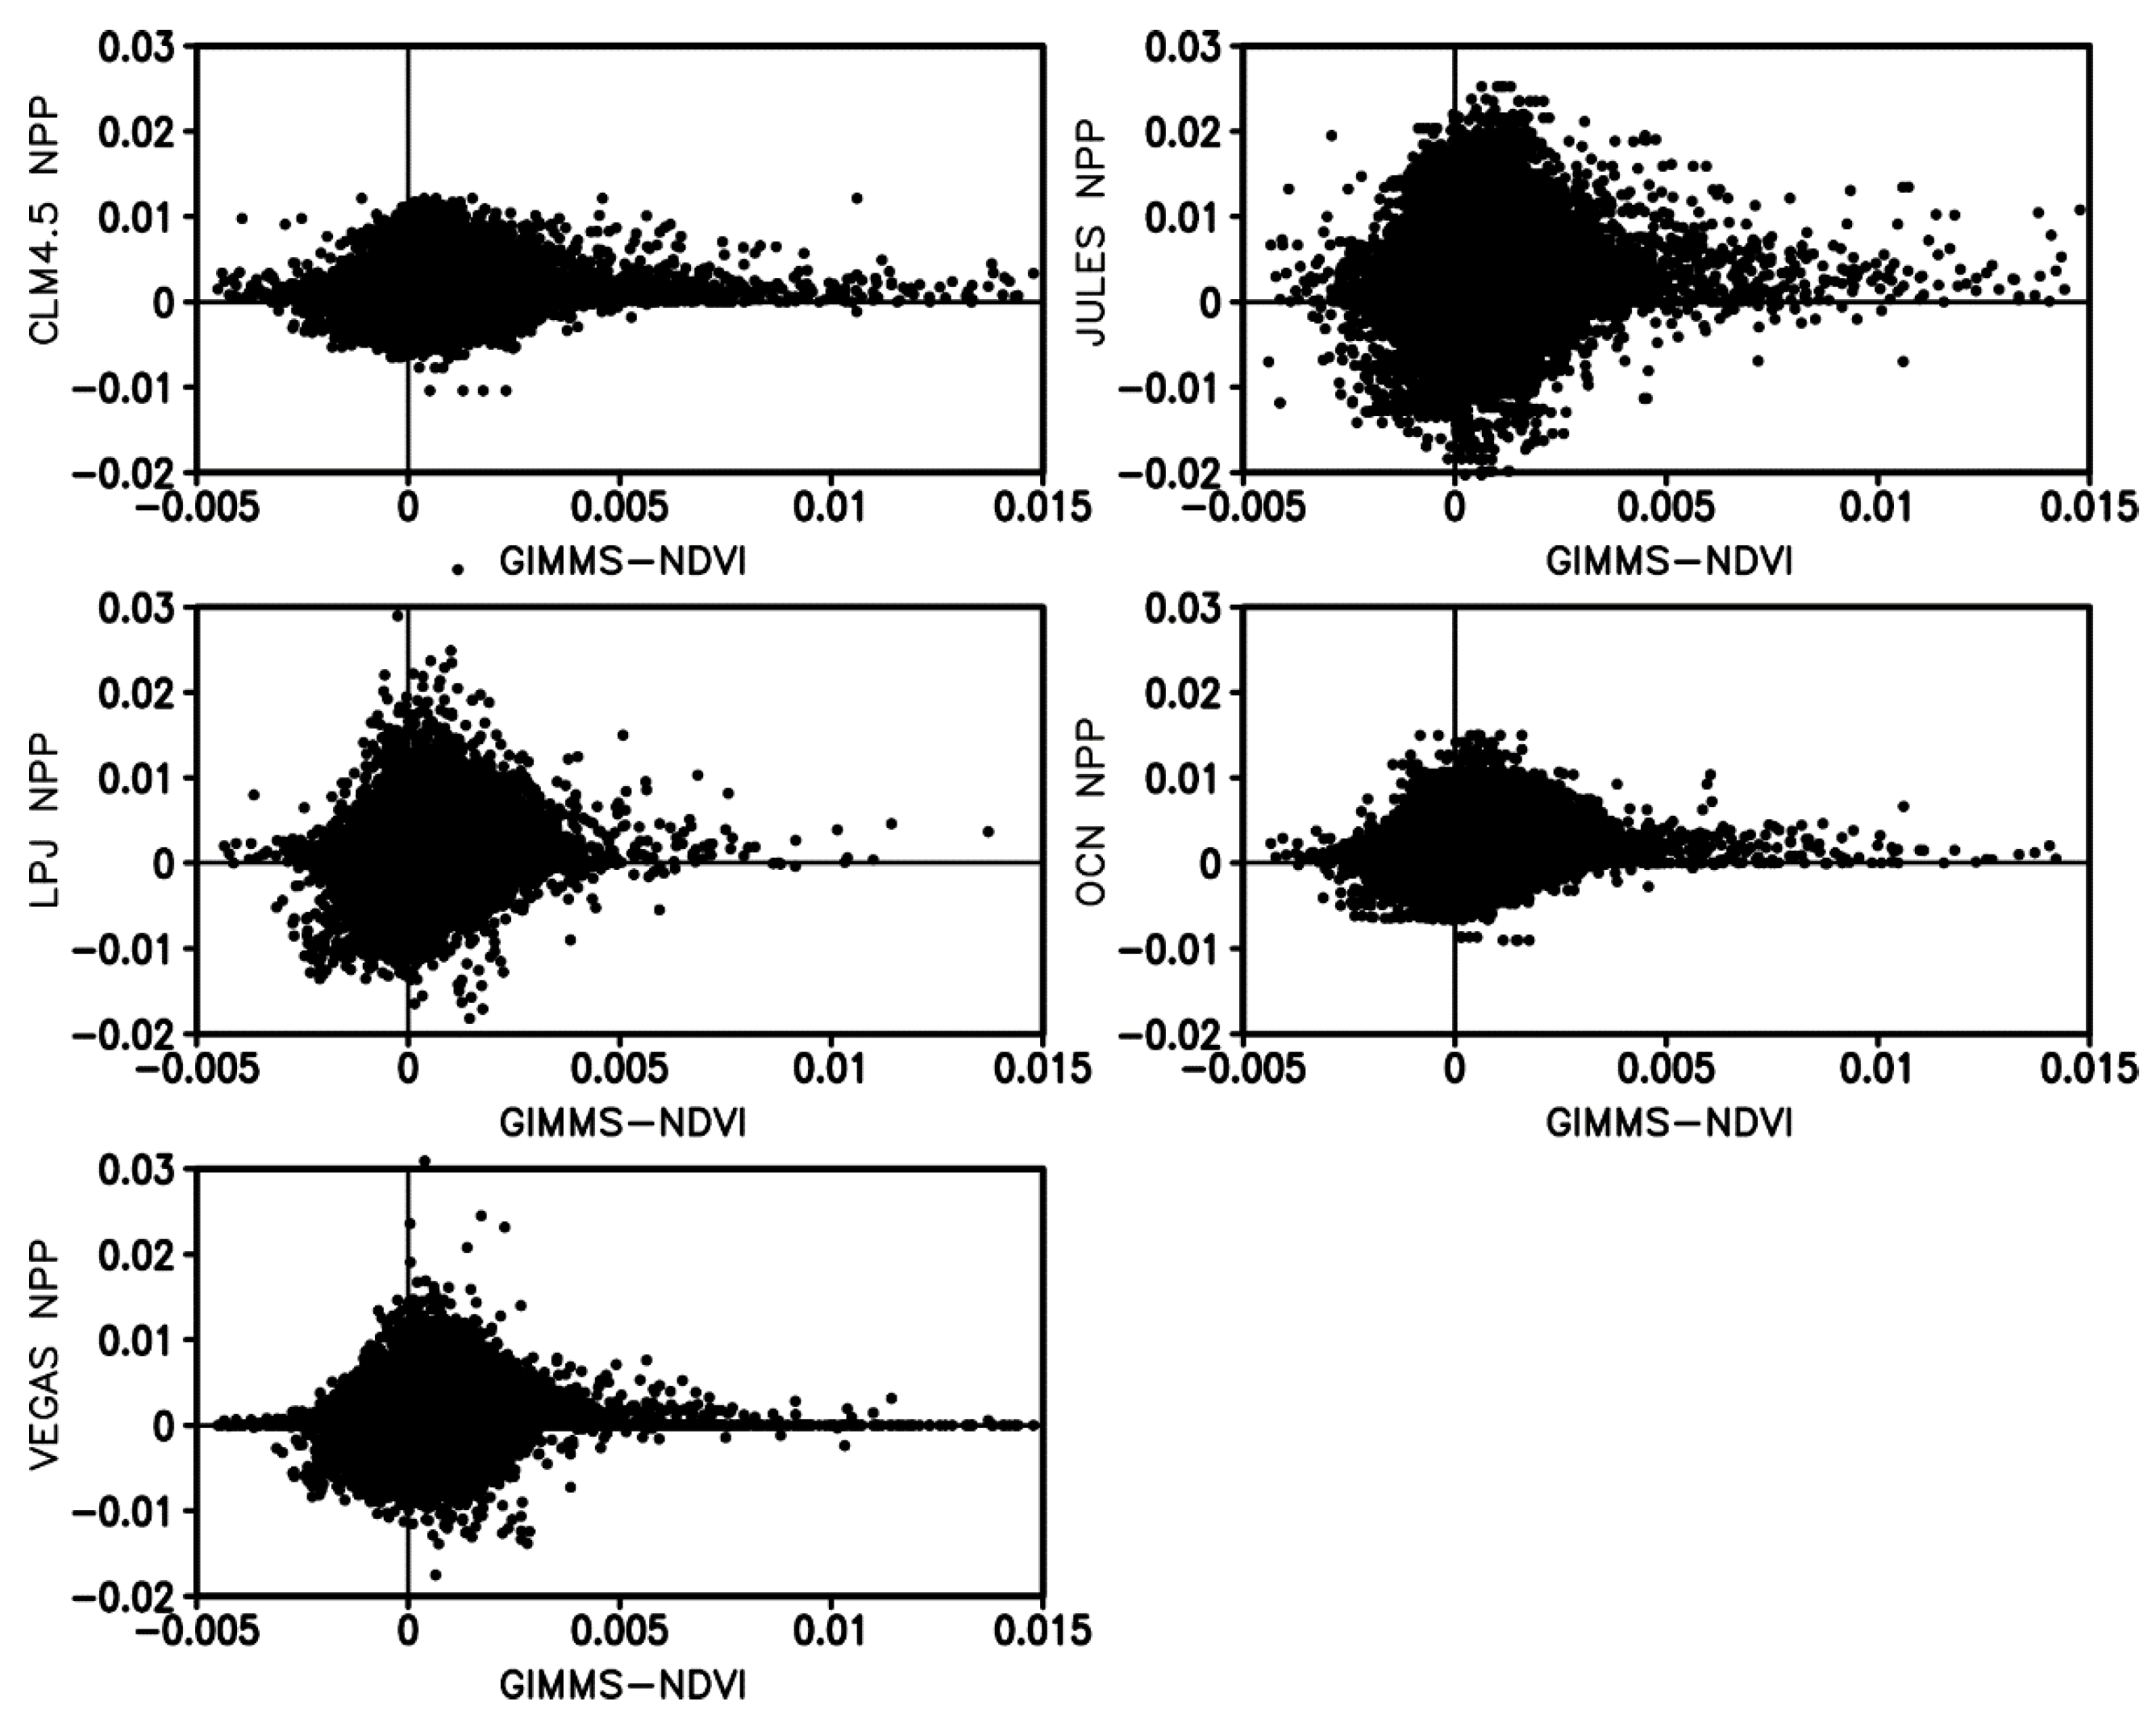
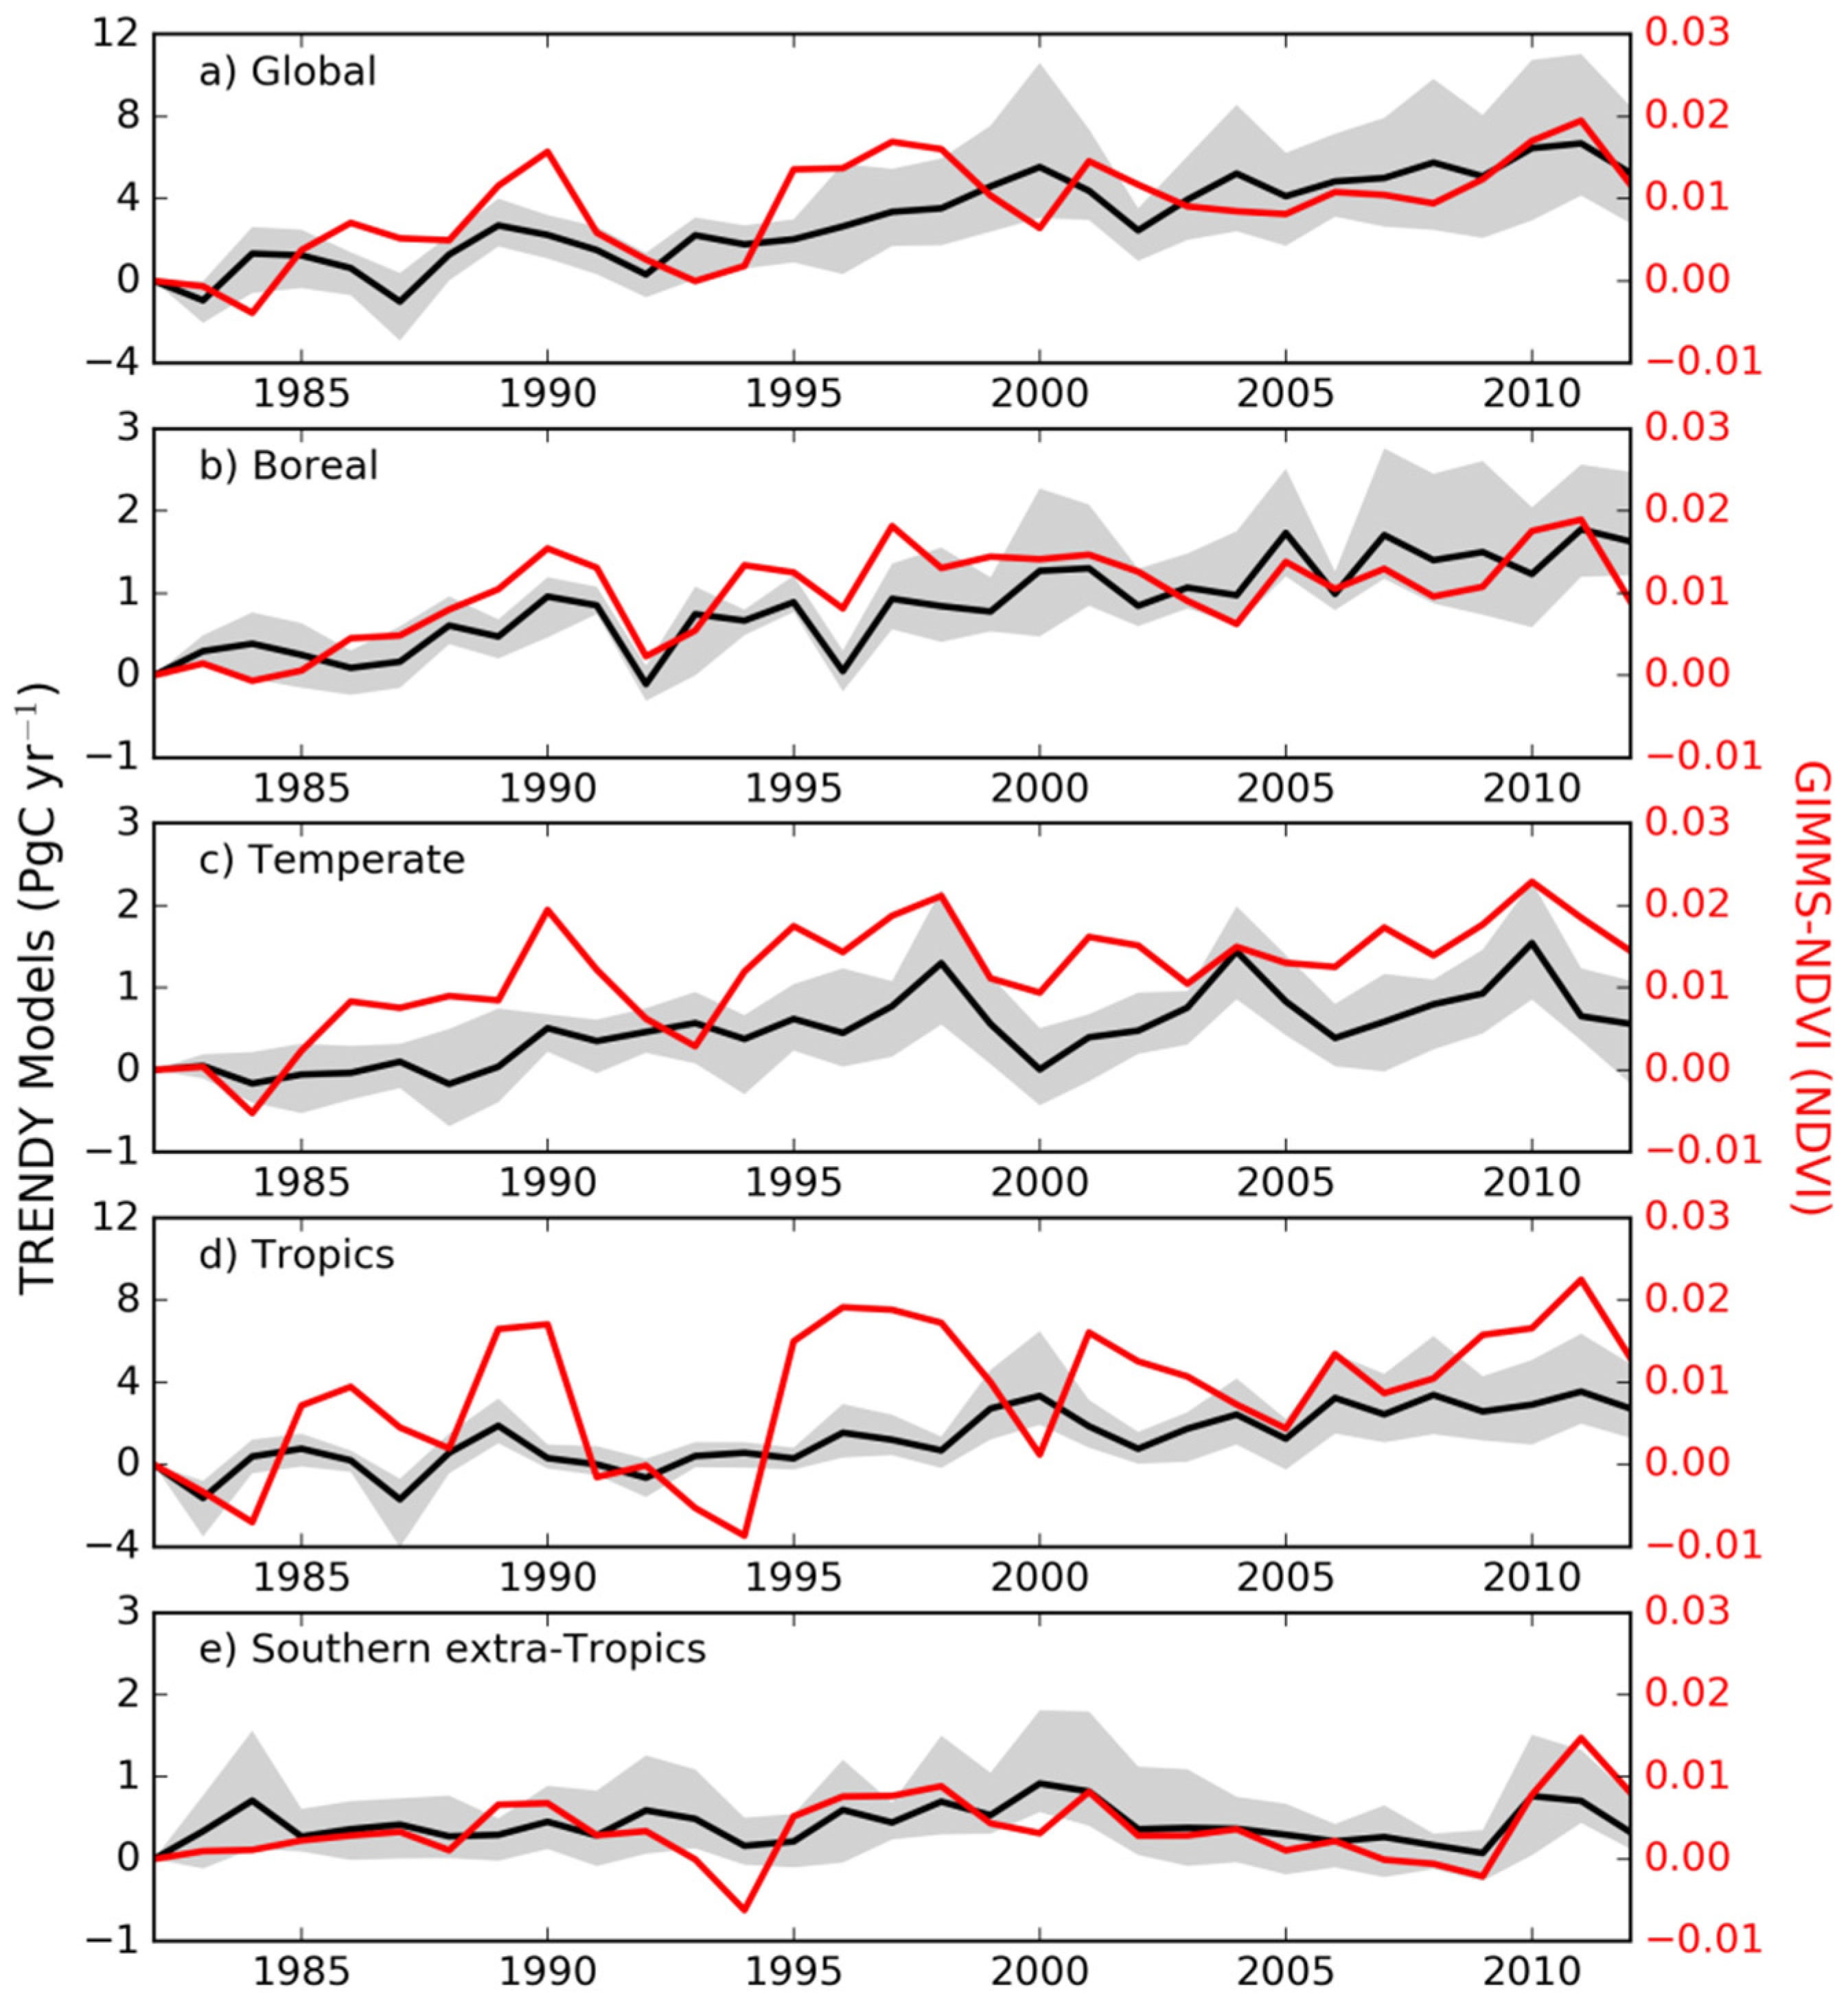
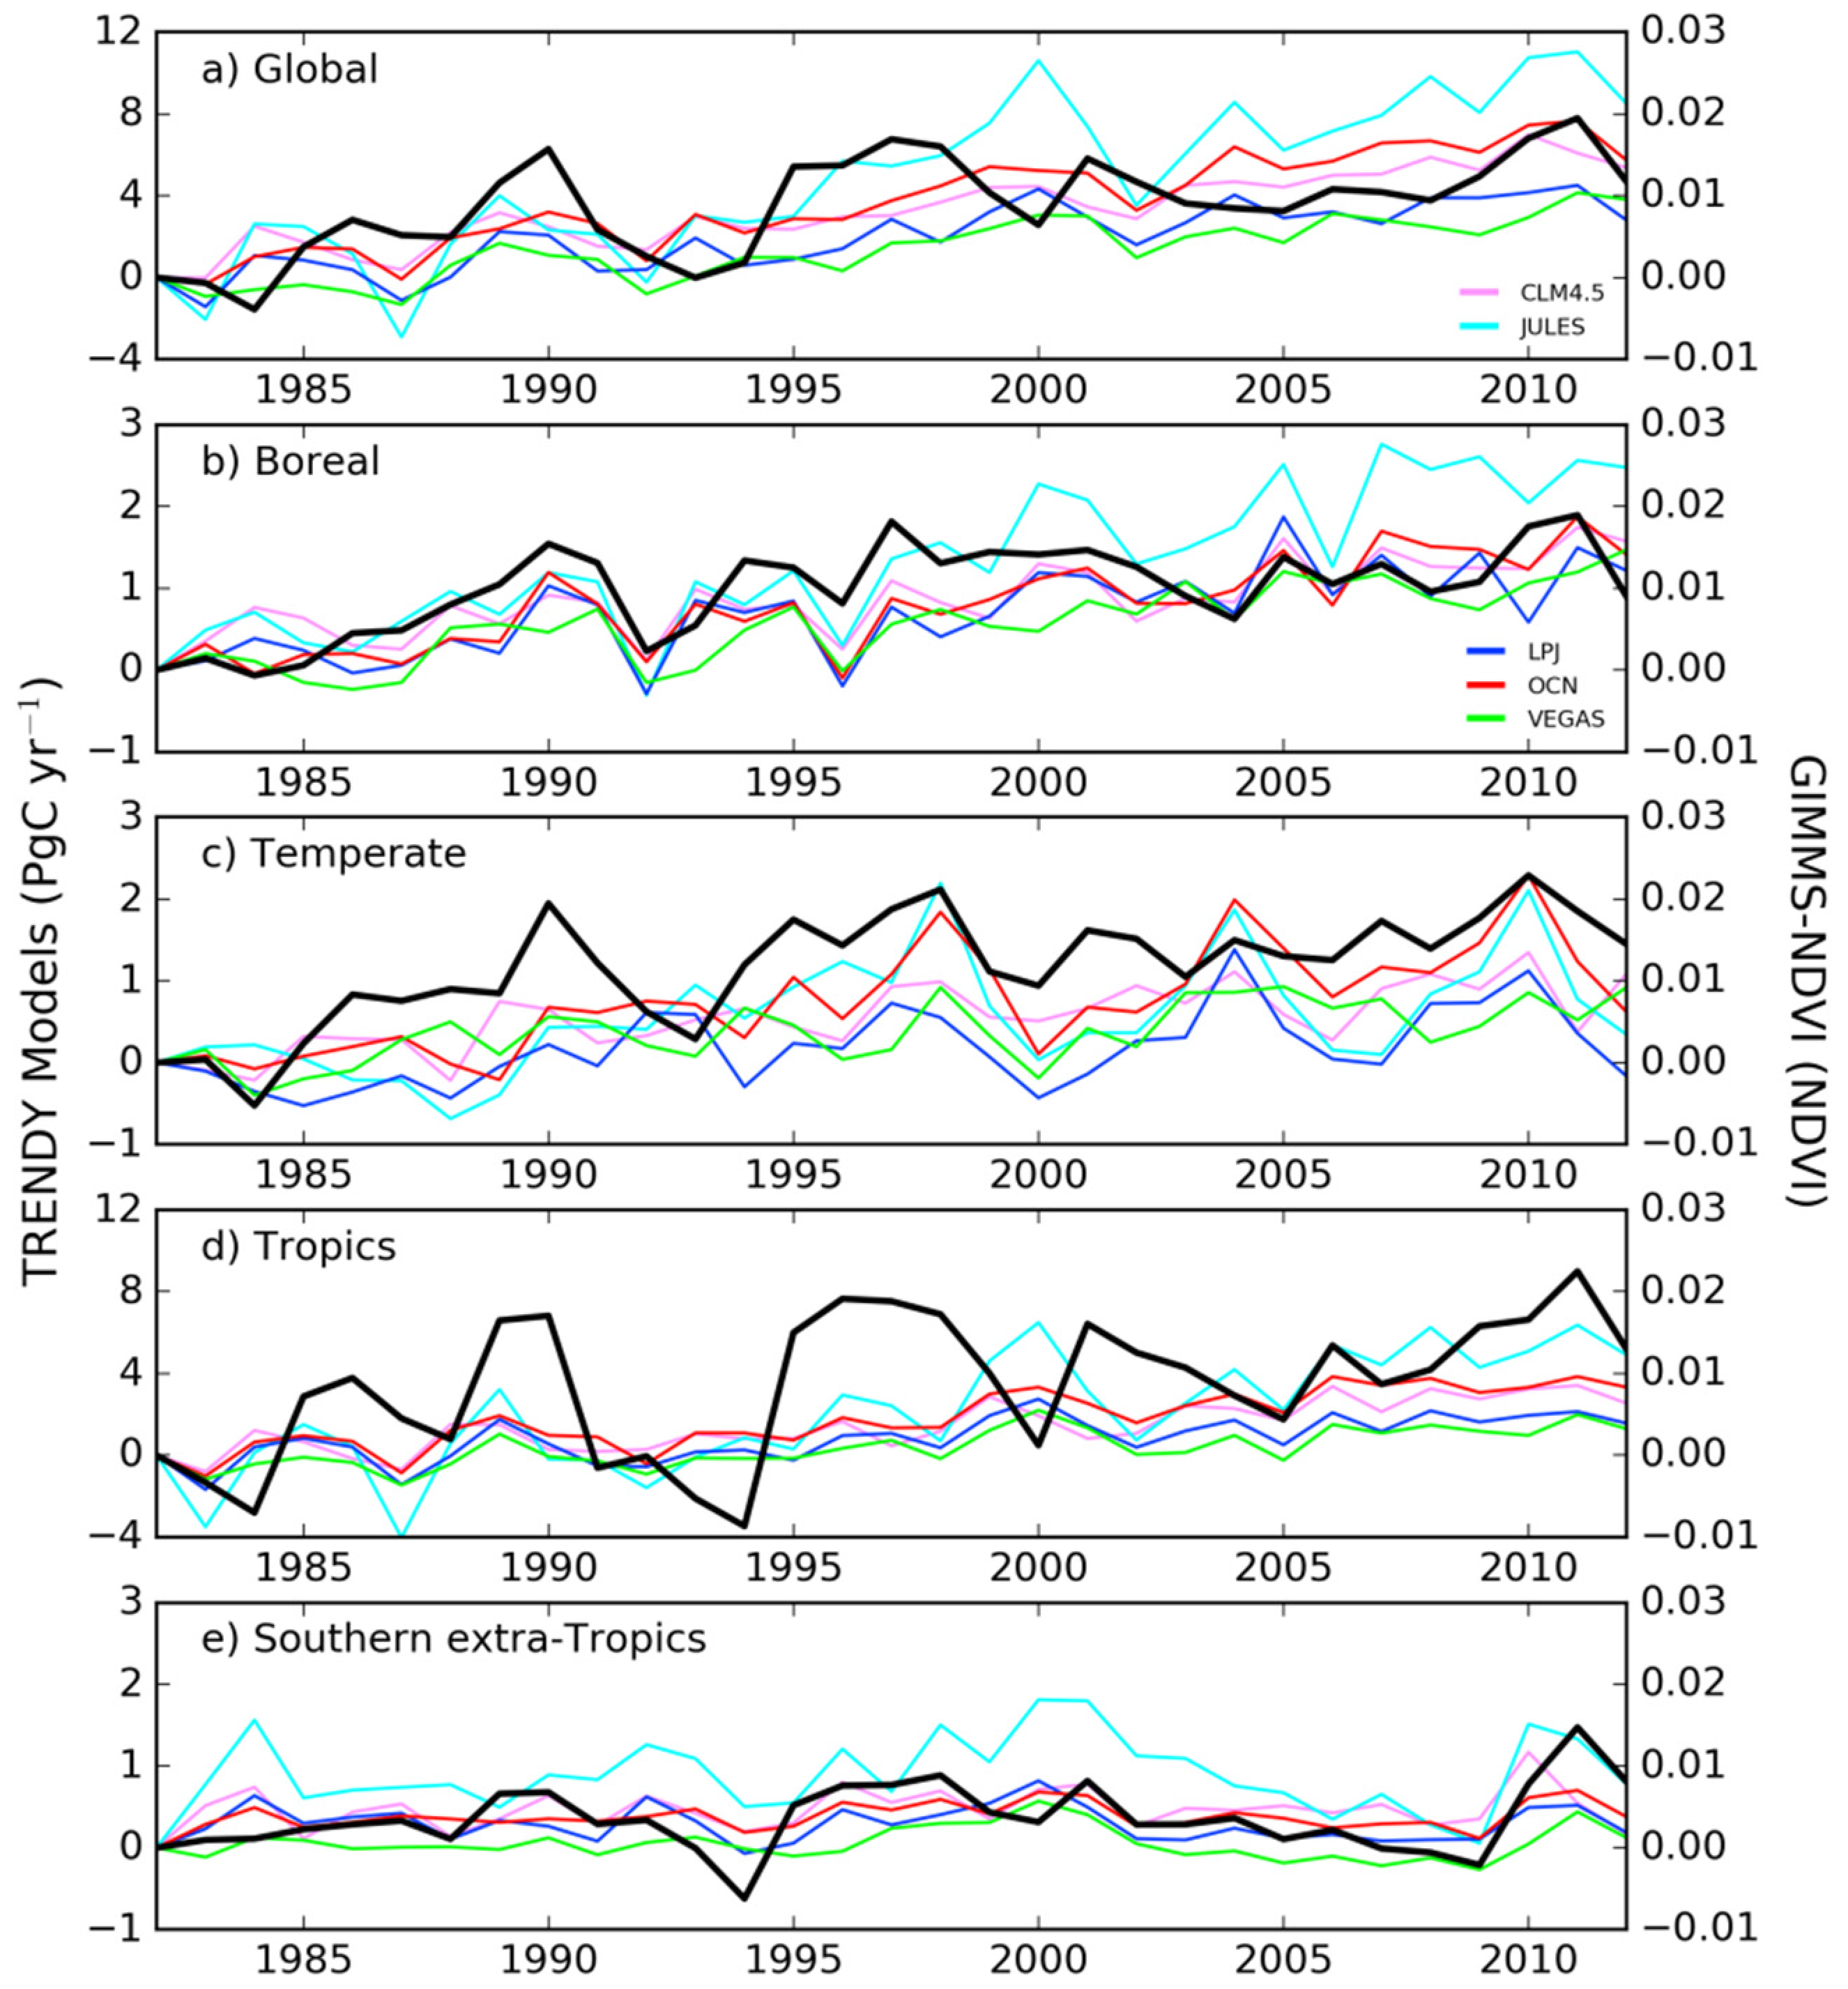
3.2. Temporal Trends of NDVI and Modeled NPP

The global mean NDVI was estimated to be 0.33 with an increasing trend of 0.00041 y−1 for the period of 1982–2012 (Table 3). At the regional level, Tropics showed substantially higher NDVI (0.43) followed by Temperate (0.30), Boreal (0.27) and Extra Tropic (0.19) regions. Despite the highest NDVI value in Tropics, maximum trend in NDVI increase (0.00052 y−1) was observed for Temperate regions. With the exception of Extra Tropics, all other regions showed a statistically significant increase of NDVI during 1982–2012 periods.
The global NPP was estimated to be about 63 Pg C·y−1, with an increase of 0.214 Pg C·y−1·y−1 (Table 2). Among the five models, JULES produced the highest global NPP (72.4 Pg C·y−1) compared to lowest NPP (53.7 Pg C·y−1) by LPJ. The global NPP estimate of about 62.9 Pg C·y−1 by VEGAS corresponds closely with the models mean ensemble (MME). The maximum global NPP increase of 0.359 Pg C·y−1·y−1 was produced by JULES followed by OCN (0.238 Pg C·y−1·y−1).
At regional level, Tropics showed the highest NPP (36.24 Pg C·y−1·y−1) followed by Temperate (13.55 Pg C·y−1·y−1), Boreal (9.68 Pg C·y−1·y−1) and Extra Tropical (3.44 Pg C·y−1·y−1) regions, respectively. However, the maximum NPP increase was observed in the Boreal (0.051 Pg C·y−1·y−1) region, as compared with all other regions. The magnitude of simulated NPP varied also among five models, for different regions. For example, JULES produced maximum NPP in the Tropics (42.80 Pg C·y−1·y−1) and in Boreal (11.42 Pg C·y−1·y−1) regions with corresponding increases of 0.237 Pg C·y−1·y−1 and 0.080 Pg C·y−1·y−1, respectively. Overall, all models showed an increasing trends in NPP across all regions, except LPJ which showed a negative trend in Extra Tropics; however, this trend was not statistically significant. Individual models’ estimates of NPP and their trends for different regions are presented in Table 4.
Time series analysis of both global NPP and NDVI showed, in general, a corresponding pattern of increase (decrease) for the duration of this study except for a few years (Figure 4). For example, NDVI showed higher values around 1990, and over the period 1995–1998. There were also a few instances (e.g., 1993 and 2000), where global NDVI showed temporary declines while NPP did not. Among the five models, this pattern was more prominent in JULES and OCN as compared to other three models (Figure 5). On regional level, higher variations between NDVI and NPP were observed in the Tropics and in Temperate regions. In the Tropics, the NDVI peak values do not fully correspond with the NPP. This was prominent during 1990 and 1995–1998. The highest peak observed in NDVI was closer to the highest peak simulated NPP by JULES. In contrast, VEGAS and LPJ showed relatively smaller NPP increase for the entire period of this study. Broadly stated, global NPP and NDVI correspond more consistently in later years (i.e., the last decade of the study period), compared to earlier years; however, models showed more variability among themselves in later years than in earlier years (Figure 5). The correlation coefficients between NDVI and modeled NPP values are given in Table 5. Overall, all models showed moderate correlations with NDVI at global level. Models ensembles NPP showed the highest correlation with NDVI in Temperate and Boreal regions compared to Extra Tropics and Tropics, respectively. At global level, VEGAS showed the highest correlation with NDVI followed by OCN and JULES. Similarly, at regional level, OCN performed better in Temperate regions compared to other models.

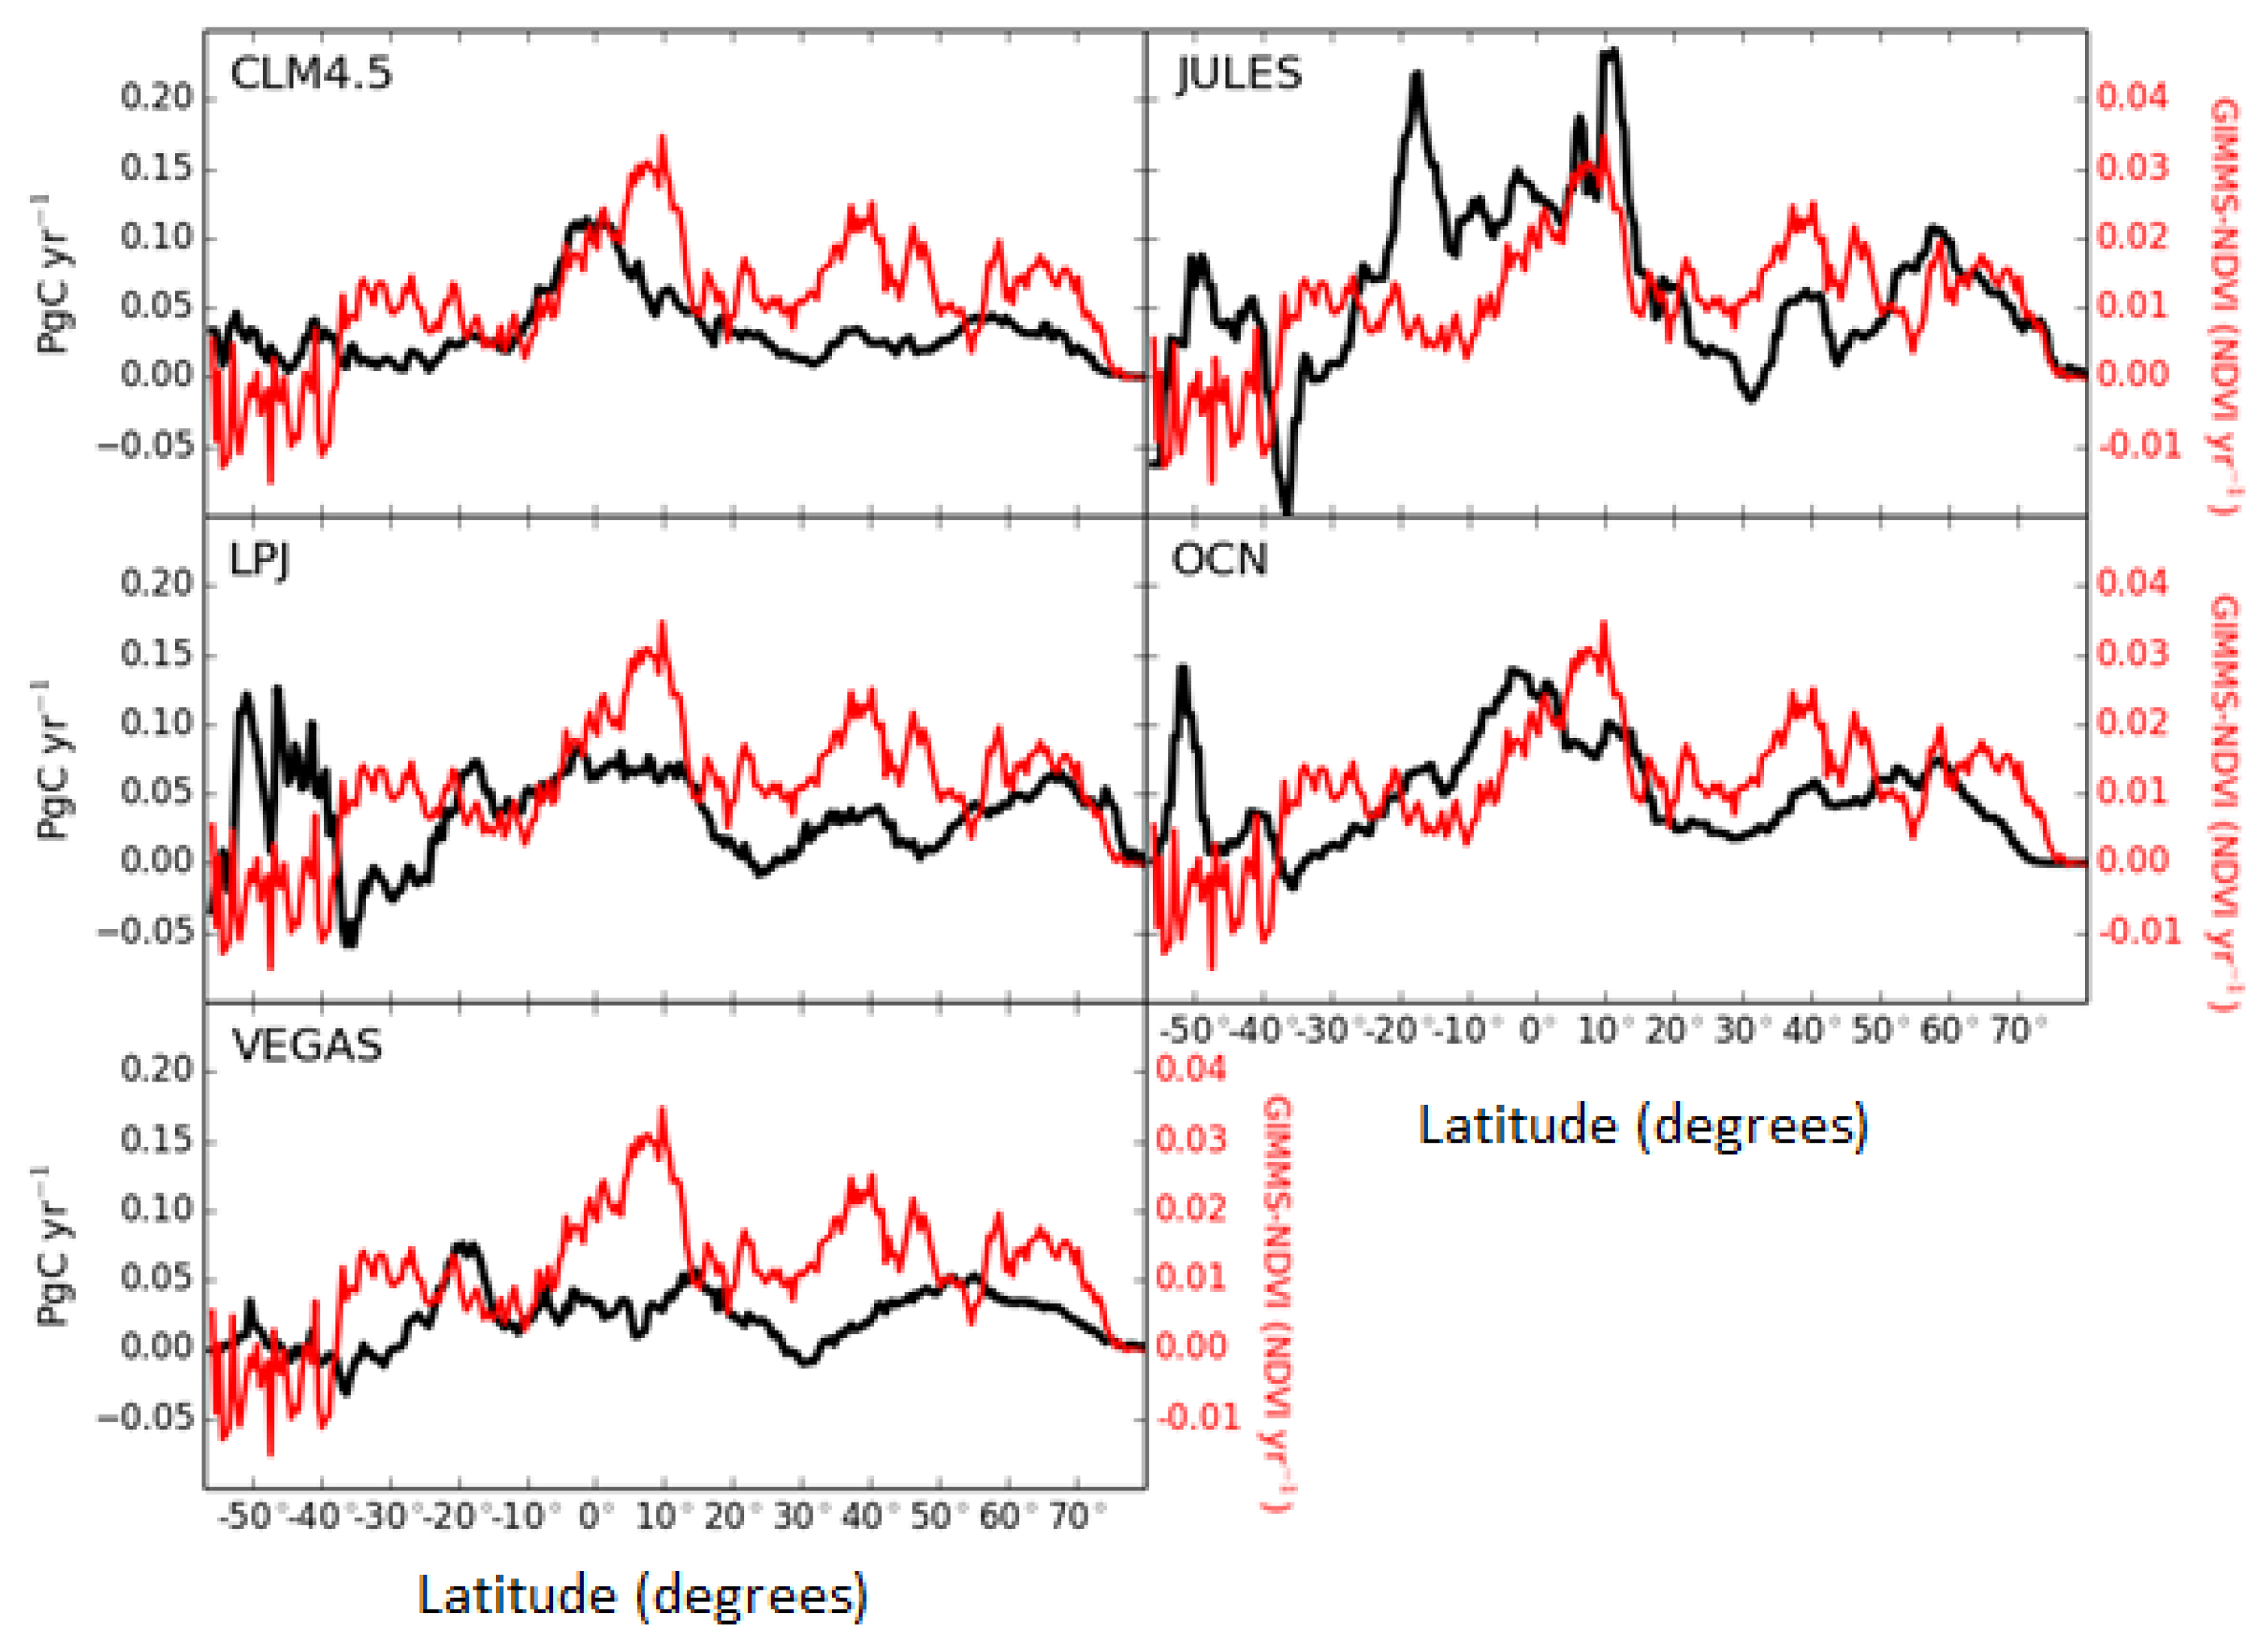
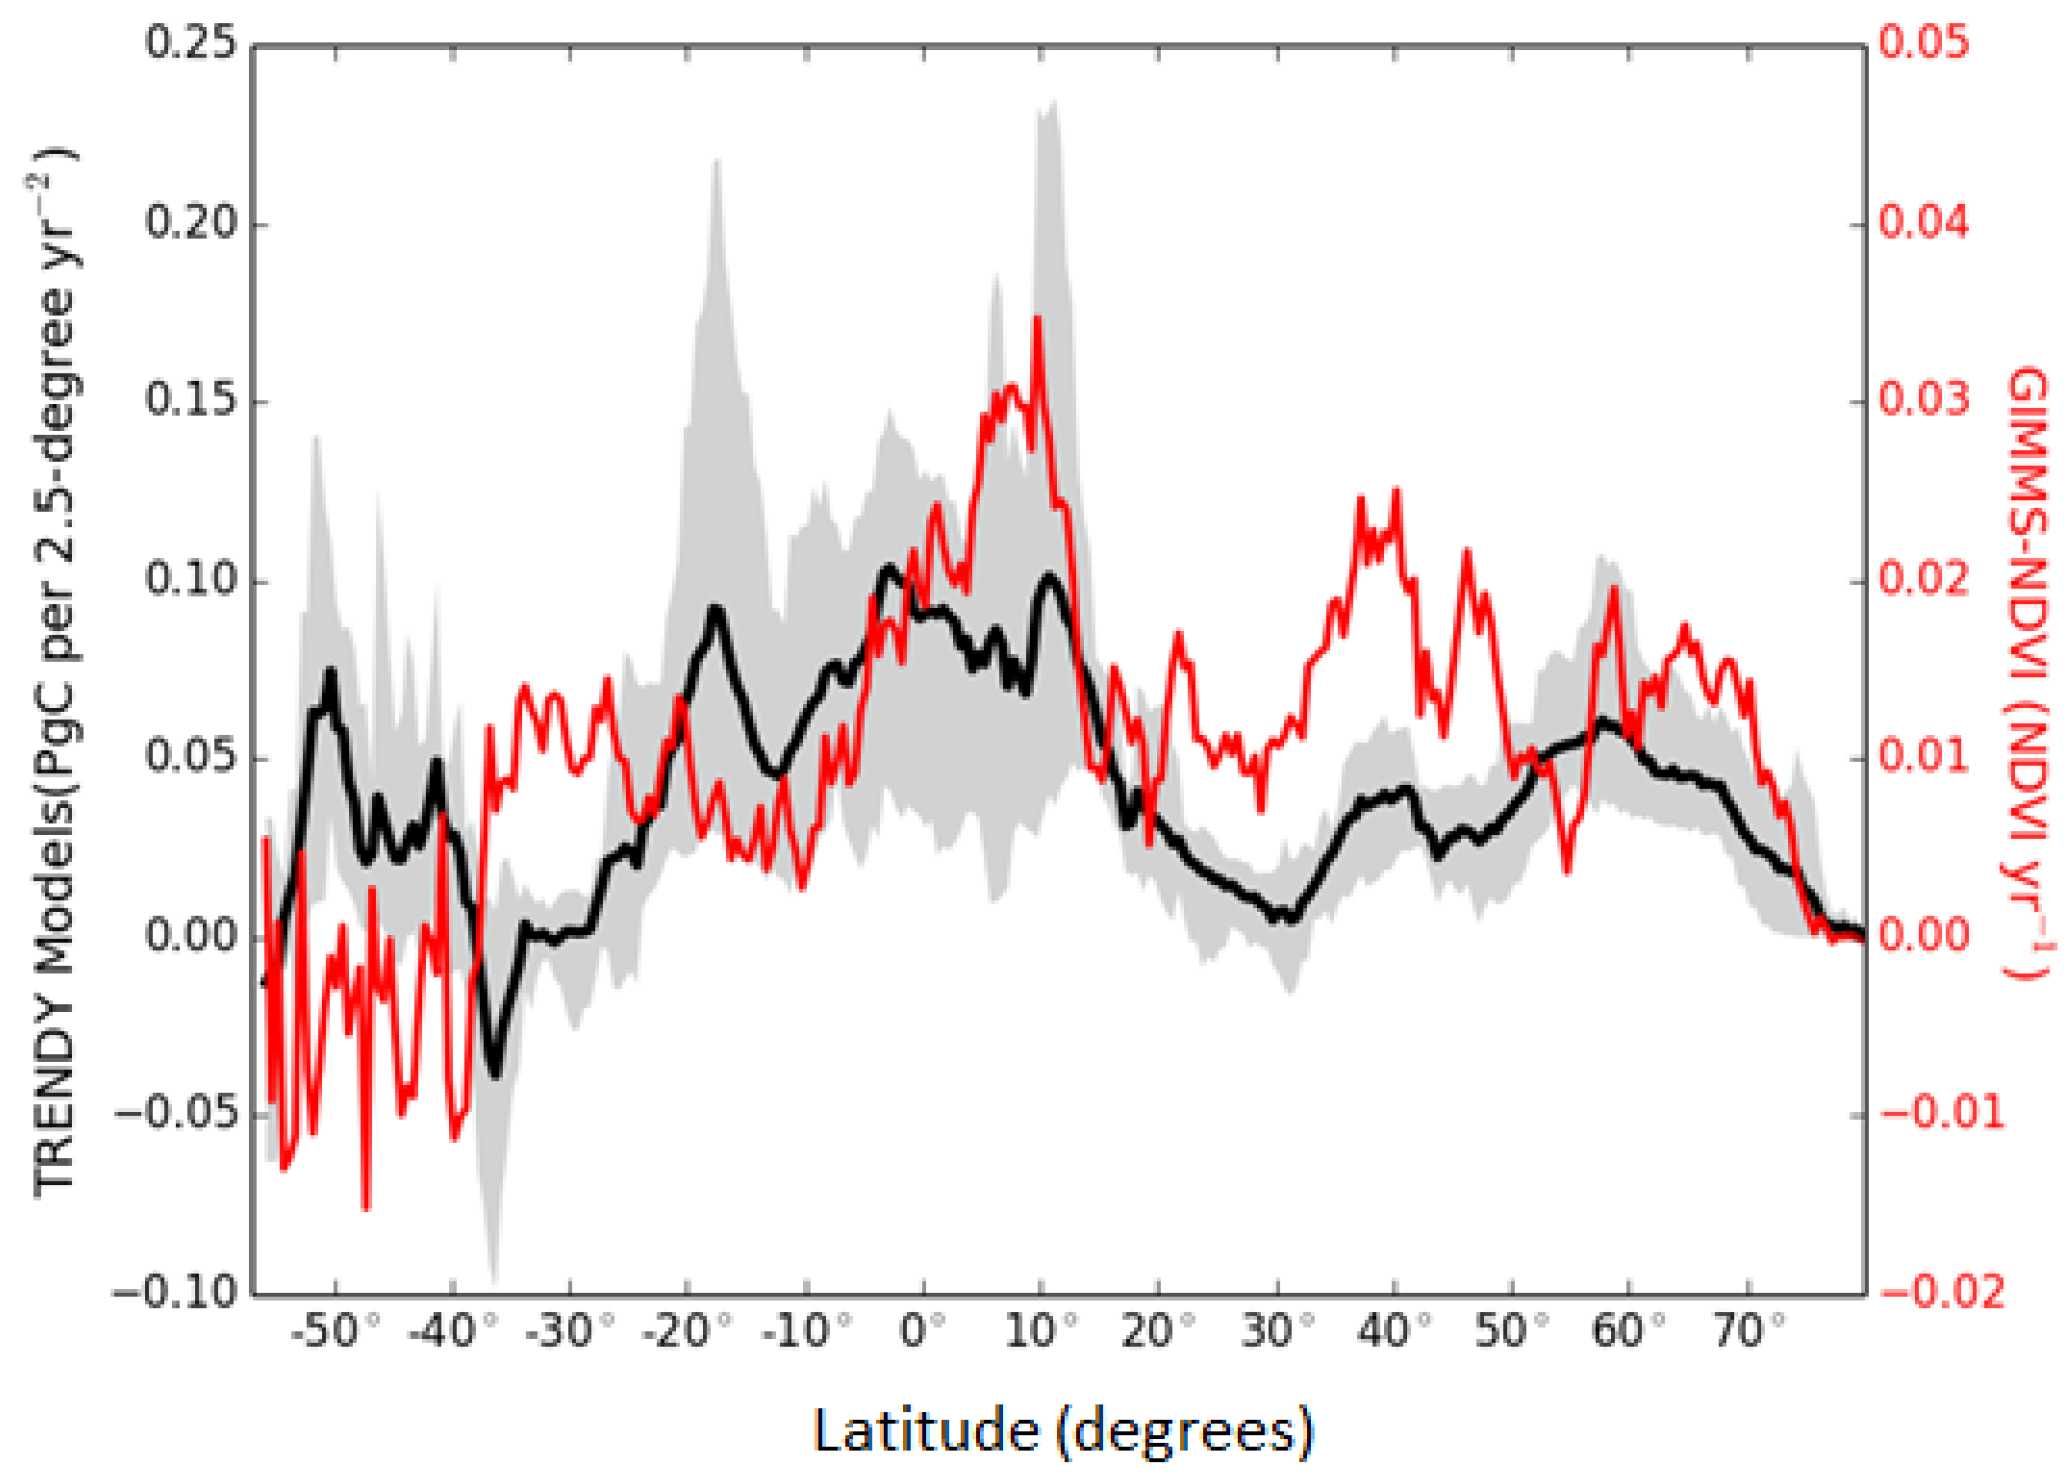
3.3. Latitudinal Trends of NDVI and Modeled NPP

The latitudinal pattern of both NDVI and NPP trends are important in overall understanding of the role of terrestrial ecosystems in carbon cycle, and their contribution and sensitivity to climate conditions. We found the maximum and minimum latitudinal NPP trend for the period of 1982–2012 to be ~0.10 Pg C·y−1·y−1 and ~−0.047 Pg C·y−1·y−1, respectively. Similarly, the maximum and minimum latitudinal NDVI trends were ~0.035 y−1 and ~−0.016 y−1, respectively. Generally, both NPP and NDVI trends showed similar patterns (Figure 6), however, the level of consistency to such patterns differed substantially for different latitudes. The larger NPP and NDVI trends were observed predominantly in the Tropics, followed by Boreal, Temperate, and Extra Tropic regions. In the Tropics, models showed higher degree of variability in NPP compared to other regions. The best agreements between NPP and NDVI trends were obtained for the Temperate and Boreal regions, while, the major discrepancy between the two was observed in the 40 S–60 S zone of Extra Tropics region.
Considering the simulated NPP trends from individual models, JULES showed larger NPP trend values compared to other models (Figure 7). The highest NPP trend value in JULES was ~0.24 Pg C·y−1·y−1 compared to the second highest value of ~0.14 Pg C·y−1·y−1 from OCN. We observed decreasing NPP trends by all five models, especially in Extra Tropics and specifically 20 S–40 S zone, followed by Temperate regions and specifically the 20 N–40 N zone. The highest decreasing NPP trends of ~−0.1 Pg C·y−1·y−1 and −0.07 Pg C·y−1·y−1 were observed for JULES and LPJ models, respectively. However, for certain zones the trend was more prominent compared to other zones. For example, the decreasing trends of both NPP and NDVI were consistent in Temperate regions and specifically the 20 N–40 N zone. The VEGAS model showed relatively consistent (with lower variations) NPP trends throughout all latitudinal regions/zones. The NPP values from the CLM4.5, LPJ and OCN models were in close agreement.

4. Discussion

4.1. Potential Drivers of NDVI and NPP Trends

The total global simulated NPP (mainly models ensemble) generally followed the temporal trend of NDVI for the study period 1982–2012. The spatial distribution of the modeled NPP and observed NDVI, however, widely differed for most of the globe, except for some regions e.g., Western Europe, African Sahel and Eurasia (Figure 1, Figure 2 and Figure 3). Despite the regional differences, both NPP and NDVI showed increasing vegetation activity from 1982–2012, which is in line with other studies [3,29].
Generally, we observed highest positive trends in both NPP and NDVI in the Northern Hemisphere (Table 3 and Table 4). Comparatively, NDVI and NPP trends showed better consistency in Temperate regions (e.g., UK and Ireland) than in Boreal regions (e.g., central Russia). Furthermore, NPP showed larger trends (>0.1 Pg C·y−1·y−1) in Boreal regions, while NDVI showed larger trends (>0.05 y−1) in Temperate regions. Apart from the some inconsistency between NDVI and NPP in Northern Hemisphere, we observed a general trend of increased vegetation activity. Higher vegetation activity in Boreal regions (predominantly covered by forests) is likely due to earlier onset and longer growing seasons [30]. Similarly, higher vegetation activity in Temperate regions (predominantly covered by grasslands and croplands) may largely be explained by increased precipitation [31,32], agricultural intensification [32,33], nitrogen deposition and nitrogen fertilizer applications [34]. Decreasing trends of both NPP and NDVI were more prominent in the Southern Hemisphere. This NPP (<−0.1 Pg C·y−1·y−1) and NDVI (<−0.05 y−1) decreasing trend was most consistent in South American countries such as Argentina and Chile. This may be attributable to increasing temperatures that cause high evaporation and larger vapor pressure deficit, which in turn creates water deficit with negative impact on optimum plant growth [29]. Decreasing trends in Southeastern Asia may be driven by the expansion of palm oil and rubber trees at the cost of tropical forests [35]. This conversion has been reported to take place at a scale large enough to impact the overall NDVI and NPP patterns in this region. Decreasing trends in the Northern Hemisphere (e.g., Boreal regions of North America and Northern China) can be attributed to regional droughts (i.e., reduced rainfall), pollution, wildfires and other disturbances [36,37]. The regions with mixture of both increasing and decreasing trends (e.g., Sahel region) can be explained by the complex interactions between land use (grazing, fertilization) and climate conditions [38].
The inter-annual variability observed in both NPP and NDVI is mainly caused by different climate events (such as El-Niño) and volcanic eruptions. In this study, modeled NPP and NDVI showed an abrupt setback after 1991 in response to El-Niño, followed by resumption of plant growth in 1993 (Figure 4 and Figure 5). Furthermore, the opposite trends between NDVI and NPP in 2000 can be attributed to the differential response of ecosystems to the cooling effect (leading to reduced length of growing season) caused by aerosols from Pinatubo eruption [1]. Both NPP (ranging from ~−0.047 to ~0.10 Pg C·y−1·y−1) and NDVI (ranging from ~−0.016 to 0.035 y−1) trends also varied substantially with latitudes (Figure 6). The highest NPP and NDVI trends were observed in the Tropics (mainly in the Amazon forest and the Sahel region of Africa). In contrast, the lowest NPP and NDVI trends were observed in Extra Tropics (mainly in Southern part of South America, e.g., Argentina). This variation over tropical regions has been attributed to the El-Niño events due to their higher association with global atmospheric CO2 growth rate [12]. These latitudinal changes in NPP and NDVI represent a combination of multiple factors (e.g., temperature, precipitation, growing season) and therefore, the complex interactions among these factors offer important insight on the observed trends [39].

4.2. Uncertainties Related to NDVI-NPP Comparison

NDVI provides a global measure of vegetation canopy responses to environmental conditions. Its strong relationship with the fraction of absorbed photosynthetically active radiation (fPAR) that it has been widely used as a proxy for gross primary productivity to study the terrestrial ecosystems dynamics [3,4,40,41]. However, the strength of this proxy reduces for disentangling of driving factors because NDVI is a one-dimensional measure and integrates the effects of many climatic and non-climatic factors [7]. It also has limitations in densely vegetated regions, because of saturation effects [20] and it may, in certain vegetation types, not fully follow the photosynthetic cycle. NPP models, on the other hand, have uncertainties linked to the parameterization [42], model formulation and underlying assumptions and it is not always clear how these propagate into the model predictions. Therefore, the results presented in this study should be interpreted with appropriate caution, although the interpretation of large-scale patterns and long-term trends can be expected to largely alleviate these concerns.
Even though this study showed a general agreement between global NPP and NDVI trends (for both ensemble and individual models); the spatial patterns varied significantly. These differences between NPP and NDVI trends can be partly attributed to the identified sources of uncertainties. For example, although several calibration and corrections have been applied to the NDVI data to create the global GIMMS product, some uncertainties associated with multiple satellite sensors, solar zenith angles and atmospheric conditions/corrections remain [4,43]. Furthermore, several other factors (e.g., atmospheric conditions, scale of imagery, moisture conditions and vegetation cover) can also largely influence the accuracy of NDVI. For example, Huete and Jackson [44] found that the soil surface influence on NDVI values was greatest in areas with vegetation cover between 45%–70%, while the NDVI signal may saturate in densely vegetated regions like tropical forest [45]. Discrepancies between NPP models can be partly attributed to the representation of land cover types among models. Some models (e.g., CLM4.5) include highly sophisticated land classification with 17 plant functional types [46] compared to other models that have smaller number of plant functional types (e.g., VEGAS with 6 plant functional types). This diverse representation of land cover/class types result in a variety of different processes and associated parameter settings (relating to carbon allocation and transfer rates among carbon pools) and contribute to differences among the models [47]. Models may use different approaches for representing natural and anthropogenic disturbances (e.g., fire, land use changes, and grazing and harvesting of forest products and croplands) [48]. Benchmarking of the models’ response to different disturbances can improve the discrepancies between NDVI and modeled NPP. Climate condition is one of the major factors in regulating the NPP dynamics; therefore, some discrepancies between NDVI and modeled NPP can be attributed to the uncertainties in climate dataset due to temporal and spatial interpolation [49]. Despite the discrepancies between NDVI and modeled NPP, the results of this study provide unique and useful insight for understanding the global and regional vegetation dynamics in response to prevailing climate conditions, and their potential impact on carbon cycle.

5. Conclusions

Our ability to assess and quantify the role of terrestrial ecosystems in carbon cycle is largely dependent on how well we can interpret the NPP dynamics under prevailing climatic condition. The objective of this study was to study the role of terrestrial ecosystem in the carbon cycle based on the most recent GIMMS-NDVI data and simulated NPP by five land-atmosphere models of the TRENDY project for the period 1982–2012. The results showed that simulated NPP corresponded with the NDVI trends in a temporal sense, but less so in a spatial sense. The simulated NPP, especially the mean ensemble of five models, reproduced general vegetation dynamics represented by NDVI. The global NPP was estimated to be about 63 Pg C·y−1, with an increasing trend of 0.214 Pg C·y−1·y−1. Similarly, the global mean NDVI was estimated to be 0.33, with an increasing trend of 0.00041 y−1. Overall, both NPP and NDVI showed higher positive trends in the Northern Hemisphere compared to the Southern Hemisphere. Higher trends of NPP and NDVI in Boreal regions (dominated by forests) suggest increased vegetation cover, likely due to the earlier onset and longer growing seasons. Similarly, in Temperate regions, higher NPP and NDVI trends support the suggested role of precipitation, nitrogen deposition and nitrogen fertilizer applications. We observed some NPP and NDVI decreasing trends, both in the Southern Hemisphere (possibly due to the effect of water deficit and higher temperature on plant growth) and in the Northern Hemisphere (possibly due to combined effects of regional droughts and wildfires on plant growth). A latitudinal trends analysis showed higher variations over Tropical and Extra Tropics. Overall, this study showed a general agreement between temporal trends in NDVI and the NPP, both for ensemble and for individual models simulations. Some of the discrepancies between NPP and NDVI can be partly attributed to the uncertainties associated with NDVI measurements (e.g., multiple satellite sensors, atmospheric conditions and corrections) and models formulations and assumptions (e.g., land-cover classification, associated model parameterization and interpolation effects in climate data). The scientific insight obtained from the spatial and temporal analyses of NPP and NDVI, for multiple decades encompassed in this study, is guiding our continued research on the contribution of terrestrial ecosystems to the global carbon cycle using a combination of models and observations in data assimilation mode. Our ultimate goal is to determine the regional and global magnitude of sources and sinks of carbon in terrestrial ecosystems, and their inter-annual and longer-term variability and change due to prevailing climate conditions.

Acknowledgments

This study was funded primarily by a Laboratory Directed Research and Development project sponsored by the Pacific Northwest National Laboratory of the U.S. Department of Energy. We acknowledge the contribution of by the TRENDY project teams for allowing us to use their simulated NPP data. We thank three anonymous reviewers for their valuable comments that led to further improvement of the manuscript.

Author Contributions

All authors contributed to the design of this research and writing of manuscript. Rashid Rafique and Fang Zhao analyzed the data. Rashid Rafique and Ghassem R. Asrar wrote the manuscript. Rogeir de Jong and Ning Zeng reviewed and offered suggestions for further improvements of the manuscript.

Conflicts of Interest

The authors declare no conflict of interest.

References

  1. Lucht, W.; Prentice, C.; Myneni, R.B.; Sitch, S.; Friedlingstein, P.; Cramer, W.; Bousquet, P.; Buermann, W.; Smith, B. Climatic control of the high-latitude vegetation greening trend and pinatubo effect. Science 2002, 296, 1687–1689. [Google Scholar] [CrossRef] [PubMed]
  2. Zhu, Z.; Bi, J.; Pan, Y.; Ganguly, S.; Anav, A.; Xu, L.; Samanta, A.; Piao, S.; Nemani, R.R.; Myneni, R.B. Global data sets of Vegetation Leaf Area Index (LAI)3g and Fraction of Photosynthetically Active Radiation (FPAR)3g derived from Global Inventory Modeling and Mapping Studies (GIMMS) Normalized Difference Vegetation Index (NDVI3g) for the period 1981 to 2011. Remote Sens. 2013, 5, 927–948. [Google Scholar]
  3. Fang, J.; Piao, S.; Field, C.B.; Pan, Y.; Guao, Q.; Zhou, L.; Peng, C.; Tao, S. Increasing net primary production in China from 1982 to 1999. Front. Ecol. Environ. 2003, 1, 293–297. [Google Scholar] [CrossRef]
  4. Zhou, L.; Tucker, C.T.; Kaufmann, R.K.; Slayback, D.; Shabanov, N.V.; Myneni, R.B. Variations in northern vegetation activity inferred from satellite data of vegetation index during 1981 to 1999. J. Geophys. Rese. Atmos. 2001, 106, 20069–20083. [Google Scholar] [CrossRef]
  5. Myneni, R.B.; Keeling, C.D.; Tucker, C.J.; Asrar, G.; Nemani, R.R. Increased plant growth in the northern high latitudes from 1981 to 1991. Nature 1997, 386, 698–702. [Google Scholar] [CrossRef]
  6. Higginbottom, T.; Symeonakis, E. Assessing land degradation and desertification using vegetation index data: Current frameworks and future directions. Remote Sens. 2014, 6, 9552–9575. [Google Scholar] [CrossRef]
  7. De Jong, R.; Schaepman, M.E.; Furrer, R.; de Bruin, S.; Verburg, P.H. Spatial relationship between climatologies and changes in global vegetation activity. Glob. Chang. Biol. 2013, 19, 1953–1964. [Google Scholar] [CrossRef] [PubMed]
  8. Li, S.; Lü, S.; Liu, Y.; Gao, Y.; Ao, Y. Variations and trends of terrestrial NPP and its relation to climate change in the 10 CMIP5 models. J. Earth Syst. Sci. 2015, 124, 395–403. [Google Scholar] [CrossRef]
  9. Forkel, M.; Carvalhais, N.; Verbesselt, J.; Mahecha, M.D.; Neigh, C.S.R.; Reichstein, M. Trend change detection in NDVI time series: Effects of inter-annual variability and methodology. Remote Sens. 2013, 5, 2113–2144. [Google Scholar] [CrossRef]
  10. Dan, L.; Ji, J.; He, Y. Use of ISLSCP II data to intercompare and validate the terrestrial net primary production in a land surface model coupled to a general circulation model. J. Geophys. Res. Atmos. 2007, 112. [Google Scholar] [CrossRef]
  11. Cao, M.; Prince, S.D.; Small, J.; Goetz, S.J. Remotely sensed interannual variations and trends in terrestrial net primary productivity 1981–2000. Ecosystems 2004, 7, 233–242. [Google Scholar] [CrossRef]
  12. Nemani, R.R.; Keeling, C.D.; Hashimoto, H.; Jolly, M.F.; Piper, S.C.; Tucker, C.J.; Myneni, R.B.; Running, S.W. Climate-Driven increases in global terrestrial net primary production from 1982 to 1999. Science 2003, 300, 1560–1563. [Google Scholar] [CrossRef] [PubMed]
  13. Friedlingstein, P.; Cox, P.; Betts, R.; Bopp, L.; Von Bloh, W.; Brovkin, V.; Cadule, P.; Doney, S.; Eby, M.; Fung, I.; et al. Climate-Carbon cycle feedback analysis: Results from the C4MIP model intercomparison. J. Clim. 2006, 19, 3337–3353. [Google Scholar] [CrossRef]
  14. Todd-Brown, K.E.O.; Randerson, J.T.; Post, W.M.; Hoffman, F.M.; Tarnocai, C.; Schuur, E.A.G.; Allison, S.D. Causes of variation in soil carbon simulations from CMIP5 Earth system models and comparison with observations. Biogeosciences 2013, 10, 1717–1736. [Google Scholar] [CrossRef]
  15. Sitch, S.; Huntingford, C.; Gedney, N.; Levy, P.E.; Lomas, M.; Piao, S.L.; Betts, R.; Ciais, P.; Cox, P.; Friedlingstein, P.; et al. Evaluation of the terrestrial carbon cycle, future plant geography and climate-carbon cycle feedbacks using five Dynamic Global Vegetation Models (DGVMs). Glob. Chang. Biol. 2008, 14, 2015–2039. [Google Scholar] [CrossRef]
  16. Bala, G.; Joshi, J.; Chatuvedi, R.K.; Gangamani, H.V.; Hashimoto, H.; Nemani, R. Trends and variability of AVHRR-derived NPP in India. Remote Sens. 2013, 5, 810–829. [Google Scholar] [CrossRef]
  17. Knorr, W.; Heimann, M. Uncertainties in global terrestrial biosphere modeling: 1. A comprehensive sensitivity analysis with a new photosynthesis and energy balance scheme. Glob. Biogeochem. Cycles 2001, 15, 207–225. [Google Scholar] [CrossRef]
  18. Gutman, G.G. On the use of long-term global data of land reflectances and vegetation indices derived from the advanced very high resolution radiometer. J. Geophys. Res. Atmos. 1999, 104, 6241–6255. [Google Scholar] [CrossRef]
  19. Zhang, P.; Anderson, B.; Tan, B.; Huang, D.; Myneni, R. Potential monitoring of crop production using a satellite-based Climate-Variability Impact Index. Agric. For. Meteorol. 2005, 132, 344–358. [Google Scholar] [CrossRef]
  20. Myneni, R.B.; Hall, F.G. The interpretation of spectral vegetation indexes. IEEE Trans. Geosci. Remote Sens. 1995, 33, 481–486. [Google Scholar] [CrossRef]
  21. Asrar, G.; Fuchs, M.; Kanemasu, E.T.; Hatfield, J.L. Estimating Absorbed Photosynthetic Radiation and Leaf Area Index from Spectral Reflectance in Wheat. Agron. J. 1984, 76, 300–306. [Google Scholar] [CrossRef]
  22. DeFries, R.; Hansen, M.; Townshend, J. Global discrimination of land cover types from metrics derived from AVHRR pathfinder data. Remote Sens. Environ. 1995, 54, 209–222. [Google Scholar] [CrossRef]
  23. Tucker, C.J.; Pinzon, J.E.; Brown, M.E.; Slayback, D.A.; Pak, E.W.; Mahoney, R.; Vermote, E.F.; El Saleous, N. An extended AVHRR 8-km NDVI dataset compatible with MODIS and SPOT vegetation NDVI data. Int. J. Remote Sens. 2005, 26, 4485–4498. [Google Scholar] [CrossRef]
  24. Pinzon, J.E.; Tucker, C.J. A non-stationary 1981–2012 AVHRR NDVI3g time series. Remote Sens 2014, 6, 6929–6960. [Google Scholar] [CrossRef]
  25. Peng, S.; Ciais, P.; Chevallier, F.; Peylin, P.; Cadule, P.; Sitch, S.; Piao, S.; Ahlström, A.; Huntingford, C.; Levy, P.; et al. Benchmarking the seasonal cycle of CO2 fluxes simulated by terrestrial ecosystem models. Glob. Biogeochem. Cycles 2015, 29, 46–64. [Google Scholar] [CrossRef]
  26. Shao, P.; Zeng, X.; Sakaguchi, K.; Monson, R.K.; Zeng, X. Terrestrial carbon cycle: Climate relations in eight CMIP5 Earth system models. J. Clim. 2013, 26, 8744–8764. [Google Scholar] [CrossRef]
  27. Mueller, T.; Dressler, G.; Tucker, C.J.; Pinzon, J.E.; Leimgruber, P.; Dubayah, R.O.; Hurtt, G.C.; Böhning-Gaese, K.; Fagan, W.F. Human land-use practices lead to global long-term increases in photosynthetic capacity. Remote Sens. 2014, 6, 5717–5731. [Google Scholar] [CrossRef]
  28. Piao, S.; Ciais, P.; Friedlingstein, P.; de Noblet-Ducoudre, N.; Cadule, P.; Viovy, N.; Wang, T. Spatiotemporal patterns of terrestrial carbon cycle during the 20th century. Glob. Biogeochem. Cycles 2009, 23. [Google Scholar] [CrossRef]
  29. Zhao, M.; Running, S.W. Drought-Induced reduction in global terrestrial net primary production from 2000 through 2009. Science 2010, 329, 940–943. [Google Scholar] [CrossRef] [PubMed]
  30. Sitch, S.; Friedlingstein, P.; Gruber, N.; Jones, S.D.; Murray-Tortarolo, G.; Ahlström, A.; Doney, S.C.; Graven, H.; Heinze, C.; Huntingford, C.; et al. Recent trends and drivers of regional sources and sinks of carbon dioxide. Biogeosciences 2015, 12, 653–679. [Google Scholar] [CrossRef] [Green Version]
  31. Chen, J.M.; Chen, B.; Higuchi, K.; Liu, J.; Chan, D.; Worthy, D.; Tans, P.; Black, A. Boreal ecosystems sequestered more carbon in warmer years. Geophys. Res. Lett. 2006, 33. [Google Scholar] [CrossRef]
  32. Miranda-Aragón, L.; Treviño-Garza, E.J.; Jiménez-Pérez, J.; Aguirre-Calderón, O.A.; González-Tagle, M.A.; Pompa-García, M.; Aguirre-Salado, C.A. NDVI-rainfall relationship using hyper-temporal satellite data in a portion of North Central Mexico (2000–2010). Afr. J. Agric. Res. 2012, 7, 1023–1033. [Google Scholar]
  33. Zeng, N.; Zhao, F.; Collatz, G.J.; Kalnay, E.; Salawitch, R.J.; West, T.O.; Guanter, L. Agricultural Green Revolution as a driver of increasing atmospheric CO2 seasonal amplitude. Nature 2014, 515, 394–397. [Google Scholar] [CrossRef]
  34. Janssens, I.A.; Dieleman, W.; Luyssaert, S.; Subke, J.A.; Reichstein, M.; Ceulemans, R.; Ciais, P.; Dolman, A.J.; Grace, J.; Matteucci, G.; et al. Reduction of forest soil respiration in response to nitrogen deposition. Nat. Geosci. 2010, 3, 315–322. [Google Scholar] [CrossRef]
  35. Mann, C.C. Addicted to rubber. Science 2009, 325, 564–566. [Google Scholar] [CrossRef] [PubMed]
  36. Beck, P.S.; Goetz, S.J. Satellite observations of high northern latitude vegetation productivity changes between 1982 and 2008: Ecological variability and regional differences. Environ. Res. Lett. 2011, 6, 045501. [Google Scholar] [CrossRef]
  37. Allen, C.D.; Macalady, A.K.; Chenchouni, H.; Bachelet, D.; McDowell, N.; Vennetier, M.; Kitzberger, T.; Rigling, A.; Breshears, D.D.; Hogg, E.T.; et al. A global overview of drought and heat-induced tree mortality reveals emerging climate change risks for forests. For. Ecol. Manag. 2010, 259, 660–684. [Google Scholar] [CrossRef]
  38. Seaquist, J.W.; Hickler, T.; Eklundh, L.; Ardö, J.; Heumann, B.W. Disentangling the effects of climate and people on Sahel vegetation dynamics. Biogeosciences 2009, 6, 469–477. [Google Scholar] [CrossRef]
  39. Valentini, R.; Matteucci, G.; Dolman, A.J.; Schulze, E.D.; Rebmann, C.J.M.E.A.G.; Moors, E.J.; Granier, A.; Gross, P.; Jensen, N.O.; Pilegaard, K.; et al. Respiration as the main determinant of carbon balance in European forests. Nature 2000, 404, 861–865. [Google Scholar] [CrossRef] [PubMed]
  40. Xu, C.; Li, X.; Hu, J.; Yang, X.; Sheng, S.; Liu, M. Evaluating the difference between the normalized difference vegetation index and net primary productivity as the indicators of vegetation vigor assessment at landscape scale. Environ. Monit. Assess. 2012, 184, 1275–1286. [Google Scholar] [CrossRef] [PubMed]
  41. Schloss, A.L.; Kicklighter, D.W.; Kaduk, J.; Wittenberg, U.; Intercomparison, T.; Model, P.O.T.P.N. Comparing global models of terrestrial net primary productivity (NPP): Comparison of NPP to climate and the Normalized Difference Vegetation Index (NDVI). Glob. Chang. Biol. 1999, 5 (Suppl. S1), 25–34. [Google Scholar] [CrossRef]
  42. Rafique, R.; Kumar, S.; Luo, Y.; Kiely, G.; Asrar, G. An algorithmic calibration approach to identify globally optimal parameters for constraining the DayCent model. Ecol. Model. 2015, 297, 196–200. [Google Scholar] [CrossRef]
  43. Diner, D.J.; Asner, G.P.; Davies, R.; Knyazilkhin, Y.; Muller, J.P.; Nolin, A.W.; Pinty, B.; Schaaf, C.B.; Stroeve, J. New directions in earth observing: Scientific applications of multiangle remote sensing. Bull. Am. Meteorol. Soc. 1999, 80, 2209–2228. [Google Scholar] [CrossRef]
  44. Huete, A.; Jackson, R. Soil and atmosphere influences on the spectra of partial canopies. Remote Sens. Environ. 1988, 25, 89–105. [Google Scholar] [CrossRef]
  45. Huete, A.; Didan, K.; Miura, T.; Rodriguez, E.P.; Gao, X.; Ferreira, L.G. Overview of the radiometric and biophysical performance of the MODIS vegetation indices. Remote Sens. Environ. 2002, 83, 195–213. [Google Scholar] [CrossRef]
  46. Fang, Y.; Liu, C.; Huang, M.; Li, H.; Leung, L.R. Steady state estimation of soil organic carbon using satellite-derived canopy leaf area index. J. Adv. Model. Earth Syst. 2014, 6, 1049–1064. [Google Scholar] [CrossRef]
  47. Wullschleger, S.D.; Epstein, H.E.; Box, E.O.; Euskirchen, E.S.; Goswami, S.; Iversen, C.M.; Kattge, J.; Norby, R.J.; van Bodegom, P.M.; Xu, X. Plant functional types in Earth system models: Past experiences and future directions for application of dynamic vegetation models in high-latitude ecosystems. Ann. Bot. 2014, 114, 1–16. [Google Scholar] [CrossRef] [PubMed]
  48. Kurz, W.A.; Stinson, G.; Rampley, G. Could increased boreal forest ecosystem productivity offset carbon losses from increased disturbances? Philos. Trans. R. Soc. B Biol Sci. 2008, 363, 2261–2269. [Google Scholar] [CrossRef] [PubMed]
  49. Pan, S.; Tian, H.; Dangal, S.R.; Zhang, C.; Yang, J.; Tao, B.; Ouyang, Z.; Wang, X.; Lu, C.; Ren, W.; et al. Complex spatiotemporal responses of global terrestrial primary production to climate change and increasing atmospheric CO2 in the 21st century. PLoS ONE 2014, 9, e112810. [Google Scholar] [CrossRef] [PubMed]
Figure 1. Spatial trends of the NDVI and five TRENDY models ensemble mean (MME) for 1982–2012 period.
Remotesensing 08 00177 g001
Figure 2. The multi-decadal and global pattern of simulated NPP trends for 1982–2012 period, based on five TRENDY models described in Table 1.
Remotesensing 08 00177 g002
Figure 3. The relation between NDVI and modeled NPP from TRENDY models for the period of 1982–2012.
Remotesensing 08 00177 g003
Figure 4. The modeled NPP and NDVI at global and regional (Boreal, Temperate, Tropics and Extra Tropics) levels, for the period of 1982–2012. Thick black line represents the MME, and shaded gray area captures the models’ spread.
Remotesensing 08 00177 g004
Figure 5. A comparison of five TRENDY models’ NPP and observed NDVI at global and regional (Boreal, Temperate, Tropics and Extra Tropics) levels, for the period of 1982–2012. Black line represents the NDVI trend.
Remotesensing 08 00177 g005
Figure 6. A latitudinal comparison of simulated NPP and observed NDVI trends. The thick black line represents the TRENDY multi-model ensemble, and the shaded gray area captures the models’ spread.
Remotesensing 08 00177 g006
Figure 7. A latitudinal comparison between NDVI and simulated NPP trends for the five TRENDY models.
Remotesensing 08 00177 g007
Table 1. Fundamental features of the five trends and drivers of the regional scale sources and sinks of carbon dioxide (TRENDY) ecosystem models used in this study [25].
ModelsResolution (Degrees)Period
CLM4.5192 × 2881860–2012
JULES192 × 1121860–2012
LPJ720 × 3601901–2012
OCN360 × 1501901–2012
VEGAS720 × 3601860–2013
Table 2. Some statistics of global simulated net primary productivity (NPP) and observed Normalized Difference Vegetation Index (NDVI) trends at every land pixels for the 1982–2012 period. Land pixels were defined using five models mean ensemble (MME) for land area as a reference, excluding Antarctica and part of Greenland.
Models/DataFraction (%) > 0Fraction (%) < 0% of Statistically Significant Land Pixels (p < 0.05)
MME79.4620.5450
CLM4.580.3519.6536
JULES67.8232.1844
LPJ71.6628.3430
OCN83.3516.6548
VEGAS78.8221.1858
NDVI67.1532.8548
Table 3. The global and regional trend rates of NDVI, with associated level of statistical significance and standard error (SE). The computed NDVI trend rates are benchmarked to the year 1982.
Spatial UnitTrend (NDVI·y−1)SE
Global0.00041 **0.03
Boreal0.00038 **0.03
Temperate0.00052 **0.03
Tropics0.00048 **0.03
Extra Tropics0.00011 *0.04
** shows where p < 0.01 and * shows where p < 0.05.
Table 4. Spatial features of modeled NPP at global and regional levels along with their trend rates and statistical significance level and standard error (SE).
Global
ModelsNPP (Pg C·y−1)Trend (Pg C·y−1·y−1)SE
MME62.900.214 **0.03
CLM4.564.750.184 **0.02
JULES72.40.359 **0.05
LPJ53.720.148 **0.03
OCN60.780.238 **0.03
VEGAS62.850.141 **0.02
Boreal (50 N–90 N)
MME9.680.051 **0.06
CLM4.59.390.038 **0.06
JULES11.420.080 **0.08
LPJ11.330.042 **0.07
OCN9.190.050 **0.07
VEGAS7.060.043 **0.08
Temperate (25 N–50 N)
MME13.550.034 **0.05
CLM4.514.040.032 **0.04
JULES14.160.037 **0.08
LPJ10.570.026 **0.08
OCN14.480.050 **0.06
VEGAS14.490.026 **0.04
Tropics (25 S–25 N)
MME36.240.126 **0.05
CLM4.537.740.109 **0.04
JULES42.80.237 **0.08
LPJ29.890.081 **0.05
OCN33.970.133 **0.04
VEGAS36.780.072 **0.04
Extra Tropics (25 S–90 S)
MME3.440.003 *0.13
CLM4.53.580.006 *0.14
JULES4.030.005 *0.23
LPJ1.93−0.001 *0.23
OCN3.150.005 *0.10
VEGAS4.530.001 *0.09
MME represents multi-models ensemble, ** shows where p < 0.01 and * shows where p < 0.05.
Table 5. Correlation coefficients between NDVI and modeled NPP at global and regional levels along with their statistical significance level (p < 0.05).
Spatial UnitCLM4.5JULESLPJOCNVEGASMME
Global0.590.610.600.660.670.64
Boreal0.640.640.630.710.680.69
Temperate0.720.560.500.730.670.73
Tropics0.420.490.500.490.500.50
Extra Tropics0.440.500.480.670.570.59
MME represents multi-models ensemble.

