Article

High-Resolution Classification of South Patagonian Peat Bog Microforms Reveals Potential Gaps in Up-Scaled CH4 Fluxes by use of Unmanned Aerial System (UAS) and CIR Imagery

by
Jan R. K. Lehmann
1,*,†,
Wiebke Münchberger
1,*,†,
Christian Knoth
2,
Christian Blodau
1,
Felix Nieberding
1,
Torsten Prinz
2,
Verónica A. Pancotto
3 and
Till Kleinebecker
1
1
Institute of Landscape Ecology, University of Muenster, Heisenbergstr. 2, 48149 Muenster, Germany
2
Institute for Geoinformatics, University of Muenster, Heisenbergstr. 2, 48149 Muenster, Germany
3
Centro Austral de Investigaciones Científicas (CADIC-CONICET), B. Houssay 200, 9410 Ushuaia, Tierra del Fuego, Argentina
*
Authors to whom correspondence should be addressed.
These authors contributed equally to this work.
Remote Sens. 2016, 8(3), 173; https://doi.org/10.3390/rs8030173
Submission received: 13 November 2015 / Revised: 2 February 2016 / Accepted: 14 February 2016 / Published: 25 February 2016
(This article belongs to the Special Issue Remote Sensing of Biogeochemical Cycles)

Abstract

:
South Patagonian peat bogs are little studied sources of methane (CH4). Since CH4 fluxes can vary greatly on a small scale of meters, high-quality maps are needed to accurately quantify CH4 fluxes from bogs. We used high-resolution color infrared (CIR) images captured by an Unmanned Aerial System (UAS) to investigate potential uncertainties in total ecosystem CH4 fluxes introduced by the classification of the surface area. An object-based approach was used to classify vegetation both on species and microform level. We achieved an overall Kappa Index of Agreement (KIA) of 0.90 for the species- and 0.83 for the microform-level classification, respectively. CH4 fluxes were determined by closed chamber measurements on four predominant microforms of the studied bog. Both classification approaches were employed to up-scale CH4 closed chamber measurements in a total area of around 1.8 hectares. Including proportions of the surface area where no chamber measurements were conducted, we estimated a potential uncertainty in ecosystem CH4 fluxes introduced by the classification of the surface area. This potential uncertainty ranged from 14.2 mg·m−2·day−1 to 26.8 mg·m−2·day−1. Our results show that a simple classification with only few classes potentially leads to pronounced bias in total ecosystem CH4 fluxes when plot-scale fluxes are up-scaled.

Graphical Abstract

1. Introduction

The effects of human activities on the carbon cycle receive much attention worldwide from both research and public perspective. Carbon cycling in peatlands is an important feature of the global carbon cycle because these ecosystems are important carbon sinks [1,2], but are main sources of methane (CH4) [1,3,4]. Methane fluxes typically vary temporally and on spatial scales from the microform to the ecosystem level [4,5,6]. In this context, northern peat bogs have been extensively studied, especially those found in the boreal zone [1,2,4,5,7]. Southern peat bogs, however, are comparatively little explored [8,9]; this is particularly true of Patagonian peat bogs [10], which have been affected little by human activities [8,10,11]. Consequently, research in Patagonian peat bogs can enhance our understanding of CH4 fluxes from pristine ecosystems.
Patagonian peat bogs are characterized by a small-scale spatial heterogeneity of different microforms [12] similar to northern boreal peatlands [13]. This patterned surface is the well-studied result of the microtopography of the bog and distinct vegetation communities characterized by different water levels. While water table depth is one of the main controls of CH4 production, CH4 emissions can be strongly associated with a specific vegetation type [5,7]. Consequently, the spatial pattern of these controlling factors leads to a pronounced small-scale heterogeneity of CH4 fluxes.
One frequently applied method to quantify CH4 fluxes on a microform level (<1 m2) is the use of closed chambers [14]. Usually representative plots within the peat bog are selected, which cover the spatial heterogeneity of the study site. Gas exchange rates from these plots can then be extrapolated to larger areas or the entire ecosystem. The number of microforms considered is usually limited to the most prominent ones. This simplification may constrain the possibility for up-scaling. Therefore, the classification of microforms is a crucial step when CH4 fluxes are up-scaled to generalize fluxes on a larger scale, and accurate microtopography and vegetation distribution maps are needed. Compiling detailed information on the distribution of plant species or the microtopography across a large land area is resource intensive. Vegetation mapping on sample plots or along transects covers usually only a fraction of the study area and is not necessarily representative for the entire wetland system. Therefore, remote sensing is a promising option for large-scale exploration of bog ecosystems [15].
Remote sensing, especially using multi- and hyperspectral techniques and LiDAR sensors, provides valuable information on spatial characteristics of peat bogs [16,17,18,19,20,21]. With advances in modern sensor technology, the quality of such image data is continually improving. Nevertheless, the spatial ground resolution (pixel size) of commonly used satellites, such as WorldView 2 (1.85 m with 8-Band multispectral sensor) often limits the identification of small-scale vegetation patterns [21,22,23]. Becker et al. [24] recommend a minimum ground resolution of 25 cm to identify small-scale hot-spots of CH4 emission in peat bogs. For the detection of larger microforms (e.g., hummocks and lawns) and a realistic estimation of ecosystem-scale carbon fluxes a minimum ground resolution of 60 cm is needed [24]. Both resolution requirements show that even high-resolution satellite imagery is not able to capture the small-scale heterogeneity relevant for accurate up-scaling of processes relevant for carbon cycling. Airborne remote sensing sensors (e.g., small hyperspectral cameras) carried by manned aircraft or helicopters are an alternative approach. Such sensors can provide the necessary high spatial, temporal and spectral resolution image data [16,25]. However, high image acquisition costs and the dependence on an airport infrastructure near to the study sites can be limiting factors for investigations.
To overcome the limitations of conventional remote sensing approaches, an Unmanned Aerial System (UAS) is a welcome alternative to survey peat bogs [26,27,28]. Other than the advantage of high flexibility, data collection is quick and cost-effective and image data can be customized to the specific requirements of the user in terms of grain size and image extent. Technical equipment is now readily available from commercial sources. The number of studies using an UAS as a sensor platform has thus greatly increased [29,30,31,32,33,34]. Especially for vegetation mapping and monitoring purposes, color-infrared (CIR) image data have proven to be extremely effective as plants have the strongest variation in reflectance in the near-infrared (NIR) region [35]. High-resolution (<2 cm) CIR imagery paired with object-based classification techniques are considered to be a promising tool for peat bog monitoring [26].
Taking advantage of modern UAS technology and high-resolution imagery, the present study investigates uncertainties in the up-scaling of CH4 fluxes that are introduced by the classification of bog vegetation. Two different object-based classification approaches were tested: (1) a detailed classification of the distribution of characteristic bog plant species; and (2) a less detailed classification of dominant bog microforms. Using both approaches, we scaled microform CH4 fluxes up to examine the effect on the total amount of the emitted CH4 on the ecosystem scale.

2. Material and Methods

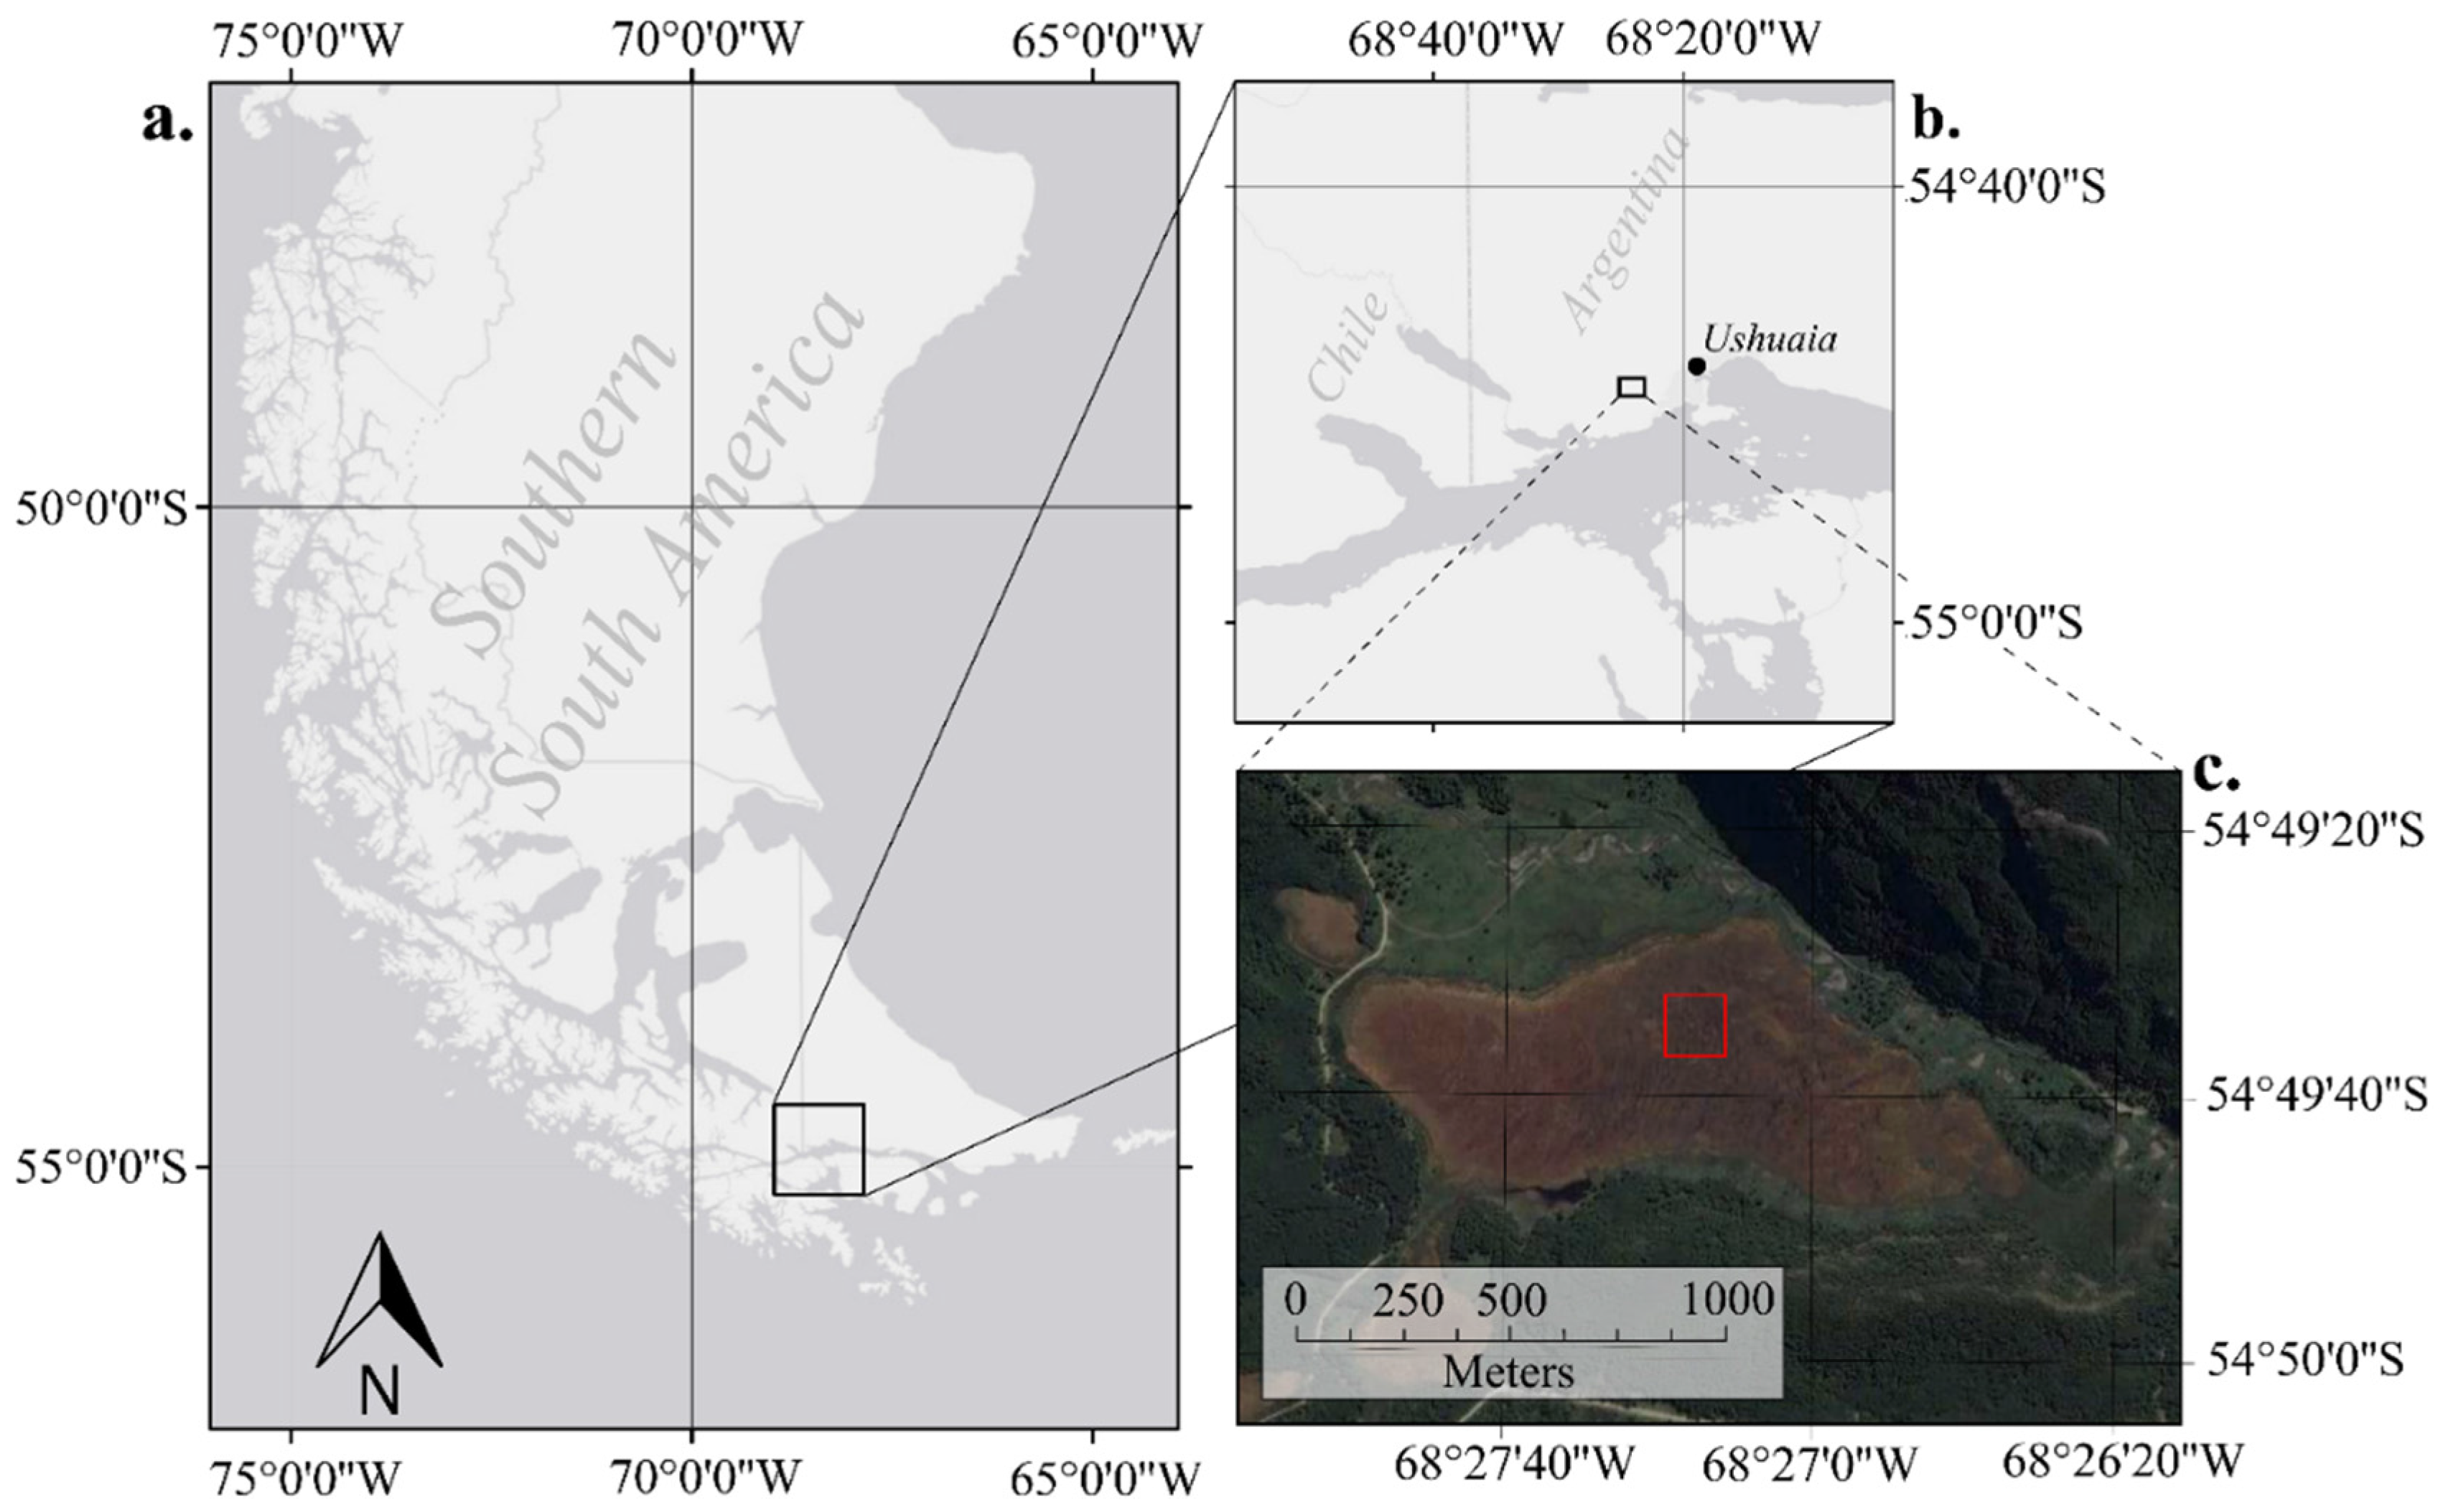
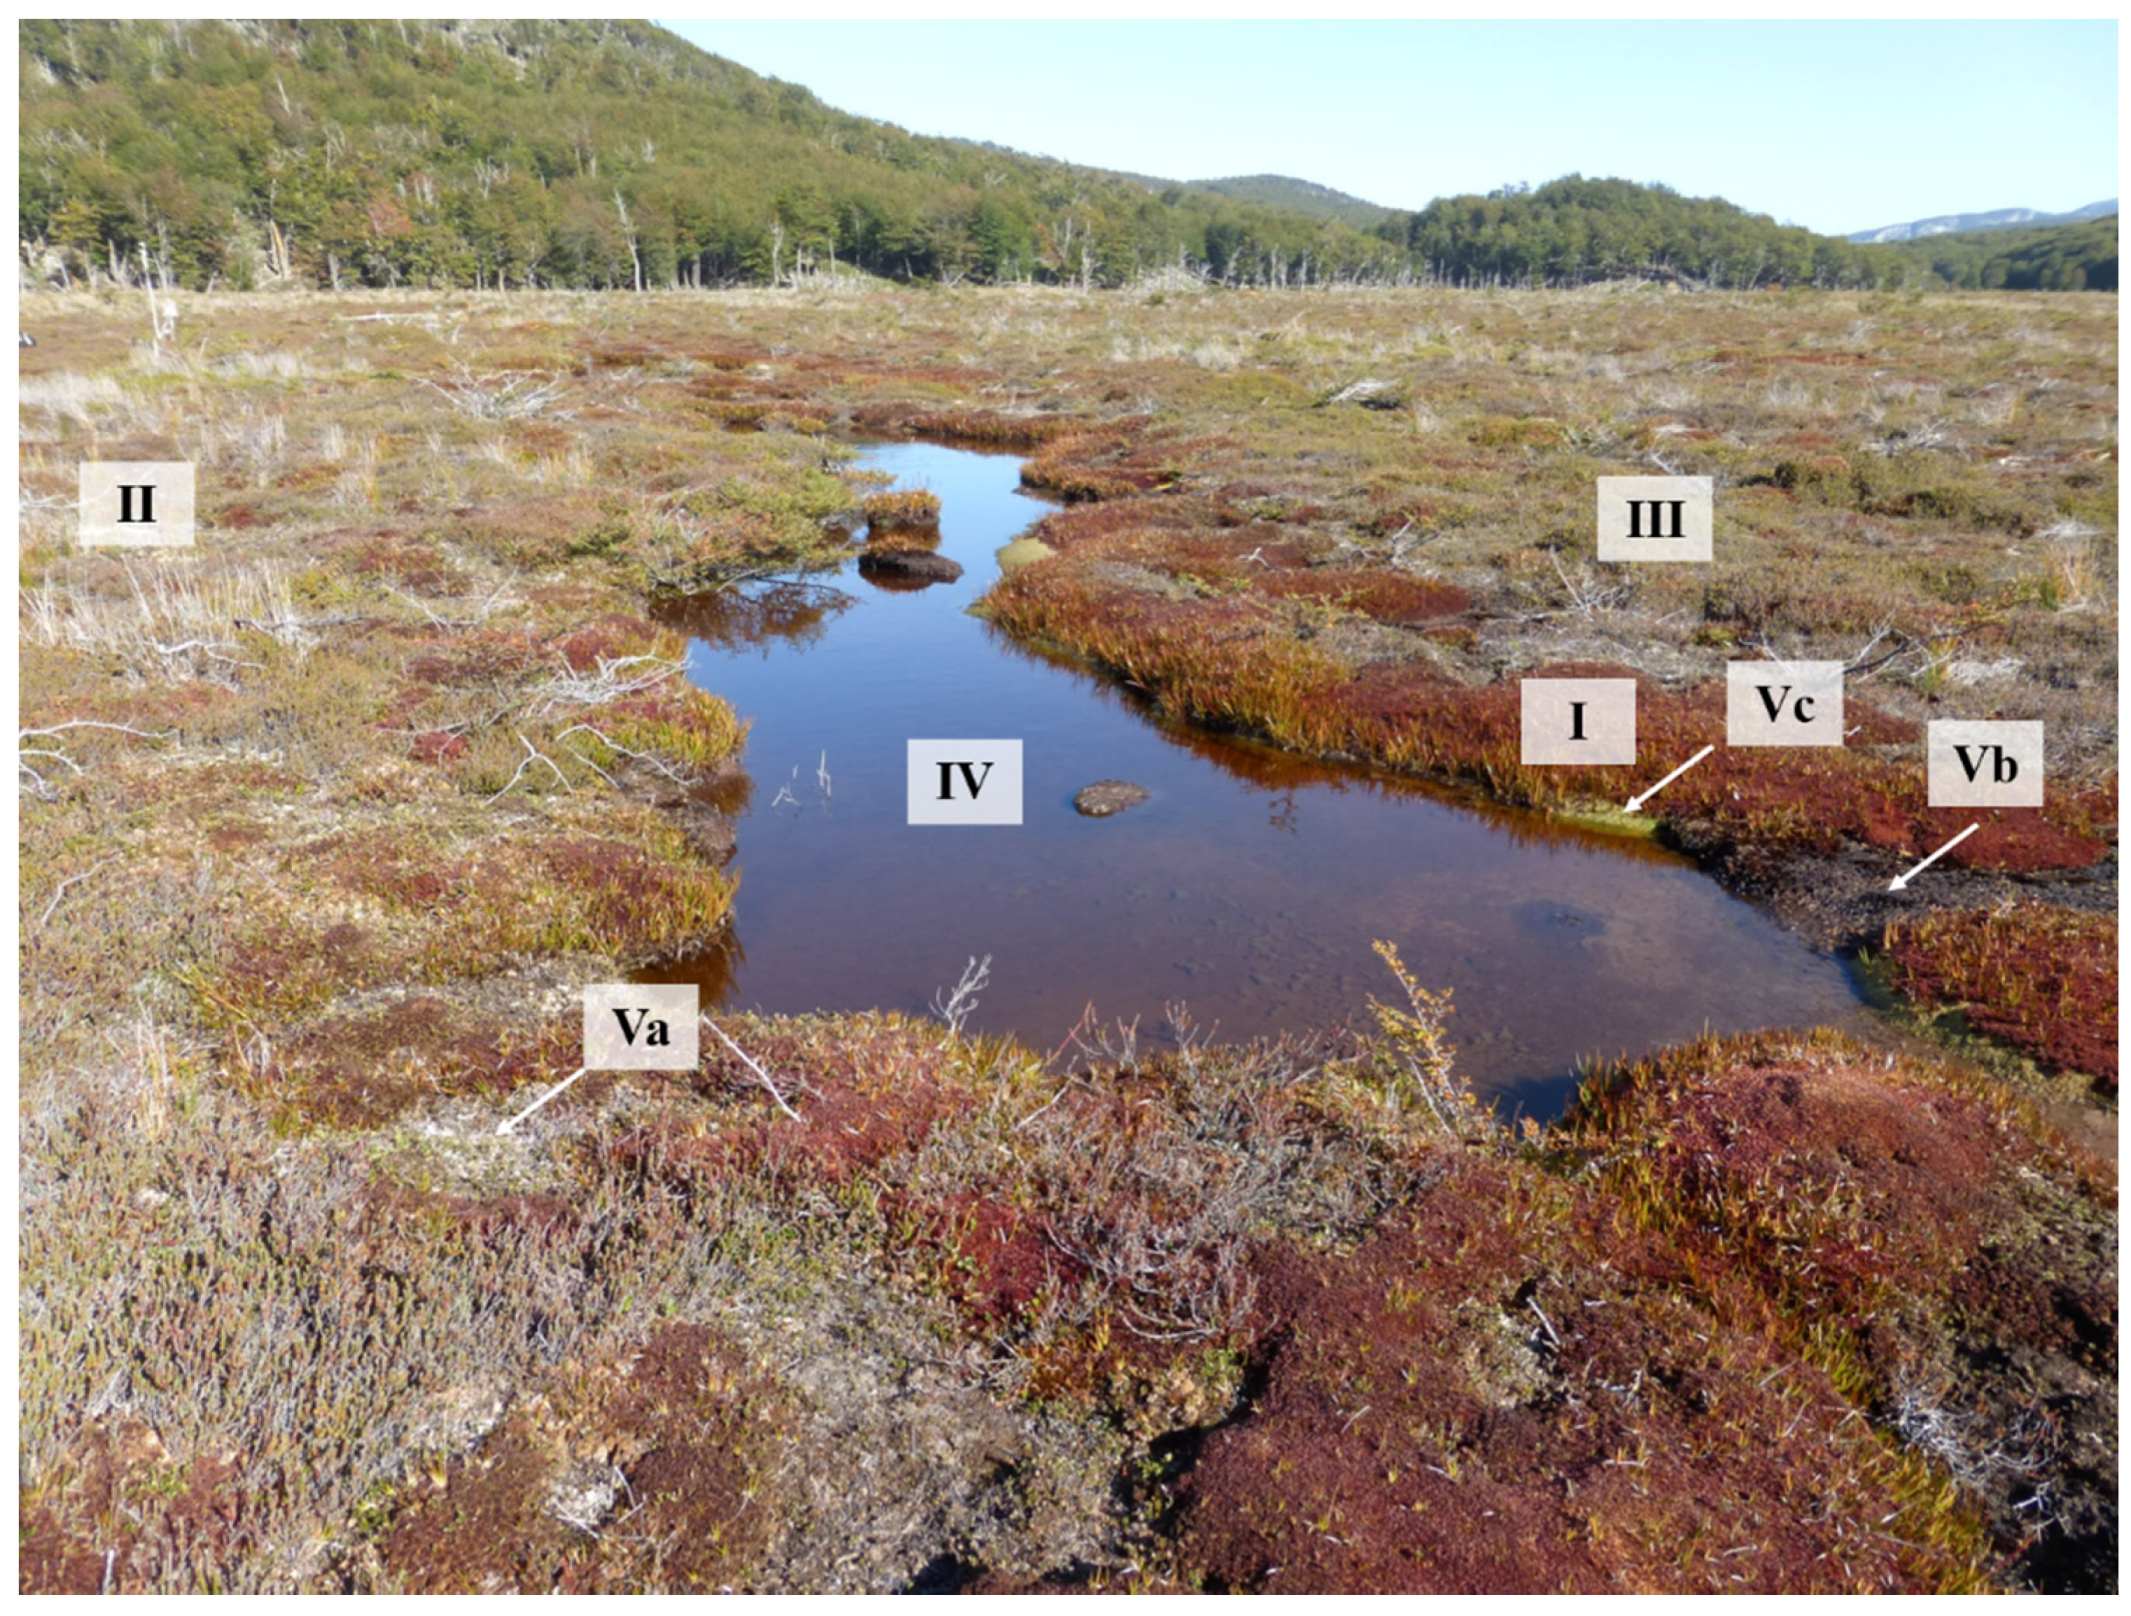
2.1. Site Description

The study area is located at 54°49′S, 68°27′W in a pristine Sphagnum-dominated bog in South Patagonia, Argentina (Figure 1) and is a part of the National Park “Tierra del Fuego” (Administración de Parques Nacionales). The climate at the study site is oceanic with a mean annual temperature of 5 °C and a mean annual precipitation of 487 mm (Servico Meterológico Nacional; for the period between 1981 and 1990). Strong winds and mild winters are typical for the region [10].
The surface of the studied bog was composed of a mosaic of different microforms following the micro-relief (Figure 2). Hummock microforms occurred along a moisture gradient with driest hummocks elevated about 50 cm above the water table. These dry Sphagnum hummocks were dominated by the peat moss Sphagnum magellanicum and the dwarf-shrub Empetrum rubrum and distinctly characterized by living and dead shoots of the rush Marsippospermum grandiflorum. Intermediate hummocks less elevated above the water table compared to dry hummocks were characterized by higher dominance of Sphagnum magellanicum and lower cover of Empetrum rubrum and Marsippospermum grandiflorum, as well as the absence of species indicative for wet Sphagnum lawns. These wet Sphagnum lawns with a water table close to the surface were purely dominated by Sphagnum magellanicum. Dry to intermediate hummocks were also observed to be dominated by Empetrum rubrum with a cover up to 100% (named Empetrum heath microform). Other frequently occurring vascular plants such as Tetroncium magellanicum, Gaultheria antarctica, Nothofagus antarctica, Carex magellanica, Rostkovia magellanica, Nanodea muscosa and Pernettya pumila showed distinctive distribution patterns along the microform moisture gradient, but were usually present with low cover [36]. Additionally, there were large areas of bog pools consisting of either open water bodies or floating Sphagnum cuspidatum. To describe the vegetation of the dominant microforms, we visually estimated the cover of each plant species on 1 m × 1 m plots accurate to the nearest 5%. Lichens and mosses other than Sphagnum magellanicum and Sphagnum cuspidatum were not determined to species level. The dominant microforms with mean cover values of characteristic plant species are given in Table 1.

2.2. Remote Sensing

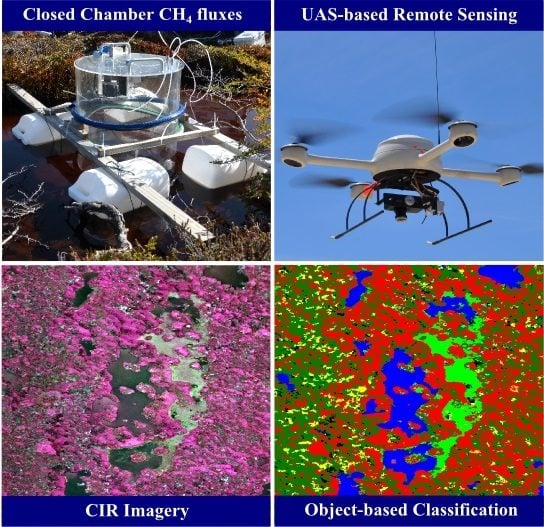
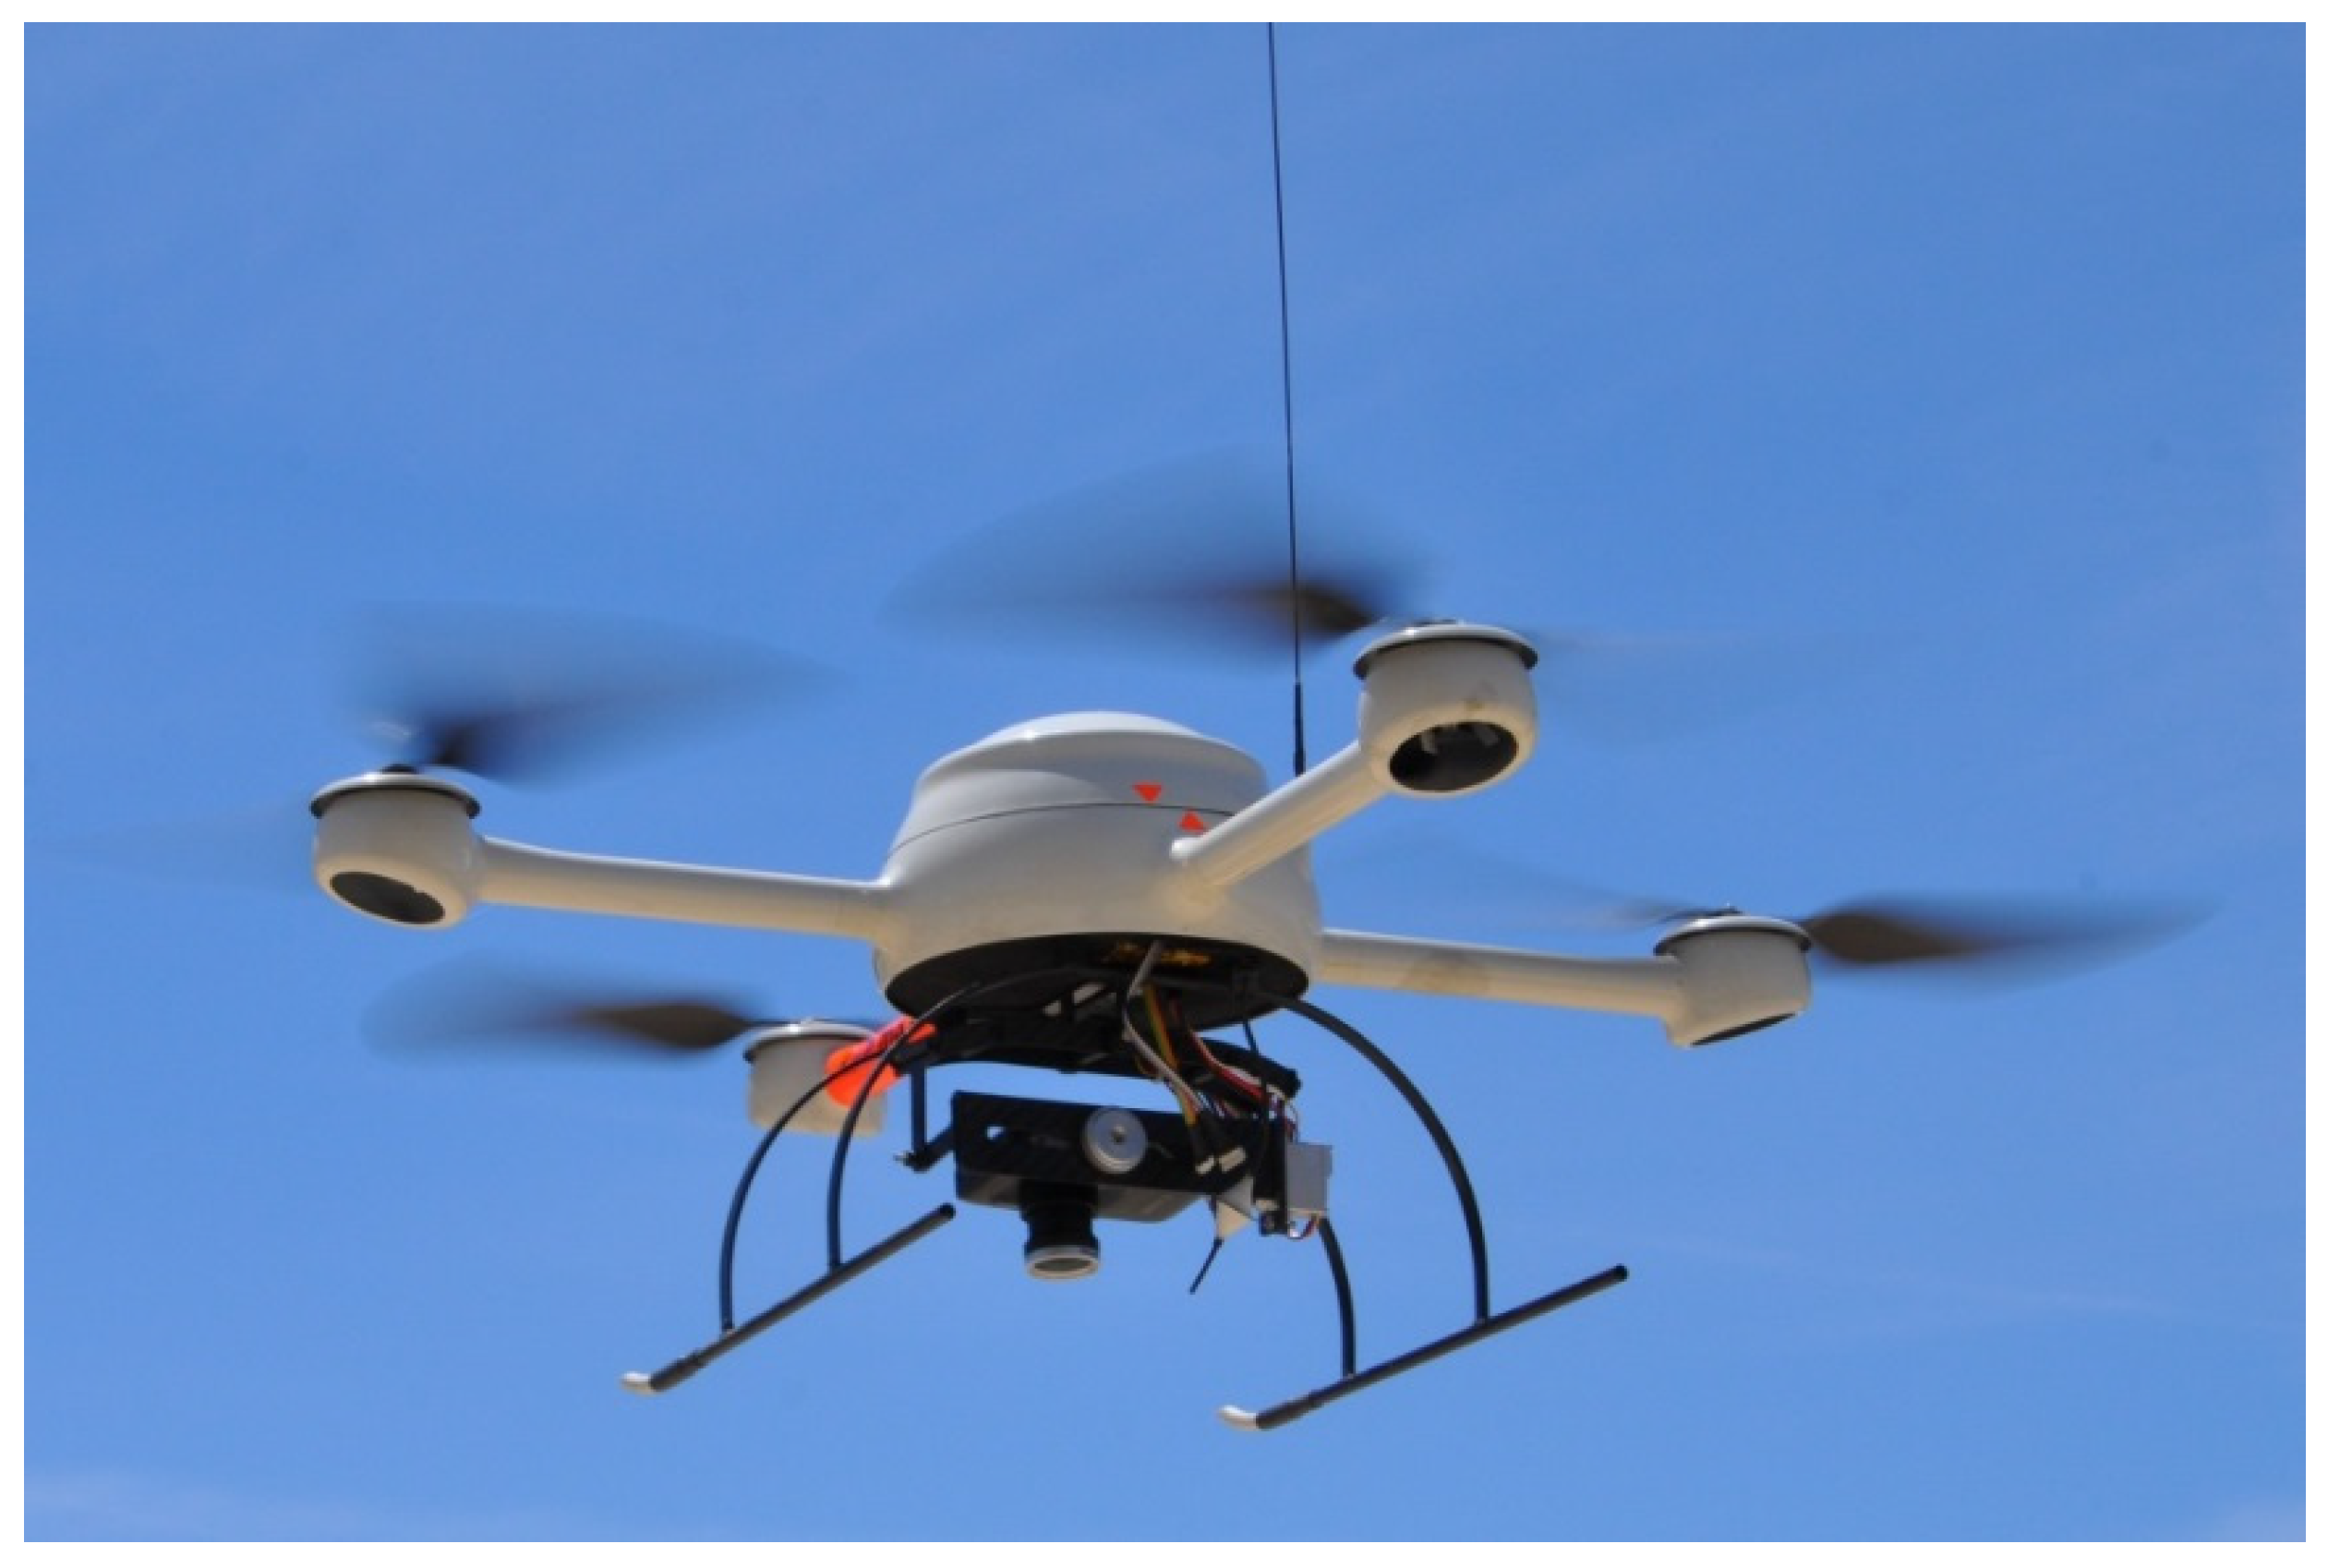
2.2.1. UAS Platform and Sensor Technique

For image data acquisition, a radio-controlled, four-propeller powered multicopter was operated as an UAS remote sensing platform (Figure 3). The used quadrocopter was a ready-made and commercially available Microdrones MD4-200 (Microdrones GmbH, Siegen, Germany). For navigation and control, this airframe is equipped with an inertial measurement unit (IMU) and a global navigation satellite system (GNSS). The system was developed for full automatic flight control, executed by pre-setting a track of waypoints and a requested flight altitude using registered (Microdrones GmbH) software. The specifications of the UAS remote sensing platform are summarized in Table 2.
In the present study, a modified Canon PowerShot SD780 IS camera was utilized to create false color composites (Figure 4). The modification includes the replacement of the “hot mirror” filter, which blocks the NIR radiation and ensures natural color images with a color effect corresponding to the human eye [37]. Due to this modification, the charge-coupled device (CCD) sensor of the camera could record NIR information. An additionally fitted cyan filter removed the visible red, enabling the system to produce false color composites where the red band was substituted by the NIR radiation. A software script installed on the SD memory card allowed setting a fixed focus, control shutter speed and lens aperture and also to release the shutter in a suitable time interval. The camera system was mounted on the UAS platform using a gimbal-mounted holder to compensate tilt and roll movements during flight enabling the vertical alignment of the optical axis during exposure. For more information about the used UAS platform and camera system, see Knoth et al. [26] and Lehmann et al. [34].

2.2.2. Image Acquisition

The CIR imagery was acquired in February 2014. The altitude Above Ground Level (AGL) was 30 m. The sensor size of the compact digital camera was 6.2 by 4.6 mm and the focal length used during the flight was 34.2 mm (35 mm equivalent). Given the flight altitude, this resulted in a ground footprint of 30.8 m × 23.1 m per image. Weather conditions were calm and sunny with scattered cloud cover forming during the time of image acquisition. Before the flights were conducted, 20 ground control points (GCPs; white Compact Discs with a diameter of 12 cm) were laid out in the studied bog and logged with a Garmin GPSMap 60CSx (~4 m accuracy) for georeferencing.

2.2.3. Data Processing and Object-Based Classification

For our further image analysis, we selected a representative bog area of 1.8 ha, which included the in situ CH4 fluxes measurement sites. The resulting imagery for this study area (241 CIR images) was preprocessed by first removing low-quality data such as blurred and under- or over-exposed images. With the remaining image data (149 CIR images) a high-resolution orthoimage mosaic with a ground resolution of less than 1.1 cm was composed using Agisoft PhotoScan Professional (v. 0.9.0; Agisoft LLC, St. Petersburg, Russia). This software uses a bundle block adjustment procedure in order to reconstruct image centre positions and orientations, from which surface models and orthoimages can then be generated. Due to low surface level differences in the studied peat bog, cast shadows caused by low illumination angles were negligible. The resulting orthoimage mosaic was georeferenced in ArcGIS (v. 10.2; ESRI, Redlands, CA, USA) using the GCPs and their GPS coordinates.
For both the species and the microform level, we performed an object-based vegetation classification using eCognition Developer software (v. 8.64.1; Trimble GeoSpatial, Sunnyvale, CA, USA). To this end, it is advantageous to use object-based image analysis (OBIA) rather than a pixel-based method to leverage the high spatial resolution of the images, with a pixel size clearly below the size of the objects of interest. OBIA allows for analyzing an extended feature space including, e.g., spectral, shape and texture characteristics. This capacity facilitates the extraction of ecologically significant image objects, making it greatly suitable for very high resolution imagery [38]. Furthermore, relational, topological and hierarchical features can be used to classify image objects on multiple levels incorporating expert knowledge on the scene context. This is particularly useful for this study, as the microforms could not be defined on the level of single plants but rather by using previous knowledge on typical species compositions (Table 1).
The classification procedure consisted of two major steps: (1) a multiresolution segmentation; and (2) an Object-Based Image Analysis (OBIA). The multiresolution segmentation was used to separate neighboring pixels into segments (objects) based on homogeneity criteria (shape/color and compactness/smoothness) and a scale factor (scale parameter), both adjustable by the user [39]. As bog vegetation can be well distinguished in the NIR-wavelength region [26], the color feature appeared as a more promising distinctive feature than shape-related characteristics. Consequently, a ratio of 0.2/0.8 for shape/color was selected (with 0.1 = lowest and 0.9 = highest possible influence of shape on the segmentation). The level of compactness and smoothness has a relatively small influence on the output objects if the shape level is set low. Thus, we used the pre-set ratio of 0.5/0.5 for the compactness/smoothness threshold. For the scale parameter, a threshold of 70 was defined by visual interpretation of the image segmentation results, based on field records and expert knowledge [10,12]. As a result, smallest segments reached a diameter of around 4 cm.
For the detailed species-level classification, the subsequent OBIA was performed using class-specific features, which have proven to be useful in previous studies applying the presented image acquisition technique [26,34]. These involved spectral information (e.g., mean green), customized vegetation indices (e.g., NDVImod), texture pattern (grey level co-occurrence matrix features (GLCM; [40]) and shape characteristics of the segments. An overview of the used object features and key thresholds is given in Table 3 and Table 4. The classification separated the image objects into seven classes, namely Sphagnum magellanicum, Sphagnum cuspidatum, Empetrum rubrum, Marsippospermum grandiflorum, lichens, dead vegetation and pools.
In contrast to the species-level classification, the classification of the dominant bog microforms required a different approach to take into account the larger floristic and structural variability within each class. These microforms cannot be identified on the species-level only, i.e., looking at single plants, but by taking into account their species composition and cover. Therefore, we added a chessboard segmentation dividing the CIR orthoimage mosaic into a regular grid of square segments. The size of these grid cells only depends on the set scale factor and not on homogeneity criteria. This characteristic leads to equal size and shape and thereby better comparability of the segments during the subsequent analysis. We selected a threshold of 65 for the scale parameter. The resulting size of 60 cm × 60 cm for each grid cell corresponds to the minimum resolution of image data for a representative detection of bog microform suggested by Becker et al. [24].
For each microform, the classification was done by implementing simple class rules for each grid cell. We used the “relative area of sub-object” features to define the microforms. This algorithm determined for each cell the species composition in terms of the proportional area covered by the different species (see Table 1). This area was calculated from the sub-objects classified in the previous step on the species-level. The microform classification represented the present microforms Empetrum heath, Sphagnum lawn, Sphagnum hummock, pools and others. The class “others” included dead vegetation, Sphagnum cuspidatum, lichens and transitional microforms that could not be clearly assigned to the Sphagnum hummock class.
The accuracy of both classifications was evaluated by selecting random samples, with a minimum of 220 samples within each vegetation class. These randomly selected samples were then manually classified by an on-screen interpretation of the available image information together with additional field data. Based on the samples, a confusion matrix was produced to evaluate the accuracy of the final classifications including overall, user’s, and producer’s classification accuracies, and Kappa statistics [41]. The interpretation of the Kappa statistics was based on the categories proposed by Landis and Koch [42], with a classification accuracy of Kappa <0.20 considered poor, 0.21 < kappa < 0.40 fair, 0.41 < kappa < 0.60 moderate, 0.61 < kappa < 0.80 good, and 0.81 < kappa < 1 very good.

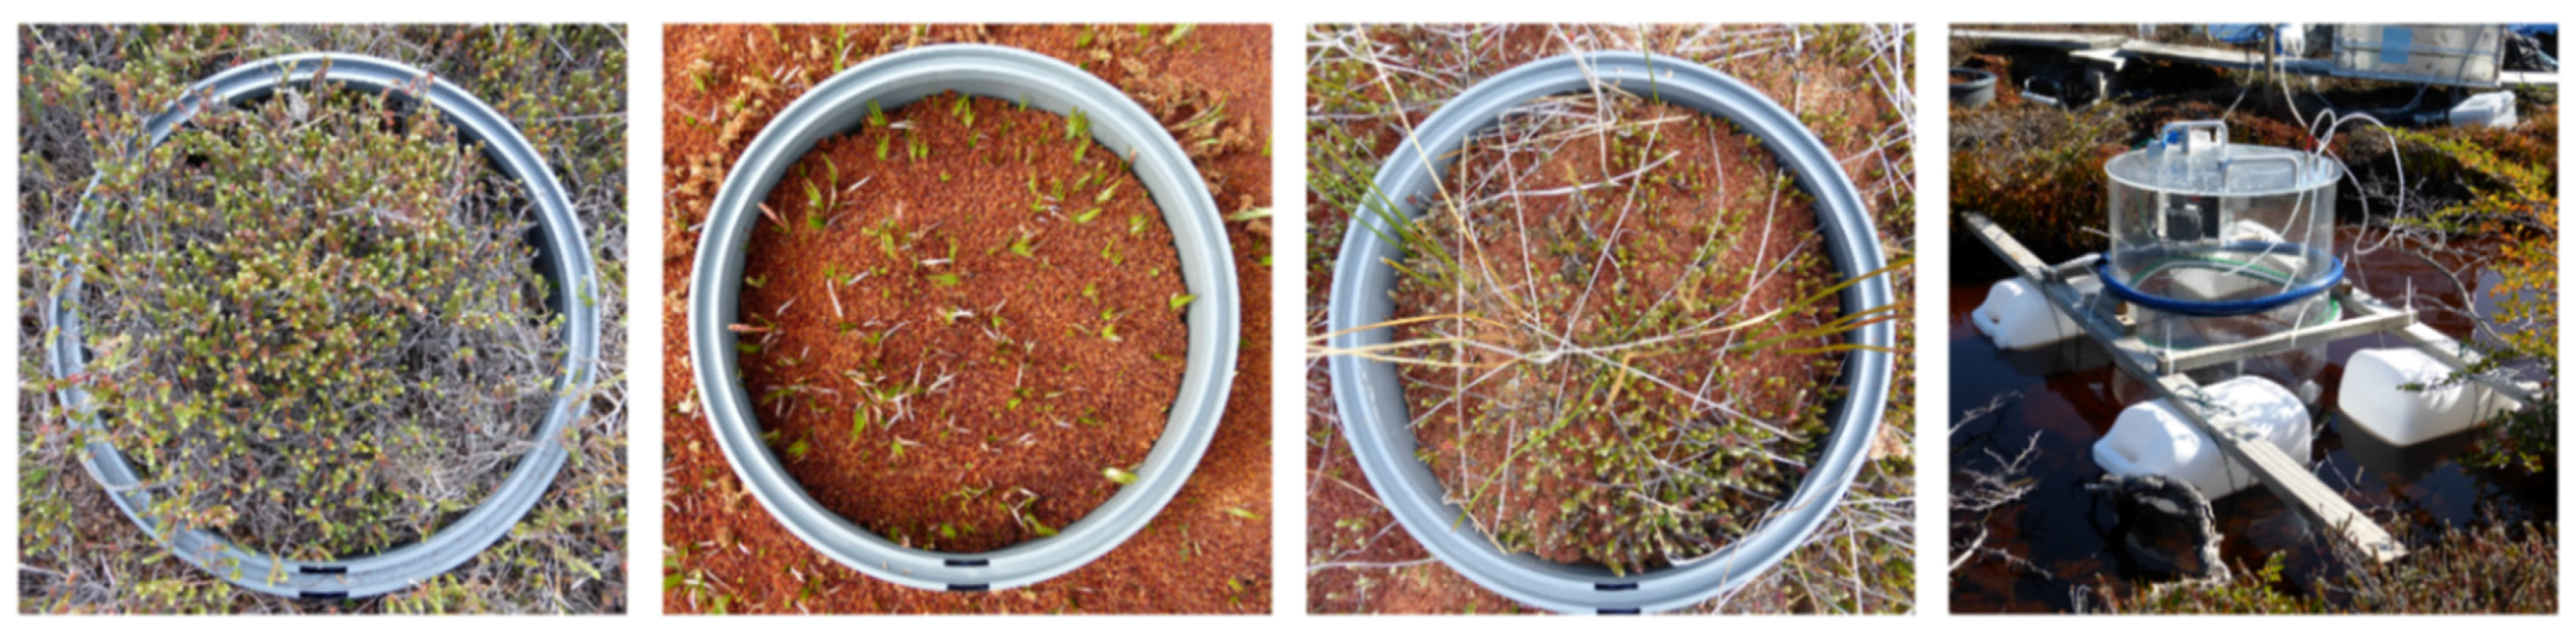
2.3. Methane (CH4) Flux Measurements

The closed chamber technique was used to measure microform-level CH4 fluxes during four days in the end of January 2015, in the austral summer. Measurements were performed on surface microforms representing the main vegetation units of the studied peat bog (Table 1, Figure 2). Selected microforms were Empetrum heaths, Sphagnum lawns and Sphagnum hummocks (Figure 5) with three replicates each representing the variation within microforms. Transitions between microforms were not considered. On each of the nine plots, collars were permanently installed in the beginning of January 2015. A transparent chamber with a diameter of 40 cm and a height of 40 cm was gently placed on each collar for at least 3 min to perform measurements. A fan ensured mixing of the air within the chamber during measurements. The chamber was equipped with a cooling system and a temperature sensor to avoid an increase of chamber temperature by more than 3 °C deviation of the ambient air temperature. Collars were equipped with a water-filled rim to ensure a gas-tight seal between chamber and collar during measurements. In addition, CH4 fluxes of two pools were determined with a floating chamber of identical dimension and design. The chamber wall extended approximately 4 cm into the water. The chamber was connected to a greenhouse gas analyzer (Los Gatos Ultraportable Greenhouse Gas Analyzer 915-001, Los Gatos Research) to measure the increase of CH4 concentrations over time. We equipped this instrument with an external pump providing a flow rate of 2 L·min−1 CH4 concentration was recorded at a rate of 1 Hz.
Microform-level CH4 fluxes were calculated from the CH4 concentration increase over time within the chamber using a modified version of the software package (MATLAB Release R2014a) routine described in [43]. CH4 concentration was modeled either as a linear (93% of cases, N = 65 flux measurements) or an exponential (7% of cases, N = 5) function of time. Models performance was compared using Akaike’s Information Criterion (AIC) as a measure of goodness-of-fit. Two measurements had to be excluded from further analyses because residuals were auto-correlated and four measurements were excluded from analysis because a strong temperature increase had been detected during chamber closure. None of the measurements showed a stepwise concentration increase indicative of ebullient events during our campaign. Of the 3 min measurement time, 60–140 s (mainly 90 s) were selected for the CH4 flux calculation. This excluded unstable conditions particularly at the beginning of the measurement. For up-scaling the microform-level CH4 fluxes to the ecosystem scale of the investigated area in the studied bog, fluxes measured on the nine plots were averaged for each microform over the four-day measurement period, multiplied with the fractional surface cover of each microform of the microform-level classification and summed to the area-weighted mean (hereafter referred to as total ecosystem CH4 flux). For the up-scaling based on the species-level classification, mean microform fluxes were multiplied with the fractional surface cover of the respective classes Empetrum rubrum (Empetrum heath fluxes), Sphagnum magellanicum (Sphagnum lawn fluxes), Marsippospermum grandiflorum (Sphagnum hummock fluxes) and pools (pool fluxes). Standard deviation of CH4 fluxes were linearly extrapolated to the classified bog area similar as the fluxes itself.

3. Results

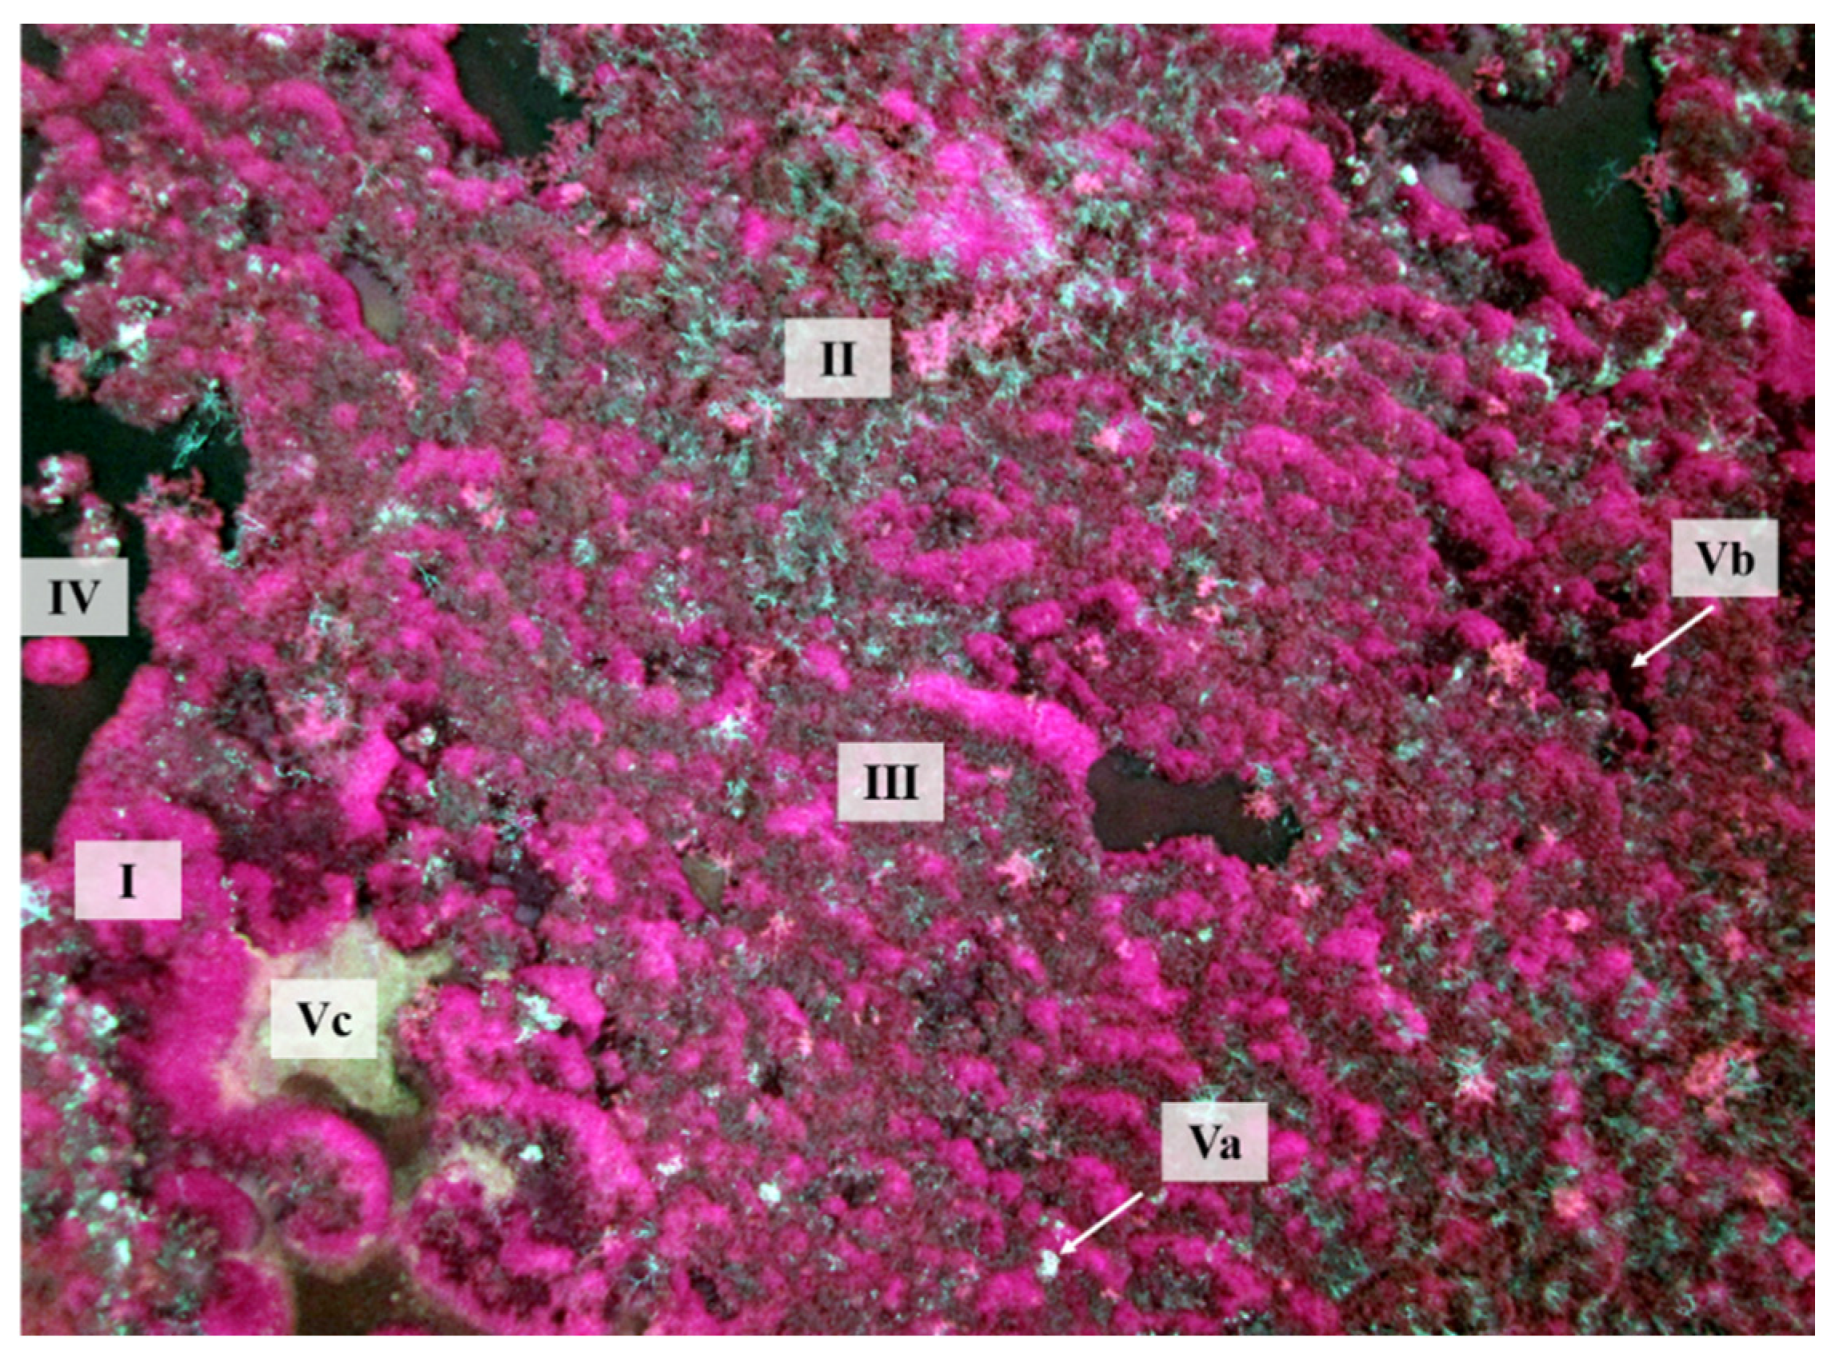
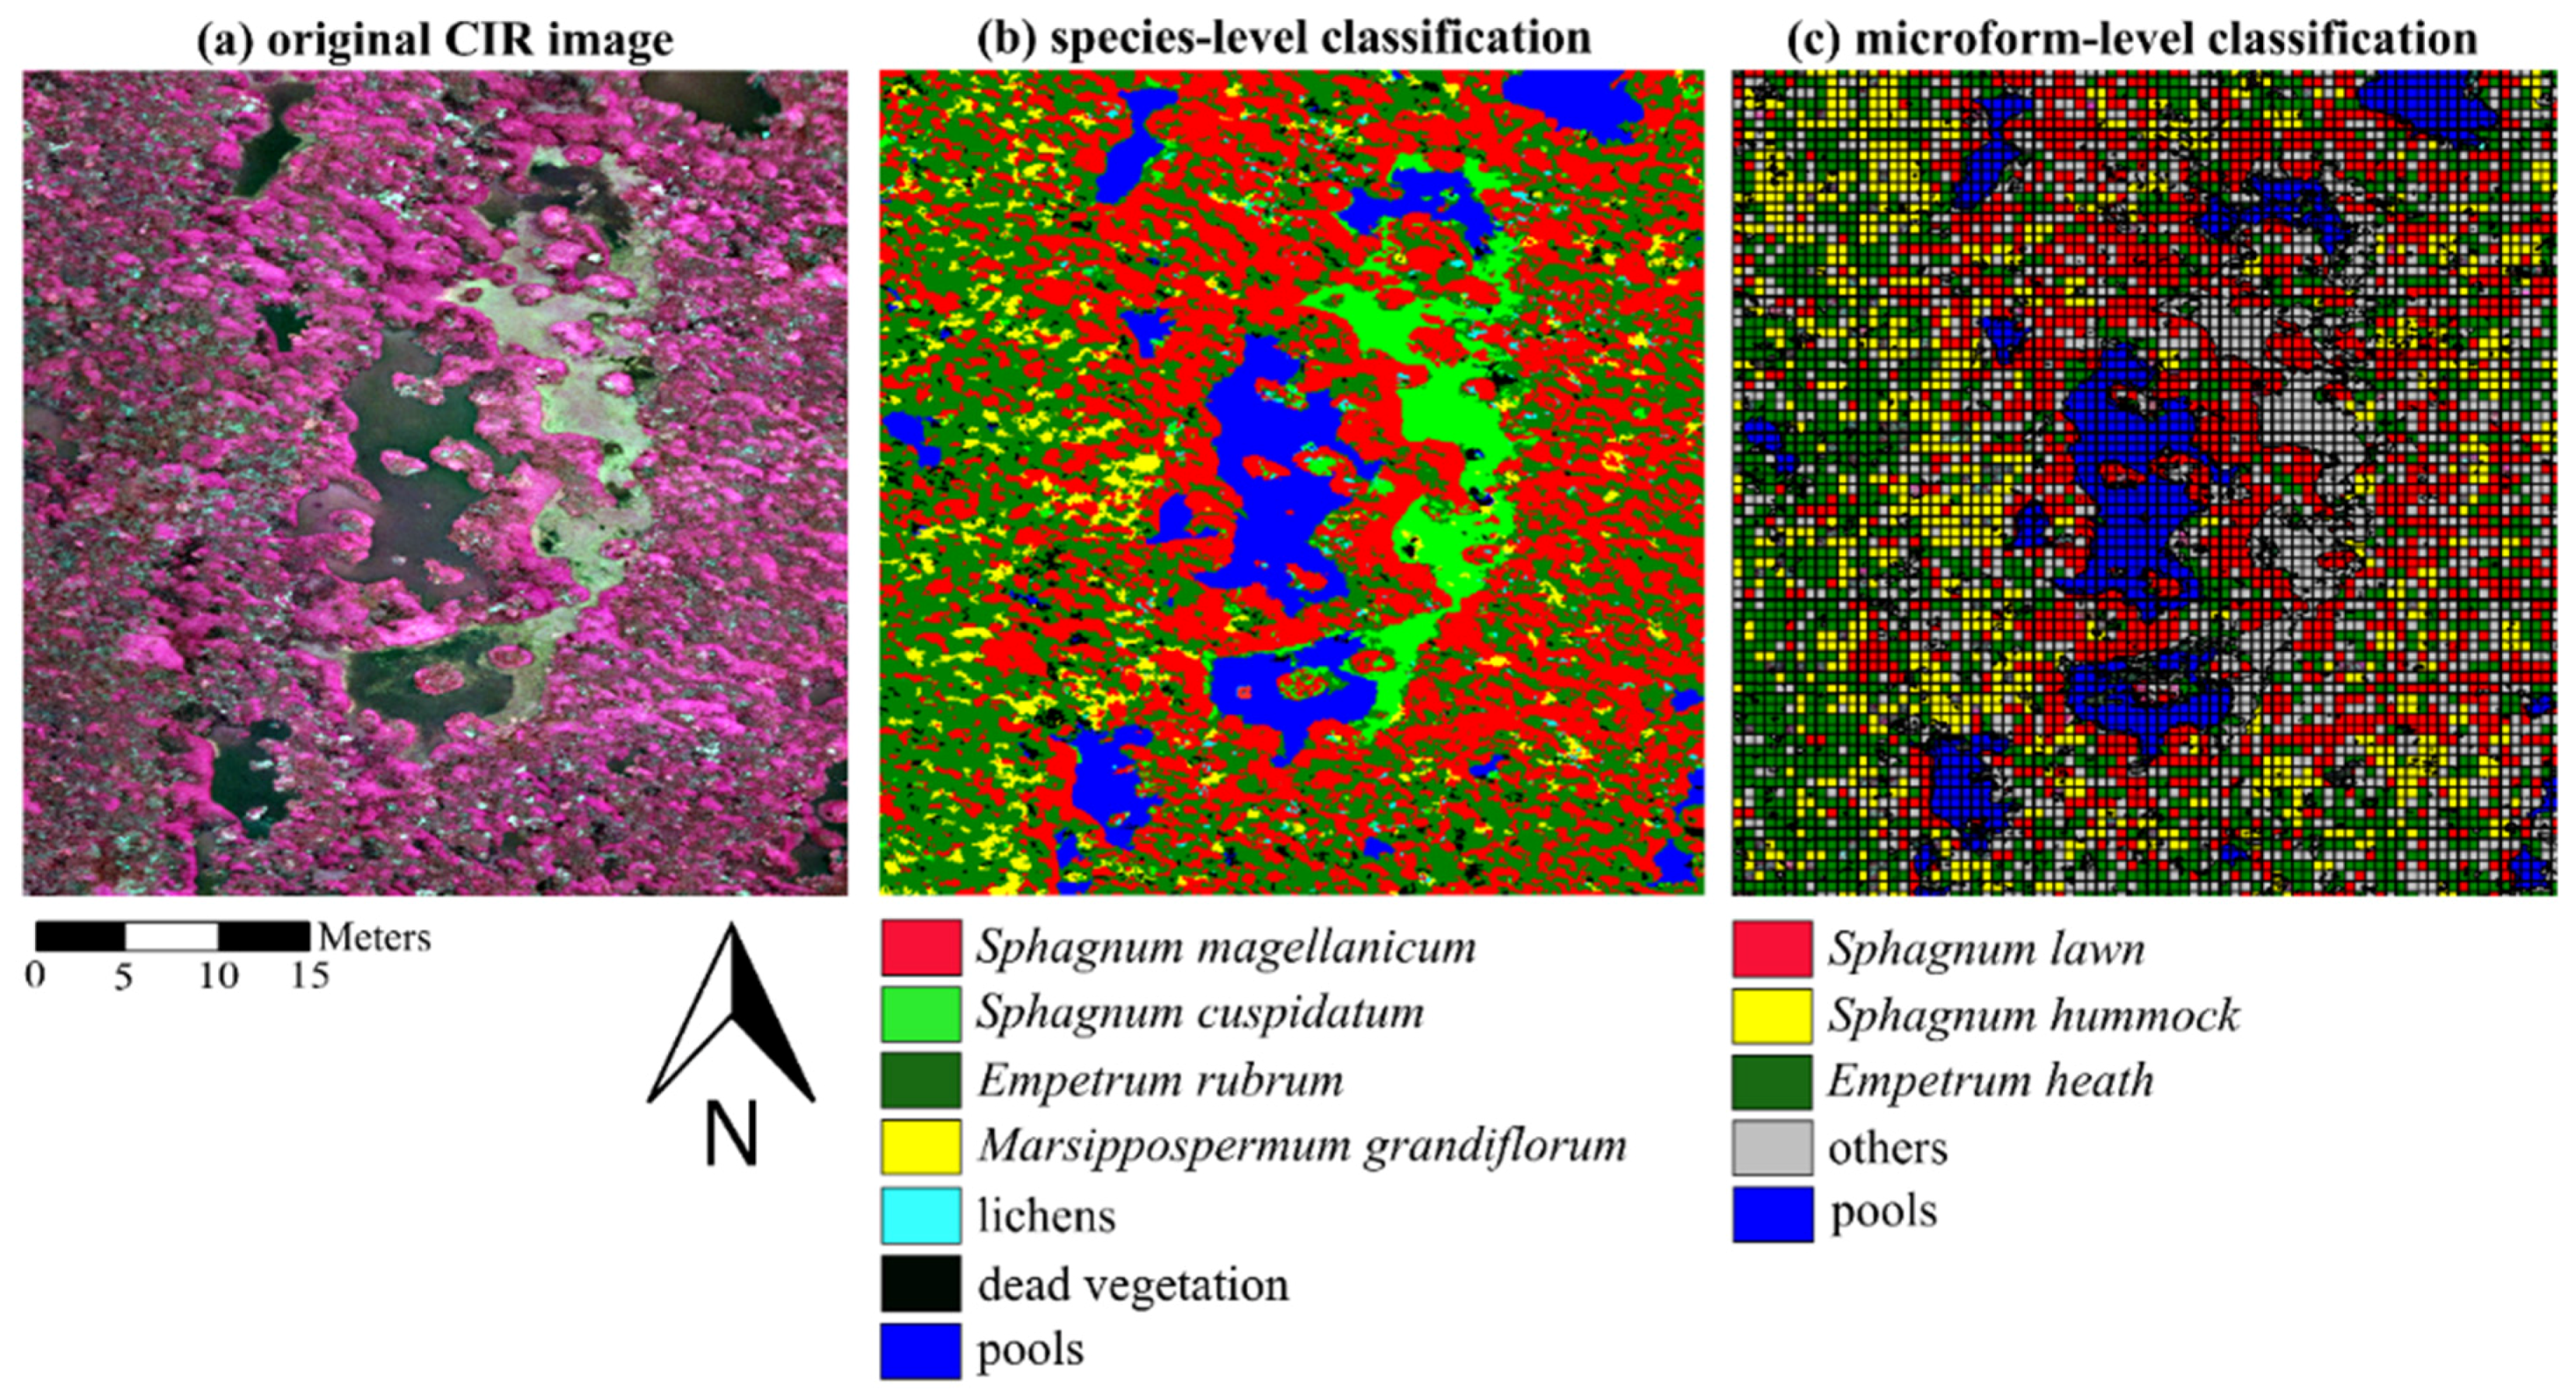
3.1. Object-Based Classification
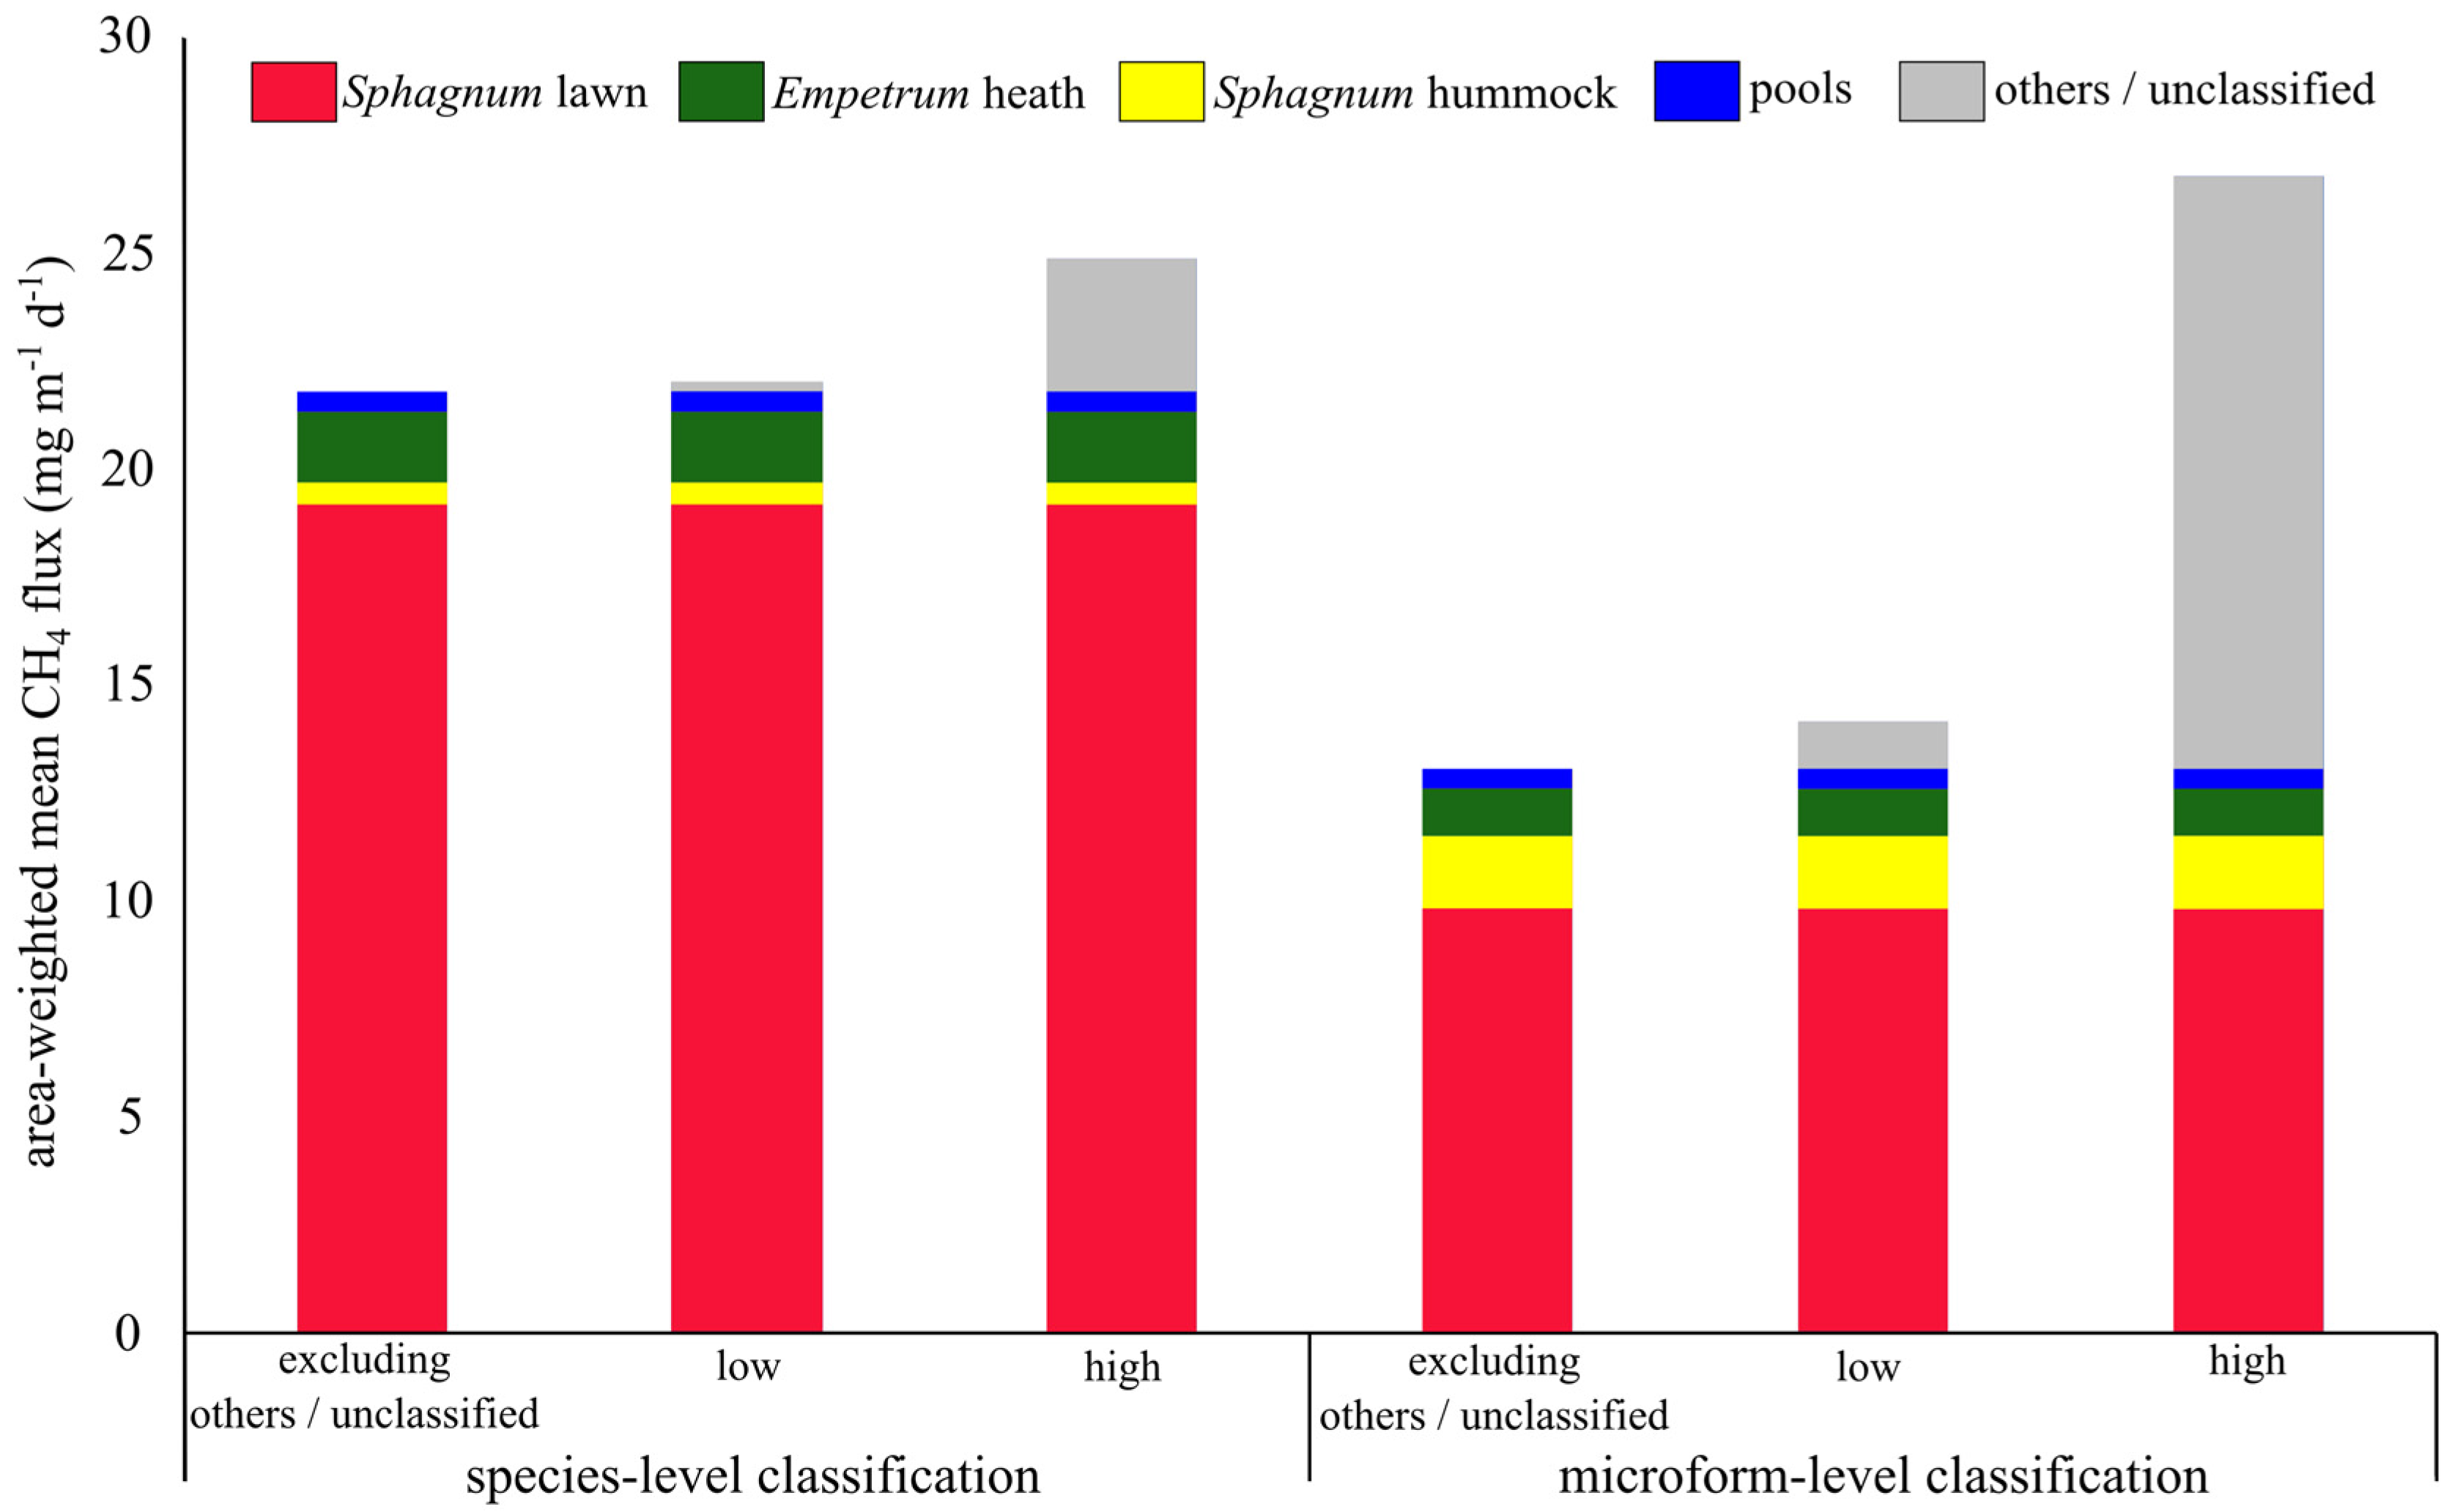
The resulting maps of the species- and microform-level classification are presented in Figure 6. The semi-automatic object-based classification revealed an overall accuracy level of 92% for the species-level classification (Table 5) and 86% for the microform-level classification (Table 6). The overall KIA statistic had a maximum of 0.90 and 0.83 at microform level and species level, respectively. The KIA per class statistics for the species-level classification suggested that Sphagnum magellanicum was the best distinguishable class with a coefficient of 0.99, followed by Empetrum rubrum (0.97), pool (0.96), dead vegetation (0.95), Sphagnum cuspidatum (0.92), lichens (0.80) and Marsippospermum grandiflorum (0.73). For the microform level classification the best class-specific KIA statistics were those for water (0.94), Sphagnum lawn (0.92), and “others” (0.87), followed by Empetrum lawn (0.76) and Sphagnum hummock (0.65). The class-specific producer’s accuracies for the species level classification ranged from 99% for Sphagnum magellanicum to 76% for Marsippospermum grandiflorum. For the microform level classification, the producer’s accuracy was highest for water (95%) and lowest for Sphagnum hummock (71%).

3.2. CH4 Fluxes

Summer CH4 fluxes in South Patagonia differed strongly across the four surface microforms Sphagnum lawn, Sphagnum hummock, Empetrum heath and pools and were highly variable within each microform (Table 7). Among the three (semi-)terrestrial microforms, the Empetrum heath emitted the least CH4 while emissions released from Sphagnum lawns were on average more than 10 times higher. Sphagnum lawns covered 20%–40% of the surface area of the bog (Table 8), depending on the classification approach, and contributed to 75% or almost 90% to the total ecosystem CH4 flux (Figure 7). Both classification approaches suggested that further microforms covered a substantial part of the surface area of the bog (Table 7). Nevertheless, their contribution to the total ecosystem CH4 flux was negligible for the species-level classification, while for the microform-level classification Sphagnum hummocks and Empetrum heath together accounted for more than 20% of the total ecosystem CH4 flux.
Excluding the area where no chamber measurements were conducted and therefore no CH4 fluxes were available, the sum of the area-weighted mean fluxes per microform yielded total ecosystem CH4 fluxes of 13.1 mg·m−2·day−1 and 21.8 mg·m−2·day−1 for the microform-level and species-level classification, respectively (Table 7, Figure 7). While the unclassified surface area amounted to almost 30% for the microform-level classification, it comprised only 6% for the species-level classification. To estimate the CH4 flux for the proportion of the surface area where no chamber measurements were conducted (e.g., lichen dominated patches), we assigned either a low CH4 flux of 3.97 mg·m−2·day−1 as determined for Empetrum heath or a high CH4 flux of 49.04 mg·m−2·day−1 as determined for Sphagnum lawn to this area. Based on this assumption, the sum of the area-weighted mean fluxes per microform increased to at least 14.2 mg·m−2·day−1 (low estimate microform-level classification) or to a maximum of 26.8 mg·m−2·day−1 (high estimate microform-level classification) for the classified area. Estimates based on the species-level classification ranged within the estimates based on the microform-level classification (Figure 7).

4. Discussion

Microform-level CH4 fluxes in the present study estimated from chamber measurements showed a pronounced spatial variability: Sphagnum lawns were local emission hotspots with comparatively high CH4 fluxes of 49.04 ± 25.7 mg·m−2·day−1. Methane flux data from South Patagonia are scarce, and, to our knowledge, we here present the first CH4 fluxes determined on several microforms in a pristine Sphagnum bog in Tierra del Fuego. CH4 fluxes from Sphagnum lawns in a bog ecosystem in Tierra del Fuego have been reported to range from 1 to 11 mg·m−2·day−1 [11] which are considerably lower rates compared to our findings. Broder et al. [44] presented CH4 fluxes from Patagonian bogs further north near Punta Arenas (Chile). Their surface fluxes (microform corresponds to our Sphagnum lawn microform) were less than 0.2 mmol·m−2·day−1 (3.21 mg·m−2·day−1 and in the range of our Empetrum heath fluxes, while their fluxes at the water table were 1–9 mmol·m−2·day−1 (16–144 mg·m−2·day−1 and up to 30 times higher compared to pool fluxes in the present study. The number of chamber measurements was restricted in the present and both of the studies cited. CH4 flux estimates from southern Patagonia are therefore still afflicted with a comparatively high uncertainty and need to be proven by further field measurements. As CH4 is produced under anaerobic conditions and water table depth is known as a major control of CH4 emissions [7], pools were suggested to be major CH4 sources in earlier studies. In contrast, CH4 fluxes from pools found in the present study were among the lowest of all investigated microforms. This might be due to an inhibition of microbial activity for example due to low supply of fresh organic substrate for methanogenesis [45]. The spatial heterogeneity of CH4 fluxes found in the present study is characteristic for bog ecosystems and has been reported previously for northern hemispheric peatlands that typically show a high spatial variability of CH4 fluxes owing to numerous factors controlling CH4 production, consumption and emission [7].
The high spatial variability of CH4 emissions requires accurate measurements not only of the fluxes themselves but also of the small-scale surface heterogeneity of bogs to understand the relative importance of single microforms for the total CH4 flux. The quality of any study comparing between scales, e.g., microform and ecosystem scale, thus depends on the quality of the underlying map. The OBIA classification processes of the high resolution CIR data collected by an UAS that we use here lead to overall very high accuracy on the species and the microform level. Especially the high accuracy observed for the Sphagnum lawn class, which was identified as the most relevant microform for ecosystem-scale CH4 fluxes, underlines the appropriateness of our CH4 flux extrapolation approach. The semi-automatic classification of microforms at our test site was only feasible using very high-resolution CIR UAS images. The use of conventional remote-sensing data such as satellite or aerial images would not have allowed acceptable classifications that meet the requirements to extrapolate spatially variable CH4 fluxes due to their low spectral and spatial resolution. The overall KIA statistic showed a maximum of 0.90 at species level and 0.83 at microform level, indicating high reliability of our multi-level upscaling classification process.
The classification procedure still left segments unclassified due to similar “mixed” spectral and textural features on the species level. In addition, on microform level several segments (grid cells) could not be assigned by the applied class rules. To further increase classification accuracy and to minimize unclassified segments, the integration of a high resolution digital surface model (DSM) in the classification process would be beneficial [46,47,48]. Since microforms in bog ecosystems are closely related to the water level and drier microforms such as hummocks occur only on elevated parts of the bog [36], height information could be used to improve the classification model.
One approach to generate such a surface model would be stereo photogrammetric analysis of the overlapping imagery (see for example [49] or the review article by Nex and Remondino [50]). However, such dense and accurate image based 3D surface models depend on a stable, accurate 3D flight pattern and sufficient image overlaps (minimum of 60% for side overlap and 80% for forward overlap) to allow accurate aerial triangulation and point cloud calculation [51]. In this study, such a large overlap was not available in most of the study area. In addition, the abovementioned height differences characterizing the different microforms are very small (e.g., variation at a centimeter scale matters; see Figure 2) and require an extremely accurate surface model for a successful integration into the classification process. There is an ongoing discussion in recent research articles about the achievable accuracy of surface models created by UAS based stereo photogrammetric analysis [52,53,54,55]. Thus, it is unclear if this achievable accuracy is sufficient for ecosystems, where the morphology is characterized by slight surface differences. Further research with a specific flight and sampling design (e.g., a high-resolution RGB camera; accurate ground truth point sampling with DGPS) is needed to investigate this approach in such ecosystems.
Another possible approach to improve the identification bog microforms and related microform-level CH4 fluxes by including additional height information, would be to use UAS-generated LIDAR data. Today’s ultra-light laser scanners are intended for UAS use [56] and can thus efficiently contribute to the classification of microforms by their microreliefs. Particularly for wetland areas, ecological monitoring of vegetation and relevant ecosystem processes using UAS-based remote sensing techniques may strongly benefit from a combination of LIDAR-generated 3D data and the spectral information provided by high-resolution CIR images. While LIDAR technology was not used in the presented study (payload restrictions), it is a promising option for future research since new generations of UAS are offering a continuously increasing flight duration and payload capacity (flight times >1 h and >1 kg payload are within reach; e.g., HiSystems 2015; Microdrones 2015). Nevertheless, our results already show that it is possible to extrapolate microform CH4 measurements to the ecosystem scale with sufficient reliability using multispectral image features without height information.
Another aspect is the identification of the interdependent classes Marsippospermum grandiflorum and Sphagnum hummock, which achieved comparably poor results (KIA per class 0.73 and 0.65). At species level, living individuals of Marsippospermum grandiflorum were difficult to identify because of the very small diameter and the upright growth of their shoots as well as similar spectral properties to the surrounding vegetation. On the other hand, dead shoots were sometimes misclassified when their texture properties did not clearly display in the imagery due to the limited quality of the used low cost sensor [34]. This resulted in misclassifications for individual plant species, especially with Sphagnum magellanicum and Empetrum rubrum. Besides the image quality (sharpness) additional restrictions related to the use of the low cost sensor should be considered. These mainly concern the separation of NIR radiation in one channel of the CIR imagery [26]. A better distinction of the NIR radiation in CIR images can be achieved using professional, purpose-built and commercially available multispectral sensors or a hyperspectral device [57]. However, such cameras cost at least several thousand Euros, whereas images recorded with a modified customer digital camera (less than 300 €) achieve a good cost–benefit ratio with the image characteristics being sufficient for a wide CIR image classification spectrum. Furthermore, it is important to take into account the effect of bidirectional reflectance in this context, especially during sunny weather. This effect can cause image hotspots in the resulting orthoimage mosaic. This may reduce the accuracy of the image classifiers. Using image ratios and indices like NDVImod (see Section 2.2.3) can mitigate these effects. However, bidirectional reflectance still was an issue that influenced the accuracy of the classification.
Although both classification approaches resulted in a very good overall accuracy particularly for the Sphagnum lawn microform emitting most CH4, our findings clearly show that the image classification is a critical issue potentially introducing a high proportion of additional uncertainty when up-scaling CH4 microform measurements to the ecosystem scale. The OBIA procedure including the segmentation process always generalizes the situation in the field and therefore is a potential source of error. The relation between image-objects and their radiometric characteristics can only partly be influenced during the segmentation process often resulting in over- or undersegmentation [58]. However, segmentation is a crucial step in analyzing complex vegetation pattern when solely spectral properties are insufficient to identify classes of interest. The presented image analysis method is a basic and straightforward OBIA approach which is not directly transferable to other use cases. However, it proved to be efficient and adequately accurate in terms of creating a detailed classification distribution of characteristic bog plant species and microforms that are relevant in terms of CH4-fluxes. It also demonstrates the high potential of object-based classification for studies of bog environments in general. This potential could be further leveraged and the transferability improved by applying more objective measures for the determination of segmentation parameters or classification features and thresholds. Several studies developed tools for automatically estimating and optimizing the scale parameter (e.g., [59,60,61]). There has also been work on the automatic definition of suitable object parameters and respective thresholds for the classification (e.g., [62]). The high potential of OBIA in this context has been demonstrated in many studies (see for example [63,64] or the review article by Blaschke [39]). In our approach, we combined parameters of the extended feature space in OBIA (e.g., texture, geometric dimensions and relative positions) using a hierarchical multi-level classification which increased accuracy and allowed for the analysis of composition of typical plant communities. The studied pools were readily identified from the high-resolution images, and their proportion of the area did not differ between both of our classification approaches, while the applied classification procedure yielded pronounced differences in the surface cover of poorly identifiable Sphagnum hummocks (KIA per class 0.65). Empetrum heaths were also difficult to identify (KIA per class 0.76) but in contrast to Sphagnum hummocks, differences in the spatial coverage due to the classification approach did not affect the contribution of this microform to the total CH4 flux.
Our results demonstrate that a simple microform-level classification can result in estimates of almost 70% lower total CH4 fluxes on the ecosystem scale compared to a more detailed species-level classification. This result is inconsistent with studies by Becker et al. [24] and Hartley et al. [65] who found that a coarse classification leads to higher total CH4 fluxes in comparison with a finer classification. The substantially lower total ecosystem CH4 fluxes obtained by the microform-level classification found in the present study might be explained by the fact that this classification resulted in a proportion of almost 30% of unclassified surface area, which could not be assigned to one of the four microforms were CH4 fluxes were determined (Table 7, microform “unclassified/others”). Furthermore, the microform-level classification led to a considerably lower area covered by Sphagnum lawns compared to the species-level classification. Accordingly, the contribution of this microform to the total ecosystem CH4 flux was underestimated compared to the species-level classification leading to this 70% lower estimate of total CH4 fluxes.
The species-level classification is assumed to yield a more realistic estimate of total ecosystem CH4 fluxes of 21.8 mg·m−2·day−1 of the classified area compared to the microform-level classification. This estimate is in the range of previously reported CH4 emissions from northern hemispheric peatlands that vary between 5 and 80 mg·m−2·day−1 [5]. Total ecosystem CH4 fluxes obtained by the species-level classification are suggested to better reflect the small-scale surface heterogeneity of the bog and, furthermore, this approach allowed assigning 94% of the surface area to one of the microforms were CH4 fluxes were determined by chamber measurements.
In previous studies, the total surface area of the ecosystem was assigned to specific classes [24,65] and, except for the study by Becker et al. 2008 [24], the classification itself as an error source was not further investigated. Hence, these approaches did not focus on the uncertainty in total ecosystem CH4 fluxes introduced by transitional microforms. We quantified this uncertainty by assigning either a high or low flux to the unclassified surface area. This potential uncertainty in up-scaled CH4 flux estimates introduced by the classification procedure ranged from 14.2 mg·m−2·day−1 (low estimate microform-level classification) to 26.8 mg·m−2·day−1 (high estimate microform-level classification) in the present study. To reduce this potential uncertainty, future studies should attempt to include transitional microforms when measuring CH4 fluxes with chambers.

5. Conclusions

Our results demonstrate pronounced differences between two object-based classification approaches regarding both, the unclassified surface cover of the bog and the surface cover where no fluxes were available. These differences strongly affected the total amount of emitted CH4. A classification with only a few classes potentially can lead to pronounced bias in total CH4 fluxes when plot-scale fluxes are up-scaled.
At our study site, one microform (Sphagnum lawn) contributed most to the total CH4 flux, whereas other microforms emitted much less CH4. Therefore, the proportional surface cover did not strongly affect the total ecosystem CH4 flux. Our results clearly demonstrate that the higher the emissions of a microform and the more difficult the identification of a microform from an image, the more important becomes the exact identification of which classes build that particular type of microform. The use of an UAS sensor platform with high resolution CIR imaging capabilities and a consequent OBIA data analysis seems to be an appropriate remote sensing strategy to tackle that challenge. A non-OBIA image classification of conventional aerial or satellite data (even on CIR composites) would certainly fail under the given requirements or simply be limited to bogs where only a single “dominant hotspot” microform that is easy to detect at an average spatial and spectral resolution contributes most to the total ecosystem CH4 flux.

Acknowledgments

We wish to acknowledge the support of the “Tierra del Fuego” Nationalpark, Ushuaia, and especially of Alejandro Valenzuela and the committed field assistance of Isabella Närdemann, Claudia Frank and Bettina Breuer. The Centro Austral de Investigaciones Científicas (CADIC-CONICET) provided facilities that enabled our fieldwork in Ushuaia. We thank Peter Sulmann for technical assistance in constructing the closed chambers. A special thanks to Keturah Smithson and Johannes Kamp for the final language check. We would also like to thank the ifgicopter group (Institute for Geoinformatics) for providing the UAS and technical support. This work was carried out within the research project CANDYbog, which was funded by the German Science Foundation (Grant No. KL2265/3-1 and BL 563/19-1). We acknowledge support by Open Access Publication Fund of University of Muenster.

Author Contributions

Wiebke Münchberger and Jan R. K. Lehmann conceived the study; Jan R. K. Lehmann and Felix Nieberding conducted the flights; Jan R. K. Lehmann processed the image data and conducted the image classification together with Christian Knoth. Wiebke Münchberger performed the chamber measurements and analyzed the flux data. Both first authors prepared the manuscript, and all authors discussed the results and commented on the manuscript.

Conflicts of Interest

The authors declare no conflict of interest.

References

  1. Gorham, E. Northern peatlands: Role in the carbon cycle and probable responses to climatic warming. Ecol. Appl. 1991, 1, 182–195. [Google Scholar] [CrossRef]
  2. Yu, Z.C. Northern peatland carbon stocks and dynamics: A review. Biogeosciences 2012, 9, 4071–4085. [Google Scholar] [CrossRef]
  3. Bridgham, S.D.; Cadillo-Quiroz, H.; Keller, J.K.; Zhuang, Q. Methane emissions from wetlands: Biogeochemical, microbial, and modeling perspectives from local to global scales. Glob. Chang. Biol. 2013, 19, 1325–1346. [Google Scholar] [CrossRef] [PubMed]
  4. Turetsky, M.R.; Kotowska, A.; Bubier, J.; Dise, N.B.; Crill, P.; Hornibrook, E.R.; Minkkinen, K.; Moore, T.R.; Myers-Smith, I.H.; Nykanen, H.; et al. A synthesis of methane emissions from 71 northern, temperate, and subtropical wetlands. Glob. Chang. Biol. 2014, 20, 2183–2197. [Google Scholar] [CrossRef] [PubMed]
  5. Blodau, C. Carbon cycling in peatlands—A review of processes and controls. Environ. Rev. 2002, 10, 111–134. [Google Scholar] [CrossRef]
  6. Limpens, J.; Berendse, F.; Blodau, C.; Canadell, J.G.; Freeman, C.; Holden, J.; Roulet, N.; Rydin, H.; Schaepman-Strub, G. Peatlands and the carbon cycle: From local processes to global implications—A synthesis. Biogeosciences 2008, 5, 1475–1491. [Google Scholar] [CrossRef]
  7. Lai, D.Y.F. Methane dynamics in Northern Peatlands: A Review. Pedosphere 2009, 19, 409–421. [Google Scholar] [CrossRef]
  8. Grootjans, J.; Iturraspe, R.; Fritz, C.; Moen, A.; Joosten, H. Mires and mire types of Peninsula Mitre, Tierra del Fuego, Argentina. Mires Peat 2014, 14, 1–20. [Google Scholar]
  9. Goodrich, J.P.; Campbell, D.I.; Roulet, N.T.; Clearwater, M.J.; Schipper, L.A. Overriding control of methane flux temporal variability by water table dynamics in a Southern Hemisphere, raised bog. J. Geophys. Res. Biogeosci. 2015, 120, 819–831. [Google Scholar] [CrossRef]
  10. Kleinebecker, T.; Hölzel, N.; Vogel, A. South Patagonian ombrotrophic bog vegetation reflects biogeochemical gradients at the landscape level. J. Veg. Sci. 2008, 19, 151–160. [Google Scholar] [CrossRef]
  11. Fritz, C.; Pancotto, V.A.; Elzenga, J.T.M.; Visser, E.J.W.; Grootjans, A.P.; Pol, A.; Iturraspe, R.; Roelofs, J.G.M.; Smolders, A.J.P. Zero methane emission bogs: Extreme rhizosphere oxygenation by cushion plants in Patagonia. New Phytol. 2011, 190, 398–408. [Google Scholar] [CrossRef] [PubMed] [Green Version]
  12. Kleinebecker, T.; HöLzel, N.; Vogel, A. Patterns and gradients of diversity in South Patagonian ombrotrophic peat bogs. Austral. Ecol. 2010, 35, 1–12. [Google Scholar] [CrossRef]
  13. Couwenberg, J.; Joosten, H. Self-organization in raised bog patterning: The origin of microtope zonation and mesotope diversity. J. Ecol. 2005, 93, 1238–1248. [Google Scholar] [CrossRef]
  14. Pihlatie, M.K.; Christiansen, J.R.; Aaltonen, H.; Korhonen, J.F.J.; Nordbo, A.; Rasilo, T.; Benanti, G.; Giebels, M.; Helmy, M.; Sheehy, J.; et al. Comparison of static chambers to measure CH4 emissions from soils. Agric. For. Meteorol. 2013, 171–172, 124–136. [Google Scholar] [CrossRef]
  15. Adam, E.; Mutanga, O.; Rugege, D. Multispectral and hyperspectral remote sensing for identification and mapping of wetland vegetation: A Review. Wetl. Ecol. Manag. 2010, 18, 281–296. [Google Scholar] [CrossRef]
  16. Thomas, V.; Treitz, P.; Jelinski, D.; Miller, J.; Lafleur, P.; McCaughey, J.H. Image classification of a northern peatland complex using spectral and plant community data. Remote Sens. Environ. 2003, 84, 83–99. [Google Scholar] [CrossRef]
  17. Mcmorrow, J.M.; Cutler, M.E.J.; Evans, M.G.; Al-Roichdi, A. Hyperspectral indices for characterizing upland peat composition. Int. J. Remote Sens. 2004, 25, 313–325. [Google Scholar] [CrossRef]
  18. Anderson, K.; Bennie, J.J.; Milton, E.J.; Hughes, P.D.M.; Lindsay, R.; Meade, R. Combining LiDAR and IKONOS data for eco-hydrological classification of an ombrotrophic peatland. J. Environ. Qual. 2010, 39, 260–273. [Google Scholar] [CrossRef] [PubMed]
  19. Bartsch, A.; Trofaier, A.M.; Hayman, G.; Sabel, D.; Schlaffer, S.; Clark, D.B.; Blyth, E. Detection of open water dynamics with ENVISAT ASAR in support of land surface modelling at high latitudes. Biogeosciences 2012, 9, 703–714. [Google Scholar] [CrossRef] [Green Version]
  20. Middleton, M.; Närhi, P.; Arkimaa, H.; Hyvönen, E.; Kuosmanen, V.; Treitz, P.; Sutinen, R. Ordination and hyperspectral remote sensing approach to classify peatland biotopes along soil moisture and fertility gradients. Remote Sens. Environ. 2012, 124, 596–609. [Google Scholar] [CrossRef]
  21. Gallant, A.L. The challenges of remote monitoring of wetlands. Remote Sens. 2015, 7, 10938–10950. [Google Scholar] [CrossRef]
  22. Crichton, K.A.; Anderson, K.; Bennie, J.J.; Milton, E.J. Characterizing peatland carbon balance estimates using freely available Landsat ETM+ data. Ecohydrology 2015, 8, 493–503. [Google Scholar] [CrossRef]
  23. Sirin, A.A.; Maslov, A.A.; Valyaeva, N.A.; Tsyganova, O.P.; Glukhova, T.V. Mapping of peatlands in the Moscow oblast based on high-resolution remote sensing data. Contemp. Probl. Ecol. 2015, 7, 808–814. [Google Scholar] [CrossRef]
  24. Becker, T.; Kutzbach, L.; Forbrich, I.; Schneider, J.; Jager, D.; Thees, B.; Wilmking, M. Do we miss the hot spots?—The use of very high resolution aerial photographs to quantify carbon fluxes in peatlands. Biogeosciences 2008, 5, 1387–1393. [Google Scholar] [CrossRef]
  25. Cole, B.; McMorrow, J.; Evans, M. Empirical modelling of vegetation abundance from airborne hyperspectral data for upland peatland restoration monitoring. Remote Sens. 2014, 6, 716–739. [Google Scholar] [CrossRef]
  26. Knoth, C.; Klein, B.; Prinz, T.; Kleinebecker, T. Unmanned aerial vehicles as innovative remote sensing platforms for high-resolution infrared imagery to support restoration monitoring in cut-over bogs. Appl. Veg. Sci. 2013, 16, 509–517. [Google Scholar] [CrossRef]
  27. Lucieer, A.; Turner, D.; King, D.H.; Robinson, S.A. Using an Unmanned Aerial Vehicle (UAV) to capture micro-topography of Antarctic moss beds. Int. J. Appl. Earth Obs. Geoinf. 2014, 27, 53–62. [Google Scholar] [CrossRef]
  28. Kalacska, M.; Arroyo-Mora, J.P.; de Gea, J.; Snirer, E.; Herzog, C.; Moore, T.R. Videographic analysis of eriophorum vaginatum spatial coverage in an ombotrophic bog. Remote Sens. 2013, 5, 6501–6512. [Google Scholar] [CrossRef]
  29. Getzin, S.; Nuske, R.S.; Wiegand, K. Using Unmanned Aerial Vehicles (UAV) to quantify spatial gap patterns in forests. Remote Sens. 2014, 6, 6988–7004. [Google Scholar] [CrossRef]
  30. Turner, D.; Lucieer, A.; Watson, C. Development of an Unmanned Aerial Vehicle (UAV) for hyper resolution vineyard mapping based on visible, multispectral, and thermal imagery. In Proceedings of the 34th International Symposium on Remote Sensing of Environment, Sydney, Australia, 10–15 April 2011.
  31. Turner, D.; Lucieer, A.; de Jong, S.M. Time series analysis of landslide dynamics using an Unmanned Aerial Vehicle (UAV). Remote Sens. 2015, 7, 1736–1757. [Google Scholar] [CrossRef]
  32. Von Bueren, S.K.; Burkart, A.; Hueni, A.; Rascher, U.; Tuohy, M.P.; Yule, I.J. Deploying four optical UAV-based sensors over grassland: Challenges and Limitations. Biogeosciences 2015, 12, 163–175. [Google Scholar] [CrossRef]
  33. Rango, A.; Laliberte, A.; Havstad, K.; Winters, C.; Steele, C.; Browning, D. Rangeland Resource Assessment, Monitoring, and Management Using Unmanned Aerial Vehicle-Based Remote Sensing. In Proceedings of the 2010 IEEE International, Geoscience and Remote Sensing Symposium (IGARSS), Honolulu, HI, USA, 25–30 July 2010; pp. 608–611.
  34. Lehmann, J.R.K.; Nieberding, F.; Prinz, T.; Knoth, C. Analysis of unmanned aerial system-based CIR images in forestry—A new perspective to monitor pest infestation levels. Forests 2015, 6, 594–612. [Google Scholar] [CrossRef] [Green Version]
  35. Ihse, M. Colour infrared aerial photography as a tool for vegetation mapping and change detection in environmental studies of Nordic ecosystems: A Review. Nor. Geogr. Tidsskr. 2007, 61, 170–191. [Google Scholar] [CrossRef]
  36. Kleinebecker, T.; Holzel, N.; Vogel, A. Gradients of continentality and moisture in South Patagonian ombrotrophic peatland vegetation. Folia Geobot. 2007, 42, 363–382. [Google Scholar] [CrossRef]
  37. Aber, J.S.; Marzolff, I.; Ries, J.B. Small-Format Aerial Photography: Principles, Techniques and Geoscience Applications; Elsevier Science: Amsterdam, The Netherlands, 2010. [Google Scholar]
  38. Laliberte, A.; Rango, A. Image processing and classification procedures for analysis of sub-decimeter imagery acquired with an unmanned aircraft over arid rangelands. GISci. Remote Sens. 2011, 48, 4–23. [Google Scholar] [CrossRef]
  39. Blaschke, T. Object based image analysis for remote sensing. ISPRS J. Photogramm. Remote Sens. 2010, 65, 2–16. [Google Scholar] [CrossRef]
  40. Ozdemir Ibrahim, D.A.N. Estimation of tree size diversity using object oriented texture analysis and aster imagery. Sensors 2008, 8, 4709–4724. [Google Scholar] [CrossRef]
  41. Congalton, R.G.; Green, K. Assessing the Accuracy of Remotely Sensed Data—Principles and Practices, 2nd ed.; CRC Press, Taylor & Francis Group: Boca Raton, FL, USA, 2009. [Google Scholar]
  42. Landis, J.R.; Koch, G.G. The measurement of observer agreement for categorical data. Biometrics 1977, 33, 159–174. [Google Scholar] [CrossRef] [PubMed]
  43. Kutzbach, L.; Schneider, J.; Sachs, T.; Giebels, M.; Nykanen, H.; Shurpali, N.J.; Martikainen, P.J.; Alm, J.; Wilmking, M. CO2 flux determination by closed-chamber methods can be seriously biased by inappropriate application of linear regression. Biogeosciences 2007, 4, 1005–1025. [Google Scholar] [CrossRef]
  44. Broder, T.; Blodau, C.; Biester, H.; Knorr, K.H. Sea spray, trace elements, and decomposition patterns as possible constraints on the evolution of CH4 and CO2 concentrations and isotopic signatures in oceanic ombrotrophic bogs. Biogeochemistry 2014, 122, 327–342. [Google Scholar] [CrossRef]
  45. Segers, R. Methane production and methane consumption: A review of processes underlying wetland methane fluxes. Biogeochemistry 1998, 41, 23–51. [Google Scholar] [CrossRef]
  46. Korpela, I.; Koskinen, M.; Vasander, H.; Holopainen, M.; Minkkinen, K. Airborne small-footprint discrete-return LiDAR data in the assessment of boreal mire surface patterns, vegetation, and habitats. For. Ecol. Manag. 2009, 258, 1549–1566. [Google Scholar] [CrossRef]
  47. Grayson, R.; Holden, J.; Jones, R.R.; Carle, J.A.; Lloyd, A.R. Improving particulate carbon loss estimates in eroding peatlands through the use of terrestrial laser scanning. Geomorphology 2012, 179, 240–248. [Google Scholar] [CrossRef]
  48. Millard, K.; Richardson, M. Wetland mapping with LiDAR derivatives, SAR polarimetric decompositions, and LiDAR-SAR fusion using a random forest classifier. Can. J. Remote Sens. 2013, 39, 290–307. [Google Scholar] [CrossRef]
  49. Al-Rawabdeh, A.; He, F.; Mousaa, A.; El-Sheimy, N.; Habib, A. Using an unmanned aerial vehicle-based digital imaging system to derive a 3D point cloud for landslide scarp recognition. Remote Sens. 2016, 8, 95. [Google Scholar] [CrossRef]
  50. Nex, F.; Remondino, F. UAV for 3D mapping applications: A Review. Appl. Geomat. 2014, 6, 1–15. [Google Scholar] [CrossRef]
  51. Dandois, J.P.; Olano, M.; Ellis, E.C. Optimal altitude, overlap, and weather conditions for computer vision UAV estimates of forest structure. Remote Sens. 2015, 7, 13895–13920. [Google Scholar] [CrossRef]
  52. Skarlatos, D.P.; Vlachos, M.; Vamvakousis, V. Investigating influence of UAV flight patterns in multi-stereo view DSM accuracy. Proc. SPIE 2015, 9528. [Google Scholar] [CrossRef]
  53. Ruzgiene, B.; Berteška, T.; Gečyte, S.; Jakubauskiene, E.; Aksamitauskas, V.Č. The surface modelling based on UAV Photogrammetry and qualitative estimation. Meas. J. Int. Meas. Confed. 2015, 73, 619–627. [Google Scholar] [CrossRef]
  54. Pavelka, K.; Šedina, J. Creating of DSM based on RPAS measurement and accuracy testing. In Surface Models for Geoscience, 1st ed.; Růžičková, K., Inspektor, T., Eds.; Springer International Publishing: New York, NY, USA, 2015; Volume 211, pp. 173–188. [Google Scholar]
  55. Ai, M.; Hu, Q.; Li, J.; Wang, M.; Yuan, H.; Wang, S. A robust photogrammetric processing method of low-altitude UAV images. Remote Sens. 2015, 7, 2302–2333. [Google Scholar] [CrossRef]
  56. Lin, Y.; Hyyppa, J.; Jaakkola, A. Mini-UAV-borne LIDAR for fine-scale mapping. IEEE Geosci. Remote Sens. Lett. 2011, 8, 426–430. [Google Scholar] [CrossRef]
  57. Chang, C.-I. Hyperspectral Data Exploitation: Theory and Applications; John Wiley & Sons: New York, NY, USA, 2007. [Google Scholar]
  58. Trias-Sanz, R.; Stamon, G.; Louchet, J. Using colour, texture, and hierarchial segmentation for high-resolution remote sensing. ISPRS J. Photogramm. Remote Sens. 2008, 63, 156–168. [Google Scholar]
  59. Drăguţ, L.; Tiede, D.; Levick, S.R. ESP: A tool to estimate scale parameter for multiresolution image segmentation of remotely sensed data. Int. J. Geogr. Inf. Sci. 2010, 24, 859–871. [Google Scholar] [CrossRef]
  60. Drăguţ, L.; Csillik, O.; Eisank, C.; Tiede, D. Automated parameterisation for multi-scale image segmentation on multiple layers. ISPRS J. Photogramm. Remote Sens. 2014, 88, 119–127. [Google Scholar] [CrossRef] [PubMed]
  61. Martha, T.R.; Kerle, N.; van Westen, C.J.; Jetten, V.; Kumar, K.V. Segment optimization and data-driven thresholding for knowledge-based landslide detection by object-based image analysis. IEEE Trans. Geosci. Remote Sens. 2011, 49, 4928–4943. [Google Scholar] [CrossRef]
  62. Stumpf, A.; Kerle, N. Object-oriented mapping of landslides using random forests. Remote Sens. Environ. 2011, 115, 2564–2577. [Google Scholar] [CrossRef]
  63. Peña, J.M.; Torres-Sánchez, J.; de Castro, A.I.; Kelly, M.; López-Granados, F. Weed mapping in early-season maize fields using object-based analysis of Unmanned Aerial Vehicle (UAV) images. PLoS ONE 2013, 8, e77151. [Google Scholar]
  64. Laliberte, A.S.; Browning, D.M.; Herrick, J.E.; Gronemeyer, P. Hierarchical object-based classification of ultra-high-resolution Digital Mapping Camera (DMC) imagery for rangeland mapping and assessment. J. Spat. Sci. 2010, 55, 101–115. [Google Scholar] [CrossRef]
  65. Hartley, I.P.; Hill, T.C.; Wade, T.J.; Clement, R.J.; Moncrieff, J.B.; Prieto-Blanco, A.; Disney, M.I.; Huntley, B.; Williams, M.; Howden, N.J.K.; et al. Quantifying landscape-level methane fluxes in subarctic Finland using a multiscale approach. Glob. Chang. Biol. 2015, 21, 3712–3725. [Google Scholar] [CrossRef] [PubMed] [Green Version]
Figure 1. (a) Location of the study area in southern South America; (b) The investigated peat bog is located 8 km western of Ushuaia (Argentina); (c) Aerial image of the peat bog (brown color) in the National Park “Tierra del Fuego” (54°49′S, 68°27′W). The photographed area is marked with a red square.
Remotesensing 08 00173 g001
Figure 2. Examples of dominant bog microforms identified by the different characteristic composition of the objects classified on species level. I. Sphagnum lawn dominated by Sphagnum magellanicum; II. Sphagnum hummock dominated by Sphagnum magellanicum and Empetrum rubrum and characterized by shoots of Marsippospermum grandiflorum; III. Empetrum heath dominated by Empetrum rubrum; IV. pools; and V. others, such as a. lichens; b. dead vegetation; and c. Sphagnum cuspidatum.
Remotesensing 08 00173 g002
Figure 3. The used Unmanned Aerial System (UAS), a commercially available Microdrones MD 4–200. The camera system, a color-infrared (CIR) modified digital Canon Power Shot SD780 IS camera is pointing downward.
Remotesensing 08 00173 g003
Figure 4. Original color infrared image with linear band equalization applied. Dominant bog microforms identified by the different characteristic composition of the objects classified on species level are indicated by Roman numerals (see also Figure 2): I. Sphagnum lawn dominated by Sphagnum magellanicum; II. Sphagnum hummock dominated by Sphagnum magellanicum and Empetrum rubrum and characterized by shoots of Marsippospermum grandiflorum; III. Empetrum heath dominated by Empetrum rubrum; IV. pools; and V. others, such as a. lichens; b. dead vegetation; and c. Sphagnum cuspidatum.
Remotesensing 08 00173 g004
Figure 5. Selected microforms for closed chamber CH4 flux measurements: Empetrum heath, Sphagnum lawn, Sphagnum hummock and pools (from left to right).
Remotesensing 08 00173 g005
Figure 6. (a) A part of the original CIR orthoimage mosaic (with linear band equalization applied). The area shown covers ca. 0.2 ha; (b) classification maps of species; and (c) microforms obtained by segmentation and subsequent object-based classification. The class “others” included dead vegetation, Sphagnum cuspidatum, lichens and drier Sphagnum-dominated vegetation (transitional microforms) that could not be clearly assigned to the Sphagnum hummock class.
Remotesensing 08 00173 g006
Figure 7. Contribution of surface microforms to the total ecosystem CH4 flux of the classified area. Two classification approaches are compared and CH4 fluxes were calculated as area-weighted means. Proportions of the surface area where no chamber measurements were conducted were excluded, or assigned to a high or low flux to give a range for the total ecosystem CH4 flux including the unclassified surface area.
Remotesensing 08 00173 g007
Table 1. Description of the dominant microforms by mean cover (%) of characteristic plant species. Other frequently occurring vascular plants were present with low cover. These plant species were not relevant for the classification procedure and thus not listed in the table.
SpeciesMicroform
Sphagnum LawnSphagnum HummockEmpetrum HeathIntermediate HummockPools
Sphagnum magellanicum9540<5800
Sphagnum cuspidatum0000(80)
Empetrum rubrum<54590200
Marsippospermum grandiflorum050<50
litter Marsippospermum grandiflorum0100<50
lichens0<55<50
Table 2. Key specifications of the used Unmanned Aerial System (UAS).
Microdrone MD 4–200Manufacturer: Microdrones GmbH, Siegen, Germany
TypeFour-propeller powered multicopter
Dimension540 mm from rotor-hub to rotor-hub
Weight800 g (depending on configuration)
Engine power4× flat core motors
Payloadmax. 250 g
Flight modeAutomatic with waypoint navigation or radio control
Enduranceup to 30 min (depending on load/wind/battery)
Table 3. Object features used during object-based image classification with eCognition.
Customized
NDVImod: ( [ Mean nir ] - [ Mean blue ] )/( [ Mean nir ] + [ Mean blue ] )
TVI: 0.5   ×   ( 120   ×   ( [ Mean nir ]   -   [ Mean green ] ) )     120   ×   ( [ Mean blue ]   -   [ Mean green ] )
Layer Values
HSI Transformation Intensity (R = nir, G = green, B = blue)
HSI Transformation Hue (R = nir, G = green, B = blue)
HSI Transformation Saturation (R = nir, G = green, B = blue)
Mean NIR
Mean Green
Mean Blue
Mean Brightness
Standard Deviation NIR
Standard Deviation Green
Standard Deviation Blue
Texture
GLCM Homogeneity
GLCM Entropy
GLCM Mean
GLDV Entropy
Class Related Features
Relative border to neighbor objects
Relative area of sub-objects
Table 4. Image examples of the classes in CIR composite (with linear band equalization applied) and key features with thresholds for the classification on the species-level.
ClassImage ExampleKey Features and Thresholds
Pools Remotesensing 08 00173 i001HSI Transformation Intensity (R = nir, G = green, B = blue) ≤ 0.57
GLCM Homogeneity (quick 8\11) (all dir.) ≥ 0.37
GLCM Entropy (quick 8\11) (all dir.) ≥ 4.3
Sphagnum magellanicum Remotesensing 08 00173 i002HSI Transformation Intensity (R = nir, G = green, B = blue) > 0.5
Sphagnum cuspidatum Remotesensing 08 00173 i003TVI > 5000
Lichens (white) Remotesensing 08 00173 i004GLDV Entropy (quick 8\11) (all dir.) ≥ 2.3
Dead vegetation Remotesensing 08 00173 i005GLCM Mean (quick8\11) (all dir.) ≤ 50
Marsippospermum grandiflorum (shoots) Remotesensing 08 00173 i006NDVImod ≤ 0.46
Mean green < 36
Empetrum rubrum Remotesensing 08 00173 i007Mean nir ≥ 85
Table 5. Confusion matrix and accuracy results of the object-based image analysis (OBIA) on species level. Producer’s accuracy (%): ratio between correctly classified objects and reference samples within a class. User’s accuracy (%): ratio between correctly classified objects and the total number of samples assigned to a class. Overall accuracy (%): ratio between the number of all correctly classified objects and the total number of samples. Kappa Index of Agreement (KIA): measure of the proportion of agreement after removing random effects.
Species-LevelPoolsSphagnum magellanicumSphagnum cuspidatumLichensDead VegetationEmpetrum rubrumMarsippospermum grandiflorum
pools217070200
Sphagnum magellanicum1304060243
Sphagnum cuspidatum0022532000
lichens000188003
dead vegetation400021100
Empetrum rubrum2270424018
Marsippospermum grandiflorum000304206
unclassified1020400
Sum225306241229221246270
Producer’s accuracy96.499.393.382.195.497.576.3
User’s accuracy96.085.487.598.498.187.996.7
Overall accuracy91.5
KIA Per Class0.960.990.920.800.950.970.73
KIA0.90
Table 6. Confusion matrix and accuracy results of the object-based image analysis (OBIA) on microform level.
Microform-LevelPoolsSphagnum HummockEmpetrum HeathSphagnum LawnOthers
pools2250002
Sphagnum hummock01752662
Empetrum heath123205511
Sphagnum lawn4502721
others61217254
unclassified13224012
Sum237247256290282
Producer’s accuracy94.970.880.093.890.0
User’s accuracy99.183.783.696.490.7
Overall accuracy86.2
KIA per Class0.940.650.760.920.87
KIA0.83
Table 7. Mean surface microform CH4 fluxes (± SD) of a Patagonian peat bog during four days in the austral summer estimated from closed chamber measurements.
Surface MicroformNMean CH4 Flux (mg·m−2·d−1)
Sphagnum lawn2149.04 ± 25.67
Sphagnum hummock2110.49 ± 6.02
Empetrum heath213.97 ± 2.99
pools75.41 ± 5.98
Table 8. Fraction of surface microform coverage and area-weighted mean CH4 fluxes (±area-weighted SD) of a Patagonian peat bog during austral summer as determined by closed chamber measurements.
Surface MicroformSpecies-Level ClassificationMicroform-Level Classification
Area (%)Area-Weighted Mean CH4 Flux (mg·m−2·day−1)Area (%)Area-Weighted Mean CH4 Flux (mg·m−2·day−1)
Sphagnum lawn3919.2 ± 10.0209.8 ± 5.1
Sphagnum hummock50.5 ± 0.3161.7 ± 1.0
Empetrum heath411.6 ± 1.2271.1 ± 0.8
pools90.5 ± 0.590.5 ± 0.5
unclassified/others6x28x
Sum10021.8 ± 12.110013.1 ± 7.4

