
Interpolation of GPS and Geological Data Using InSAR Deformation Maps: Method and Application to Land Subsidence in the Alto Guadalentín Aquifer (SE Spain)

 , , , , , , and
Abstract
:
1. Introduction
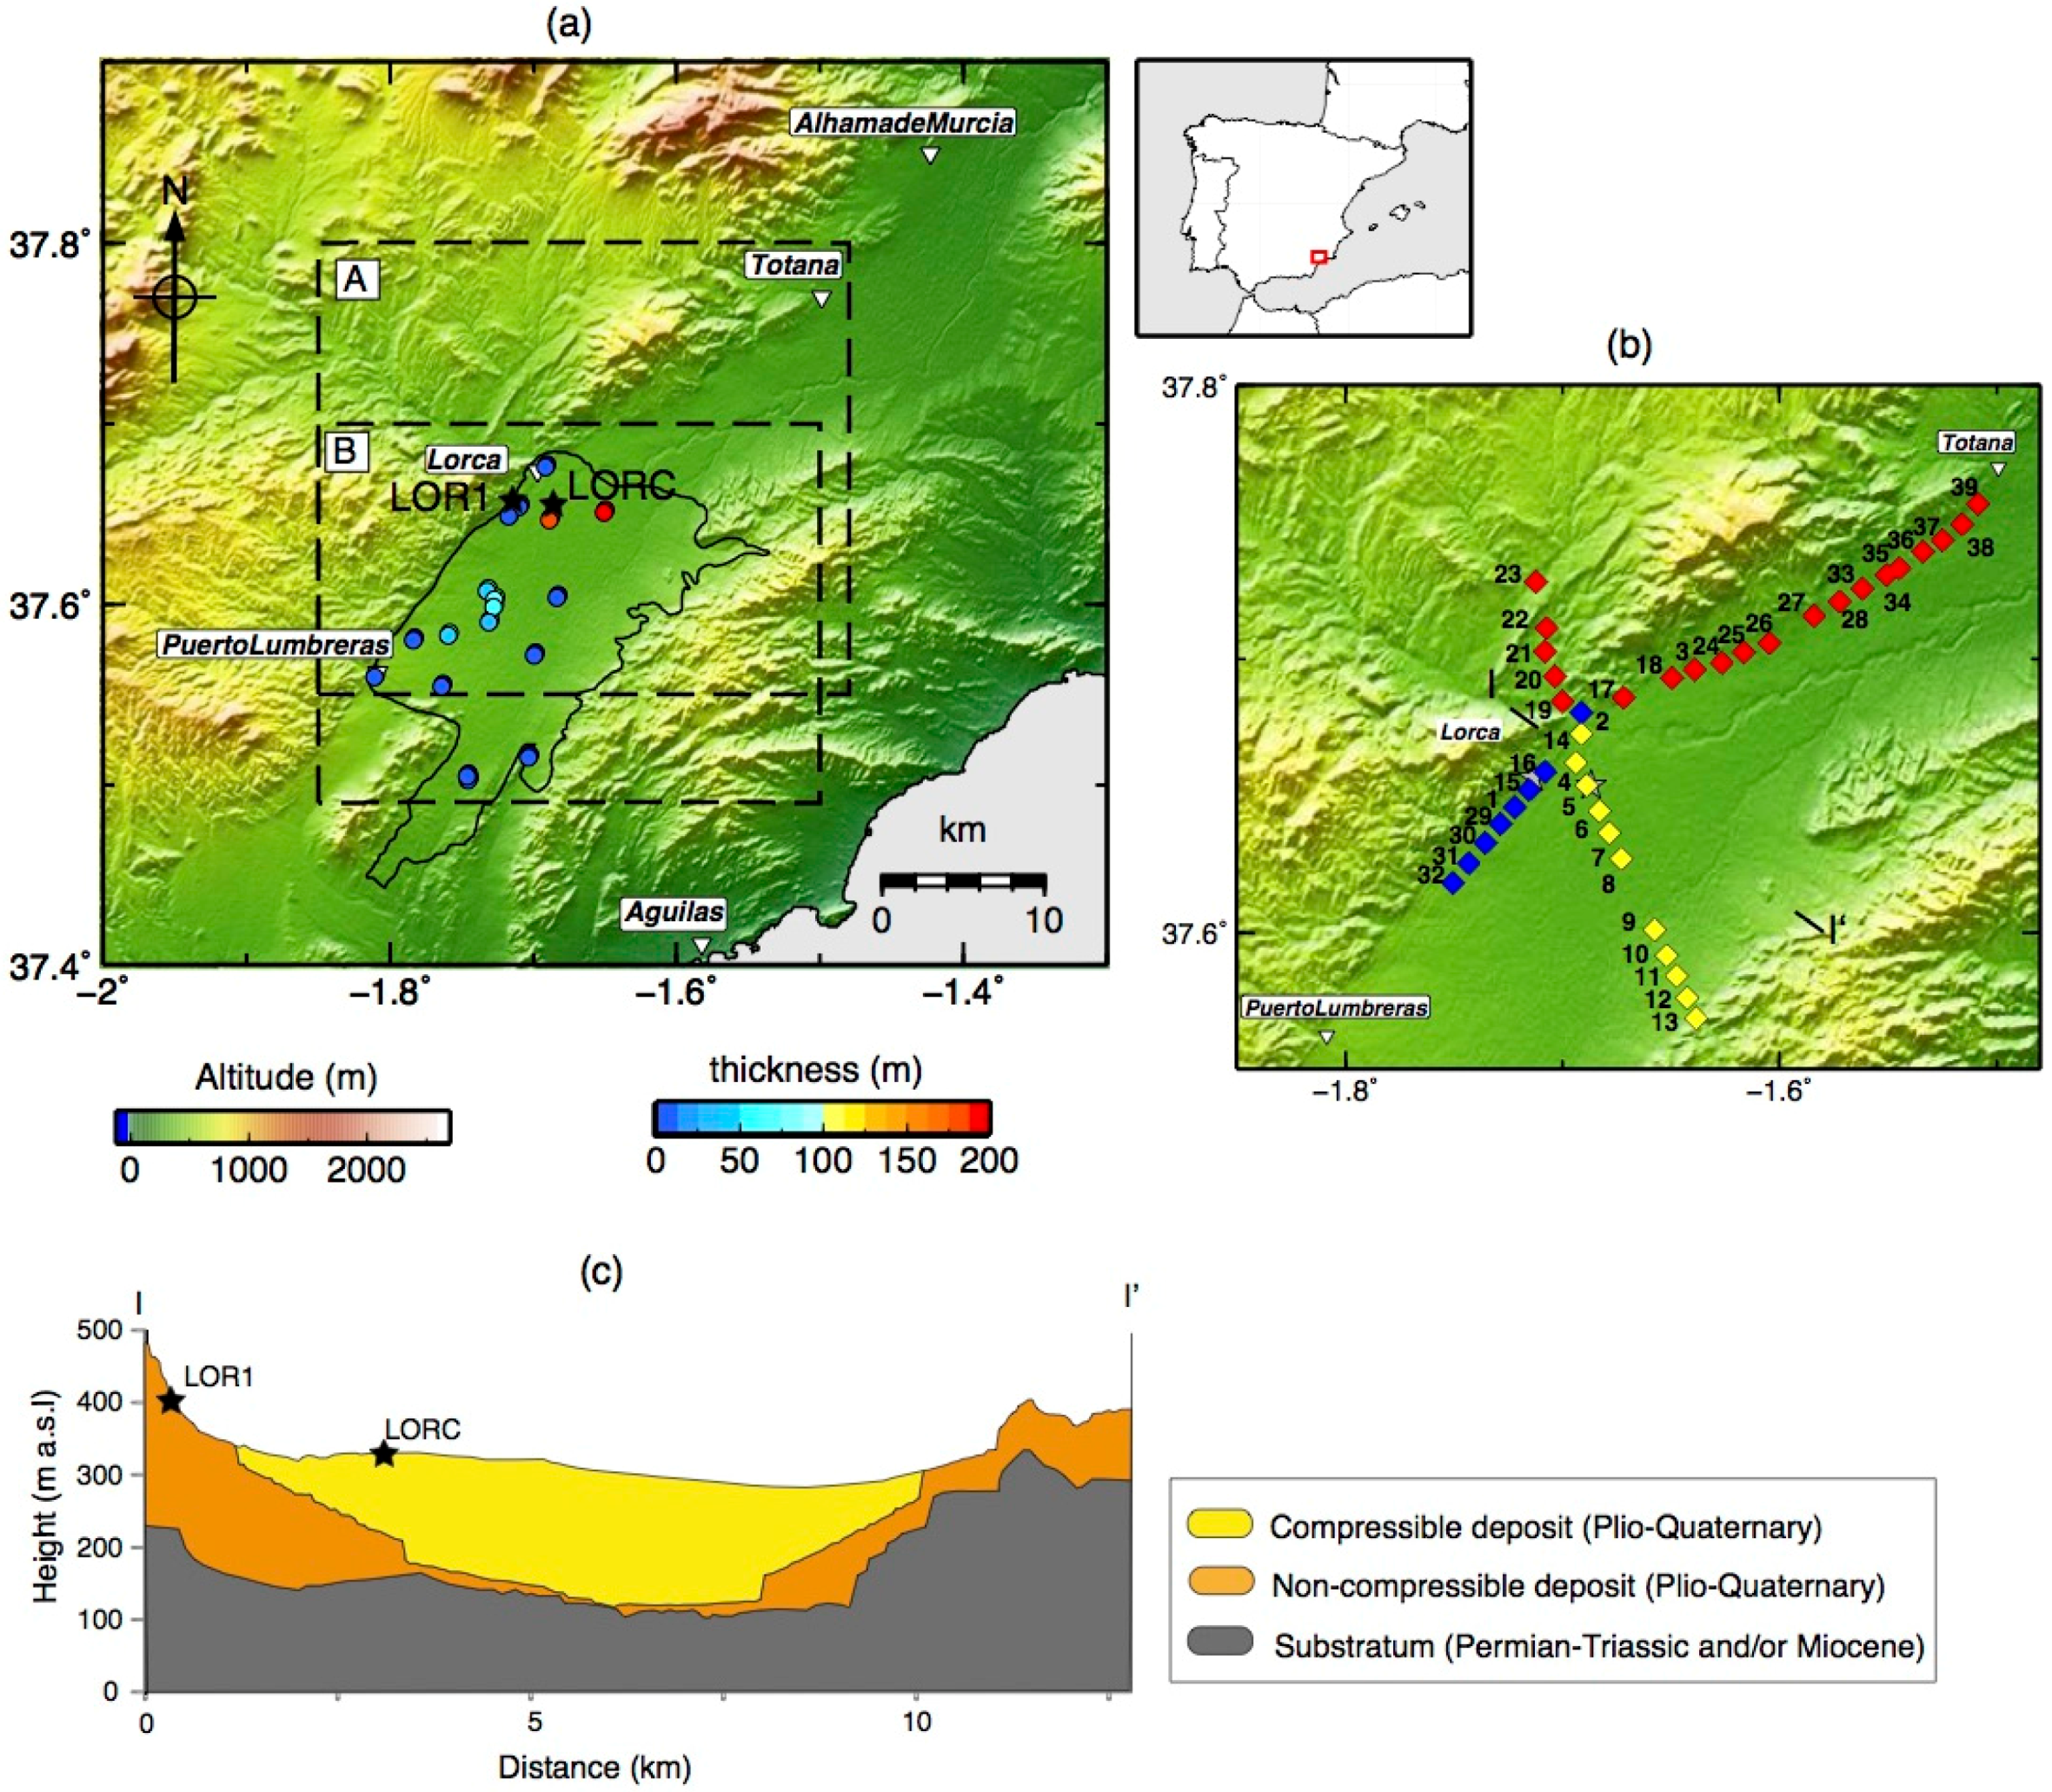
2. Study Area
3. Data and Methods
3.1. Estimation of InSAR Deformation Rates
3.2. Estimation of GPS Deformation Rates
3.3. Compressible Deposit Thickness
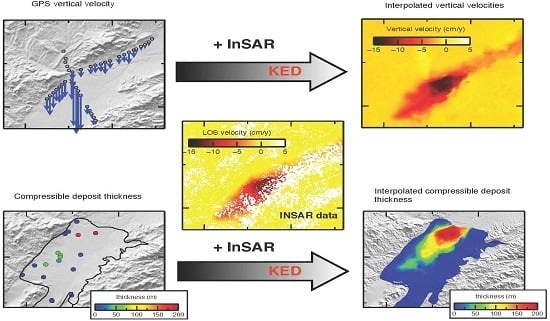
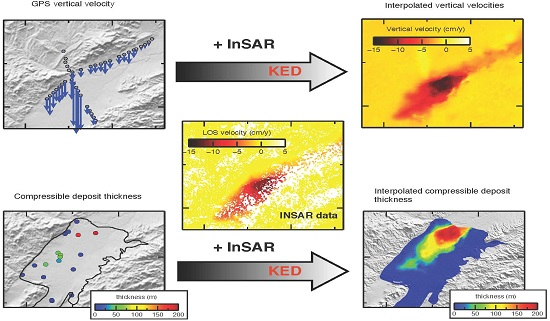
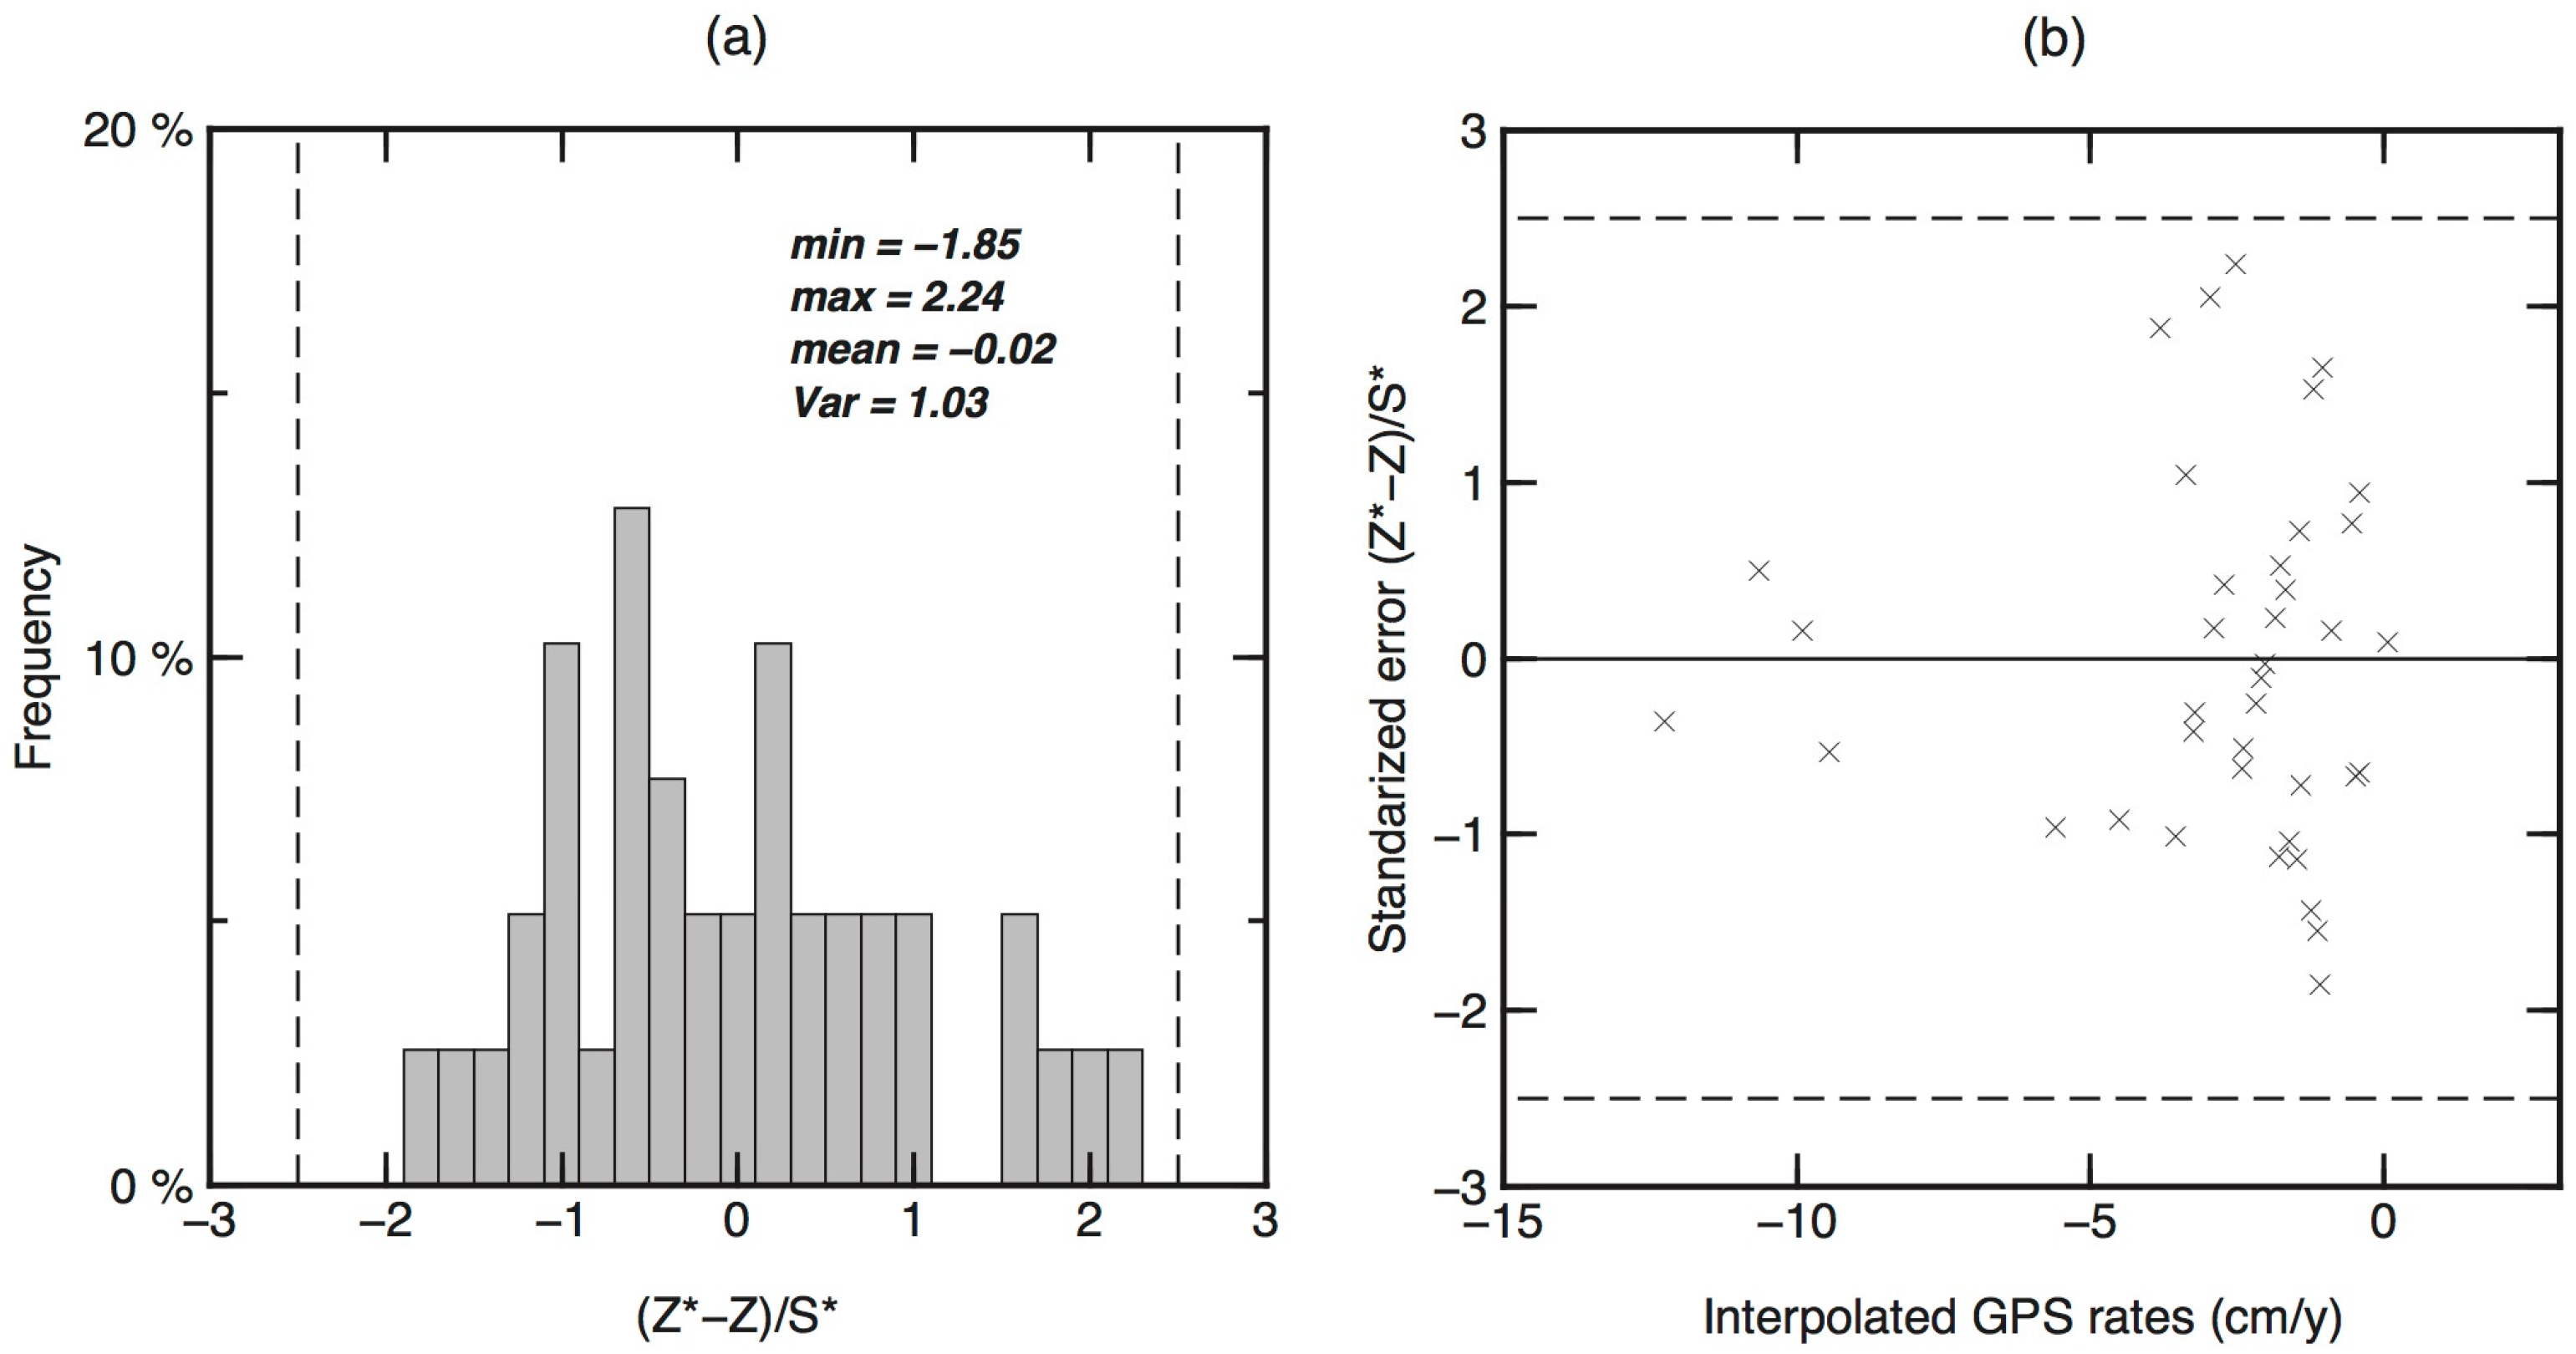
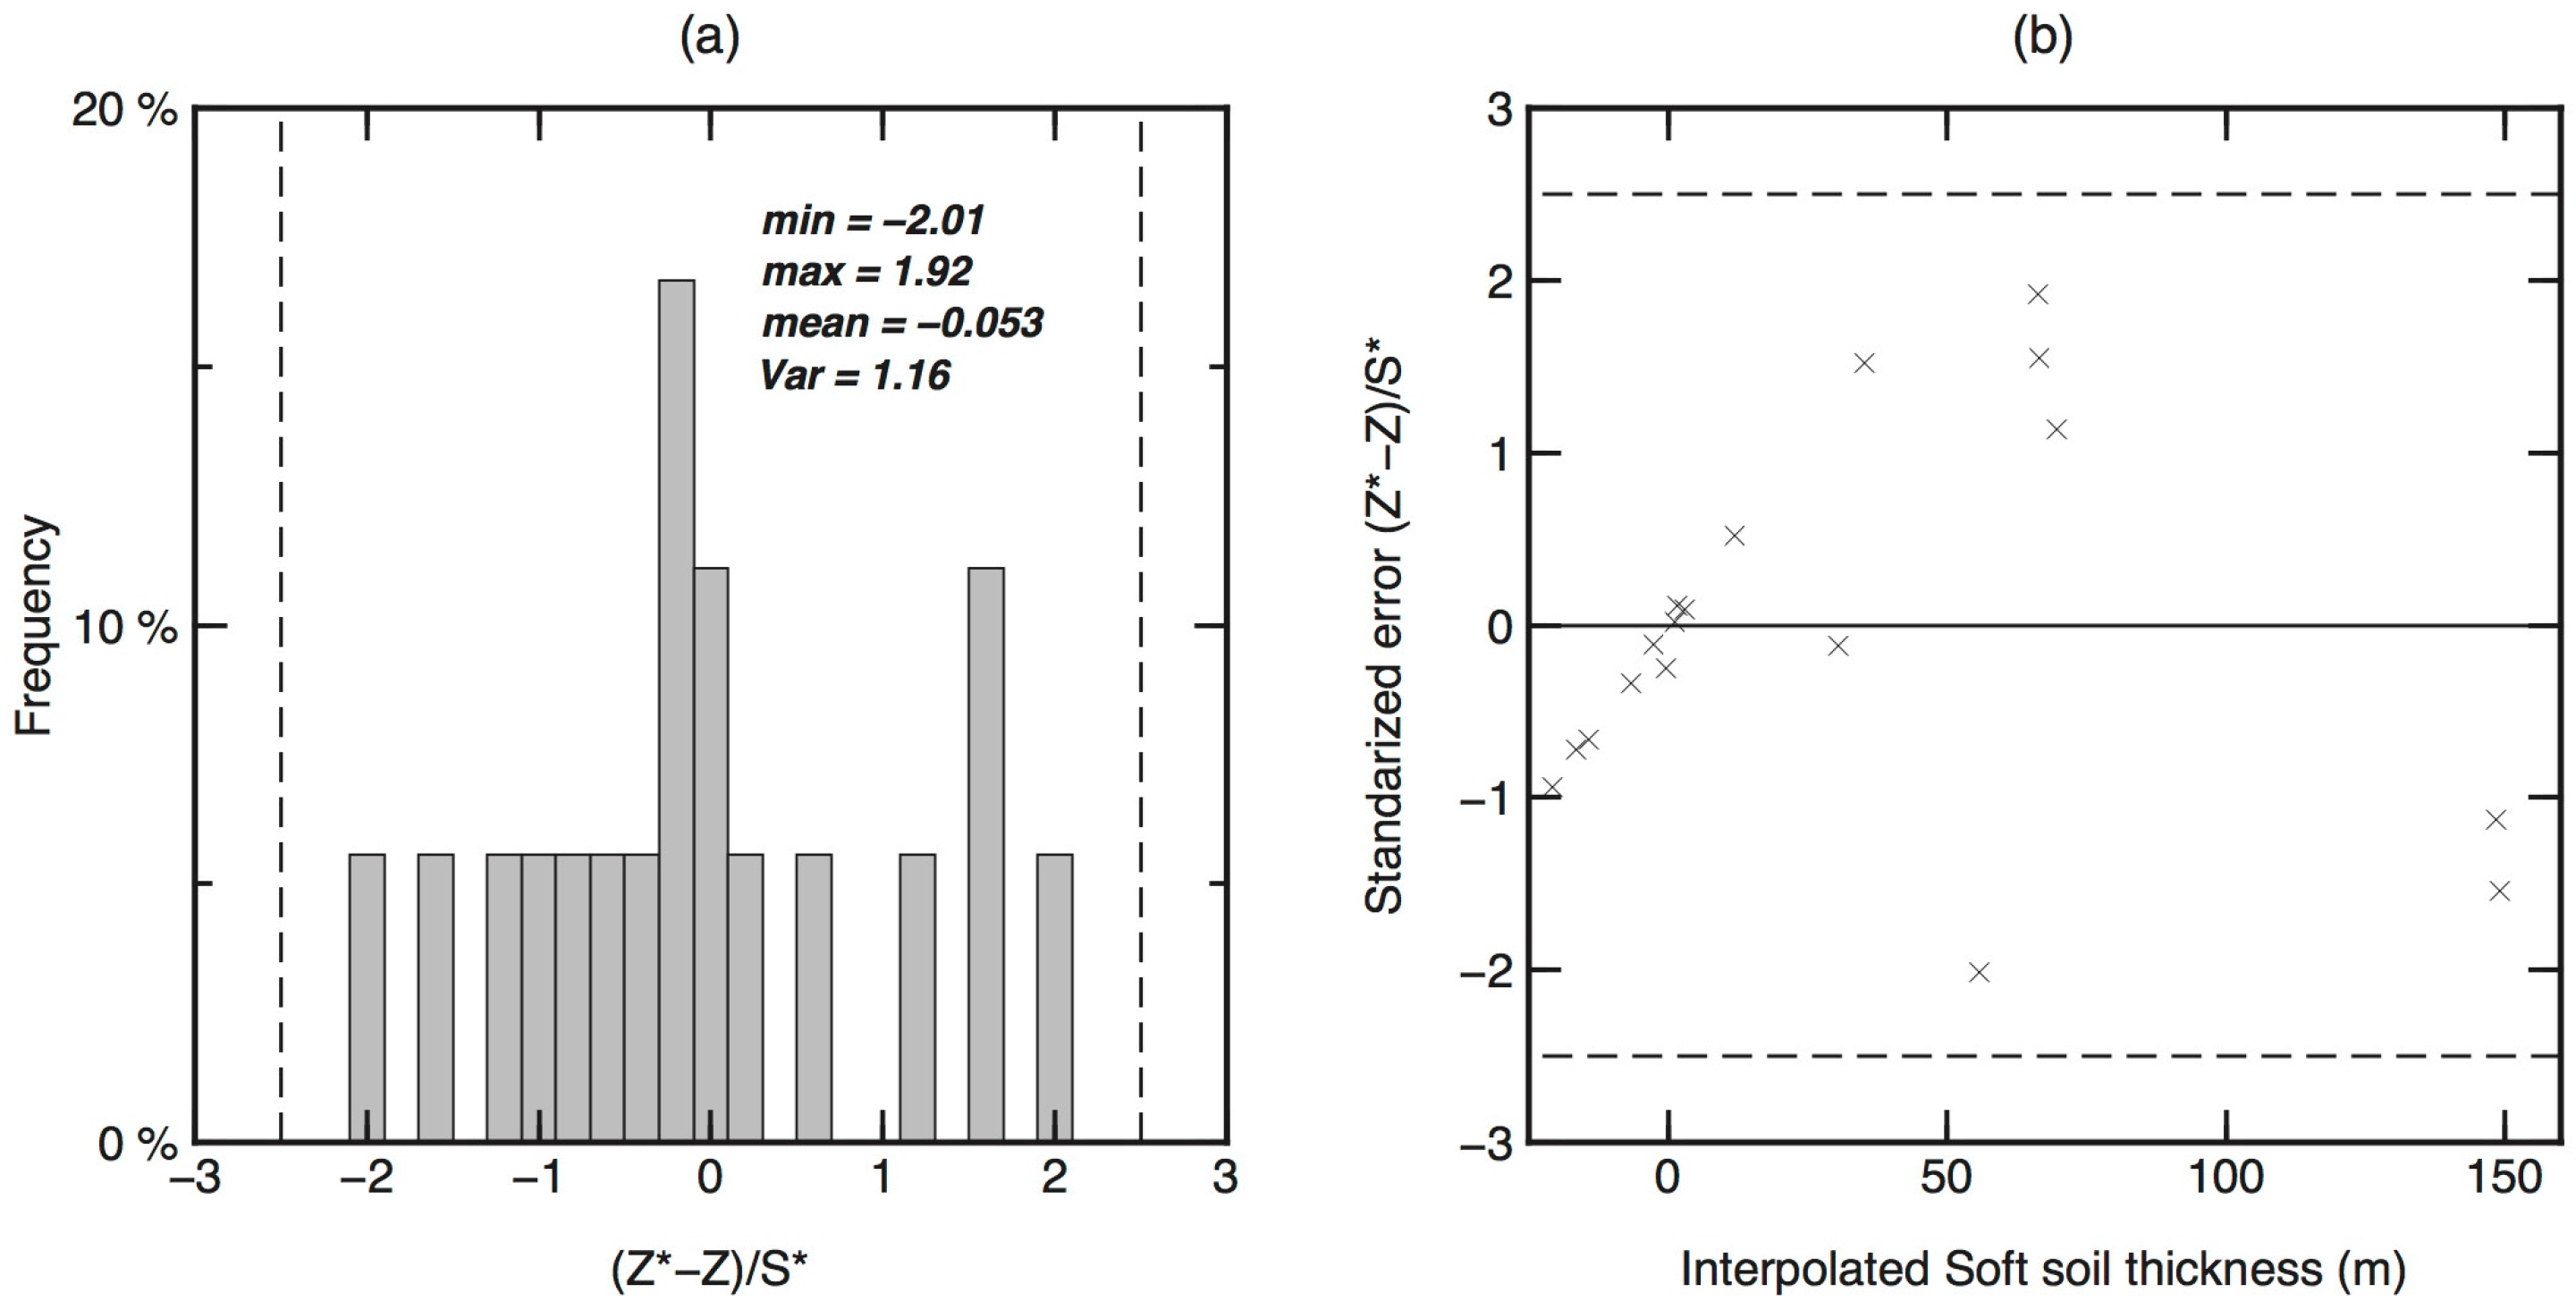
3.4. Kriging with External Drift
4. Results
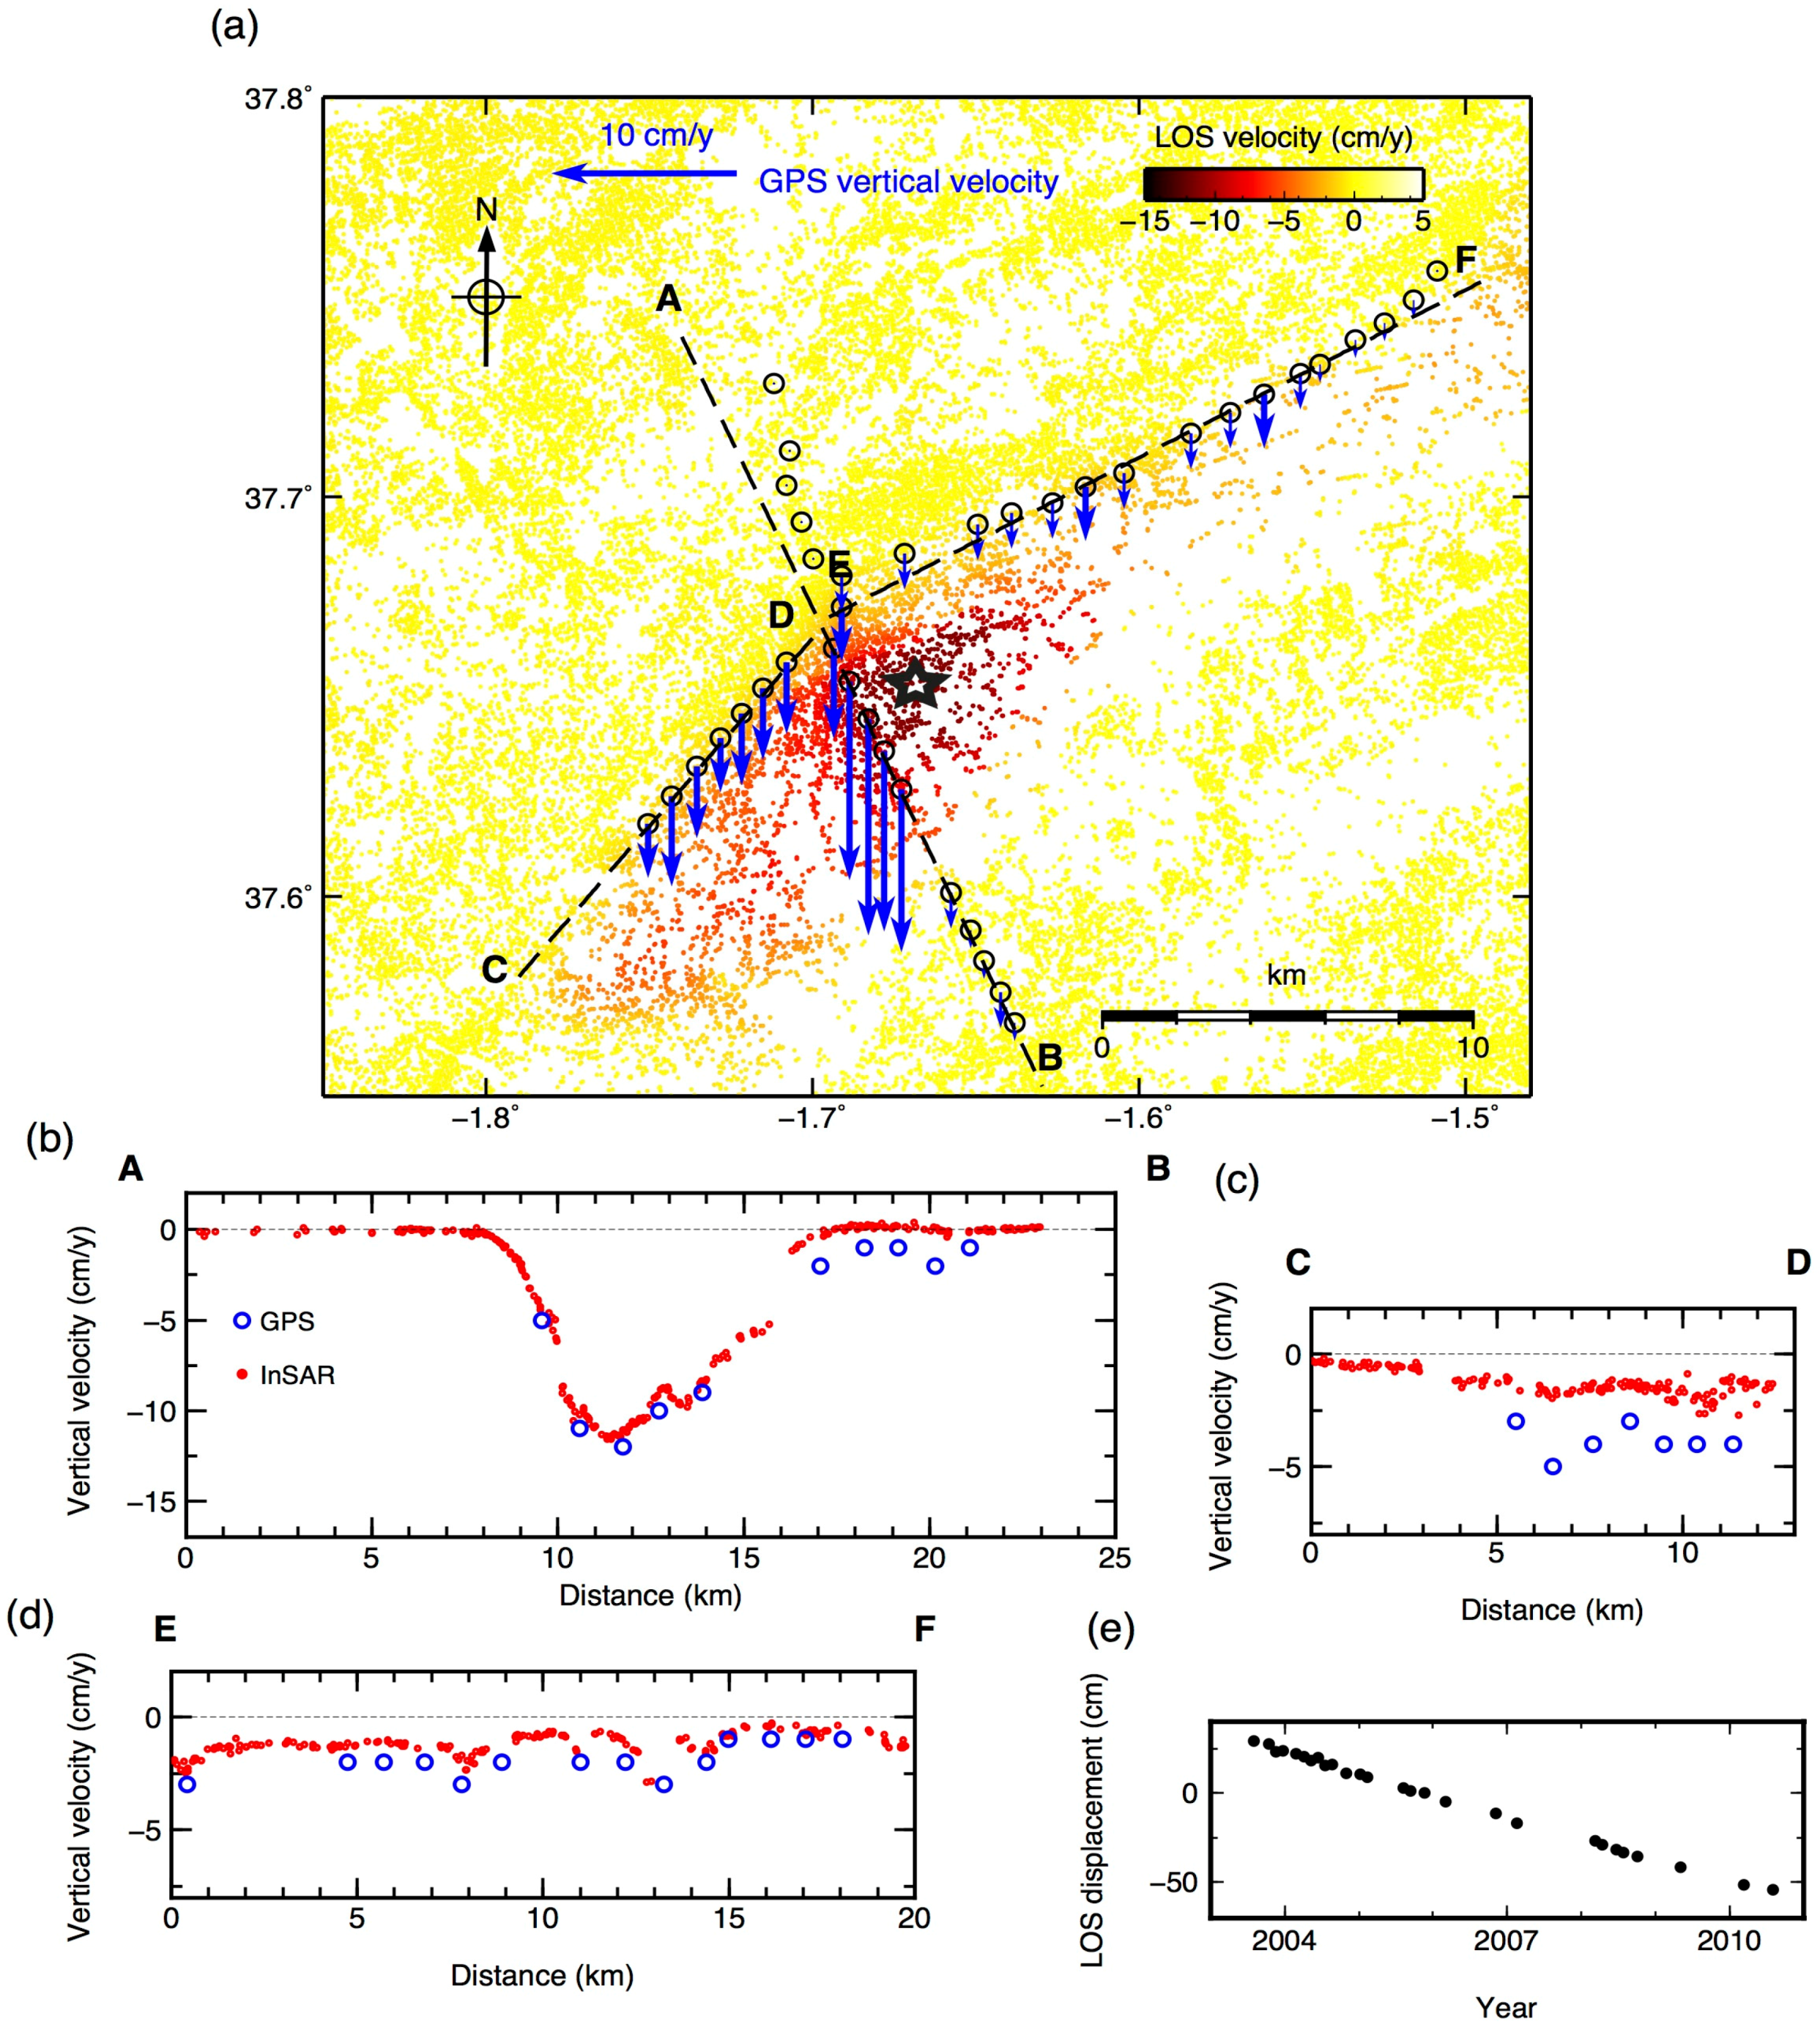
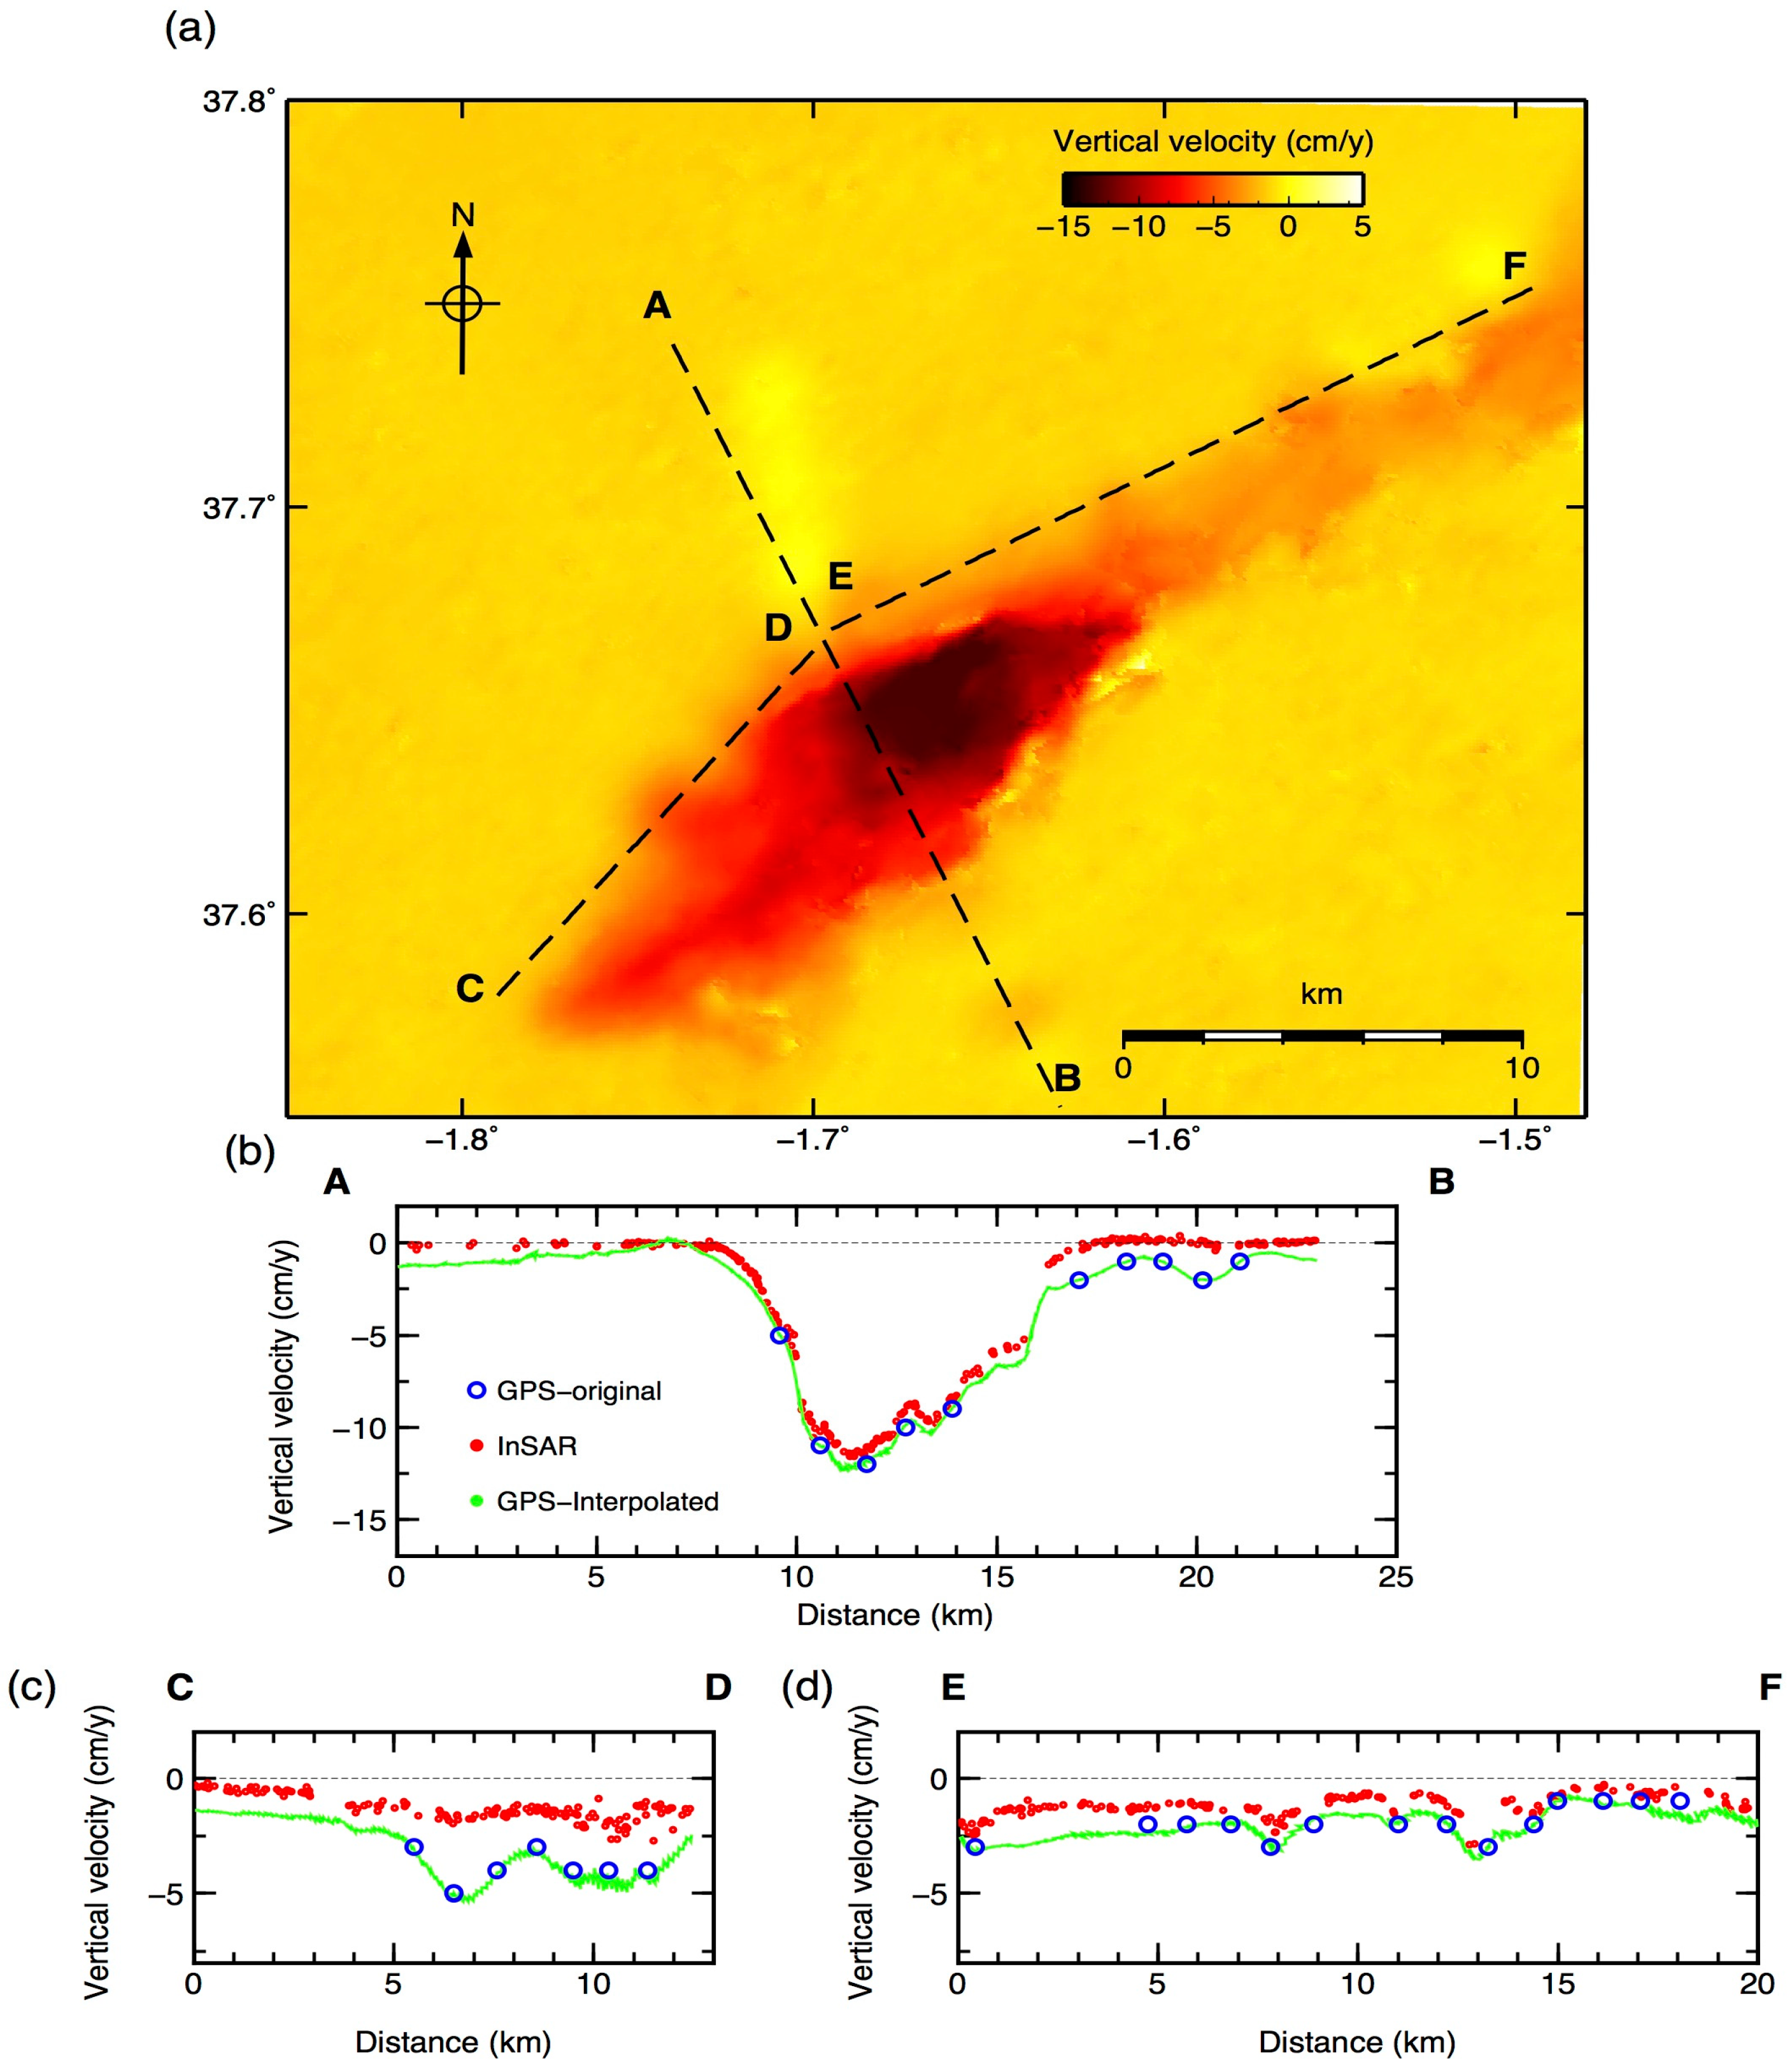
4.1. InSAR and GPS Deformation Rates
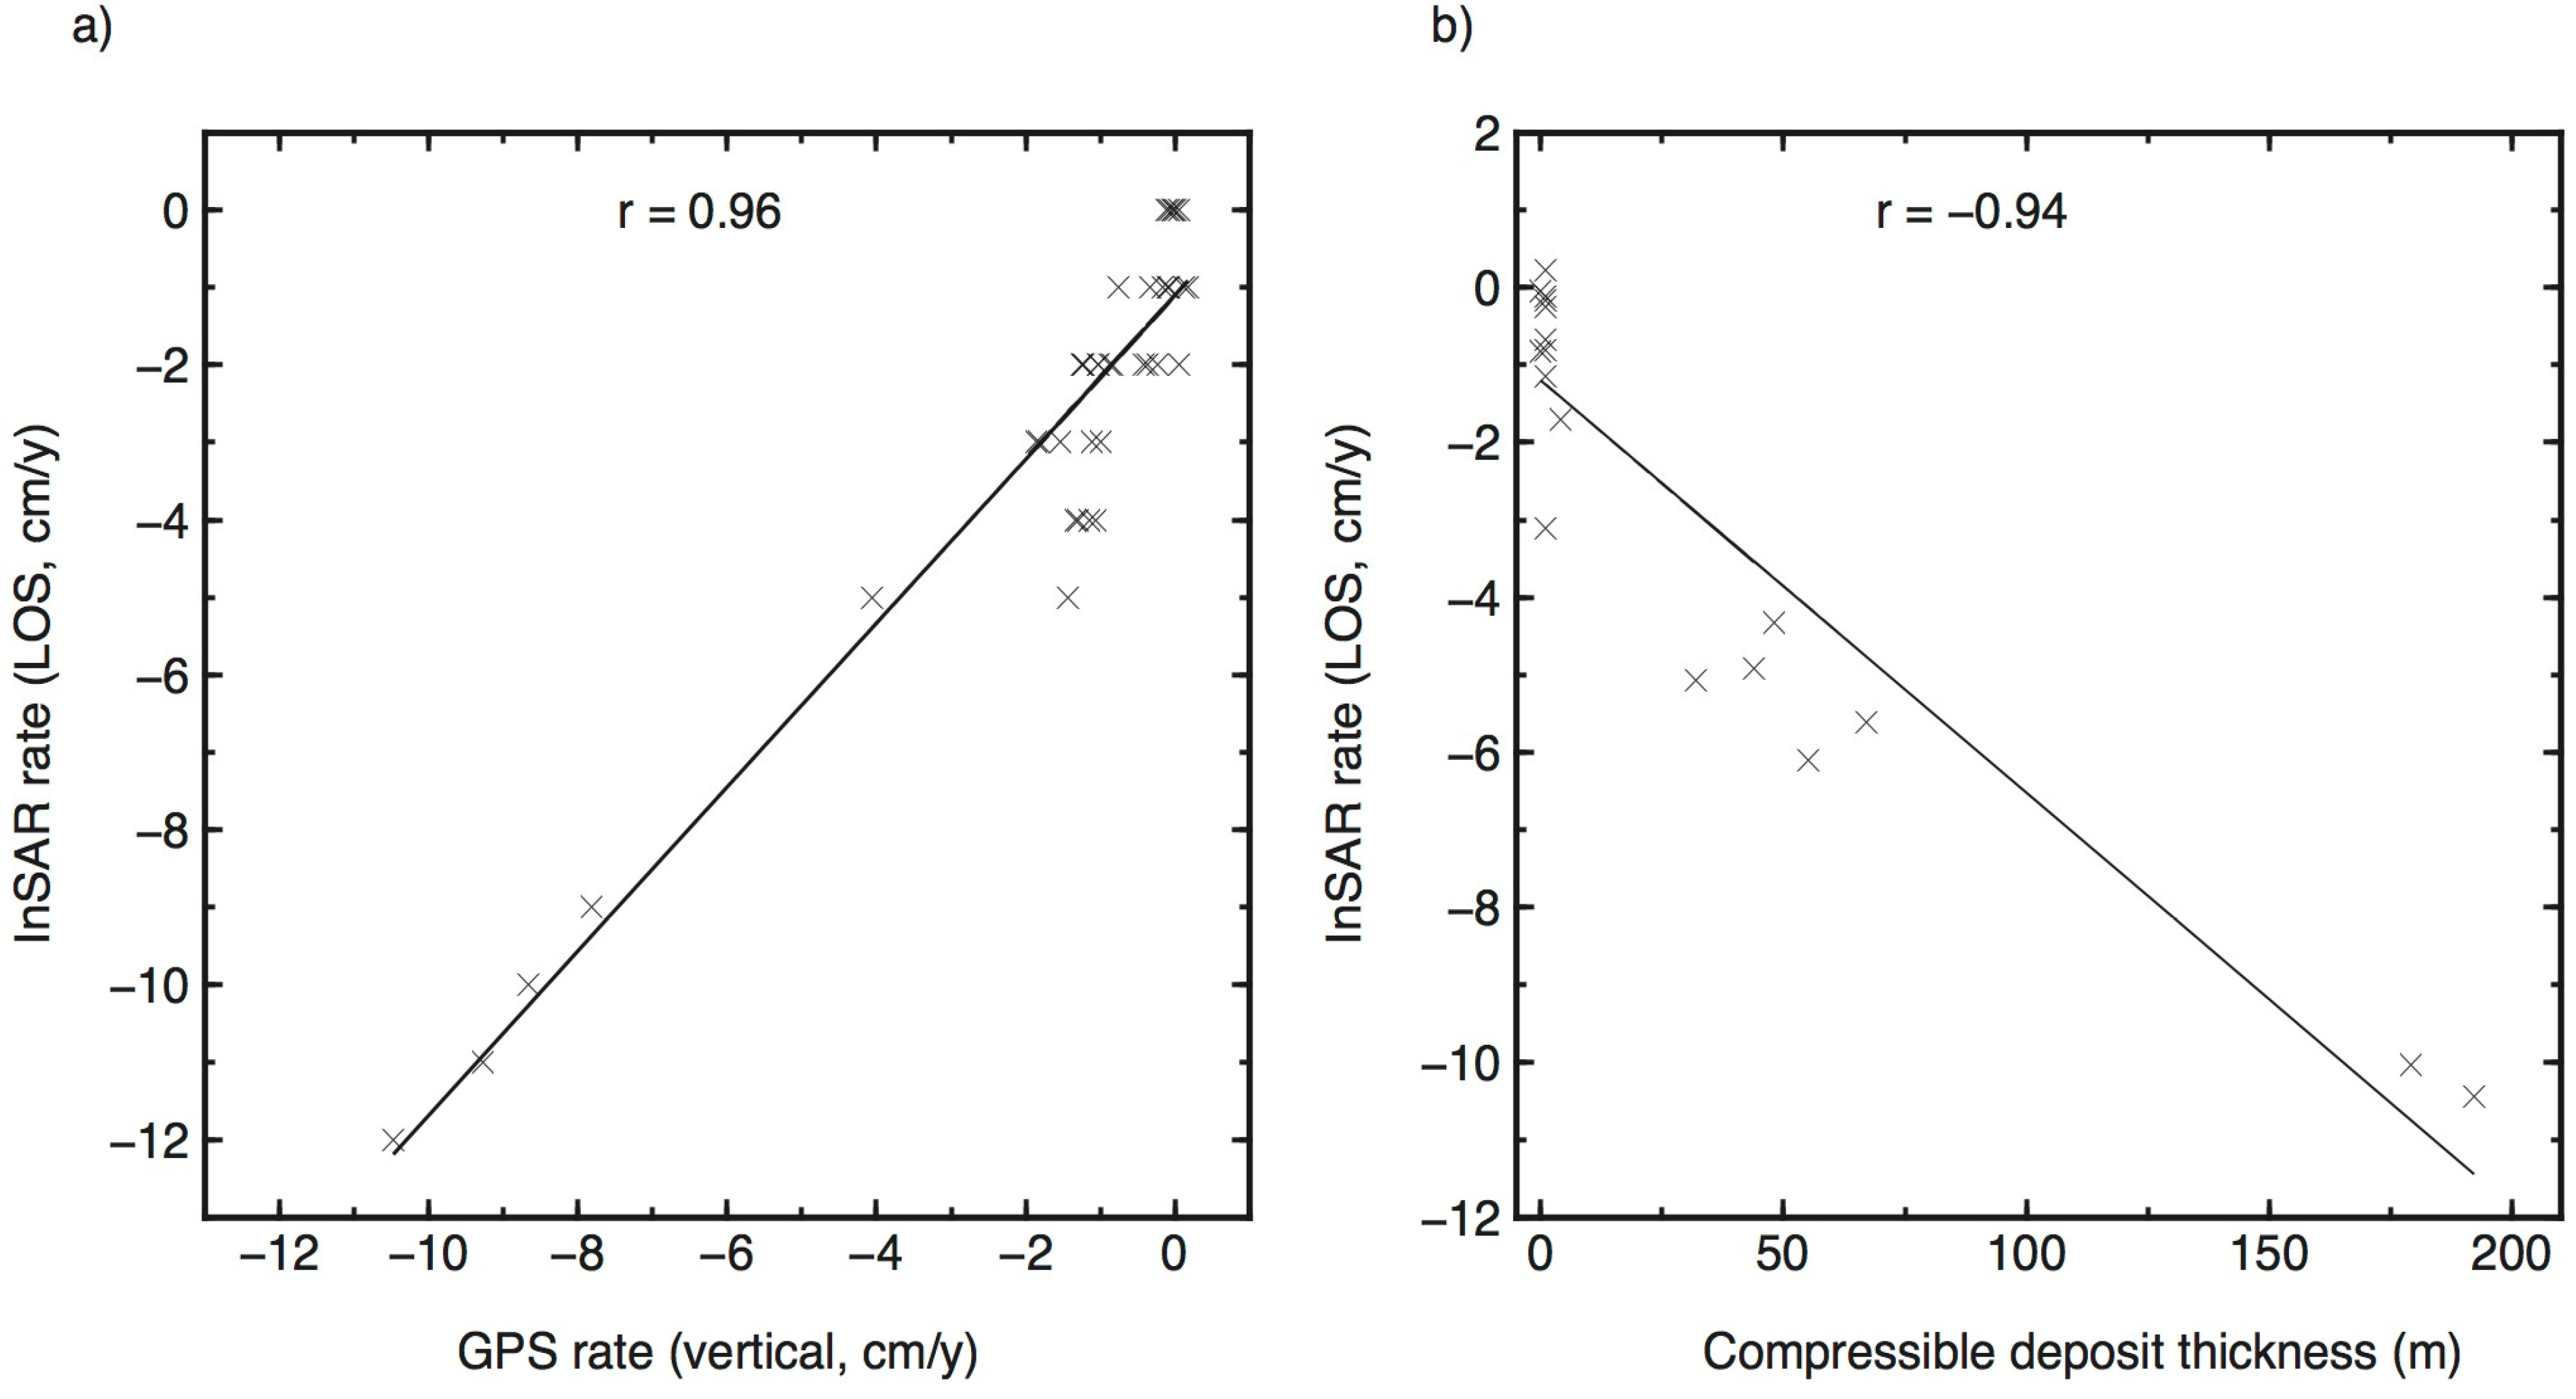
4.2. Correlation InSAR-GPS and InSAR-Compressible Deposit Thickness
4.3. Map of GPS Vertical Deformation Rates
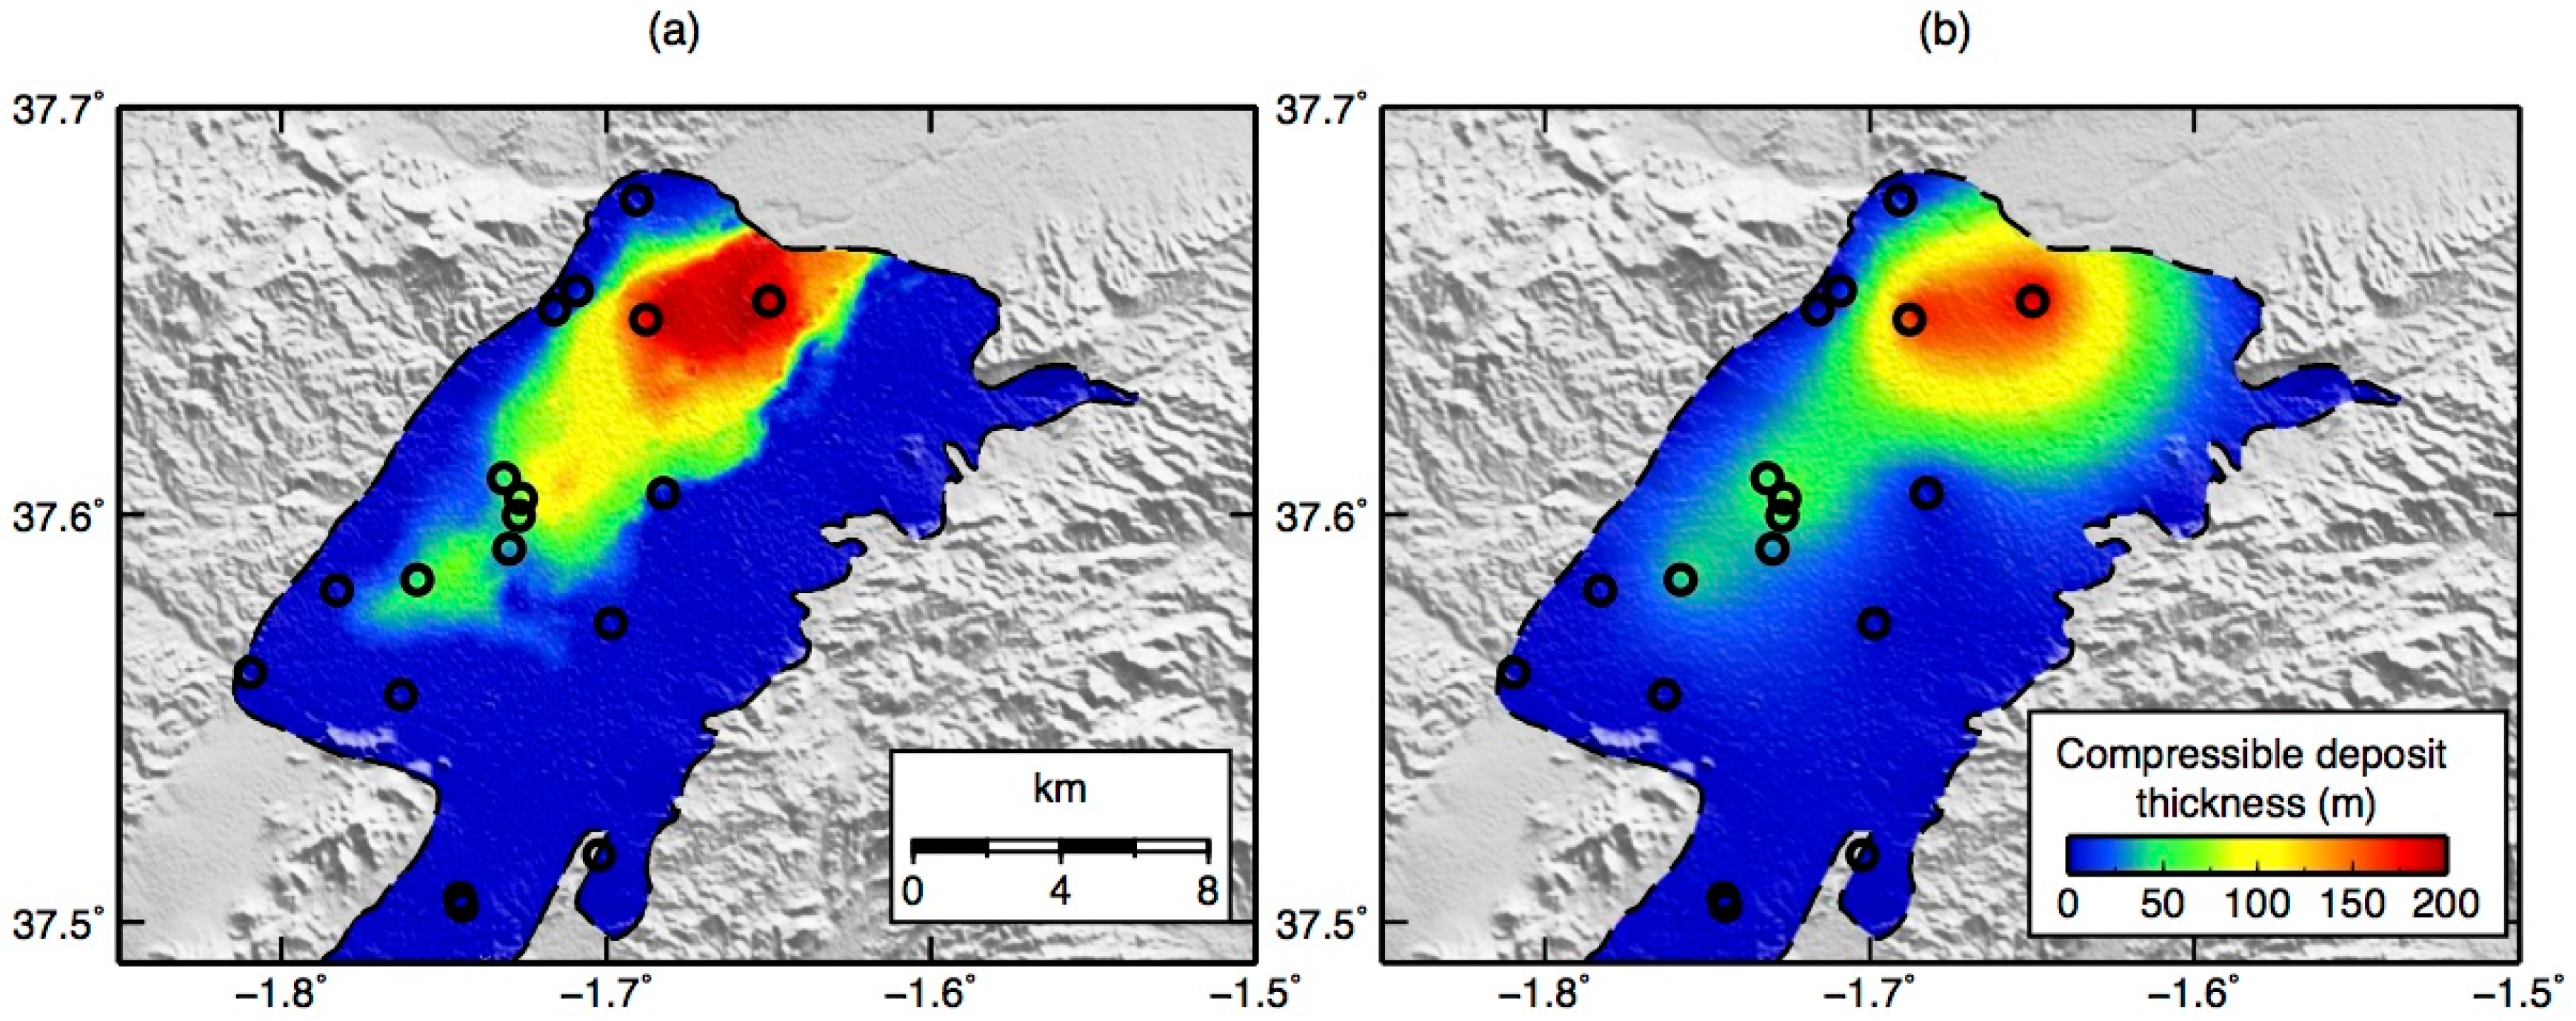
4.4. Compressible Deposit Thickness Map
5. Discussion
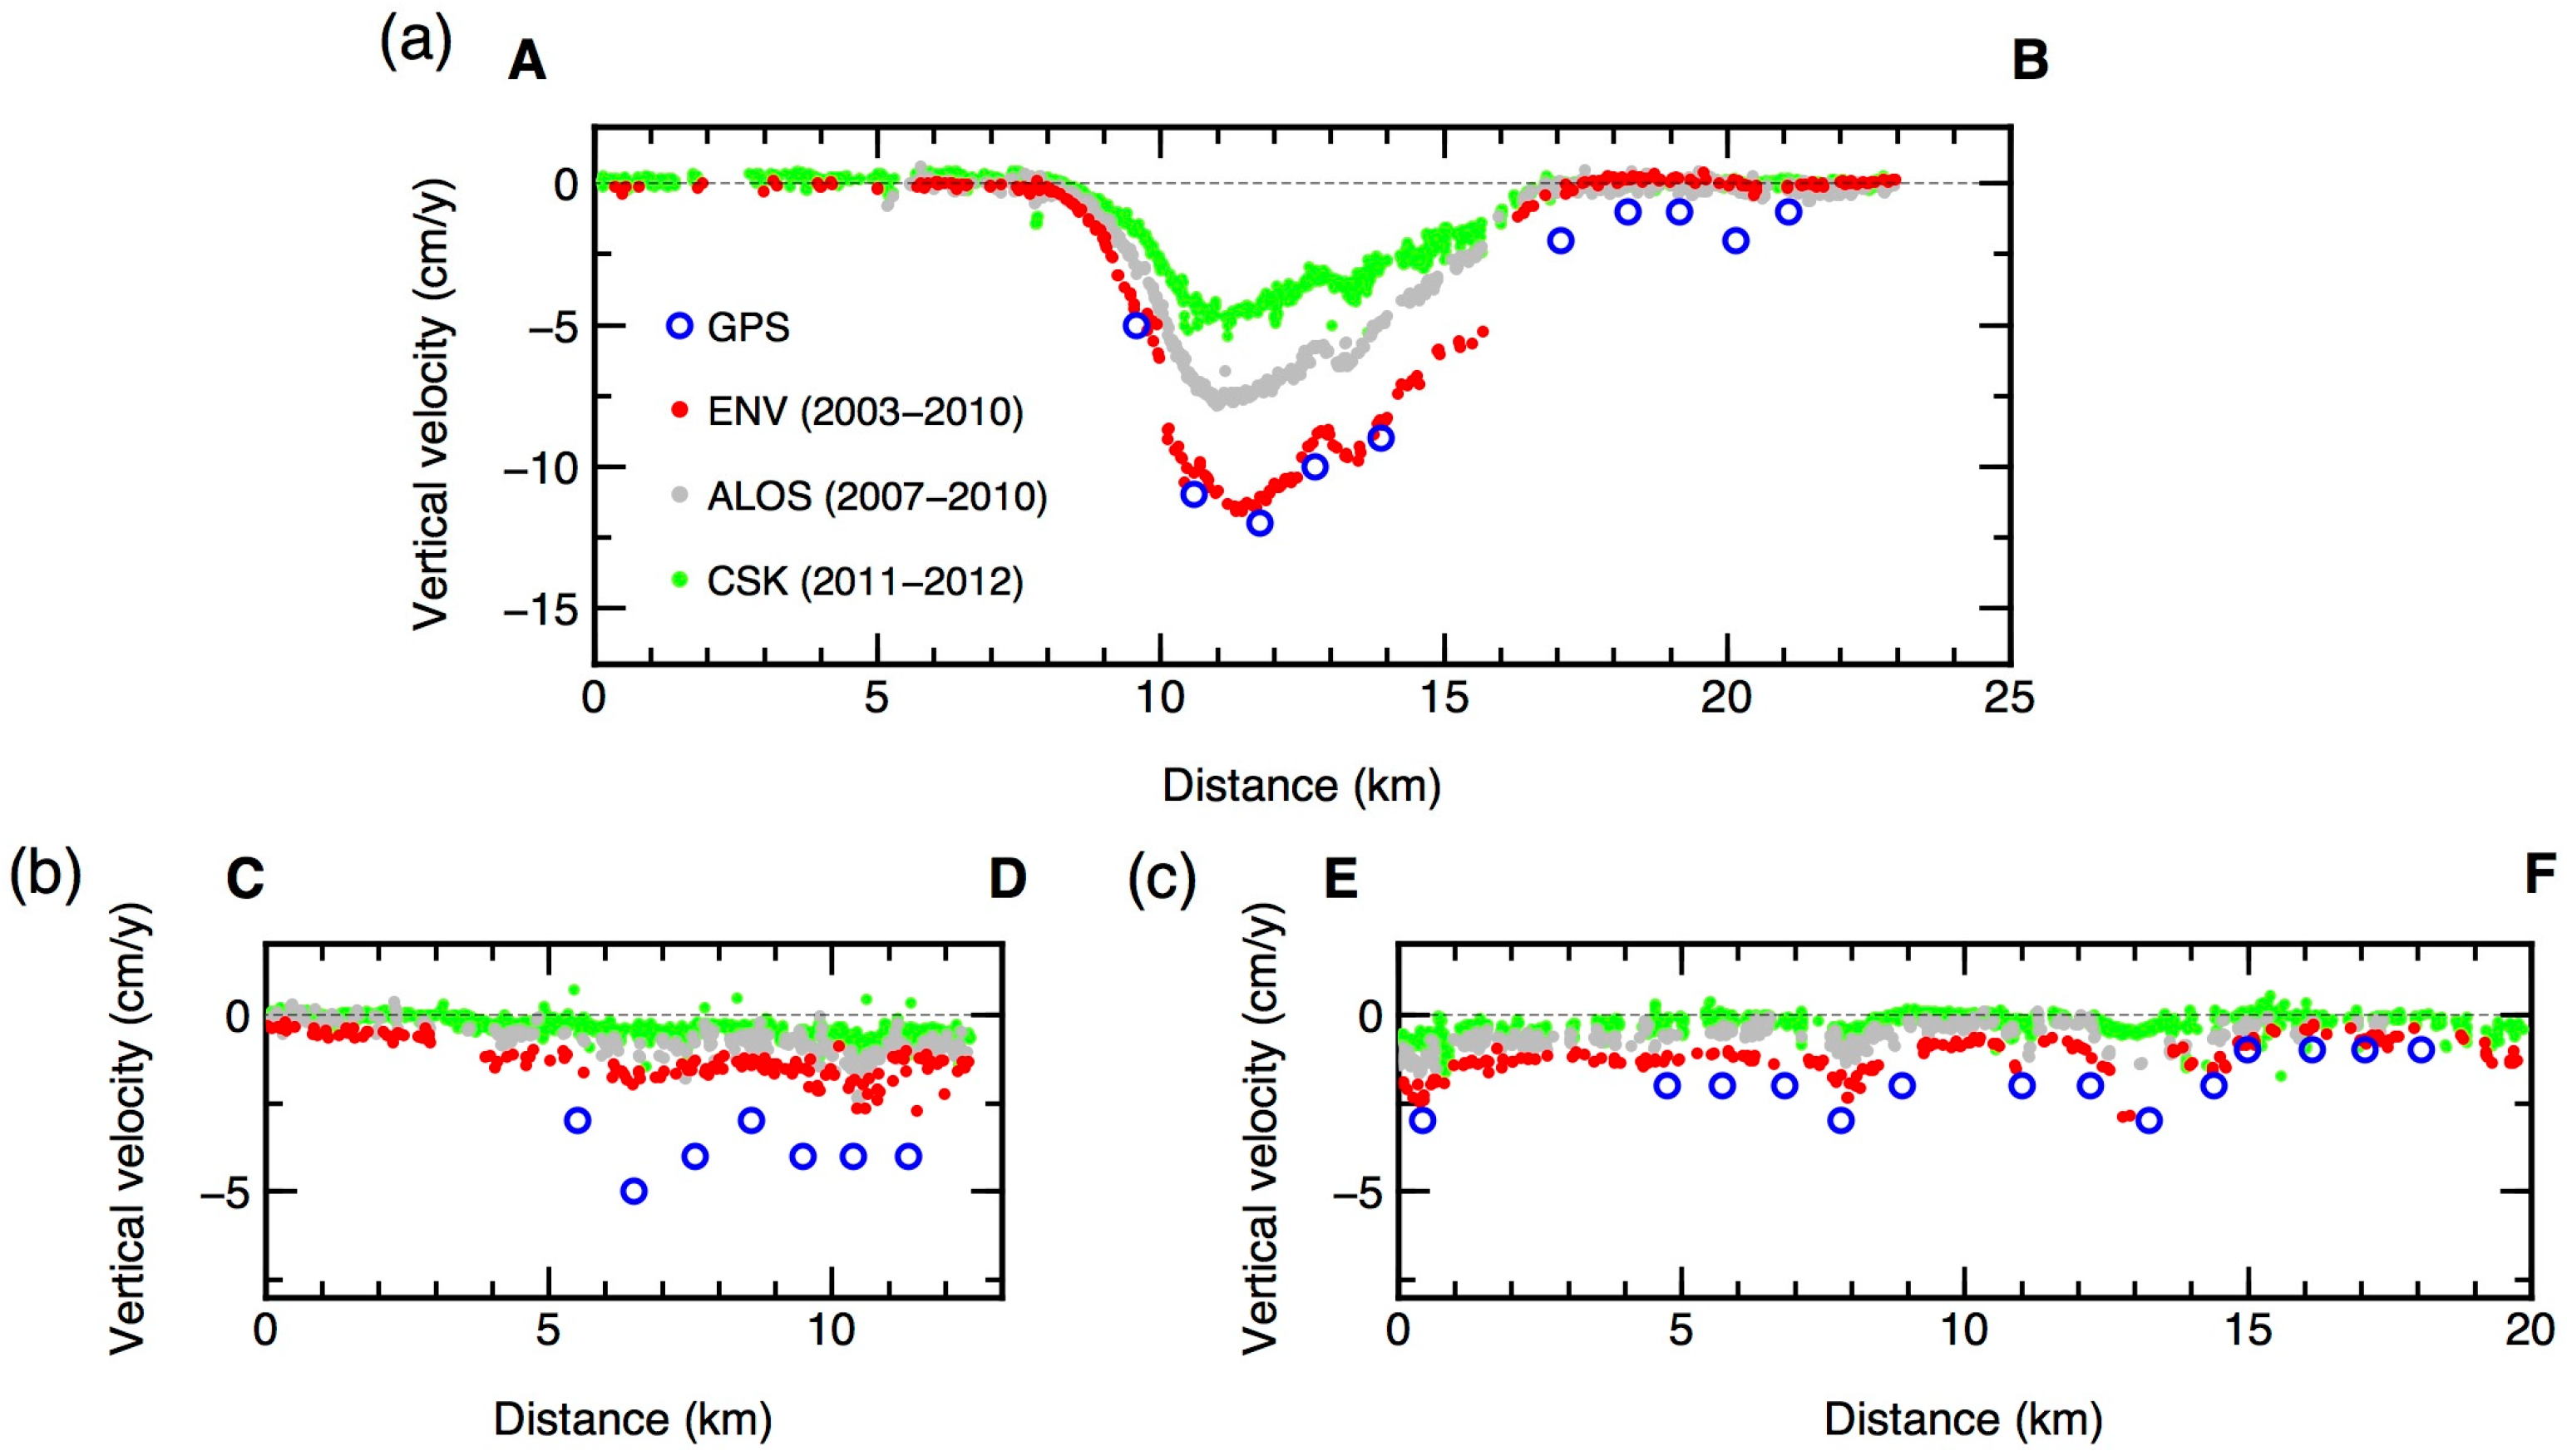
5.1. Comparison of Vertical Deformation Rates with Previous Studies
5.2. Comparison of the Compressible Deposit Thickness Map with Previous Studies
5.3. Future Research Directions: Sentinel-1 Data
6. Conclusions
Supplementary Materials
Acknowledgments
Author Contributions
Conflicts of Interest
Abbreviations
| GPS | Global Positioning System |
| GNSS | Global Navigation Satellite System |
| InSAR | Interferometric Synthetic Aperture Radar |
| SAR | Synthetic Aperture Radar |
| KED | Kriging with External Drift |
References
- Clarke, R.; Lawrence, A.; Foster, S. Groundwater: A Threatened Resource; United Nations Environment Programme Environment Library: Nairobi, Kenya, 1996. [Google Scholar]
- Galloway, D.L.; Burbey, T. Review: Regional land subsidence accompanying groundwater extraction. Hydrogeol. J. 2011. [Google Scholar] [CrossRef]
- Minh, D.H.T.; Trung, L.V.; Toan, T.L. Mapping ground subsidence phenomena in Ho Chi Minh City through the radar interferometry technique using ALOS PALSAR data. Remote Sens. 2015, 7, 8543–8562. [Google Scholar] [CrossRef] [Green Version]
- Yang, Y.; Luo, Y.; Liu, M.; Wang, R.; Wang, H. Research of features related to land subsidence and ground fissure disasters in the Beijing Plain. Proc. Int. Assoc. Hydrol. Sci. 2015, 372, 239–242. [Google Scholar] [CrossRef]
- Tomás, R.; García-Barba, J.; Cano, M.; Sanabria, M.P.; Ivorra, S.; Duro, J.; Herrera, G. Subsidence damage assessment of a gothic church using Differential Interferometry and field data. Struct. Health Monit. 2012, 11, 751–762. [Google Scholar] [CrossRef] [Green Version]
- Famiglietti, J.S. The global groundwater crisis. Nat. Clim. Chang. 2014, 4, 945–948. [Google Scholar] [CrossRef]
- Anderson, M.P.; Woessner, W.W. Applied Groundwater Modeling: Simulation of Flow and Advective Transport, 1st ed.; Academic Press: San Diego, CA, USA, 1992. [Google Scholar]
- Galloway, D.L.; Hoffmann, J. The application of satellite differential SAR interferometry-derived ground displacements in hydrogeology. Hydrogeol. J. 2007, 15, 133–154. [Google Scholar] [CrossRef]
- Tomás, R.; Romero, R.; Mulas, J.; Marturiá, J.J.; Mallorquí, J.J.; Lopez-Sanchez, J.M.; Herrera, G.; Gutiérrez, F.; González, P.J.; Fernández, P.J.; et al. Radar interferometry techniques for the study of ground subsidence phenomena: A review of practical issues through cases in Spain. Environ. Earth Sci. 2013. [Google Scholar] [CrossRef] [Green Version]
- Colesanti, C.; Ferretti, A.; Novali, F.; Prati, C.; Rocca, F. SAR monitoring of progressive and seasonal ground deformation using the permanent scatterers technique. IEEE Trans. Geosci. Remote Sens. 2003, 4, 1685–1701. [Google Scholar] [CrossRef]
- Lanari, R.; Mora, O.; Manunta, M.; Mallorqui, J.J.; Berardino, P.; Sansosti, E. A small baseline DIFSAR approach for investigating deformations on full resolution SAR interferograms. IEEE Trans. Geosci. Remote Sens. 2004, 7, 1377–1386. [Google Scholar] [CrossRef]
- Schmidt, D.A.; Burgmann, R. Time-dependent land uplift and subsidence in the Santa Clara valley, California, from a large interferometric synthetic aperture radar data set. J. Geophys. Res. 2003, 108, 2416–2428. [Google Scholar] [CrossRef]
- Hoffmann, J.; Zebker, H.; Galloway, D.; Amelung, F. Seasonal subsidence and rebound in Las Vegas Valley, Nevada, observed by synthetic aperture radar interferometry. Water Resour. Res. 2001, 37, 1551–1566. [Google Scholar] [CrossRef]
- Tomás, R.; Herrera, G.; Delgado, J.; Lopez-Sanchez, J.M.; Mallorqui, J.J.; Mulas, J. A ground subsidence study based on DInSAR data: Calibration of soil parameters and subsidence prediction in Murcia City (Spain). Eng. Geol. 2009, 111, 19–30. [Google Scholar] [CrossRef]
- Ezquerro, P.; Herrera, G.; Marchamalo, M.; Tomás, R.; Béjar-Pizarro, M.; Martínez, R. A quasi-elastic aquifer deformational behavior: Madrid aquifer case study. J. Hydrol. 2014, 519, 1192–1204. [Google Scholar] [CrossRef]
- Reeves, J.A.; Knight, R.; Zebker, H.A.; Kitanidis, P.K.; Schreüder, W.A. Estimating temporal changes in hydraulic head using InSAR data in the San Luis Valley, Colorado. Water Resour. Res. 2014, 50, 4459–4473. [Google Scholar] [CrossRef]
- Goovaerts, P. Geostatistical approaches for incorporating elevation into the spatial interpolation of rainfall. J. Hydrol. 2000, 228, 113–129. [Google Scholar] [CrossRef]
- Rivest, M.; Marcotte, D.; Pasquier, P. Hydraulic head field estimation using kriging with an external drift: A way to consider conceptual model information. J. Hydrol. 2008, 361, 349–361. [Google Scholar] [CrossRef]
- Hudson, G.; Wackernagel, H. Mapping temperature using kriging with external drift: Theory and an example from Scotland. Int. J. Climatol. 1994, 14, 77–91. [Google Scholar] [CrossRef]
- Troisi, S.; Fallico, C.; Straface, S.; Migliari, E. Application of kriging with external drift to estimate hydraulic conductivity from electrical-resistivity data in unconsolidated deposits near Montalto Uffugo, Italy. Hydrogeol. J. 2000, 8, 356–367. [Google Scholar] [CrossRef]
- López-Bermúdez, F.; Barberá, G.G.; Alonso-Sarría, F.; Belmonte Serrato, F. Natural Resources and Socioeconomic Systems in the Guadalentín Basin (South-east Spain): Water as a Key Factor. In Mediterranean Desertification: A Mosaic of Processes and Responses; Geeson, N.A., Brandt, C.J., Thornes, J.B., Eds.; John Wiley & Sons LTD: Manhattan, NY, USA, 2002; pp. 233–245. [Google Scholar]
- De Mets, C.; Gordon, R.G.; Argus, D.F.; Stein, S. Effect of recent revisions to the geomagnetic reversal time scale on estimate of current late motions. Geophys. Res. Lett. 1994, 21, 2191–2194. [Google Scholar] [CrossRef]
- Silva, P.G.; Goy, J.L.; Zazo, C.; Bardají, T. Fault generated mountain fronts in Southeast Spain: Geomorphologic assessment of tectonic and seismic activity. Geomorphology 2003, 250, 203–226. [Google Scholar] [CrossRef]
- Martínez-Díaz, J.J.; Masana, E.; Ortuño, M. Active tectonics of the Alhama de Murcia fault, Betic Cordillera, Spain. J. Iber. Geol. 2012, 38, 253–270. [Google Scholar] [CrossRef]
- Cerón, J.C.; Pulido-Bosch, A. Groundwater problems resulting from CO2 pollution and overexploitation in Alto Guadalentín aquifer (Murcia, Spain). Environ. Geol. 1996, 28, 223–228. [Google Scholar] [CrossRef]
- Silva, P.G.; Calmel-Avila, M.; Bardají, T.; Goy, J.L.; Zazo, C. Transition from alluvial to fluvial systems in the Guadalentín Depression (SE Spain) during the Holocene: Lorca Fan versus Guadalentín River. Geomorphology 2008, 100, 144–153. [Google Scholar] [CrossRef]
- CHS (Confederación Hidrográfica del Segura). Plan Hidrológico de la Cuenca del Segura 2015/2021. Análisis Piezométrico Histórico y de los Ultimos 25 años (1990–2014) de las Masas de Agua Subterráneas de la Demarcación Hidrográfica del Segura. 070.057 Alto Guadalentín. 2014. Available online: https://www.chsegura.es/static/plan-15-21/01_MEMORIA.zip (accessed on 17 November 2016).
- Boni, R.; Herrera, G.; Meisina, C.; Notti, D.; Béjar-Pizarro, M.; Zucca, F.; González, P.J.; Palano, M.; Tomás, R.; Fernández, J. Twenty-year advanced DInSAR analysis of severe land subsidence: The Alto Guadalentín Basin (Spain) case study. Eng. Geol. 2015. [Google Scholar] [CrossRef]
- González, P.J.; Fernández, J. Drought-driven transient aquifer compaction imaged using multitemporal satellite radar interferometry. Geology 2011, 39, 551–554. [Google Scholar] [CrossRef]
- Rigo, A.; Béjar-Pizarro, M.; Martínez-Díaz, J. Monitoring of Guadalentín valley (southern Spain) through a fast SAR Interferometry method. J. Appl. Geophys. 2013, 91, 39–48. [Google Scholar] [CrossRef]
- Bozzano, F.; Esposito, C.; Franchi, S.; Mazzanti, P.; Perissin, D.; Rocca, A.; Romano, E. Understanding the subsidence process of a quaternary plain by combining geological and hydrogeological modelling with satellite InSAR data: The Acque Albule Plain case study. Remote Sens. Environ. 2015, 168, 219–238. [Google Scholar] [CrossRef]
- Ortega-Becerril, J.A.; Garzón, G.; Béjar-Pizarro, M.; Martínez-Díaz, J.J. Towards an increase of flash-flood geomorphic effects due to gravel mining and ground subsidence in Nogalte stream (SE Spain, Murcia). Nat. Hazards Earth Syst. Sci. 2016, 16, 2273–2286. [Google Scholar] [CrossRef]
- European Space Agency. ASAR Product Handbook. 2007. Available online: https://earth.esa.int/pub/ESA_DOC/ENVISAT/ASAR/asar.ProductHandbook.2_2.pdf (accessed on 17 Novembe 2016).
- Berardino, P.; Fornaro, G.; Lanari, R.; Sansosti, E. A new algorithm for surface deformation monitoring based on small baseline differential SAR interferograms. IEEE Trans. Geosci. Remote Sens. 2002, 40, 2375–2383. [Google Scholar] [CrossRef]
- Rosen, P.A.; Hensley, S.; Peltzer, G.; Simons, M. Updated repeat orbit interferometry package released. Eos Trans. Am. Geophys. Union 2004, 85, 47. [Google Scholar] [CrossRef]
- Kampes, B.; Hanssen, R.; Perski, Z. Radar interferometry with public domain tools. Proc. Fringe 2003, ESA SP-550, 1–5. [Google Scholar]
- Farr, T.; Rosen, P.; Caro, E.; Crippen, R.; Duren, R.; Hensley, S.; Alsdorf, D. The shuttle radar topography mission. Rev. Geophys. 2007, 45, 2005RG000183. [Google Scholar] [CrossRef]
- Hooper, A.; Segall, P.; Zebker, H. Persistent scatterer interferometric synthetic aper- ture radar for crustal deformation analysis, with application to Volcán Alcedo, Galápagos. J. Geophys. Res. 2007, 112, B07407. [Google Scholar] [CrossRef]
- IGN (Instituto Geográfico Nacional de España). El Nuevo Modelo de Geoide Para EspañaEGM08–REDNAP. 2009. Available online: ftp://ftp.geodesia.ign.es/documentos/EL%20NUEVO%20MODELO%20DE%20GEOIDE%20PARA%20ESPA_A%20EGM08-REDNAP.pdf (accessed on 13 August 2016).
- Goovaerts, P. Geostatistics for Natural Resources Evaluation; Oxford University Press: Oxford, UK, 1997. [Google Scholar]
- Journel, A.G. Fundamentals of Geostatistics in Five Lessons; American Geophysical Union: Washington, DC, USA, 1989. [Google Scholar]
- Geovariances. Isatis v11 Software Manual; Geovariances: Avon, France, 2011. [Google Scholar]
- Isaaks, E.H.; Srivastava, R.M. Applied Geostatistics; Oxford University Press: New York, NY, USA, 1989; p. 561. [Google Scholar]
- Journel, A.G.; Huijbregts, C.J. Mining Geostatistics; Academic Press: San Diego, CA, USA, 1978. [Google Scholar]
- Wackernagel, H. Multivariate Geostatistics: An Introduction with Applications; Springer Science & Business Media: Berlin, Germany, 2013. [Google Scholar]
- Clark, I. The art of cross validation in geostatistical application. Proc. APCOM 1986, 19, 211–220. [Google Scholar]
- Gómez-Hernández, J.J.; Cassiraga, E.F.; Guardiola-Albert, C.; Rodríguez, J.Á. Incorporating information from a digital elevation model for improving the areal estimation of rainfall. In GeoENV III—Geostatistics for Environmental Applications; Springer: Dordrecht, The Netherlands, 2001; pp. 67–78. [Google Scholar]
- Manconi, A.; Casu, F. Joint analysis of displacement time series retrieved from SAR phase and amplitude: Impact on the estimation of volcanic source parameters. Geophys. Res. Lett. 2012. [Google Scholar] [CrossRef]
- Rosenquvist, A.; Shimada, M.; Watanabe, M. ALOS PALSAR: Technical outline and mission concepts. In Proceedings of the 4th International Symposium on Retrieval of Bio- and Geophysical Parameters from SAR Data for Land Applications, Innsbruck, Austria, 16–19 November 2004.
- Italian Space Agency. COSMO-SkyMed System Description & User Guide. 2010. Available online: http://www.e-geos.it/products/pdf/csk-user_guide.pdf (accessed on 17 November 2016).
- Sansosti, E.; Manunta, M.; Casu, F.; Bonano, M.; Ojha, C.; Marsella, M.; Lanari, R. Radar remote sensing from space for surface deformation analysis: Present and future opportunities from the new SAR sensor generation. Rend. Fis. Acc. Lincei 2015. [Google Scholar] [CrossRef]
- Geudtner, D.; Torres, R.; Snoeij, P.; Davidson, M.; Rommen, B. Sentinel-1 System Capabilities and Applications. In Proceedings of the International Geoscience and Remote Sensing Symposium, Quebec, QC, Canada, 13–18 July 2014.
- Plank, S. Rapid damage assessment by means of multi-temporal SAR—A comprehensive review and outlook to Sentinel-1. Remote Sens. 2014, 6, 4870–4906. [Google Scholar] [CrossRef]
- Milillo, P.; Riel, B.; Minchew, B.; Yun, S.H.; Simons, M.; Lundgren, P. On the synergistic use of SAR constellations’ data exploitation for earth science and natural hazard response. IEEE J. Sel. Top. Appl. Earth Obs. Remote Sens. 2015. [Google Scholar] [CrossRef]
- Barra, A.; Monserrat, O.; Mazzanti, P.; Esposito, C.; Crosetto, M.; Mugnozza, G.S. First insights on the potential of Sentinel-1 for landslides detection. Geomat. Nat. Hazards Risk 2016. [Google Scholar] [CrossRef]


© 2016 by the authors; licensee MDPI, Basel, Switzerland. This article is an open access article distributed under the terms and conditions of the Creative Commons Attribution (CC-BY) license (http://creativecommons.org/licenses/by/4.0/).
Share and Cite
Béjar-Pizarro, M.; Guardiola-Albert, C.; García-Cárdenas, R.P.; Herrera, G.; Barra, A.; López Molina, A.; Tessitore, S.; Staller, A.; Ortega-Becerril, J.A.; García-García, R.P. Interpolation of GPS and Geological Data Using InSAR Deformation Maps: Method and Application to Land Subsidence in the Alto Guadalentín Aquifer (SE Spain). Remote Sens. 2016, 8, 965. https://doi.org/10.3390/rs8110965
Béjar-Pizarro M, Guardiola-Albert C, García-Cárdenas RP, Herrera G, Barra A, López Molina A, Tessitore S, Staller A, Ortega-Becerril JA, García-García RP. Interpolation of GPS and Geological Data Using InSAR Deformation Maps: Method and Application to Land Subsidence in the Alto Guadalentín Aquifer (SE Spain). Remote Sensing. 2016; 8(11):965. https://doi.org/10.3390/rs8110965
Chicago/Turabian StyleBéjar-Pizarro, Marta, Carolina Guardiola-Albert, Ramón P. García-Cárdenas, Gerardo Herrera, Anna Barra, Antonio López Molina, Serena Tessitore, Alejandra Staller, José A. Ortega-Becerril, and Ramón P. García-García. 2016. "Interpolation of GPS and Geological Data Using InSAR Deformation Maps: Method and Application to Land Subsidence in the Alto Guadalentín Aquifer (SE Spain)" Remote Sensing 8, no. 11: 965. https://doi.org/10.3390/rs8110965