
Crop Mapping Using PROBA-V Time Series Data at the Yucheng and Hongxing Farm in China


Abstract
:1. Introduction
2. Materials
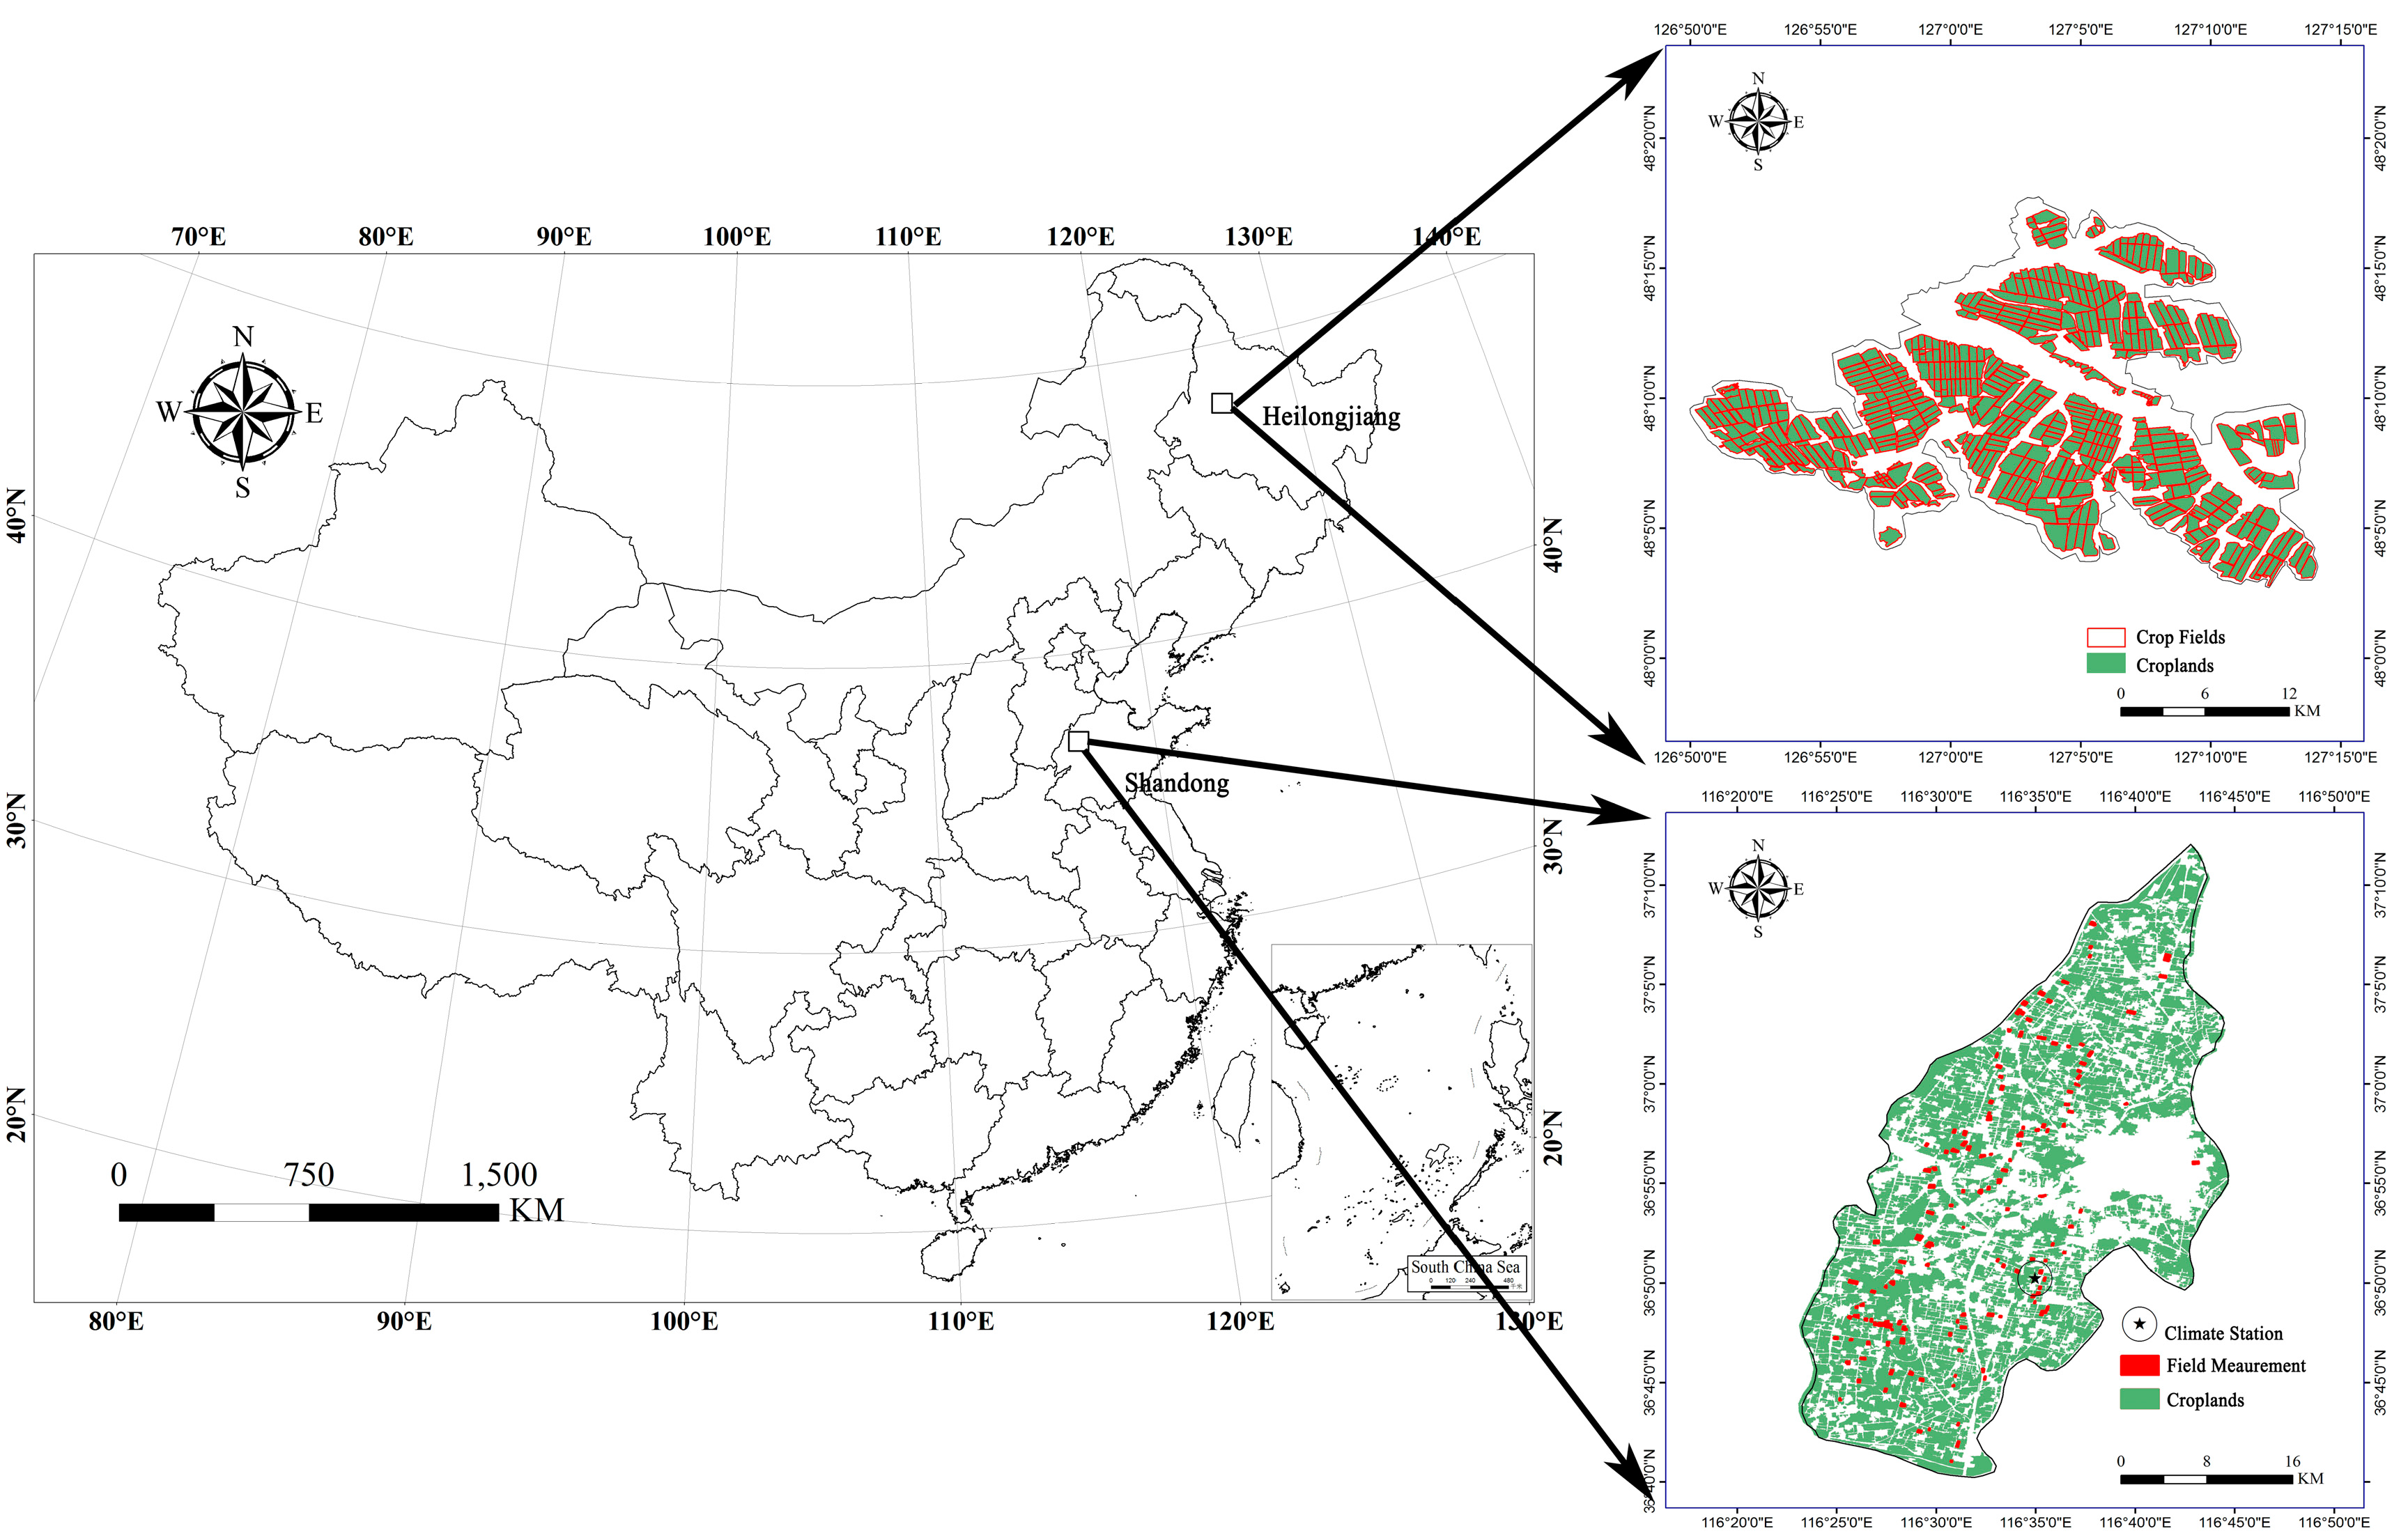
2.1. Study Area
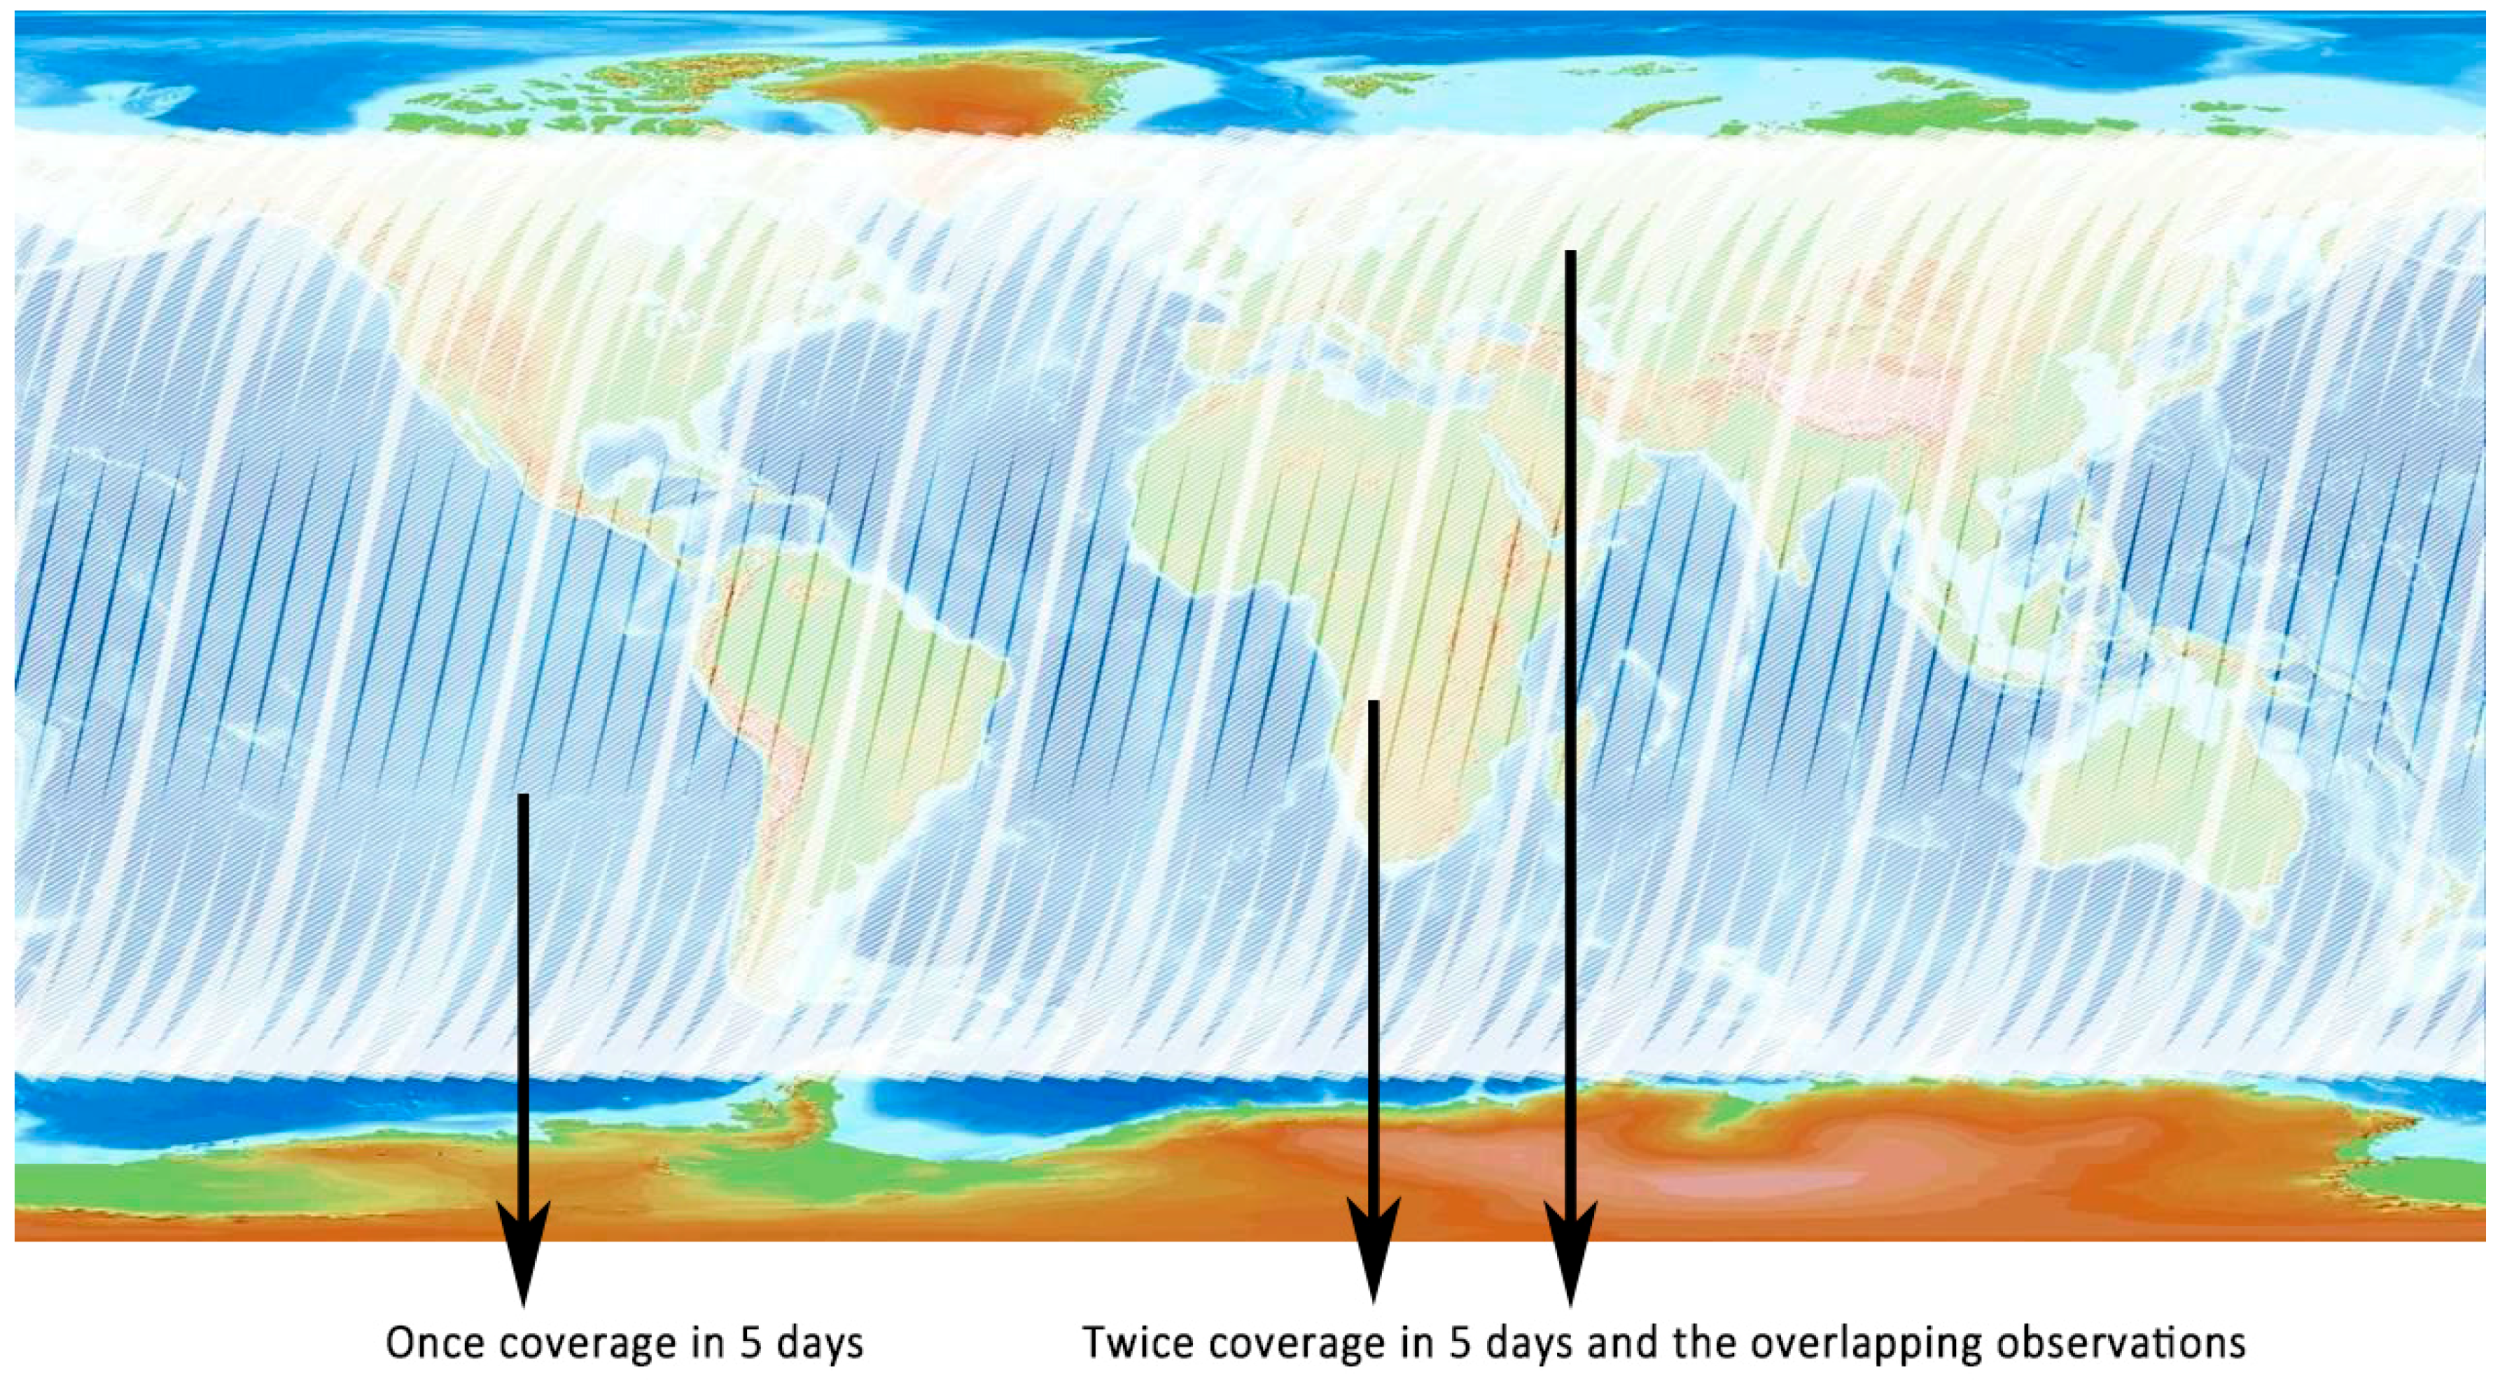
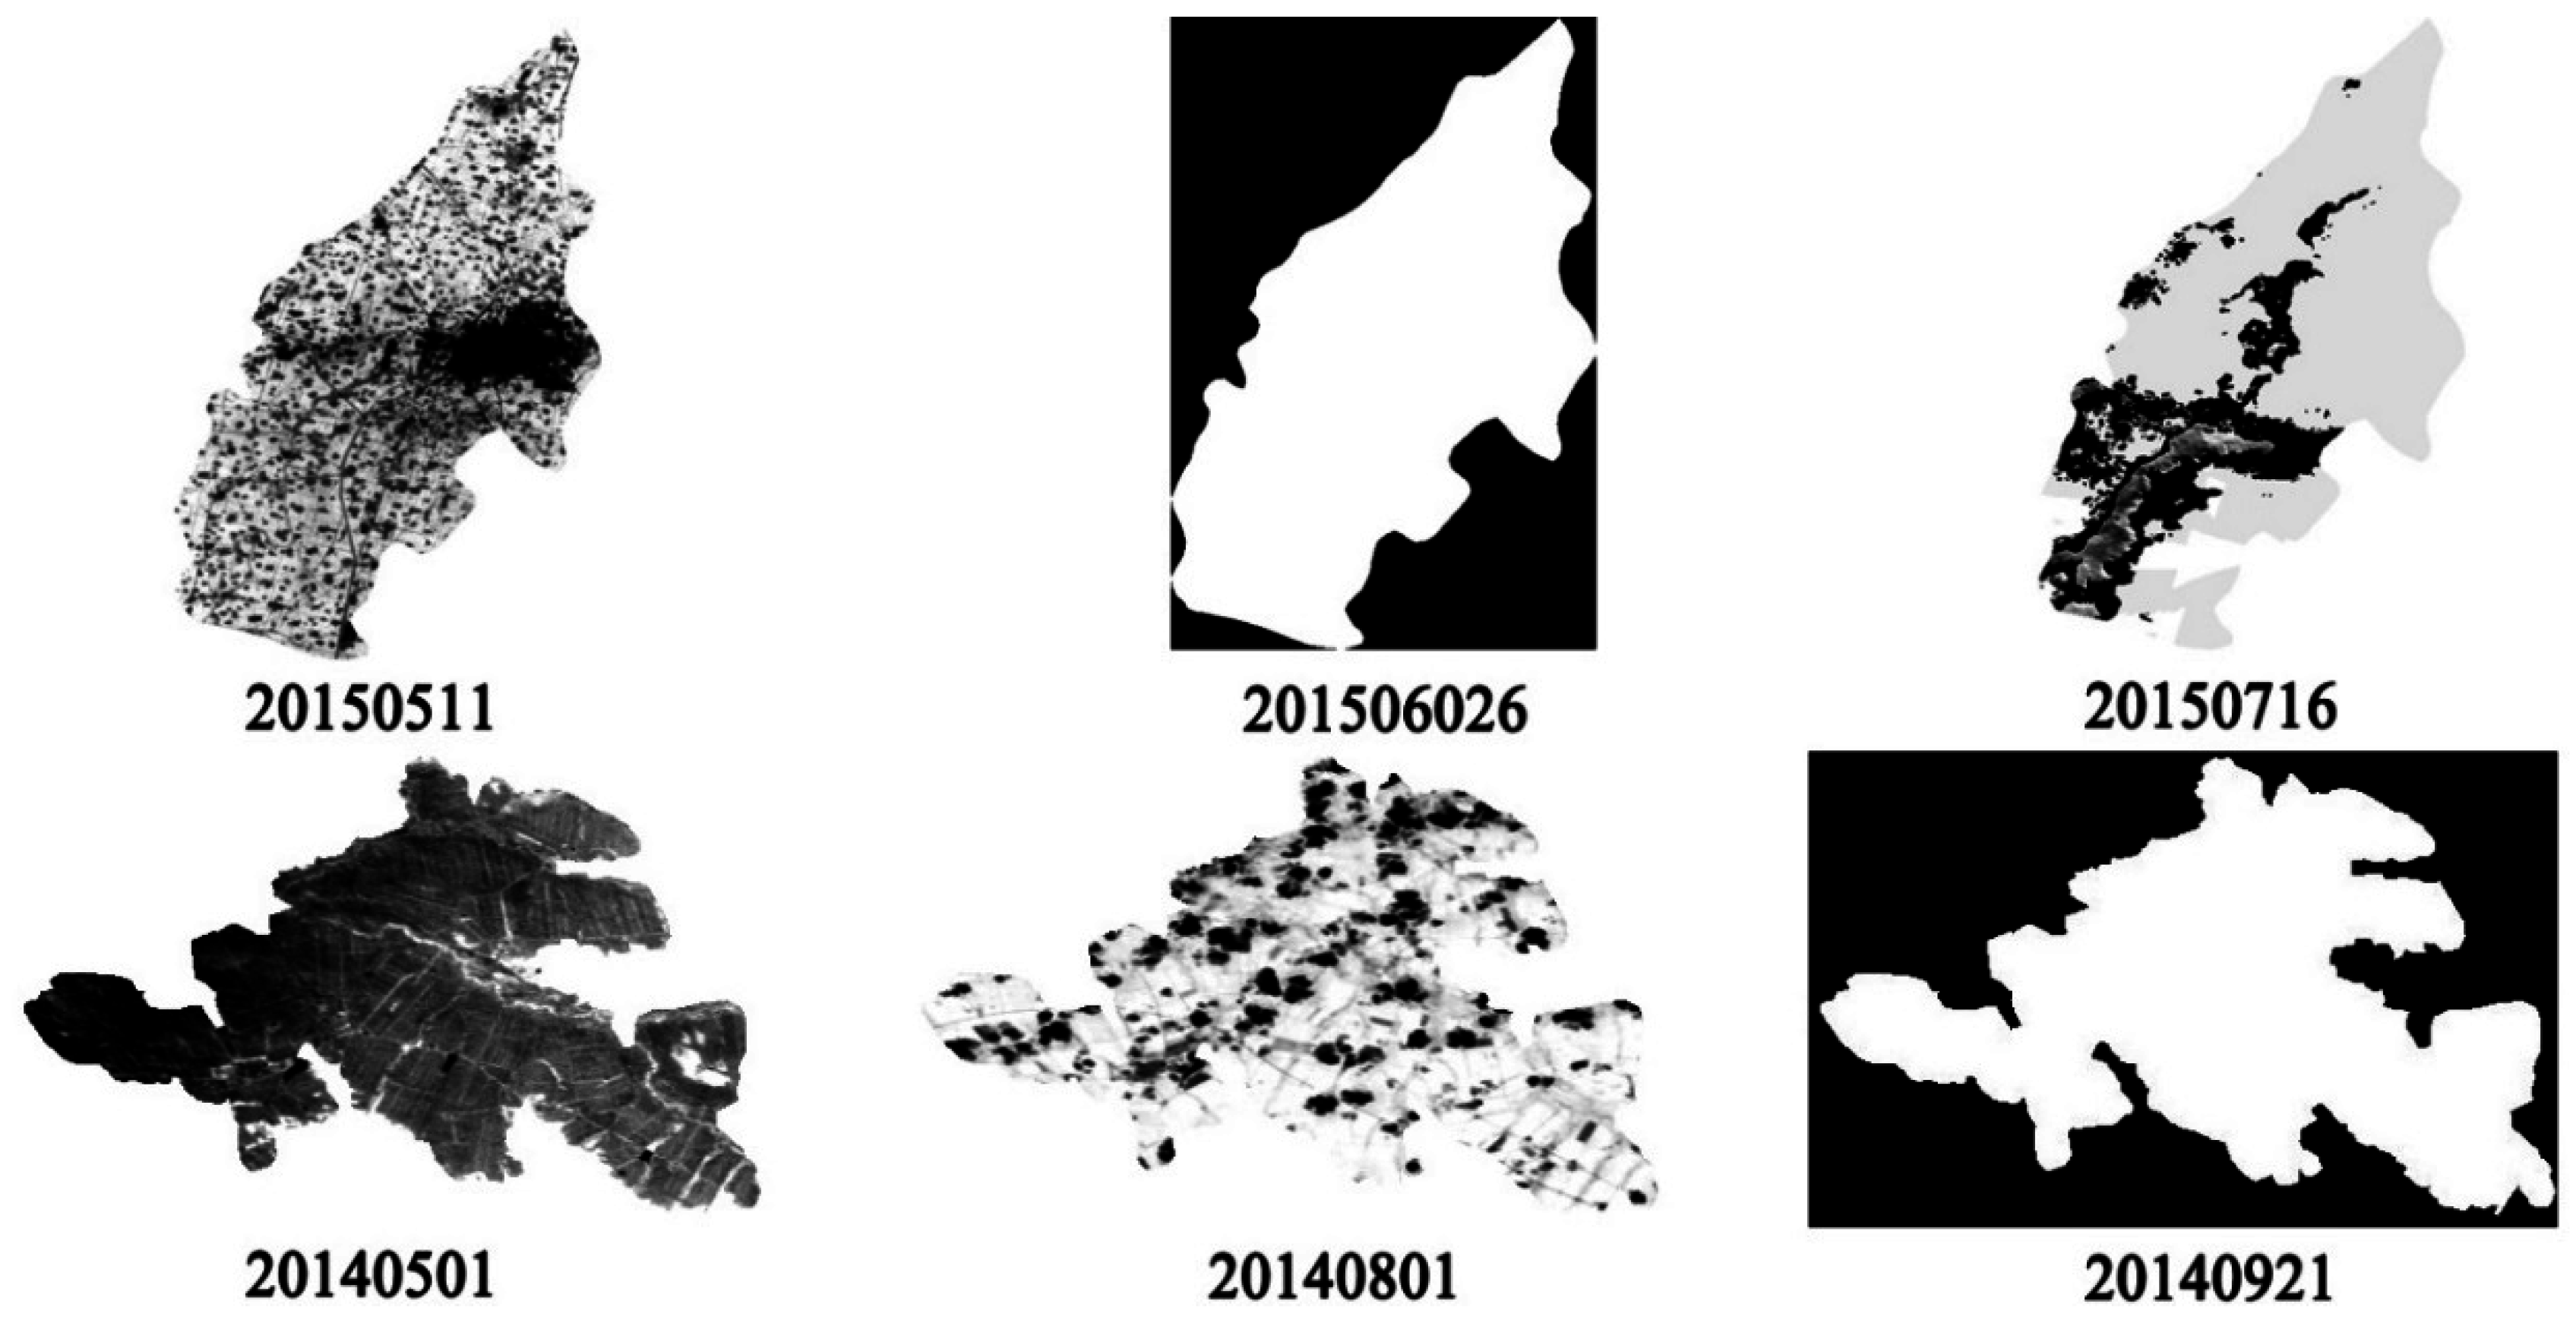
2.2. Satellite Data
2.3. Validation Data
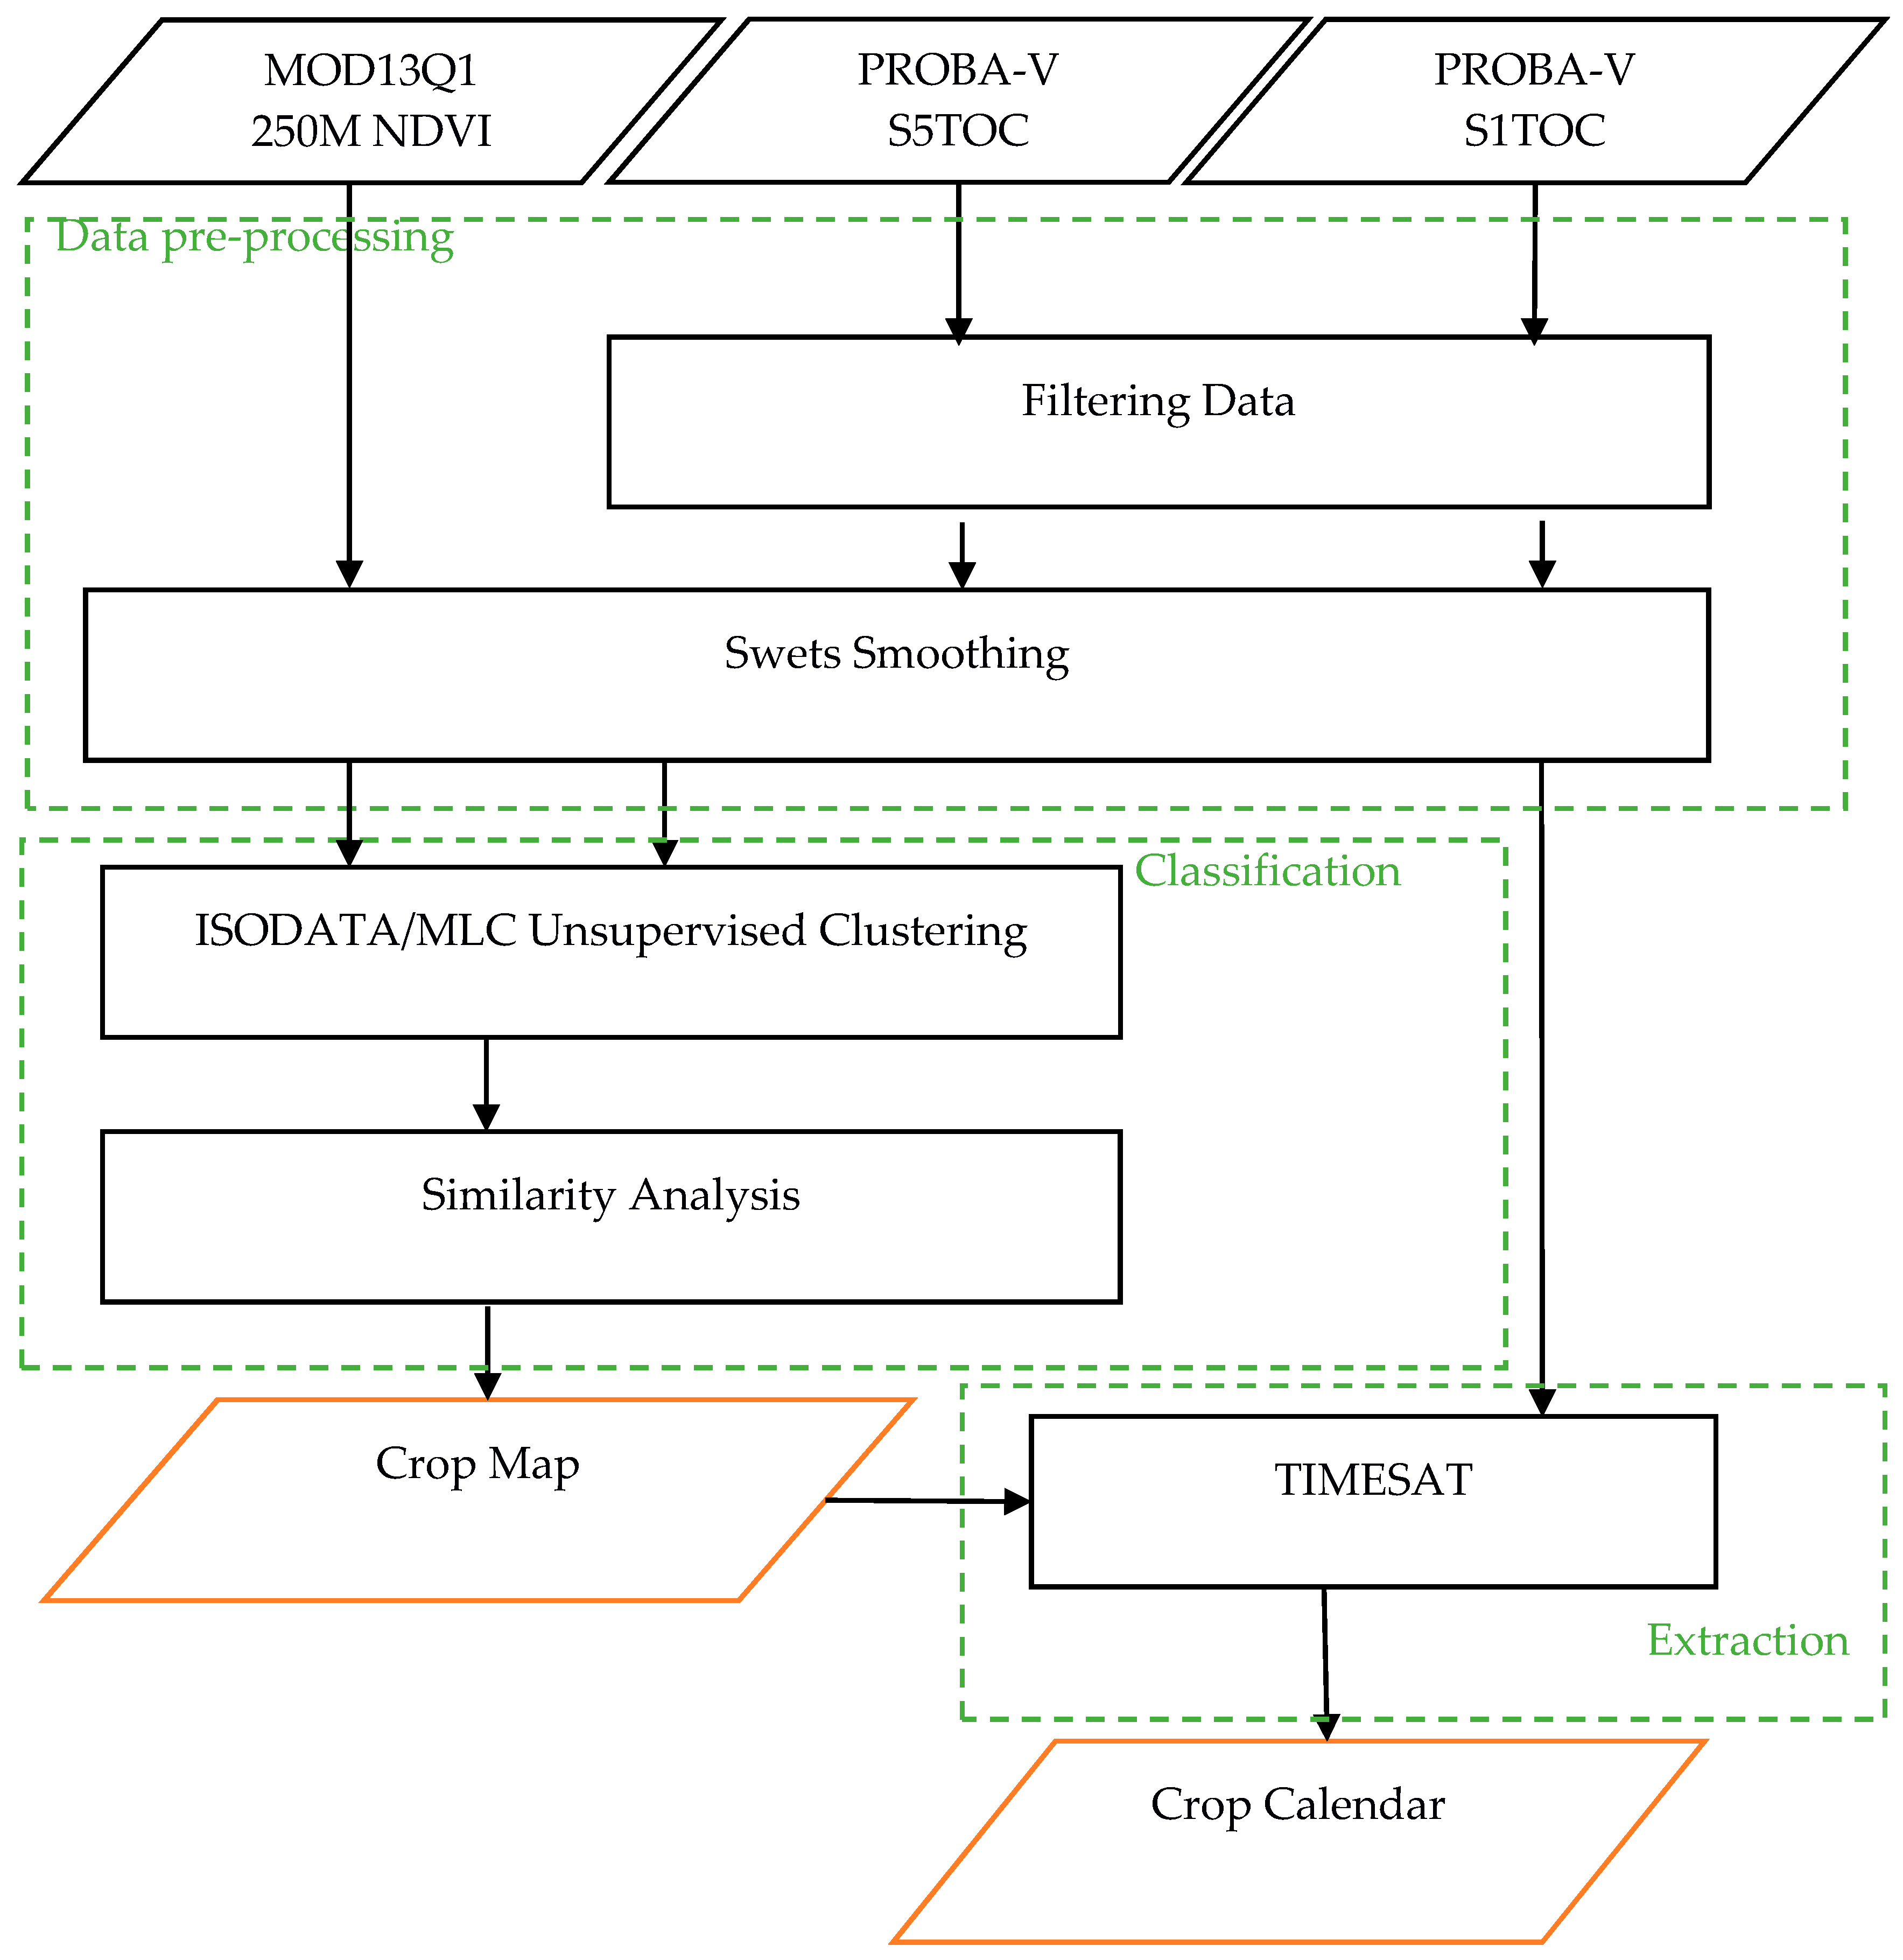
3. Methods
3.1. Data Pre-Processing
3.1.1. Filtering Data
3.1.2. Smoothing
3.2. Classification
3.3. Extraction of Phenological Parameters
4. Results
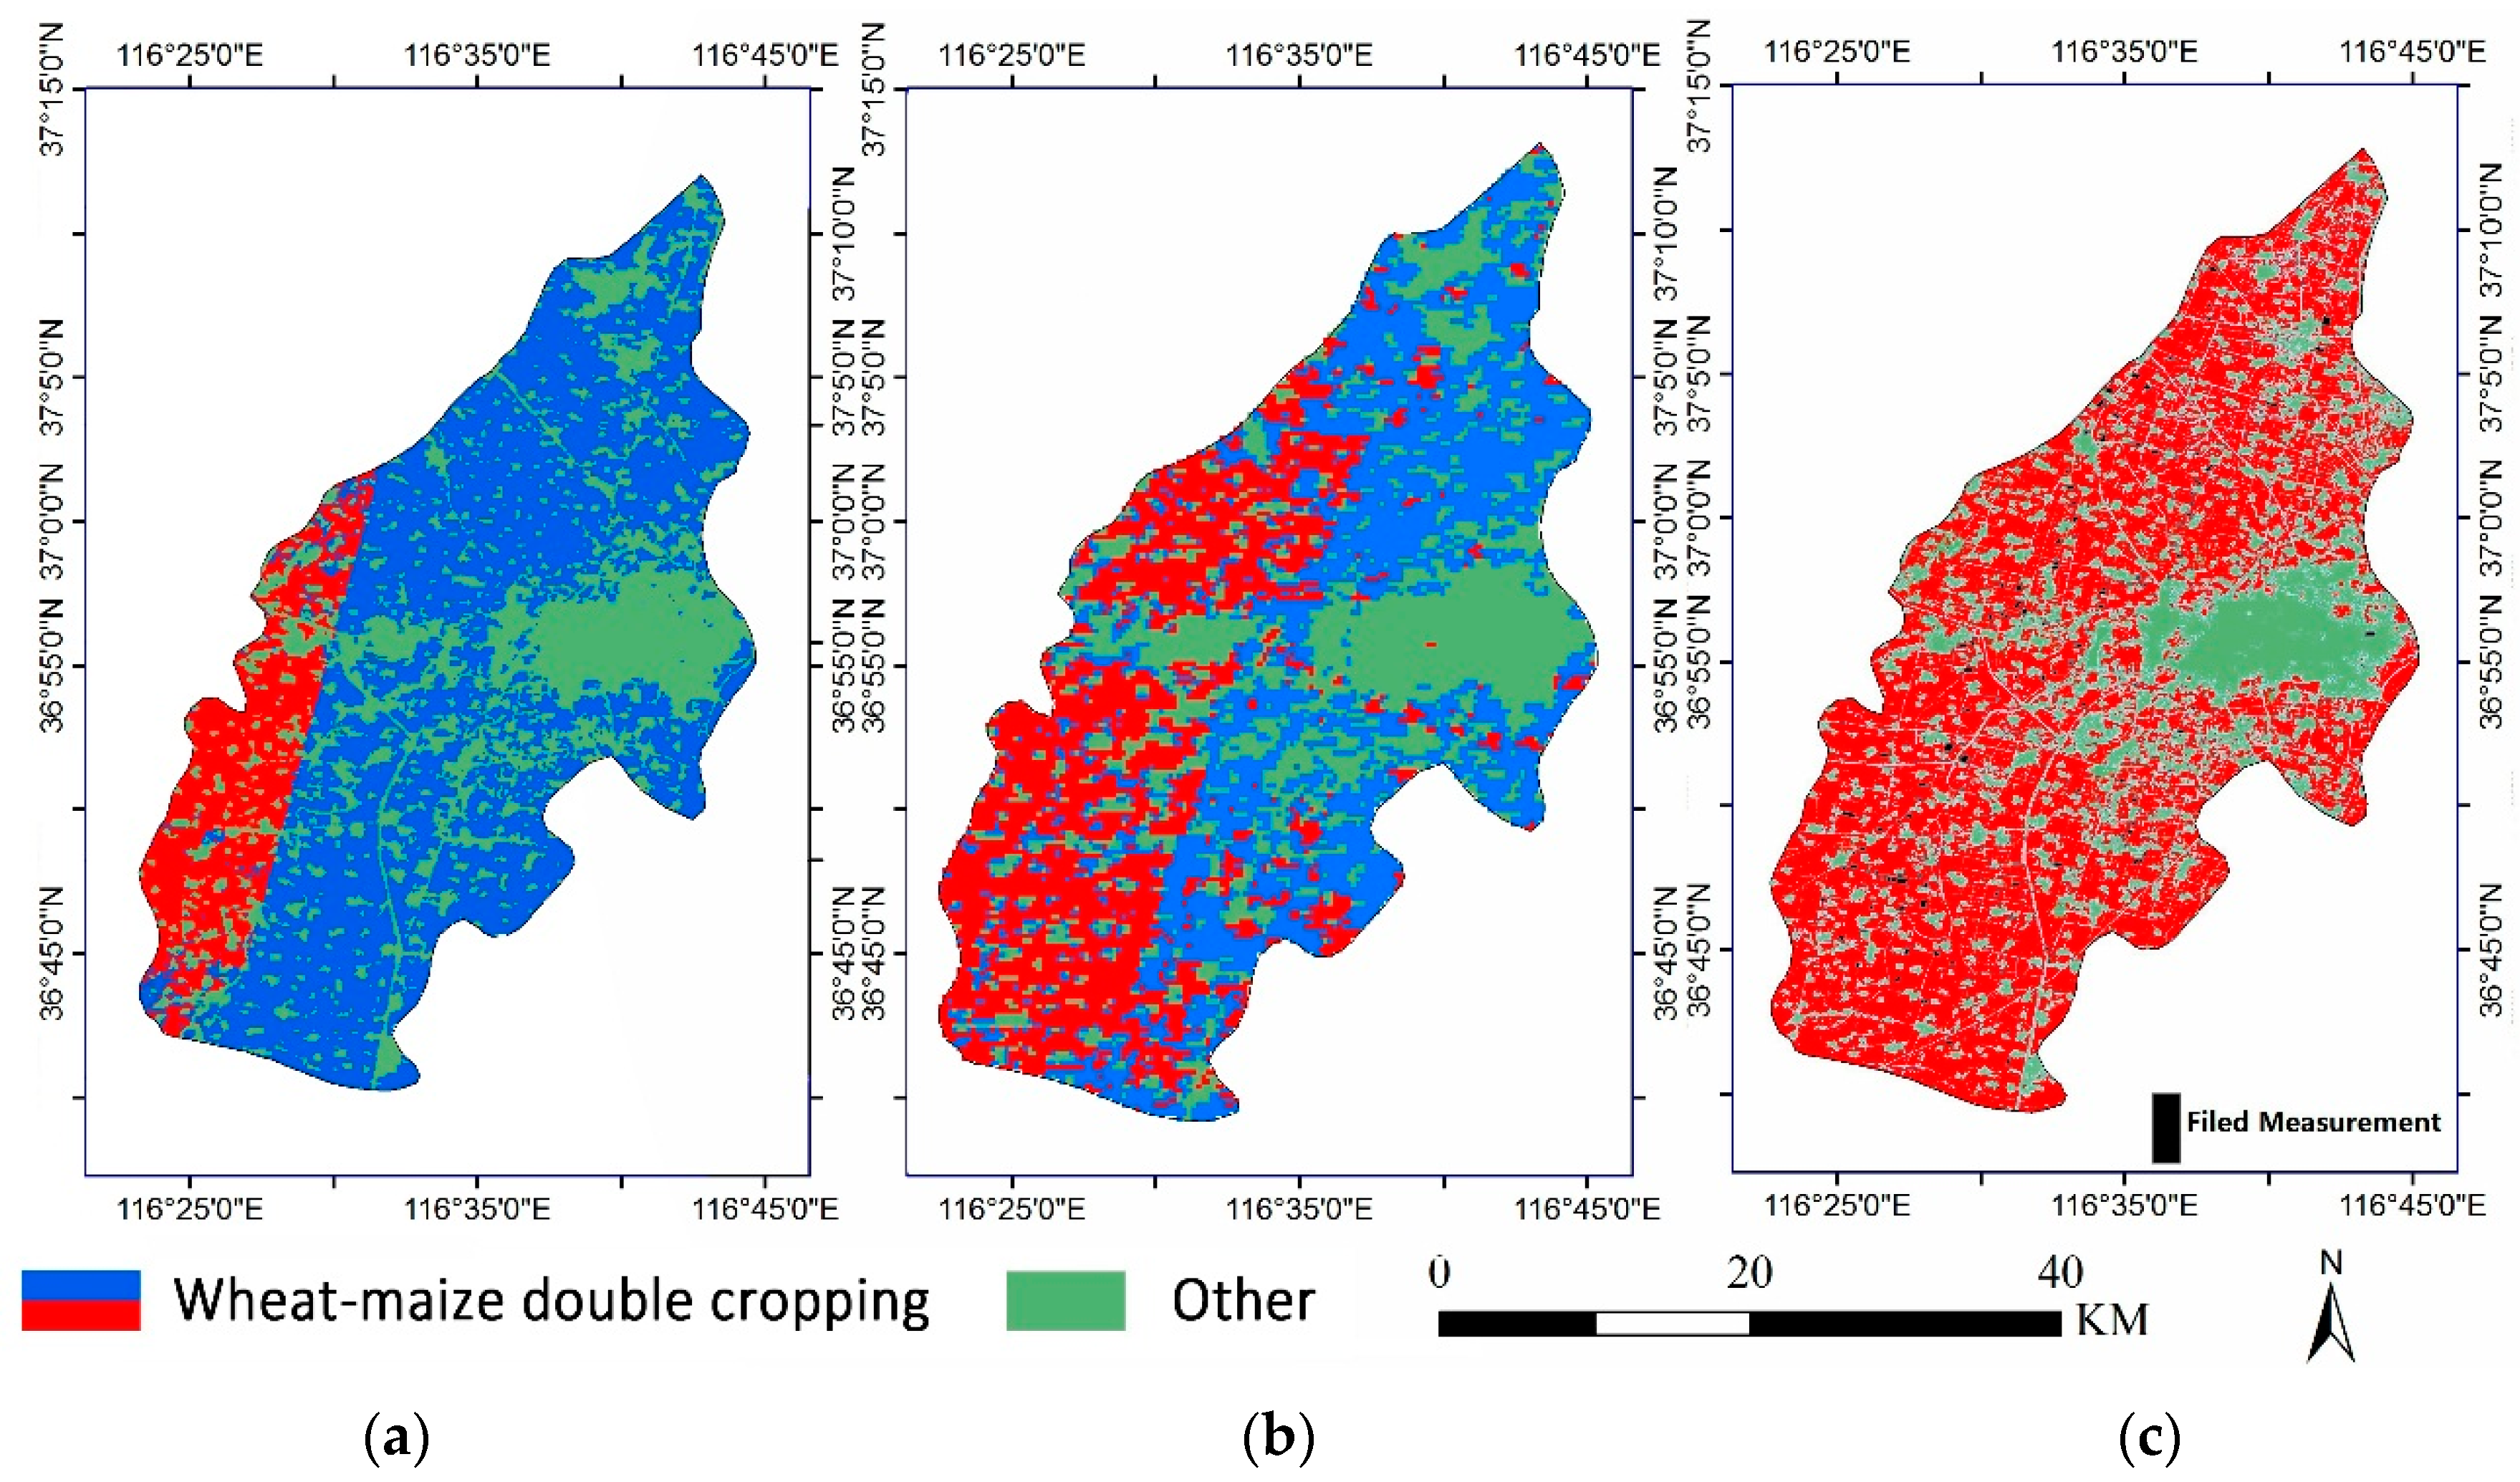
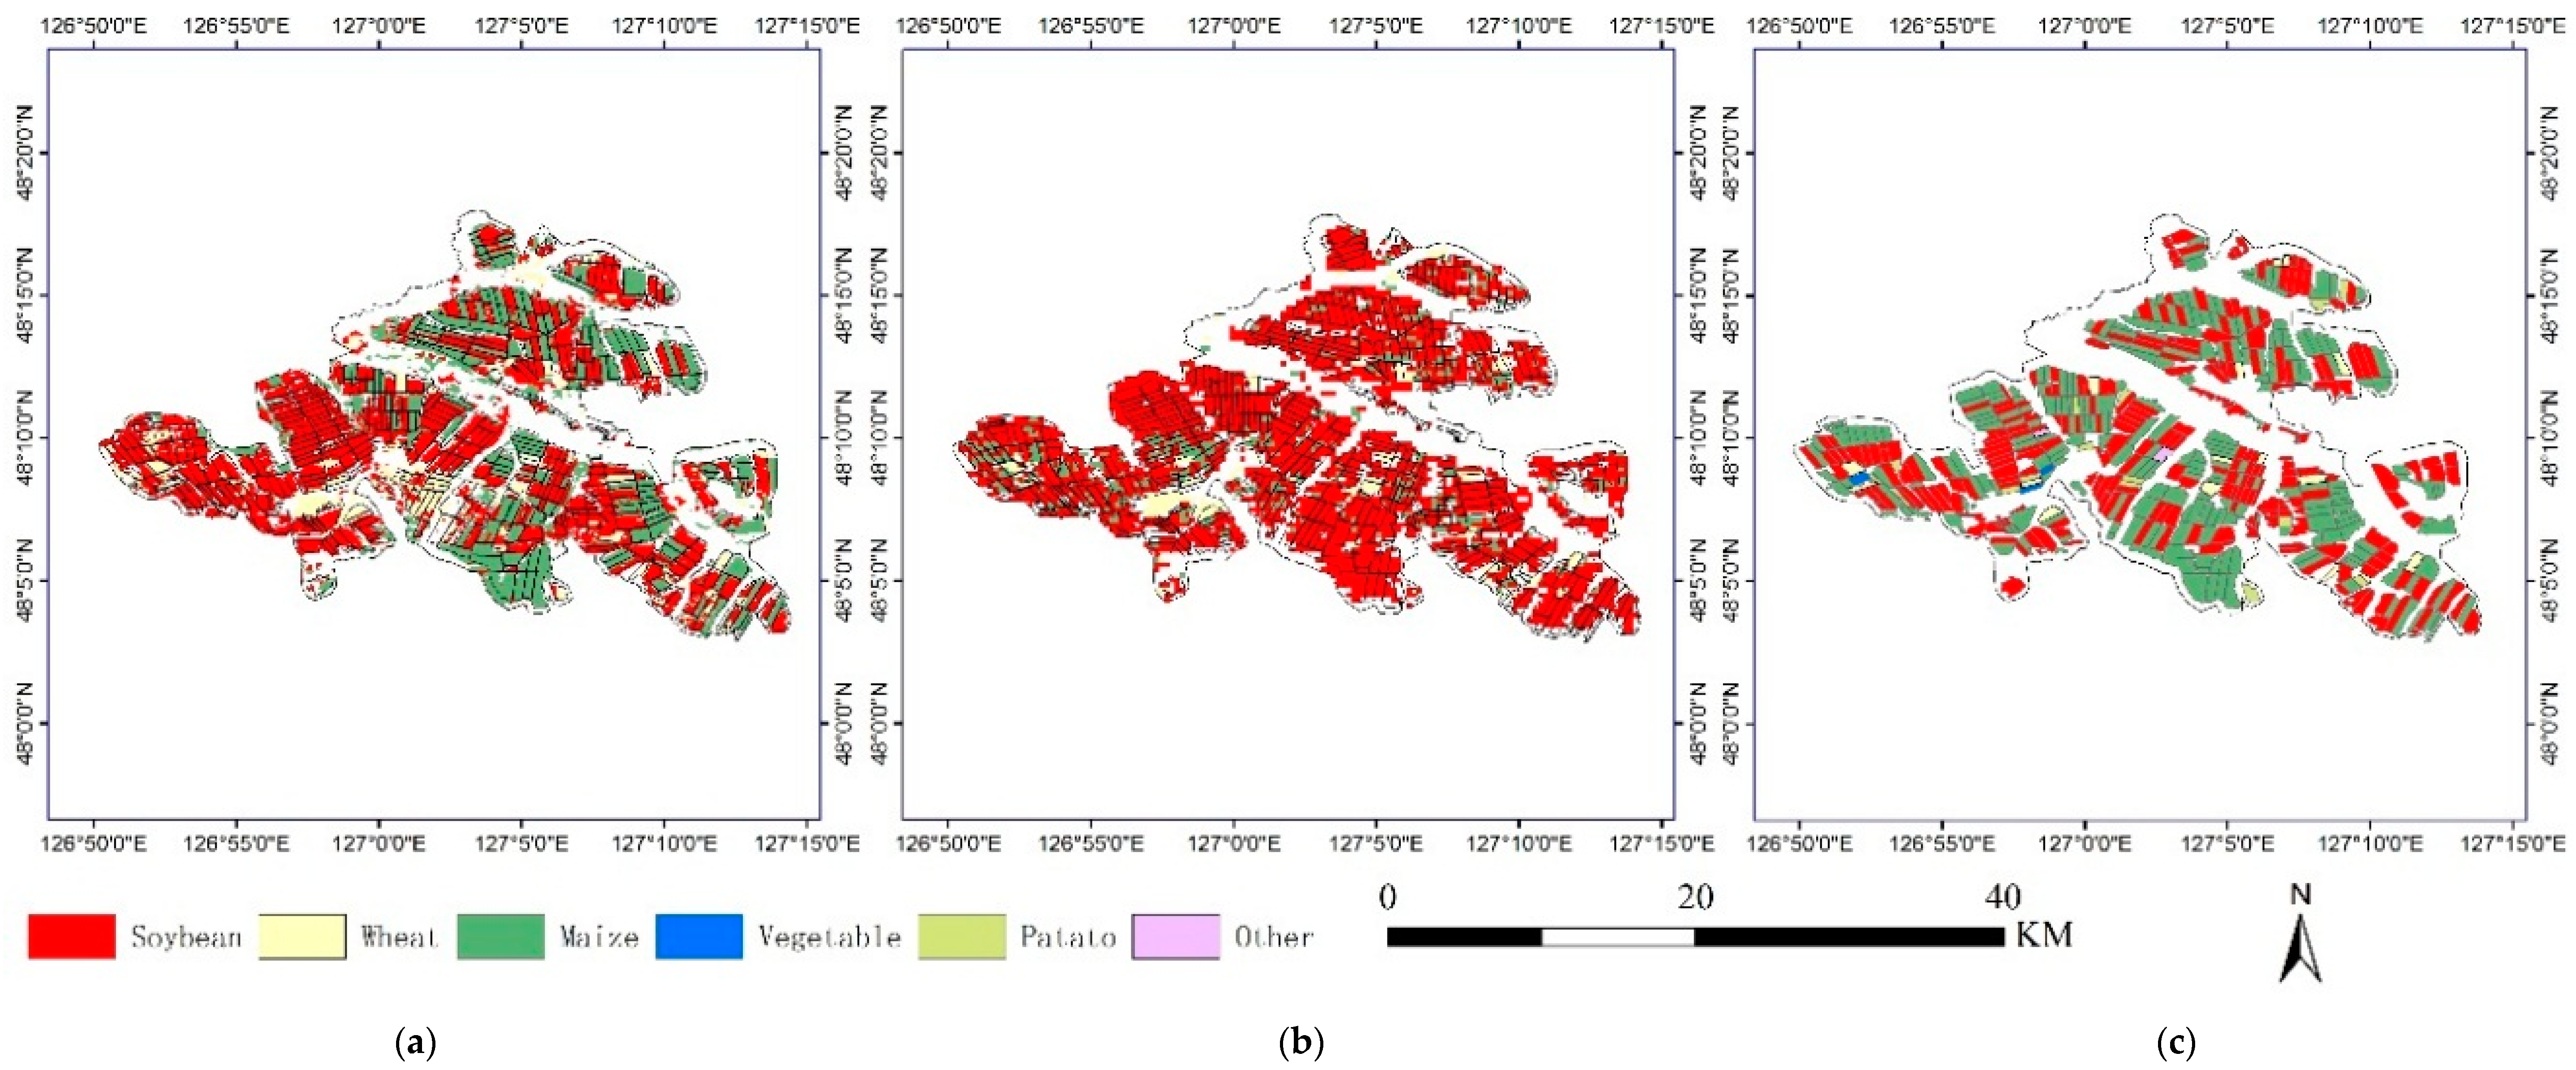
4.1. Crop Mapping
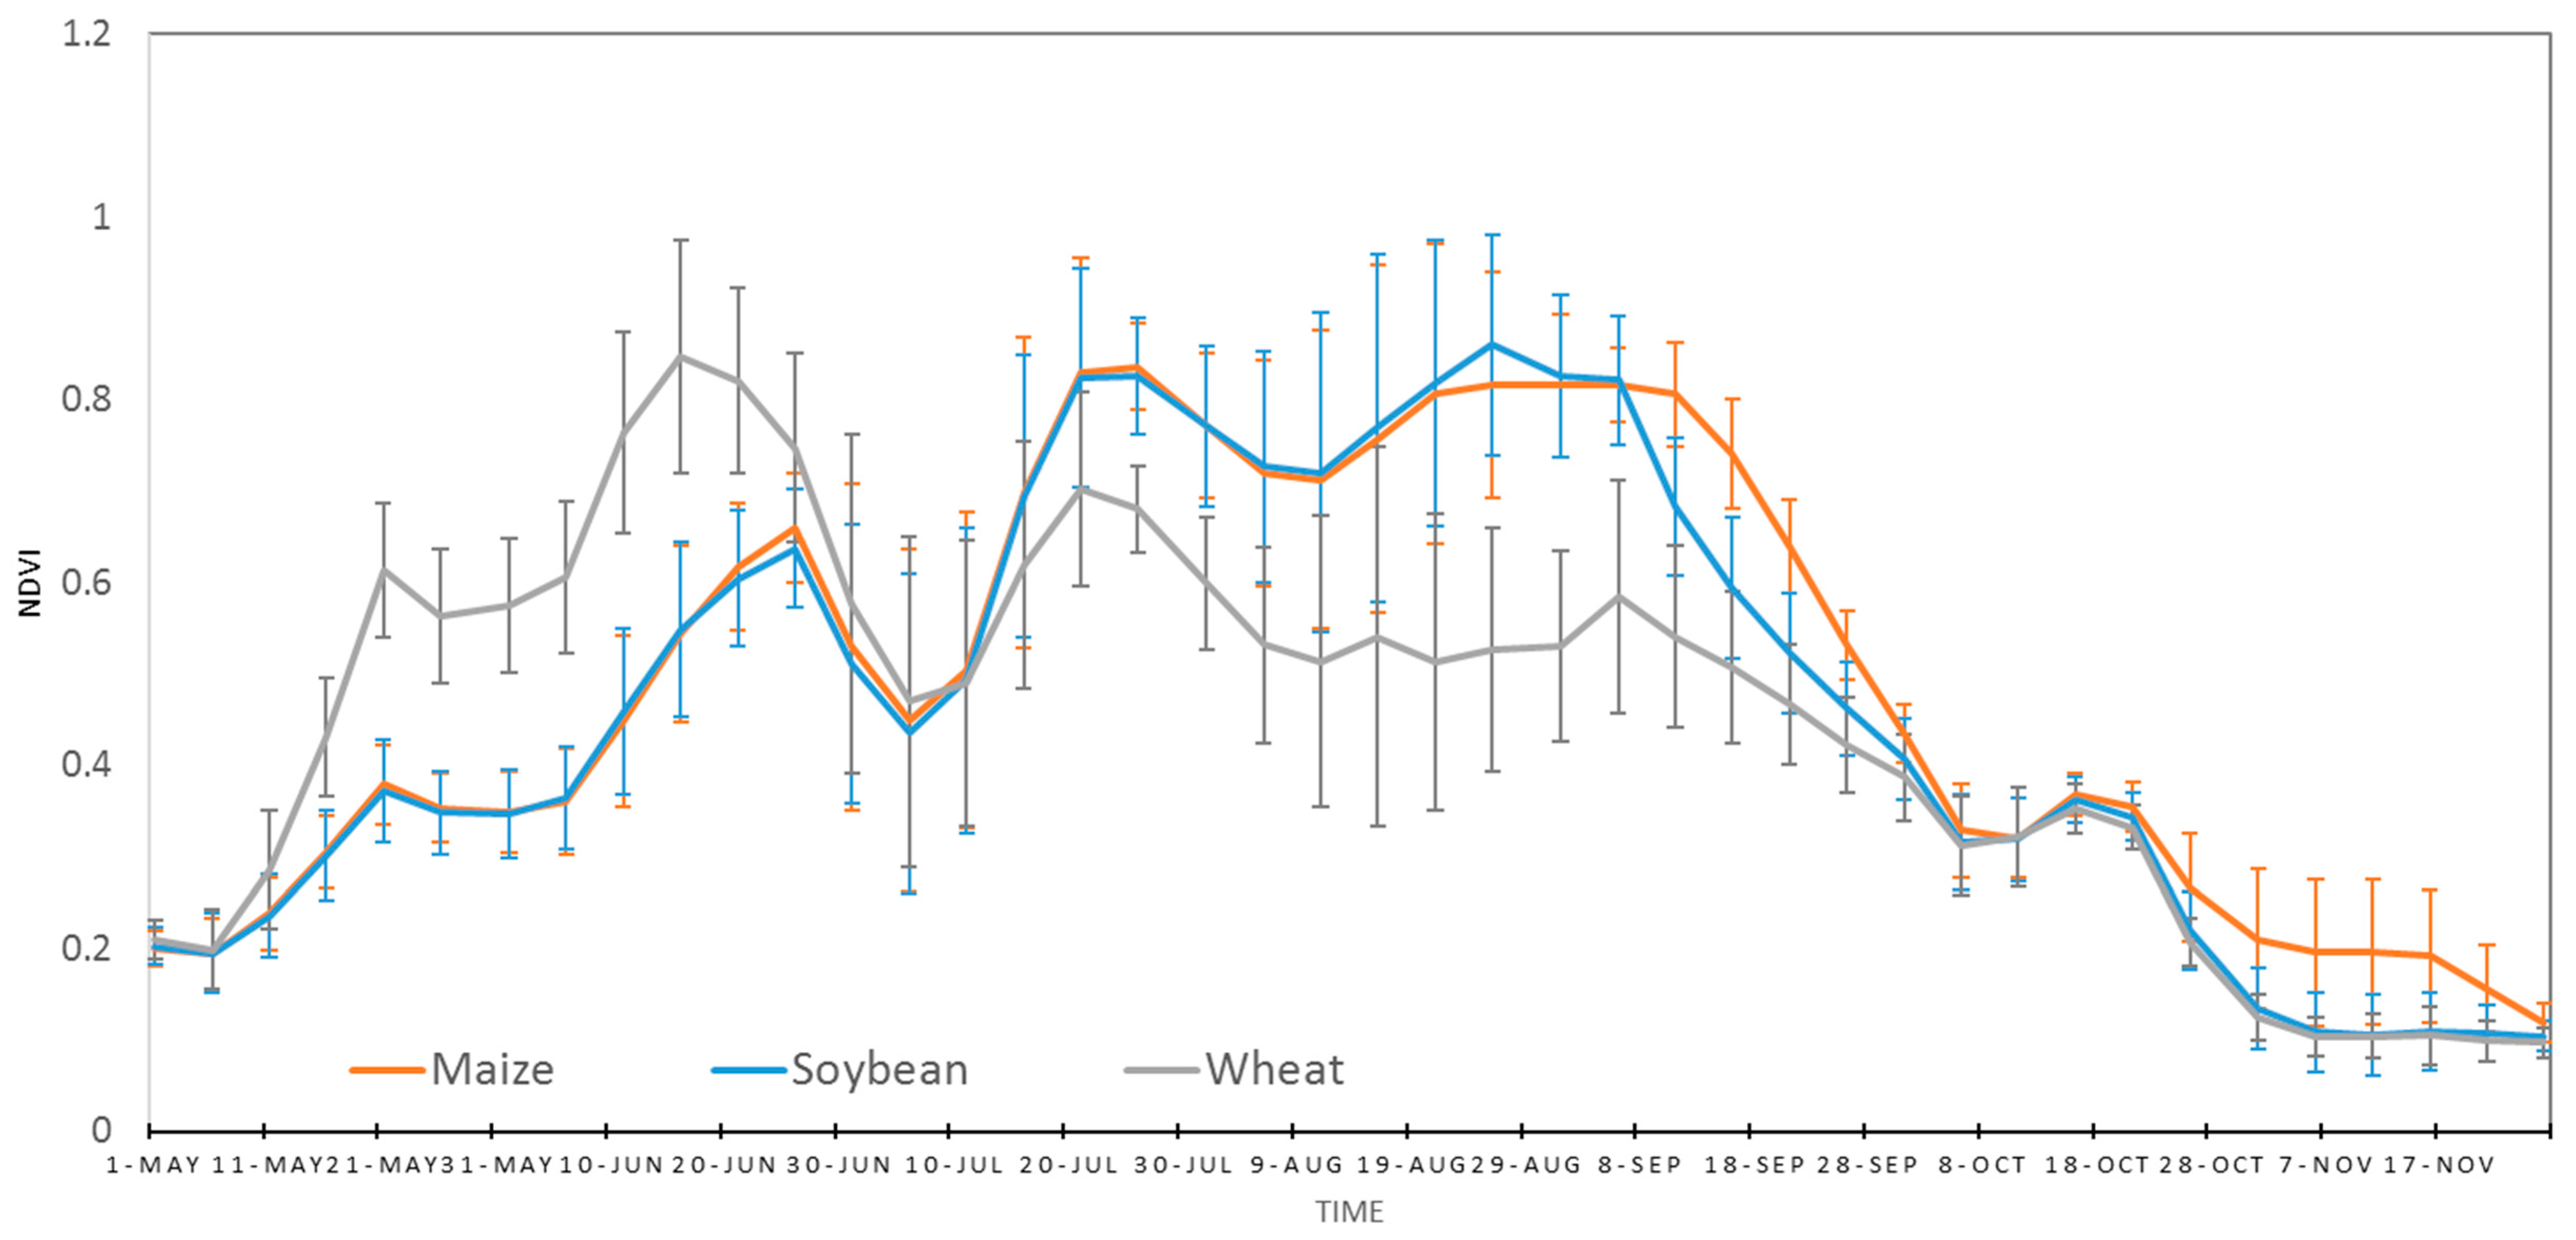
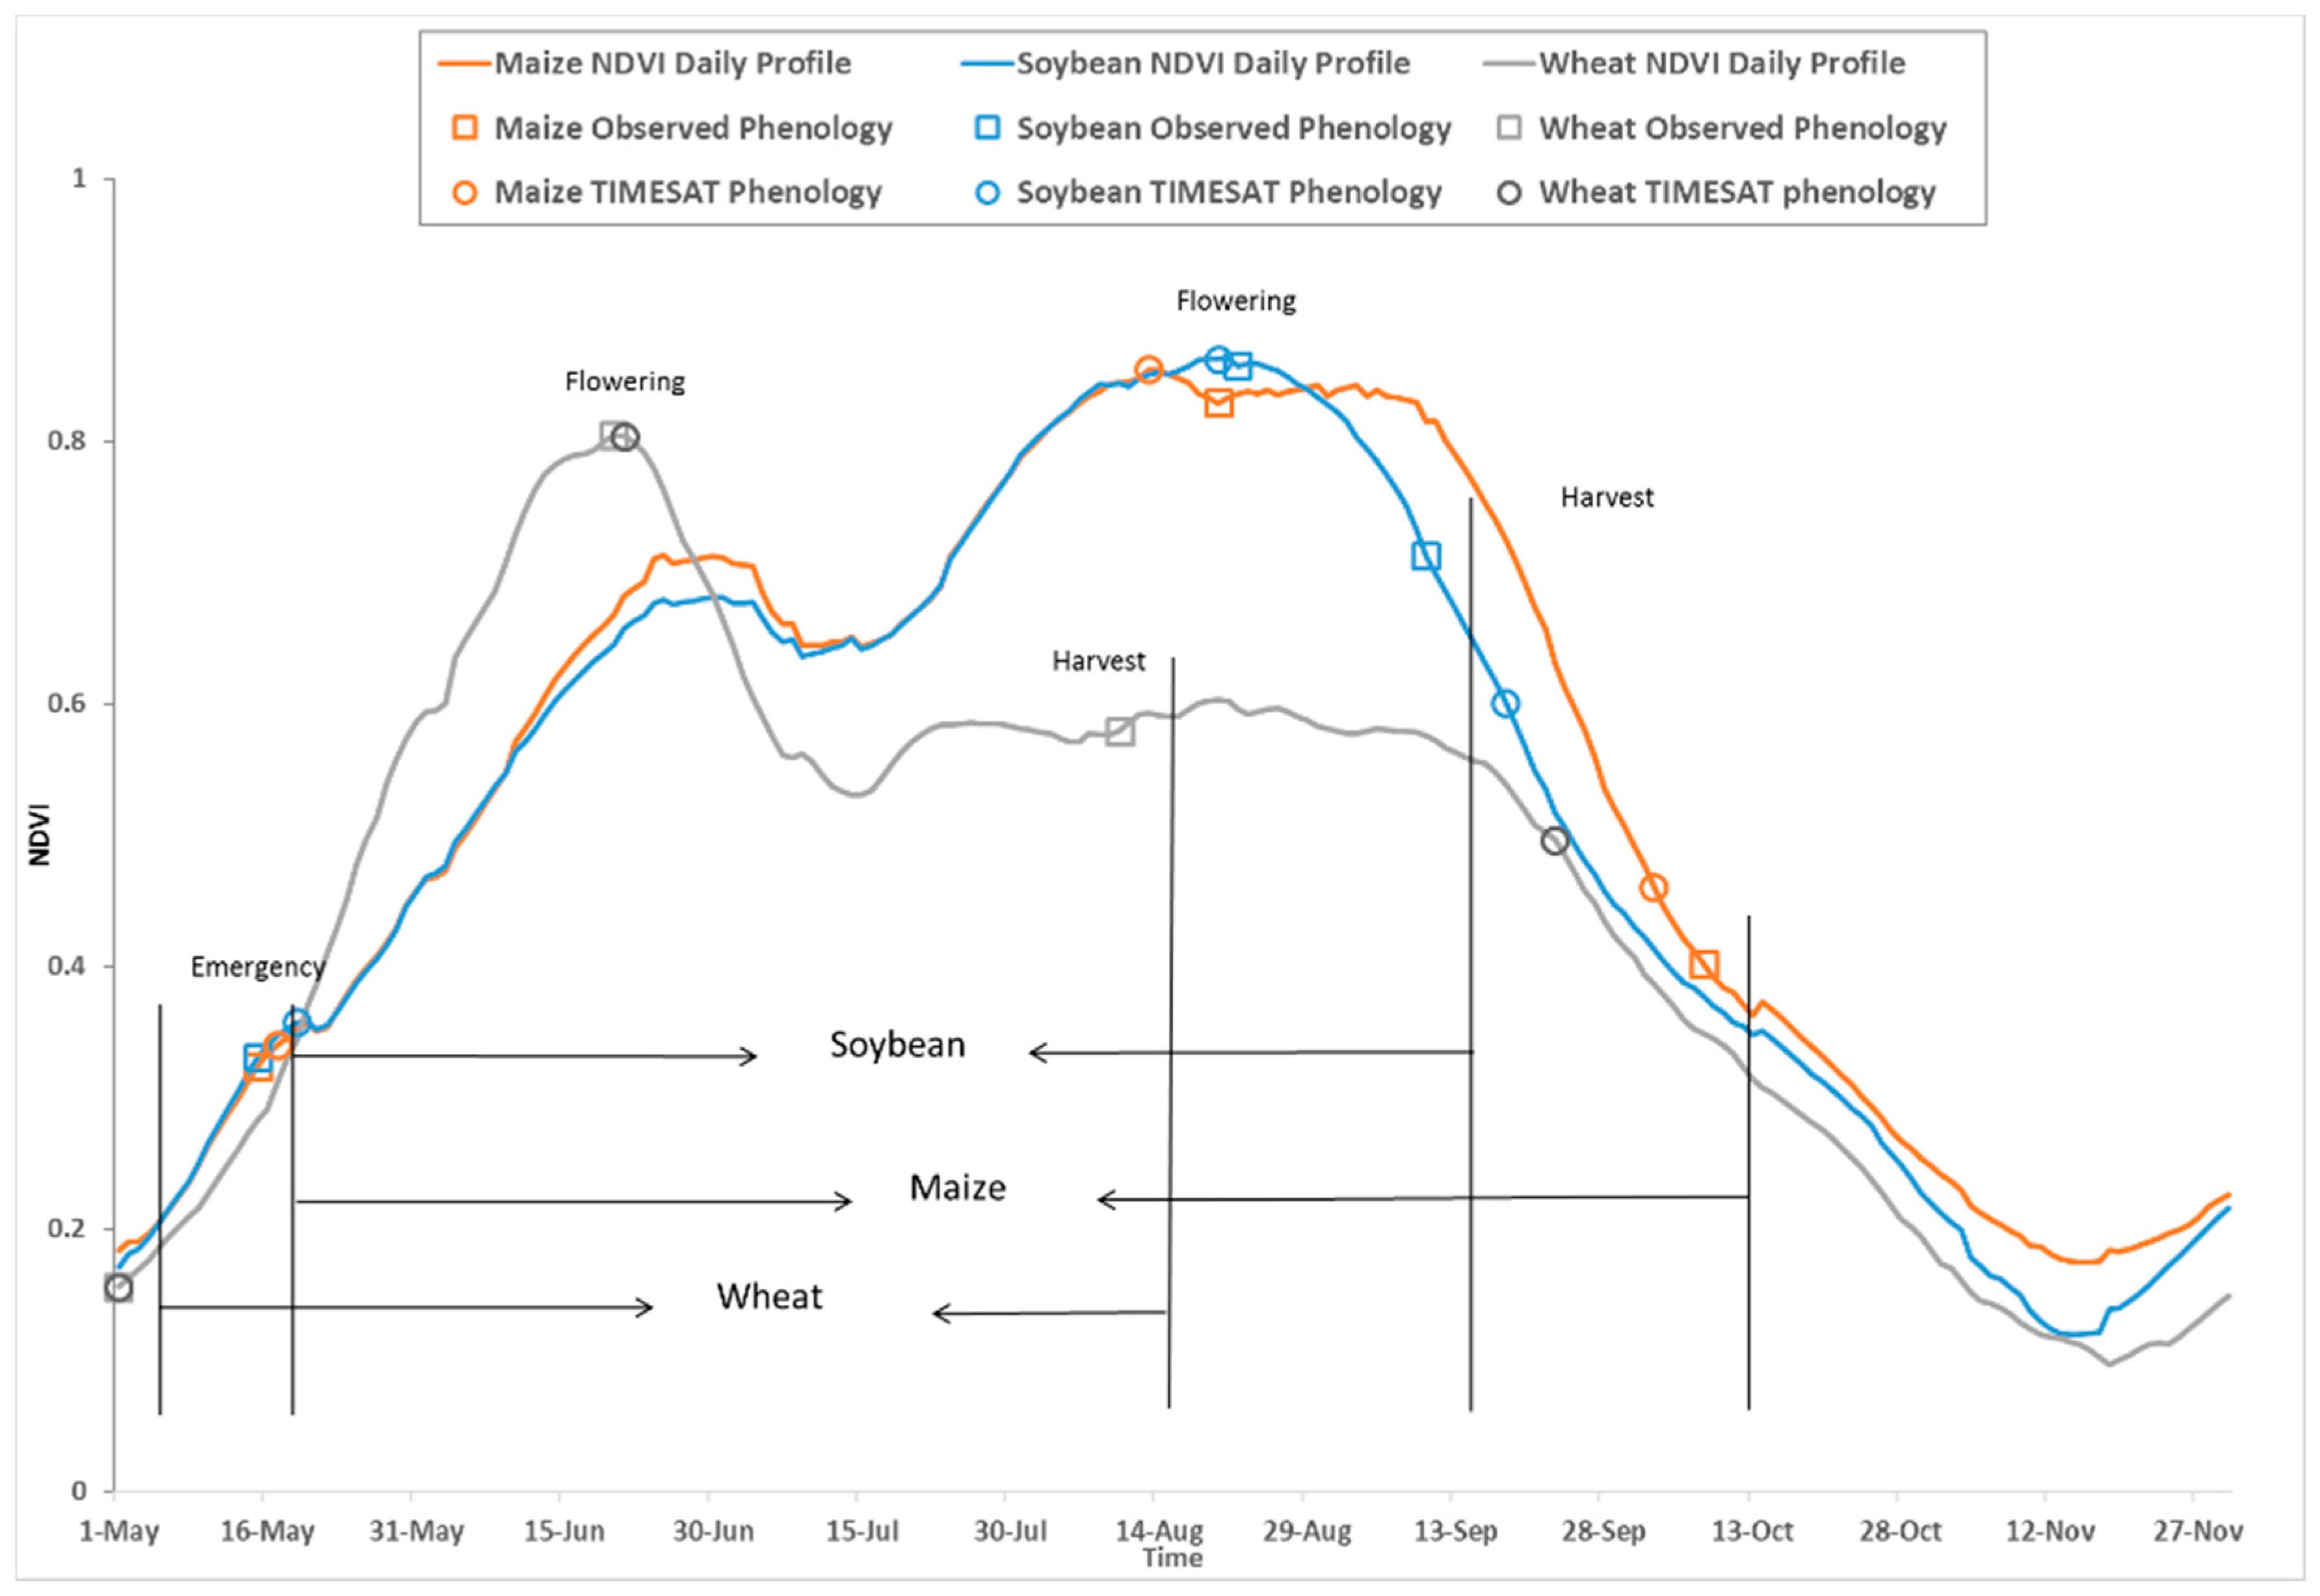
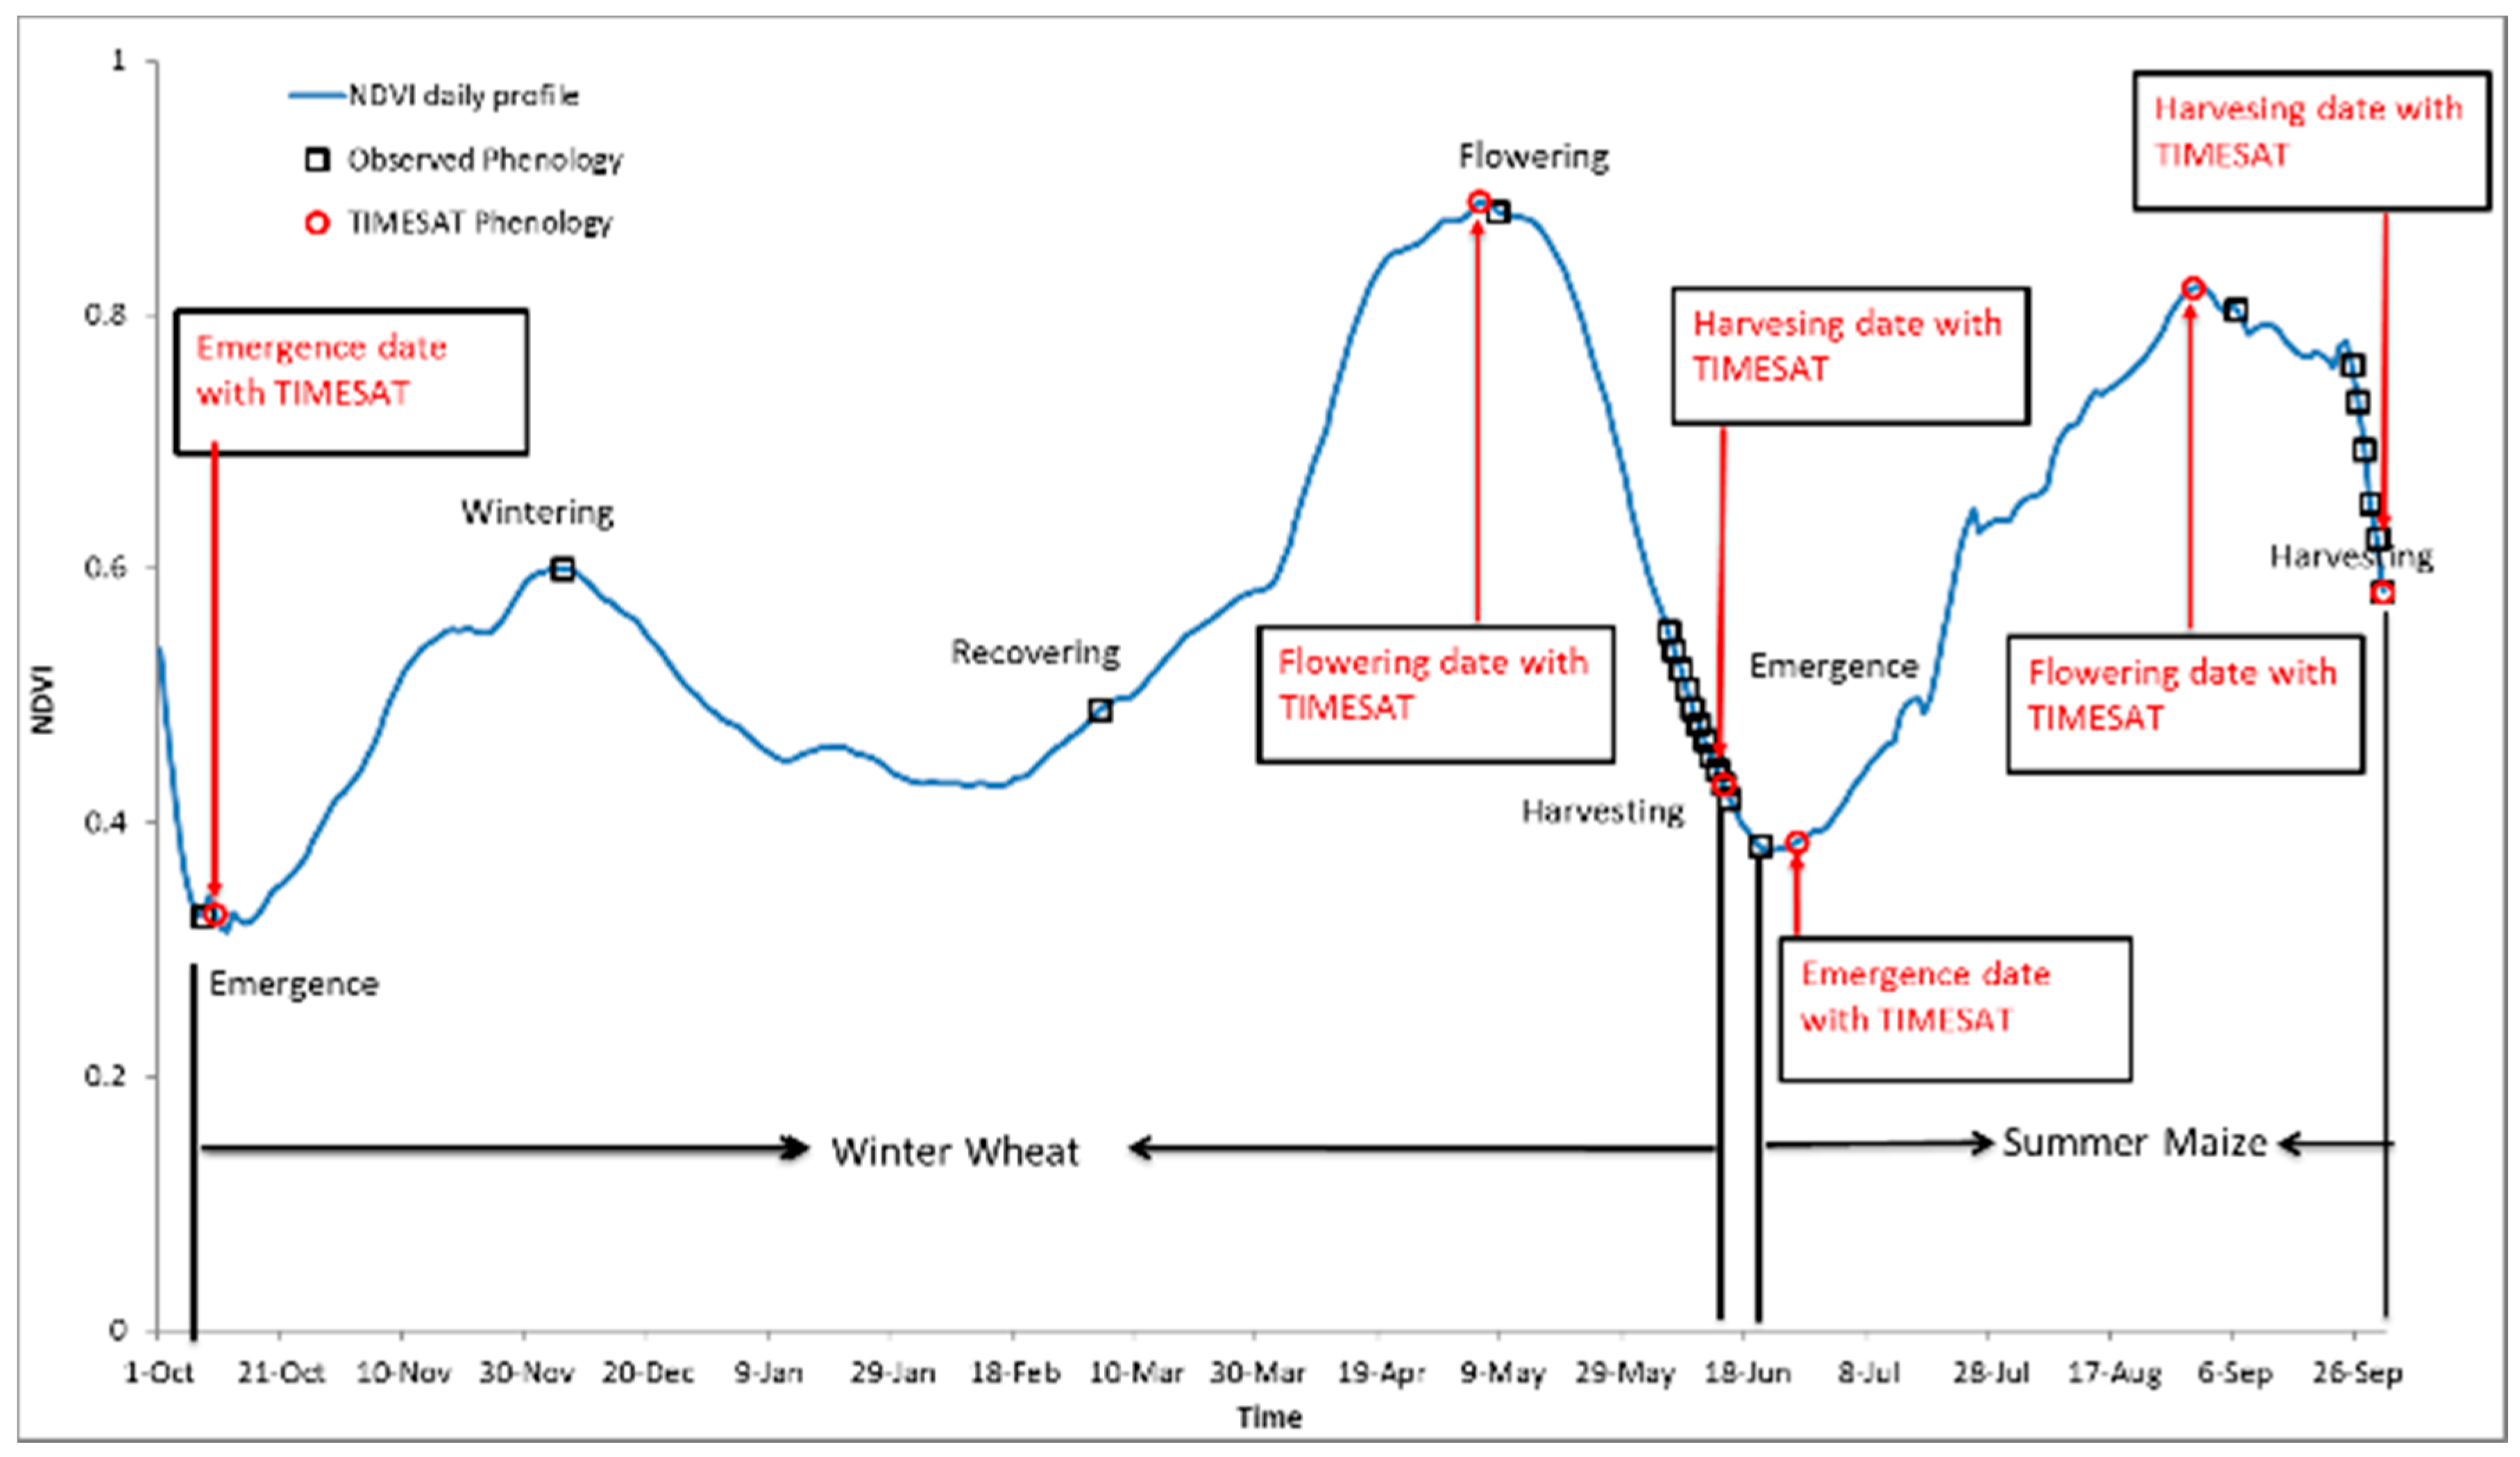
4.2. Crop Phenology
5. Discussion
6. Conclusions
Acknowledgments
Author Contributions
Conflicts of Interest
References
- Chen, Z.; Li, S.; Ren, J.; Gong, P.; Zhang, M.; Wang, L.; Xiao, S.; Jiang, D. Monitoring and management of agriculture with remote sensing. In Advances in Land Remote Sensing; Springer: Dordrecht, The Netherlands, 2008; pp. 397–421. [Google Scholar]
- Macdonald, R.B.; Hall, F.G. Global crop forecasting. Science 1980, 208, 670–679. [Google Scholar] [CrossRef] [PubMed]
- Bolton, D.K.; Friedl, M.A. Forecasting crop yield using remotely sensed vegetation indices and crop phenology metrics. Agric. For. Meteorol. 2013, 173, 74–84. [Google Scholar] [CrossRef]
- Delécolle, R.; Maas, S.J.; Guérif, M.; Baret, F. Remote sensing and crop production models: Present trends. ISPRS. J. Photogramm. Remote Sens. 1992, 47, 145–161. [Google Scholar] [CrossRef]
- Vieira, M.A.; Formaggio, A.R.; Rennó, C.D.; Atzberger, C.; Aguiar, D.A.; Mello, M.P. Object based image analysis and data mining applied to a remotely sensed Landsat time-series to map sugarcane over large areas. Remote Sens. Environ. 2012, 123, 553–562. [Google Scholar] [CrossRef]
- Atzberger, C. Advances in remote sensing of agriculture: Context description, existing operational monitoring systems and major information needs. Remote Sens. 2013, 5, 949–981. [Google Scholar] [CrossRef]
- Atzberger, C. Correction: Atzberger, C. Advances in remote sensing of agriculture: context description, existing operational monitoring systems and major information needs. Remote Sens. 2013, 5, 949–981. Remote Sens. 2013, 5, 4124. [Google Scholar] [CrossRef]
- Wardlow, B.D.; Egbert, S.L. Large-area crop mapping using time-series MODIS 250m NDVI data: An assessment for the U.S. Central Great Plains. Remote Sens. Environ. 2008, 112, 1096–1116. [Google Scholar] [CrossRef]
- De Wit, A.J.W.; Clevers, J.G.P.W. Efficiency and accuracy of per-field classification for operational crop mapping. Int. J. Remote Sens. 2004, 25, 4091–4112. [Google Scholar] [CrossRef]
- Reed, B.C.; Schwartz, M.D.; Xiao, X. Remote sensing phenology. In Phenology of Ecosystem Processes: Applications in Global Change Research; Springer: New York, NY, USA, 2003; pp. 365–381. [Google Scholar]
- Brown, M.E.; Beurs, K.M.D.; Marshall, M. Global phenological response to climate change in crop areas using satellite remote sensing of vegetation, humidity and temperature over 26 years. Remote Sens. Environ. 2012, 126, 174–183. [Google Scholar] [CrossRef]
- Huete, A.; Didan, K.; Miura, T.; Rodriguez, E.P.; Gao, X.; Ferreira, L.G. Overview of the radiometric and biophysical performance of the MODIS vegetation indices. Remote Sens. Environ. 2002, 83, 195–213. [Google Scholar] [CrossRef]
- Quarmby, N.A.; Milnes, M.; Hindle, T.L.; Silleos, N. Use of multi-temporal NDVI measurements from AVHRR data for crop yield estimation and prediction. Int. J. Remote Sens. 1993, 14, 199–210. [Google Scholar] [CrossRef]
- Groten, S.M.E. NDVI—Crop monitoring and early yield assessment of Burkina Faso. Int. J. Remote Sens. 1993, 14, 1495–1515. [Google Scholar] [CrossRef]
- Hansen, M.C.; Loveland, T.R. A review of large area monitoring of land cover change using Landsat data. Remote Sens. Environ. 2012, 122, 66–74. [Google Scholar] [CrossRef]
- Pax, M. The effect of spatial resolution on the ability to monitor the status of agricultural lands. Remote Sens. Environ. 1997, 61, 210–220. [Google Scholar]
- Mukashema, A.; Veldkamp, A.; Vrieling, A. Automated high resolution mapping of coffee in Rwanda using an expert Bayesian network. Int. J. Appl. Earth Obs. Geoinf. 2014, 33, 331–340. [Google Scholar] [CrossRef]
- Duveiller, G.; Defourny, P. A conceptual framework to define the spatial resolution requirements for agricultural monitoring using remote sensing. Remote Sens. Environ. 2010, 114, 2637–2650. [Google Scholar] [CrossRef]
- Galford, G.L.; Mustard, J.F.; Melillo, J.; Gendrin, A.; Cerri, C.C.; Cerri, C.E.P. Wavelet analysis of MODIS time series to detect expansion and intensification of row-crop agriculture in Brazil. Remote Sens. Environ. 2008, 112, 576–587. [Google Scholar] [CrossRef]
- Vrieling, A.; Beurs, K.M.D.; Brown, M.E. Variability of African farming systems from phenological analysis of NDVI time series. Clim. Chang. 2011, 109, 455–477. [Google Scholar] [CrossRef]
- Sakamoto, T.; Wardlow, B.D.; Gitelson, A.A.; Verma, S.B.; Suyker, A.E.; Arkebauer, T.J. A two-step filtering approach for detecting maize and soybean phenology with time-series MODIS data. Remote Sens. Environ. 2010, 114, 2146–2159. [Google Scholar] [CrossRef]
- Zhang, X.; Friedl, M.A.; Schaaf, C.B.; Strahler, A.H.; Hodges, J.C.F.; Gao, F.; Reed, B.C.; Huete, A. Monitoring vegetation phenology using MODIS. Remote Sens. Environ. 2003, 84, 471–475. [Google Scholar] [CrossRef]
- Atzberger, C.; Eilers, P.H.C. A time series for monitoring vegetation activity and phenology at 10-daily time steps covering large parts of South America. Int. J. Digit. Earth 2011, 4, 365–386. [Google Scholar] [CrossRef]
- Kastens, J.H.; Kastens, T.L.; Kastens, D.L.A.; Price, K.P.; Martinko, E.A.; Lee, R.Y. Image masking for crop yield forecasting using AVHRR NDVI time series imagery. Remote Sens. Environ. 2005, 99, 341–356. [Google Scholar] [CrossRef]
- Pan, Y.; Li, L.; Zhang, J.; Liang, S.; Zhu, X.; Sulla-Menashe, D. Winter wheat area estimation from MODIS-EVI time series data using the Crop Proportion Phenology Index. Remote Sens. Environ. 2012, 119, 232–242. [Google Scholar] [CrossRef]
- Pan, Z.; Huang, J.; Zhou, Q.; Wang, L.; Cheng, Y.; Zhang, H.; Blackburn, G.A.; Yan, J.; Liu, J. Mapping crop phenology using NDVI time-series derived from HJ-1 A/B data. Int. J. Appl. Earth Obs. Geoinf. 2015, 34, 188–197. [Google Scholar] [CrossRef]
- Zheng, B.; Myint, S.W.; Thenkabail, P.S.; Aggarwal, R.M. A support vector machine to identify irrigated crop types using time-series Landsat NDVI data. Int. J. Appl. Earth Obs. Geoinf. 2015, 34, 103–112. [Google Scholar] [CrossRef]
- Jinwei, D.; Xiangming, X.; Michael, A.M.; Geli, Z.; Yuanwei, Q.; David, T.; Chandrashekhar, B.; Berrien, M. Mapping paddy rice planting area in northeastern Asia with Landsat 8 images, phenology-based algorithm and Google Earth Engine. Remote Sens. Environ. 2016, 185, 142–154. [Google Scholar]
- Breon, F.M.; Vermote, E. Correction of MODIS surface reflectance time series for BRDF effects. Remote Sens. Environ. 2012, 125, 1–9. [Google Scholar] [CrossRef]
- Chen, J.; Jönsson, P.; Tamura, M.; Gu, Z.; Matsushita, B.; Eklundh, L. A simple method for reconstructing a high-quality NDVI time-series data set based on the Savitzky–Golay filter. Remote Sens. Environ. 2004, 91, 332–344. [Google Scholar] [CrossRef]
- Savitzky, A.; Golay, M.J.E. Smoothing and differentiation of data by simplified least squares procedures. Anal. Chem. 1964, 36, 1627–1639. [Google Scholar] [CrossRef]
- Viovy, N.; Arino, O.; Belward, A.S. The Best Index Slope Extraction (BISE): A method for reducing noise in NDVI time-series. Int. J. Remote Sens. 1992, 13, 1585–1590. [Google Scholar] [CrossRef]
- Michishita, R.; Jin, Z.; Chen, J.; Xu, B. Empirical comparison of noise reduction techniques for NDVI time-series based on a new measure. ISPRS J. Photogramm. Remote Sens. 2014, 91, 17–28. [Google Scholar] [CrossRef]
- Cracknell, A.P. The Advanced Very High Resolution Radiometer (AVHRR); CRC Press: BocaRaton, FL, USA, 1997; p. 526. [Google Scholar]
- Jakubauskas, M.E.; Legates, D.R.; Kastens, J.H. Crop identification using harmonic analysis of time-series AVHRR NDVI data. Comput. Electron. Agric. 2003, 37, 127–139. [Google Scholar] [CrossRef]
- Xiao, X.; Boles, S.; Liu, J.; Zhuang, D.; Frolking, S.; Li, C.; Salas, W.; Iii, B.M. Mapping paddy rice agriculture in southern China using multi-temporal MODIS images. Remote Sens. Environ. 2005, 95, 480–492. [Google Scholar] [CrossRef]
- Justice, C.O.; Vermote, E.; Townshend, J.R.G.; Defries, R.; Roy, D.P.; Hall, D.K.; Salomonson, V.V.; Privette, J.L.; Riggs, G.; Strahler, A. The Moderate Resolution Imaging Spectroradiometer (MODIS): Land remote sensing for global change research. IEEE Trans. Geosci. Remote Sens. 1998, 36, 1228–1249. [Google Scholar] [CrossRef]
- Lunetta, R.S.; Shao, Y. Monitoring agricultural cropping patterns across the Laurentian Great Lakes Basin using MODIS-NDVI data. Int. J. Appl. Earth Obs. Geoinf. 2010, 12, 81–88. [Google Scholar] [CrossRef]
- Atzberger, C.; Formaggio, A.R.; Shimabukuro, Y.E.; Udelhoven, T.; Mattiuzzi, M.; Sanchez, G.A.; Arai, E. Obtaining crop-specific time profiles of NDVI: The use of unmixing approaches for serving the continuity between SPOT-VGT and PROBA-V time series. Int. J. Remote Sens. 2014, 35, 2615–2638. [Google Scholar] [CrossRef]
- Maisongrande, P.; Duchemin, B.; Dedieu, G. VEGETATION/SPOT: An operational mission for the Earth monitoring; presentation of new standard products. Int. J. Remote Sens. 2004, 25, 9–14. [Google Scholar] [CrossRef]
- Estrella, N.; Sparks, T.H.; Menzel, A. Effects of temperature, phase type and timing, location, and human density on plant phenological responses in Europe. Clim. Res. 2009, 39, 235–248. [Google Scholar] [CrossRef]
- Bégué, A.; Arvor, D.; Lelong, C.; Vintrou, E.; Simões, M. Agricultural systems studies using remote sensing. In Remote Sensing Handbook, 2nd ed.; CRC Press: BocaRaton, FL, USA, 2015; pp. 113–128. [Google Scholar]
- Schroeder, T.A.; Wulder, M.A.; Healey, S.P.; Moisen, G.G. Mapping wildfire and clearcut harvest disturbances in boreal forests with Landsat time series data. Remote Sens. Environ. 2011, 115, 1421–1433. [Google Scholar] [CrossRef]
- Zhang, M.; Zhou, Q.; Chen, Z.; Jia, L.; Yong, Z.; Cai, C. Crop discrimination in Northern China with double cropping systems using Fourier analysis of time-series MODIS data. Int. J. Appl. Earth Obs. Geoinf. 2008, 10, 476–485. [Google Scholar]
- Sakamoto, T.; Yokozawa, M.; Toritani, H.; Shibayama, M.; Ishitsuka, N.; Ohno, H. A crop phenology detection method using time-series MODIS data. Remote Sens. Environ. 2005, 96, 366–374. [Google Scholar] [CrossRef]
- Tarnavsky, E.; Garrigues, S.; Brown, M.E. Multiscale geostatistical analysis of AVHRR, SPOT-VGT, and MODIS global NDVI products. Remote Sens. Environ. 2008, 112, 535–549. [Google Scholar] [CrossRef]
- Fensholt, R.; Rasmussen, K.; Nielsen, T.T.; Mbow, C.; Rasmussen, K.; Nielsen, T.T.; Mbow, C. Evaluation of earth observation based long term vegetation trends—Intercomparing NDVI time series trend analysis consistency of Sahel from AVHRR GIMMS, Terra MODIS and SPOT VGT data. Remote Sens. Environ. 2009, 113, 1886–1898. [Google Scholar] [CrossRef]
- Aschbacher, J.; Milagro-Pérez, M.P. The European Earth monitoring (GMES) programme: Status and perspectives. Remote Sens. Environ. 2012, 120, 3–8. [Google Scholar] [CrossRef]
- Dierckx, W.; Sterckx, S.; Benhadj, I.; Livens, S.; Duhoux, G.; Achteren, T.V.; Francois, M.; Mellab, K.; Saint, G. PROBA-V mission for global vegetation monitoring: Standard products and image quality. Int. J. Remote Sens. 2014, 35, 2589–2614. [Google Scholar] [CrossRef]
- Petitjean, F.; Inglada, J.; Gancarski, P. Assessing the quality of temporal high-resolution classifications with low-resolution satellite image time series. Int. J. Remote Sens. 2014, 35, 2693–2712. [Google Scholar] [CrossRef]
- Roumenina, E.; Atzberger, C.; Vassilev, V.; Dimitrov, P.; Kamenova, I.; Banov, M.; Filchev, L.; Jelev, G. Single- and multi-date crop identification using PROBA-V 100 and 300 m S1 products on Zlatia test site, Bulgaria. Remote Sens. 2015, 7, 13843–13862. [Google Scholar] [CrossRef]
- Vassilev, V.S. Crop identification mapping on the arable territory of Bulgaria using multi-temporal 100 m PROBA-V NDVI data for 2014. C. R. Acad. Bulg. Sci. 2015, 68, 761–766. [Google Scholar]
- Memarsadeghi, N.; Mount, D.M.; Netanyahu, N.S.; Le Moigne, J. A fast implementation of the ISODATA clustering algorithm. Int. J. Comput. Geom. Appl. 2007, 17, 71–103. [Google Scholar] [CrossRef]
- Ball, G.H.; Hall, D.J. ISODATA, A Novel Method of Data Analysis and Pattern Classification; Technical Report for Stanford RI; Stanford Research Institute: Menlo Park, CA, USA, 1965. [Google Scholar]
- Eerens, H.; Haesen, D.; Rembold, F.; Urbano, F.; Tote, C.; Bydekerke, L. Image time series processing for agriculture monitoring. Environ. Model. Softw. 2014, 53, 154–162. [Google Scholar] [CrossRef]
- Jönsson, P.; Eklundh, L. TIMESAT—A program for analyzing time-series of satellite sensor data. Comput. Geosci. 2004, 30, 833–845. [Google Scholar] [CrossRef]
- Global Earth Observation System of Systems (GEOSS), Joint Experiment of Crop Assessment and Monitoring. Available online: http://www.jecam.org/ (accessed on 18 August 2014).
- Liu, Y.; Yang, R.; Long, H.; Gao, J.; Wang, J. Implications of land-use change in rural China: A case study of Yucheng, Shandong province. Land Use Policy 2014, 40, 111–118. [Google Scholar] [CrossRef]
- Cheng, Z.; Meng, J.; Wang, Y. Improving spring maize yield estimation at field scale by assimilating time-series HJ-1 CCD data into the WOFOST model using a new method with fast algorithms. Remote Sens. 2016, 8, 303. [Google Scholar] [CrossRef]
- Wolters, E.; Dierckx, W.; Swinnen, E. PROBA-V Products User Manual v1.3; VITO: Mol, Belgium, 2014; Available online: proba-v.vgt.vito.be/sites/default/files/Product_User_Manual.pdf (accessed on 31 August 2015).
- Zhang, M.; Wu, B.; Yu, M.; Zou, W.; Zheng, Y. Crop condition assessment with adjusted NDVI using the uncropped Arable Land Ratio. Remote Sens. 2014, 6, 5774–5794. [Google Scholar] [CrossRef]
- Zhang, M.; Wu, B.; Meng, J. Quantifying winter wheat residue biomass with a spectral angle index derived from China Environmental Satellite data. Int. J. Appl. Earth Obs. Geoinf. 2014, 32, 105–113. [Google Scholar] [CrossRef]
- Atzberger, C.; Eilers, P.H.C. Evaluating the effectiveness of smoothing algorithms in the absence of ground reference measurements. Int. J. Remote Sens. 2011, 32, 3689–3709. [Google Scholar] [CrossRef]
- Swets, D.L.; Reed, B.C.; Rowland, J.D.; Marko, S.E. A weighted least-squares approach to temporal NDVI smoothing. In Proceedings of the 1999 ASPRS Annual Conference: From Image to Information, Portland, OR, USA, 17–21 May 1999; pp. 17–21.
- Reed, B.C.; Brown, J.F.; Vanderzee, D.; Loveland, T.R.; Merchant, J.W.; Ohlen, D.O. Measuring phenological variability from satellite imagery. J. Veg. Sci. 1994, 5, 703–714. [Google Scholar] [CrossRef]
- Jonsson, P.; Eklundh, L. Seasonality extraction by function fitting to time-series of satellite sensor data. IEEE Trans. Geosci. Remote Sens. 2002, 40, 1824–1832. [Google Scholar] [CrossRef]
- Ren, R.; Guo, S.; Gu, L. Fast bowtie effect elimination for MODIS L 1B data. J. China Univ. Posts Telecommun. 2010, 17, 120–126. [Google Scholar] [CrossRef]
- Baruth, B.; Royer, A.; Klisch, A.; Genovese, G. The use of remote sensing within the MARS crop yield monitoring system of the European Commission. Int. Arch. Photogramm. Remote Sens. Spat. Inf. Sci. 2008, 37, 935–940. [Google Scholar]
- Pittman, K.; Hansen, M.C.; Becker-Reshef, I.; Potapov, P.V.; Justice, C.O. Estimating global cropland extent with multi-year MODIS data. Remote Sens. 2010, 2, 1844–1863. [Google Scholar] [CrossRef]
- Fritz, S.; You, L.; Bun, A.; See, L.; Mccallum, I.; Schill, C.; Perger, C.; Liu, J.; Hansen, M.; Obersteiner, M. Cropland for sub-Saharan Africa: A synergistic approach using five land cover data sets. Geophys. Res. Lett. 2011, 38, 155–170. [Google Scholar] [CrossRef]
- Fritz, S.; See, L.; Mccallum, I.; You, L.; Bun, A.; Moltchanova, E.; Duerauer, M.; Albrecht, F.; Schill, C.; Perger, C. Mapping global cropland and field size. Glob. Chang. Biol. 2015, 21, 1980–1992. [Google Scholar] [CrossRef] [PubMed] [Green Version]
- Peña-Barragán, J.M.; Ngugi, M.K.; Plant, R.E.; Six, J. Object-based crop identification using multiple vegetation indices, textural features and crop phenology. Remote Sens. Environ. 2011, 115, 1301–1316. [Google Scholar] [CrossRef]
- Sterckx, S.; Benhadj, I.; Duhoux, G.; Livens, S.; Dierckx, W.; Goor, E.; Adriaensen, S.; Heyns, W.; Hoof, K.V.; Strackx, G. The PROBA-V mission: Image processing and calibration. Int. J. Remote Sens. 2014, 35, 2565–2588. [Google Scholar] [CrossRef]
- Mica, S.; Galli, L.; Duhoux, G.; Livens, S.; Jovanovic, V.; Giustiniani, A.; Dries, J.C.; Zender, J.; Santandrea, S. PROBA-V geometric calibration. In Proceedings of the 2012 IEEE International Geoscience and Remote Sensing Symposium, Munich, Germany, 22–27 July 2012; pp. 1034–1037.
- Xiong, J.; Toller, G.; Chiang, V.; Sun, J.; Esposito, J.; Barnes, W. MODIS Level 1b Algorithm Theoretical Basis Document; Goddard Space Flight Center, National Aeronautics and Space Administration: Greenbelt, MD, USA, 2005.
- Sayer, A.M.; Hsu, N.C.; Bettenhausen, C. Implications of MODIS bowtie distortion on aerosol optical depth retrievals, and techniques for mitigation. Atmos. Meas. Tech. Discuss. 2015, 8, 8727–8752. [Google Scholar] [CrossRef]
- Gómezlandesa, E.; Rango, A.; Bleiweiss, M. An algorithm to address the MODIS bowtie effect. Can. J. Remote Sens. 2004, 30, 644–650. [Google Scholar] [CrossRef]
- Li, Y.; Shi, Z. A research on an algorithm for removing bowtie effect. In Proceedings of the 2011 Symposium of Photonics and Optoelectronics (SOPO), Wuhan, China, 16–18 May 2011; pp. 1–4.


| Location | Data | Time | Number of Images | Invalid Images | Percentage of Images Used for Smoothing |
|---|---|---|---|---|---|
| Yucheng | S5 100 m | 1 October 2014–26 September 2015 | 72 | 20 | 72% |
| S1 300 m | 1 October 2014–30 September 2015 | 365 | 120 | 67% | |
| Hongxing | S5 100 m | 1 May 2014–26 November 2014 | 42 | 2 | 95% |
| S1 300 m | 1 May 2014–30 November 2014 | 213 | 28 | 87% |
| Proba-V Classification | |||||
|---|---|---|---|---|---|
| Reference Data | |||||
| Wheat-Maize | Other | Total | User Acc. | Commission | |
| Wheat-Maize | 48,592 | 17,351 | 65,943 | 73.69% | 26.31% |
| Other | 9052 | 24,245 | 33,297 | 72.81% | 27.19% |
| Total | 57,644 | 41,596 | 99,240 | ||
| Prod. Acc. | 84.30% | 58.29% | |||
| Omission | 15.70% | 41.71% | |||
| Overall Accuracy = 73.39%, Kappa Coefficient = 0.44 | |||||
| Field Accuracy = 143/146 (97.85%) | |||||
| MODIS Classification | |||||
| Reference Data | |||||
| Wheat-Maize | Other | Total | User Acc. | Commission | |
| Wheat-Maize | 7270 | 2973 | 10,243 | 70.98% | 29.02% |
| Other | 1451 | 3366 | 4817 | 69.88% | 30.12% |
| Total | 8721 | 6339 | 15,060 | ||
| Prod. Acc. | 83.36% | 53.10% | |||
| Omission | 16.64% | 46.90% | |||
| Overall Accuracy = 70.62%, Kappa Coefficient = 0.38 | |||||
| Field Accuracy = 132/146 (90.41%) | |||||
| Proba-V Classification | ||||||
|---|---|---|---|---|---|---|
| Reference Data | ||||||
| Maize | Soybean | Wheat | Total | User Acc. | Commission | |
| Maize | 6581 | 1322 | 33 | 7936 | 82.93% | 17.07% |
| Soybean | 4104 | 8862 | 82 | 13,048 | 67.92% | 32.08% |
| Wheat | 225 | 362 | 1372 | 1959 | 70.04% | 29.96% |
| Total | 10,910 | 10,546 | 1487 | 22,943 | ||
| Prod. Acc. | 60.32% | 84.03% | 92.27% | |||
| Omission | 39.68% | 15.97% | 7.73% | |||
| Overall Accuracy = 73.29%, Kappa Coefficient = 0.53 | ||||||
| MODIS Classification | ||||||
| Reference Data | ||||||
| Maize | Soybean | Wheat | Total | User Acc. | Commission | |
| Maize | 142 | 214 | 5 | 361 | 39.34% | 60.66% |
| Soybean | 1164 | 1036 | 7 | 2207 | 46.94% | 53.06% |
| Wheat | 10 | 9 | 62 | 81 | 76.54% | 23.46% |
| Total | 1316 | 1259 | 74 | 2649 | ||
| Prod. Acc. | 10.84% | 82.42% | 83.78% | |||
| Omission | 89.16% | 17.58% | 16.22% | |||
| Overall Accuracy = 46.81%, Kappa Coefficient = 0.01 | ||||||
| Location | Crop | Phenology/Farm Operation | Observed | TIMSAT Result | Gap |
|---|---|---|---|---|---|
| Yu Cheng | Winter wheat | Emergence | 8 October | 10 October | 2 |
| Wintering | 6 December | ||||
| Tillering | 4 March | ||||
| Flowering | 8 May | 5 May | 3 | ||
| Harvest | 5–15 June | 14 June | 0 | ||
| Summer maize | Emergence | 20 June | 26 June | 6 | |
| Flowering | 6 September | 30 August | 7 | ||
| Harvest | 20–30 September | 30 September | 0 | ||
| Hongxing | Maize | Emergence | 15 May | 17 May | 2 |
| Flowering | 20 August | 13 August | 7 | ||
| Harvest | 8 October | 3 October | 5 | ||
| Soybean | Emergence | 15 May | 19 May | 4 | |
| Flowering | 22 August | 20 August | 2 | ||
| Harvesting | 10 September | 18 September | 8 | ||
| Wheat | Emergence | 1 May | 1 May | 0 | |
| Flowering | 21 June | 20 June | 1 | ||
| Harvest | 10 August | 23 September | 44 |
© 2016 by the authors; licensee MDPI, Basel, Switzerland. This article is an open access article distributed under the terms and conditions of the Creative Commons Attribution (CC-BY) license (http://creativecommons.org/licenses/by/4.0/).
Share and Cite
Zhang, X.; Zhang, M.; Zheng, Y.; Wu, B. Crop Mapping Using PROBA-V Time Series Data at the Yucheng and Hongxing Farm in China. Remote Sens. 2016, 8, 915. https://doi.org/10.3390/rs8110915
Zhang X, Zhang M, Zheng Y, Wu B. Crop Mapping Using PROBA-V Time Series Data at the Yucheng and Hongxing Farm in China. Remote Sensing. 2016; 8(11):915. https://doi.org/10.3390/rs8110915
Chicago/Turabian StyleZhang, Xin, Miao Zhang, Yang Zheng, and Bingfang Wu. 2016. "Crop Mapping Using PROBA-V Time Series Data at the Yucheng and Hongxing Farm in China" Remote Sensing 8, no. 11: 915. https://doi.org/10.3390/rs8110915