
Assessment of Mining Extent and Expansion in Myanmar Based on Freely-Available Satellite Imagery

 ,
,
Abstract
:
1. Introduction
2. Materials and Methods
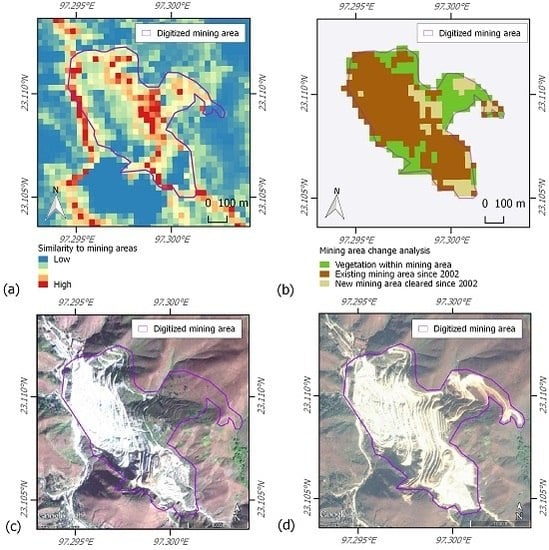
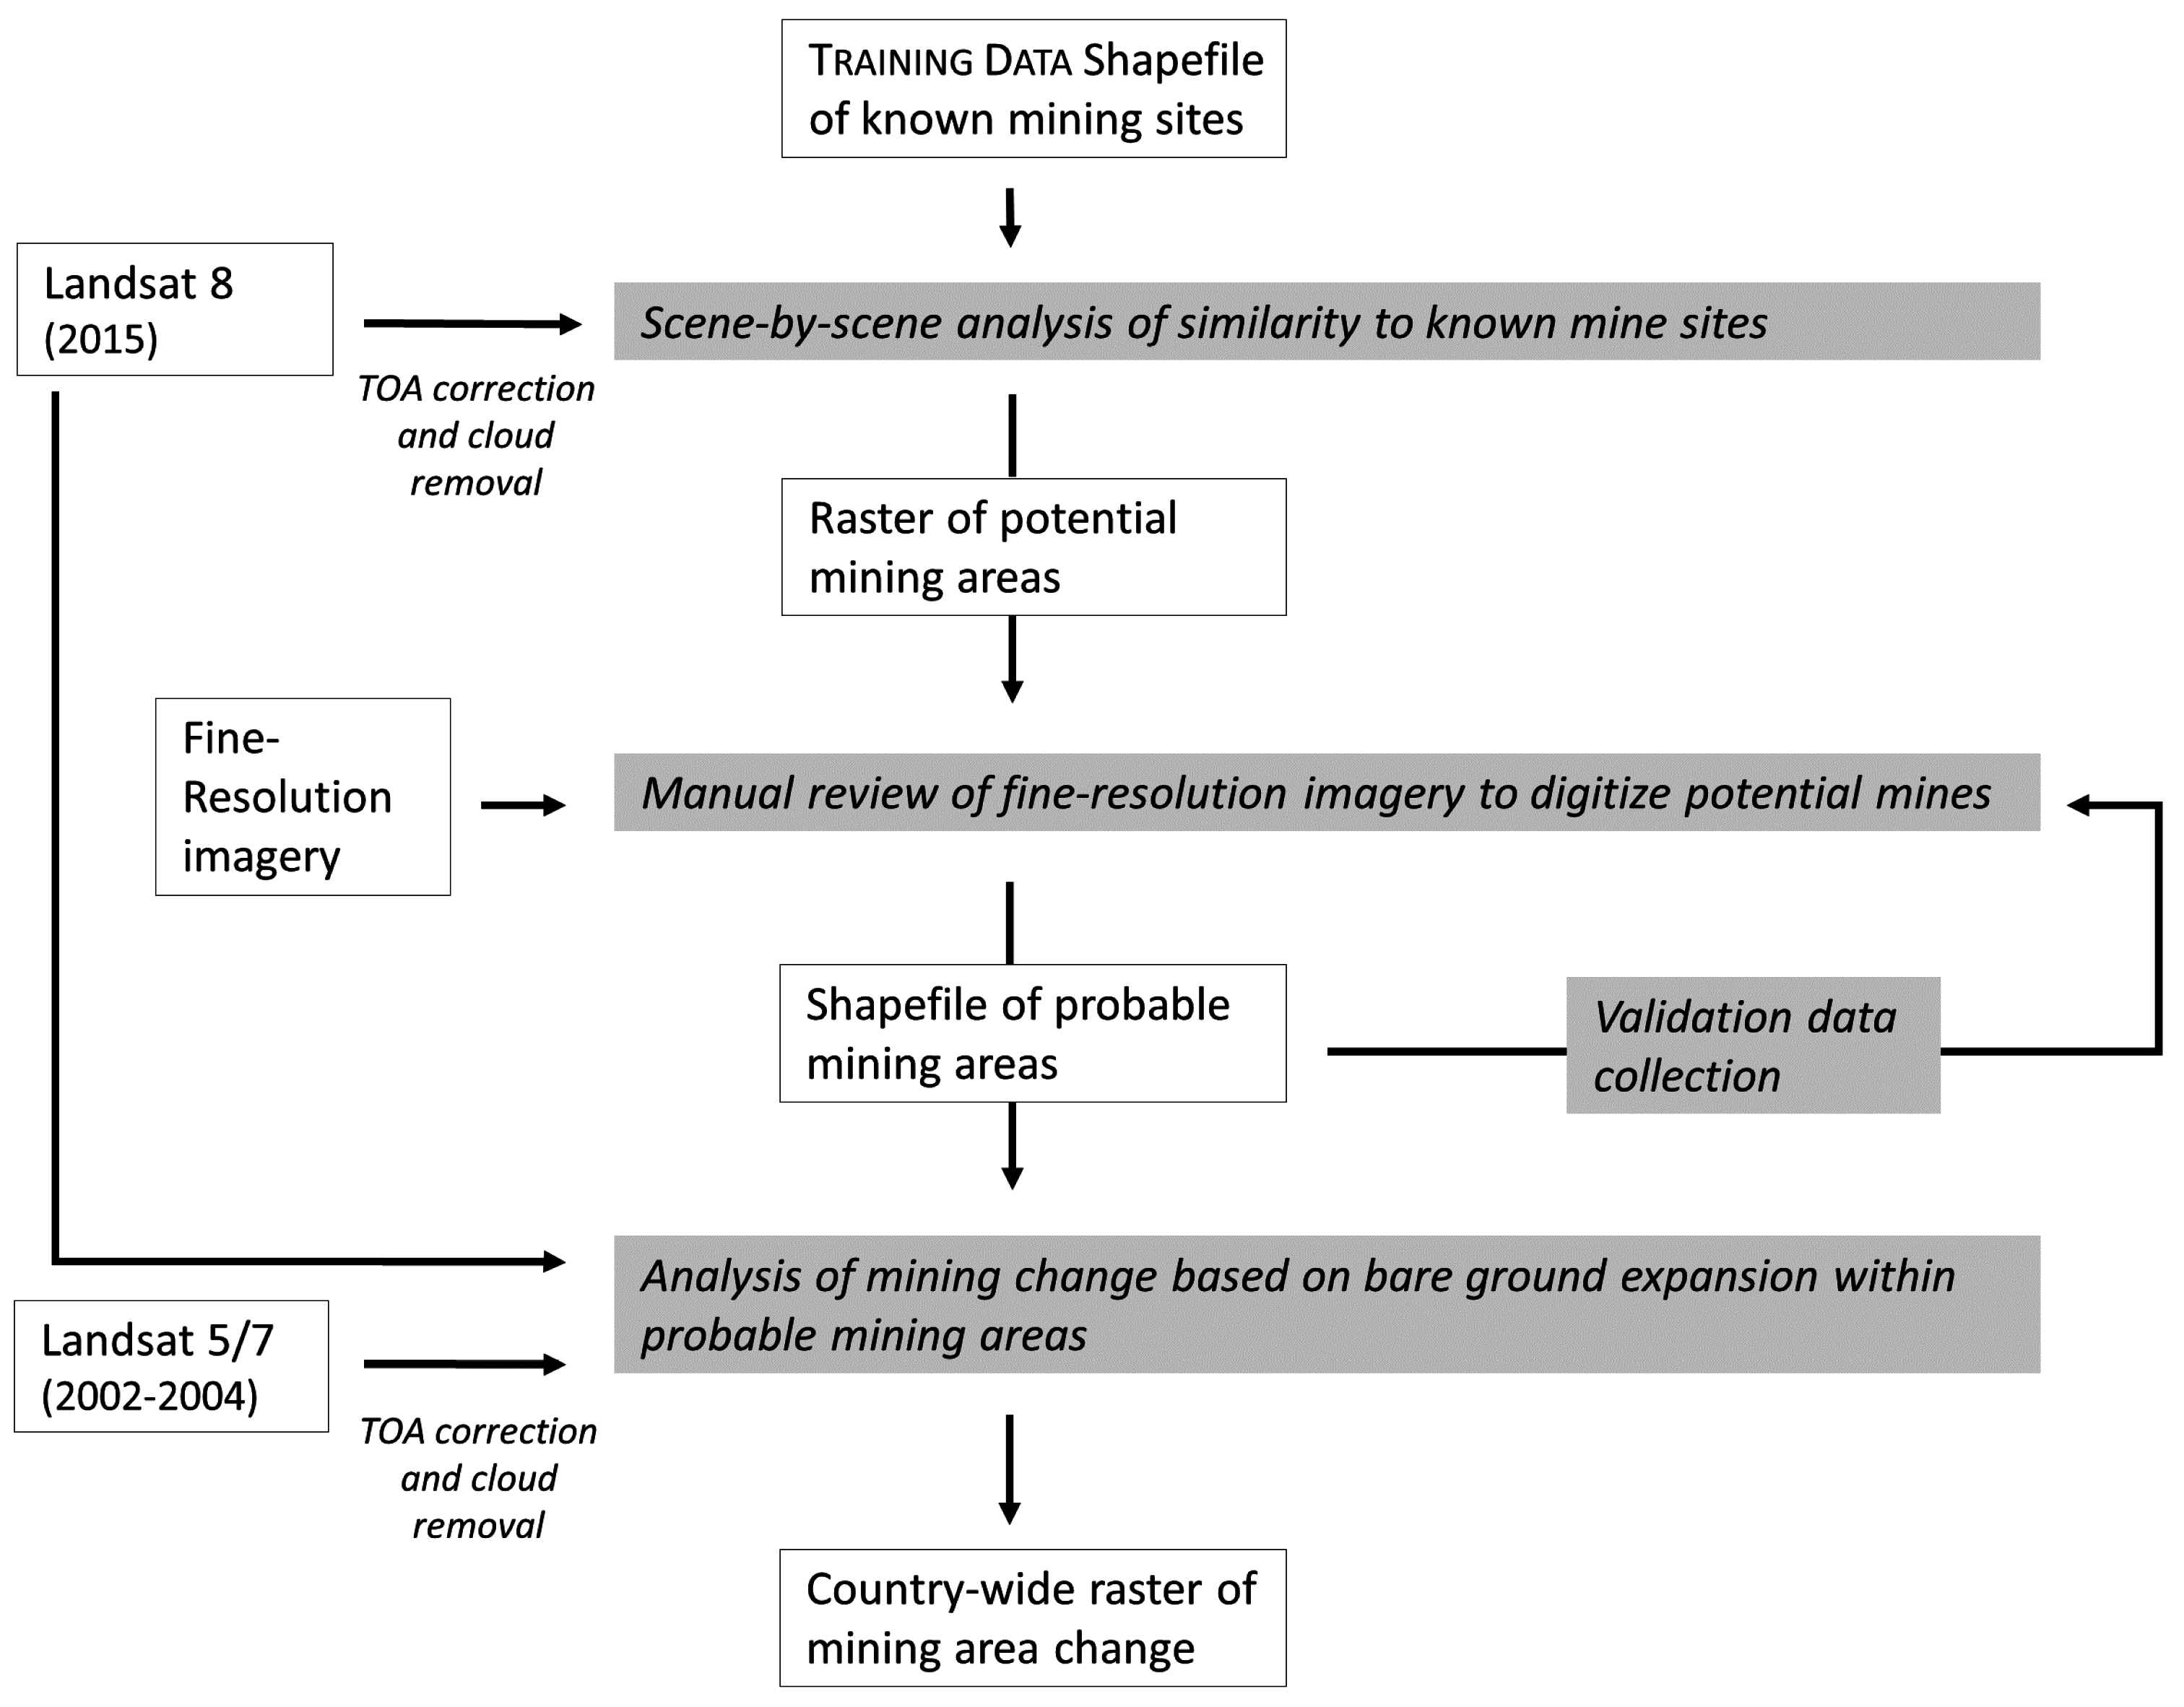
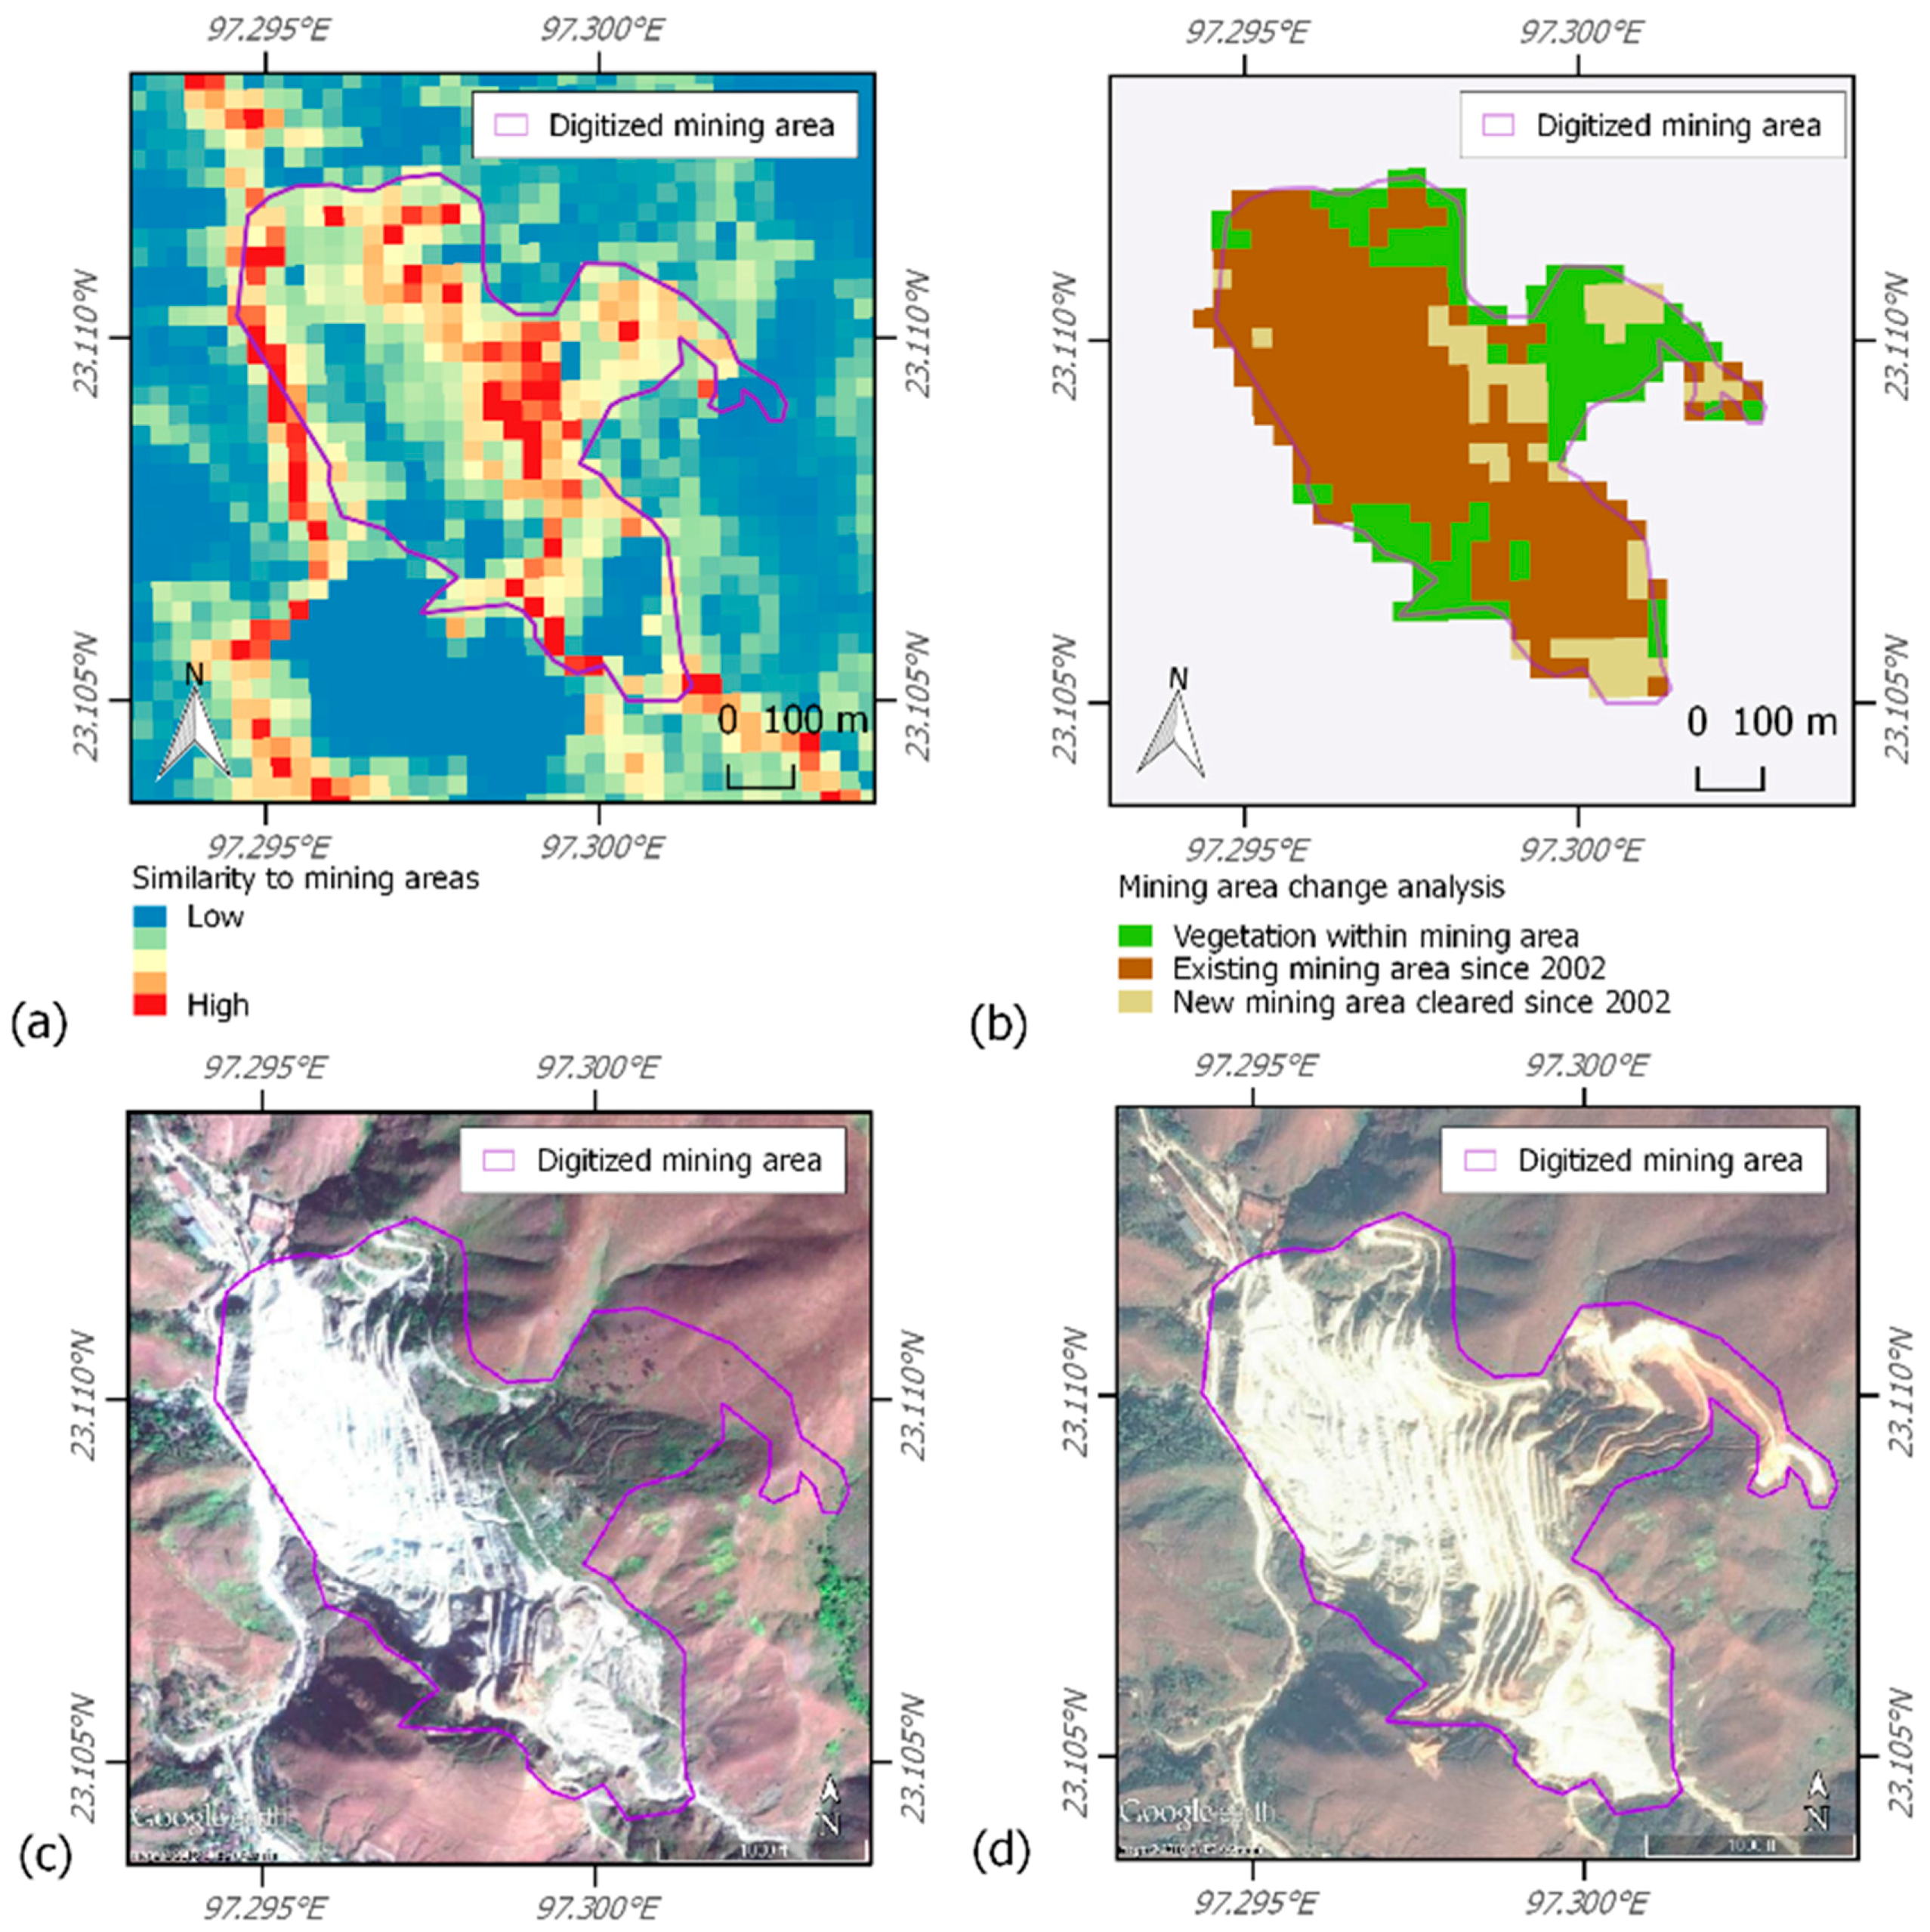
2.1. Identification of Potential Mining Areas
- Normalized Difference Vegetation Index (NDVI): (Band 5 − Band 4)/(Band 5 + Band 4)
- Normalized Burn Ratio (NBR): (Band 5 − Band 7)/(Band 5 + Band 7)
- Normalized Difference Moisture Index (NDMI): (Band 5 − Band 6)/(Band 5 + Band 6)
- Shortwave Infrared: (Band 6/1000)
- Red reflectance: (Band 4/1000)
2.2. Identification of Current Mines with Fine-Resolution Imagery
2.3. Validation Data Collection
2.4. Calculating Mining Area Change
- (a)
- The difference in albedo was large, indicating a change from vegetation (low albedo) to bare ground (high albedo), such that:where .
- (b)
- The new bare ground was very bright, likely indicating a mining area as opposed to natural reflectance, such that:where .
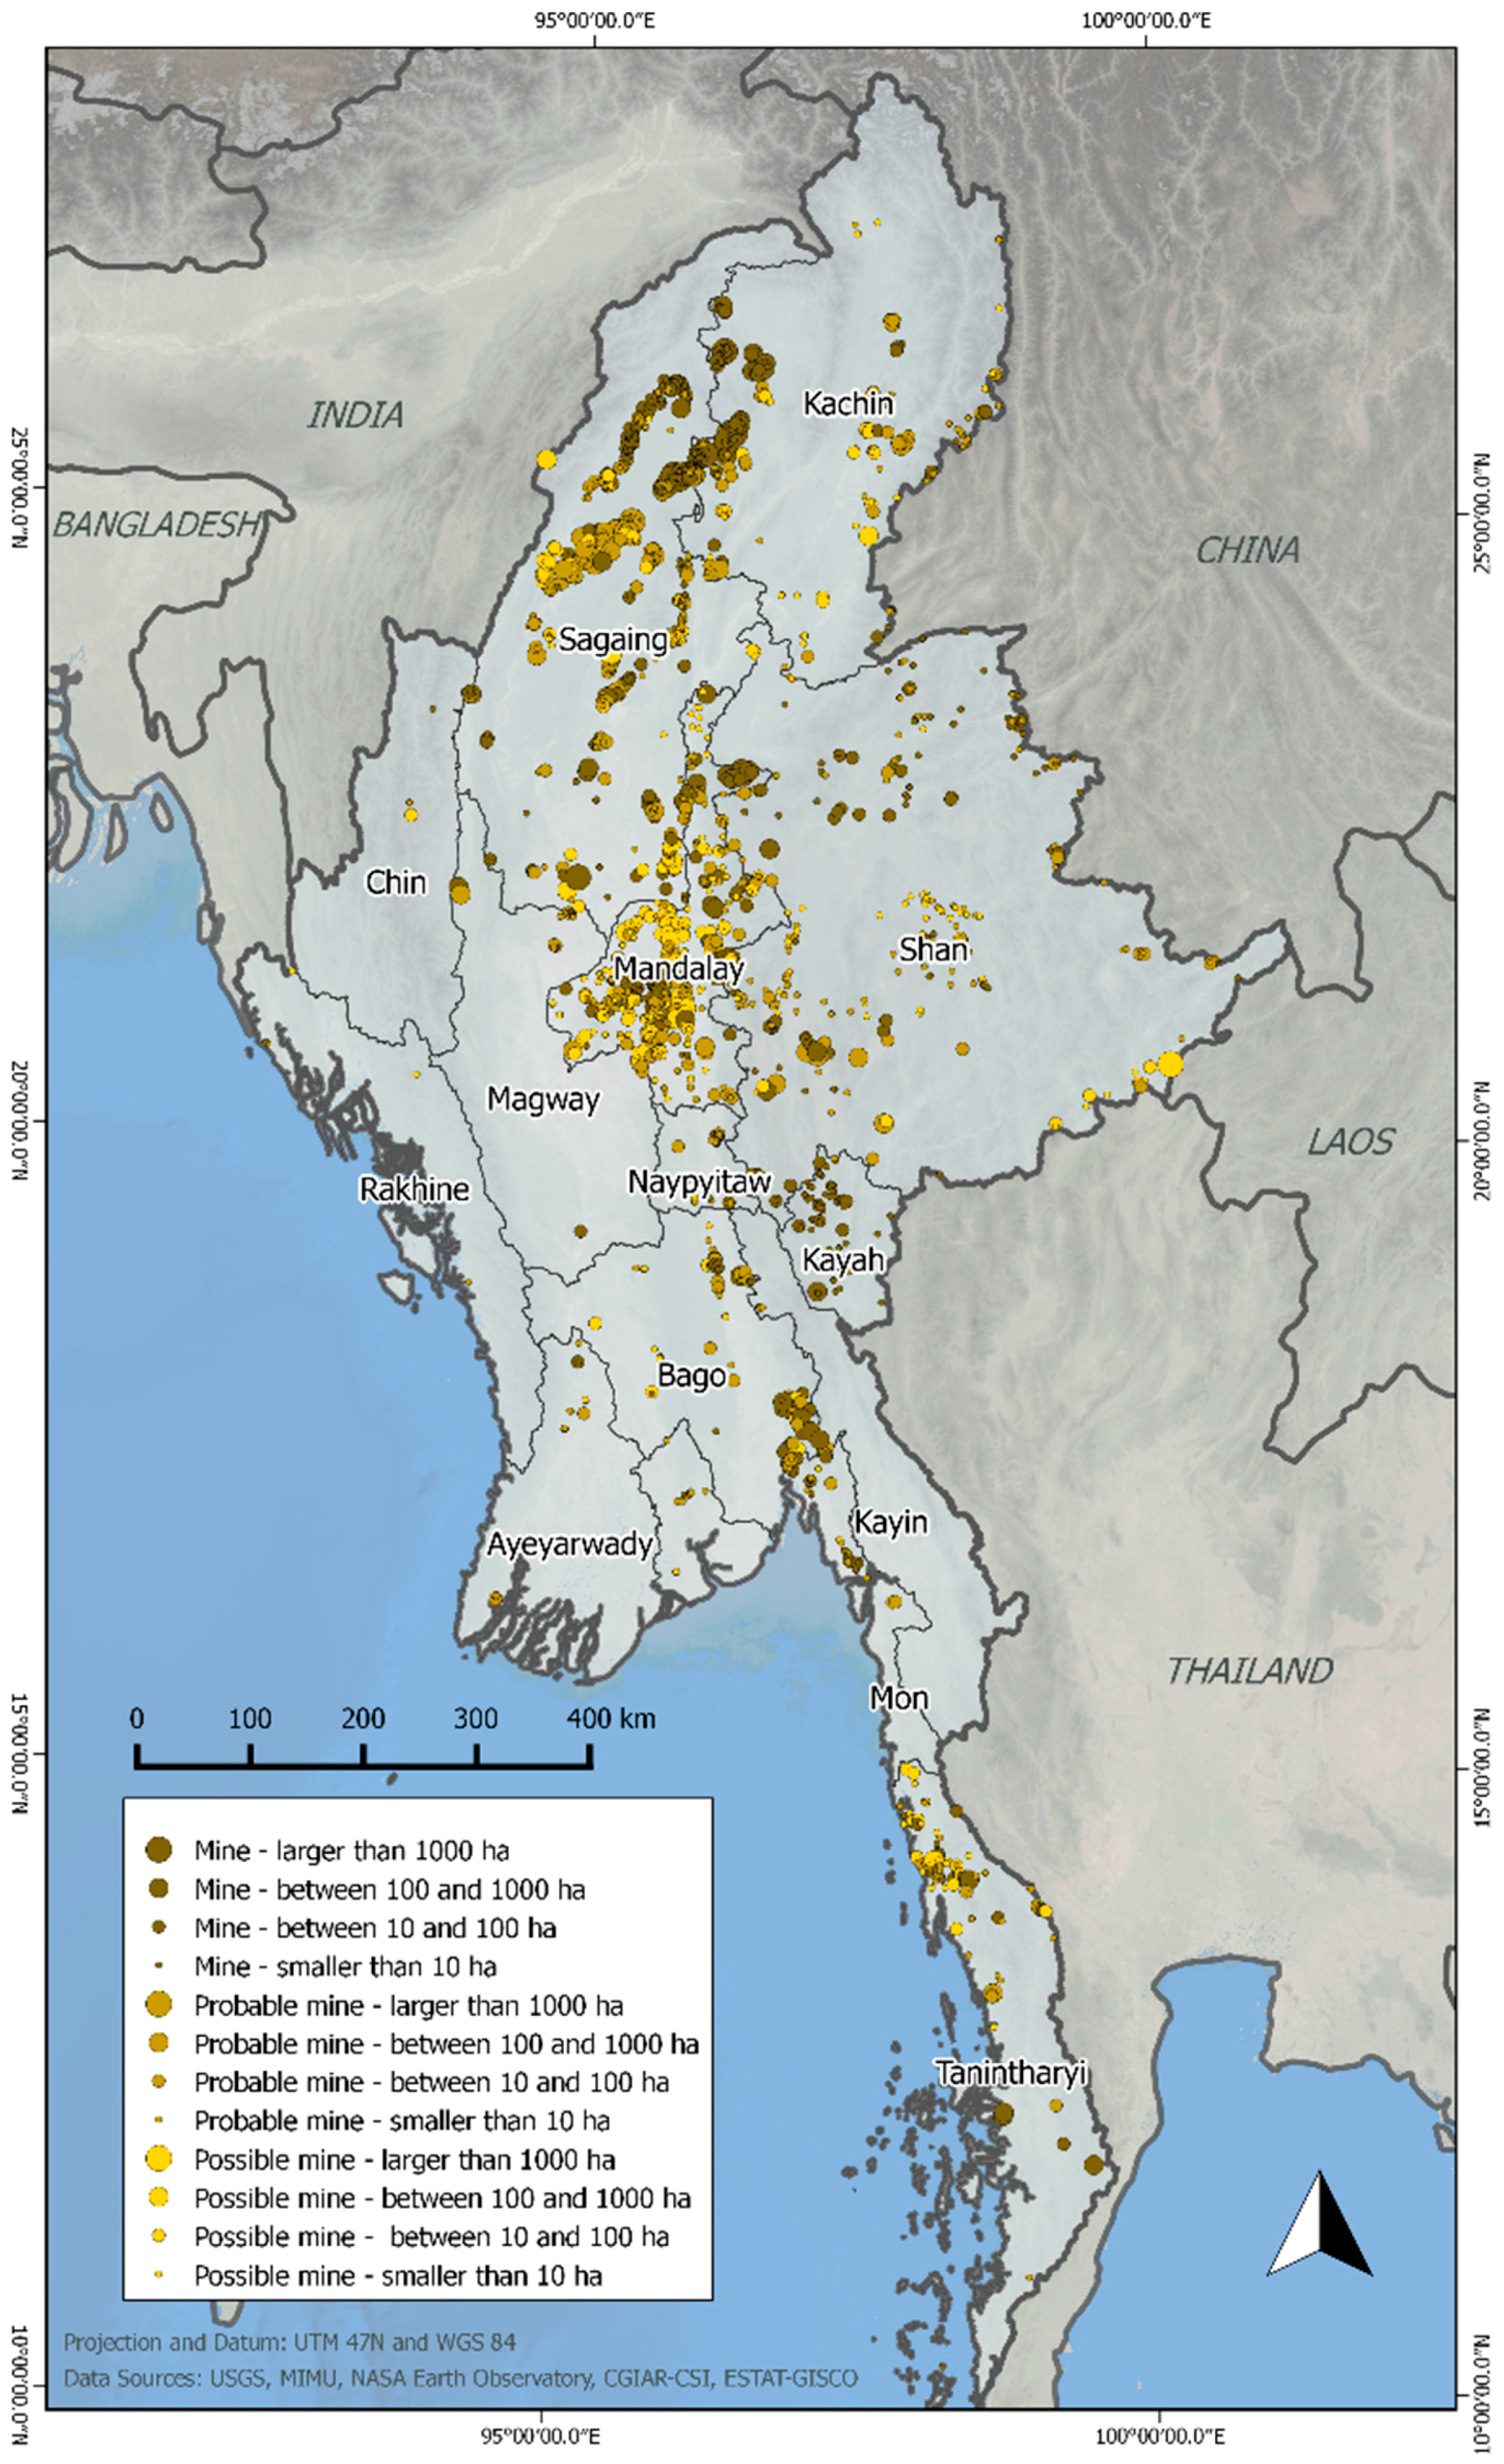
3. Results
3.1. Mining in 2015
3.2. Mining Area Change between 2002 and 2015
4. Discussion
Caveats and Limitations
5. Conclusions
Supplementary Materials
Acknowledgments
Author Contributions
Conflicts of Interest
References
- Win, S.; Myint, M.M. Mineral potential of Myanmar. Resour. Geol. 1998, 48, 209–218. [Google Scholar] [CrossRef]
- Gardiner, N.J.; Robb, L.J.; Searle, M.P. The metallogenic provinces of Myanmar. Appl. Earth Sci. 2014, 123, 25–38. [Google Scholar] [CrossRef]
- Htun, K. Sustainable mining in Myanmar. Appl. Environ. Res. 2014, 36, 25–35. [Google Scholar]
- Linn, S.N. Myanmar’s Mining Investment and Its Discontents; East Asia Forum: Canbarra, Australia, 2015. [Google Scholar]
- Oxford Business Group. Myanmar Mining to Welcome New Wave of FDI. Economic News. 26 February 2016. Available online: http://www.oxfordbusinessgroup.com/news/myanmar-mining-welcome-new-wave-fdi (accessed on 11 April 2016).
- Hughes, C.; Toime, M. Myanmar Mining—An Update on Recent Developments. Berwin, Leighton, and Paisner, LLP. Available online: https://www.blplaw.com/expert-legal-insights/articles/myanmar-mining-update-recent-developments (accessed on 11 April 2016).
- Osawa, T.; Hatsukawa, Y. Artisanal and small-scale gold mining in Myanmar. Int. J. Hum. Cult. Stud. 2015, 2015, 221–230. [Google Scholar] [CrossRef]
- Kristensen, A.K.B.; Thomsen, J.F.; Mikkelsen, S. A review of mercury exposure among artisanal small-scale gold miners in developing countries. Int. Arch. Occup. Environ. Health 2014, 87, 579–590. [Google Scholar] [CrossRef] [PubMed]
- Lynn, T.A.; Oye, M. Natural Resources and Subnational Governments in Myanmar: Key Considerations for Wealth Sharing; Subnational Governance in Myanmar Discussion Paper Series; The Asia Foundation: San Francisco, CA, USA, 2014. [Google Scholar]
- Woods, K. Commercial Agriculture Expansion in Myanmar: Links to deforestation, Conversion Timber, and Land Conflicts; Forest Trends: Washington, DC, USA, 2015. [Google Scholar]
- Sabins, F.F. Remote sensing for mineral exploration. Ore Geol. Rev. 1999, 14, 157–183. [Google Scholar] [CrossRef]
- Gabr, S.; Ghulam, A.; Kusky, T. Detecting areas of high-potential gold mineralization using ASTER data. Ore Geol. Rev. 2010, 38, 59–69. [Google Scholar] [CrossRef]
- Kooistra, L.; Salas, E.A.L.; Clevers, J.; Wehrens, R.; Leuven, R.; Nienhuis, P.H.; Buydens, L.M.C. Exploring field vegetation reflectance as an indicator of soil contamination in river floodplains. Environ. Pollut. 2004, 127, 281–290. [Google Scholar] [CrossRef]
- Choe, E.; van der Meer, F.; van Ruitenbeek, F.; van der Werff, H.; de Smeth, B.; Kim, K.-W. Mapping of heavy metal pollution in stream sediments using combined geochemistry, field spectroscopy, and hyperspectral remote sensing: A case study of the Rodalquilar mining area, SE Spain. Remote Sens. Environ. 2008, 112, 3222–3233. [Google Scholar] [CrossRef]
- Townsend, P.A.; Helmers, D.P.; Kingdon, C.C.; McNeil, B.E.; de Beurs, K.M.; Eshleman, K.N. Changes in the extent of surface mining and reclamation in the Central Appalachians detected using a 1976–2006 Landsat time series. Remote Sens. Environ. 2009, 113, 62–72. [Google Scholar] [CrossRef]
- Petropoulos, G.P.; Partsinevelos, P.; Mitraka, Z. Change detection of surface mining activity and reclamation based on a machine learning approach of multi-temporal Landsat TM imagery. Geocarto Int. 2013, 28, 323–342. [Google Scholar] [CrossRef]
- Prakash, A.; Gupta, R.P. Land-use mapping and change detection in a coal mining area-a case study in the Jharia coalfield, India. Int. J. Remote Sens. 1998, 19, 391–410. [Google Scholar] [CrossRef]
- Latifovic, R.; Fytas, K.; Chen, J.; Paraszczak, J. Assessing land cover change resulting from large surface mining development. Int. J. Appl. Earth Obs. Geoinf. 2005, 7, 29–48. [Google Scholar] [CrossRef]
- Schimmer, R. A remote sensing and GIS method for detecting land surface areas covered by copper mill tailings. In Proceedings of the Pecora 17—The Future of Land Imaging…Going Operational, Denver, CO, USA, 18–20 November 2008.
- Demirel, N.; Emil, M.K.; Duzgun, H.S. Surface coal mine area monitoring using multi-temporal high-resolution satellite imagery. Int. J. Coal Geol. 2011, 86, 3–11. [Google Scholar] [CrossRef]
- Maxwell, A.E.; Warner, T.A.; Strager, M.P.; Pal, M. Combining RapidEye satellite imagery and LiDAR for mapping of mining and mine reclamation. Photogramm. Eng. Remote Sens. 2014, 80, 179–189. [Google Scholar] [CrossRef]
- Asner, G.P.; Llactayo, W.; Tupayachi, R.; Luna, E.R. Elevated rates of gold mining in the Amazon revealed through high-resolution monitoring. Proc. Natl. Acad. Sci. USA 2013, 110, 18454–18459. [Google Scholar] [CrossRef] [PubMed]
- Akiwumi, F.A.; Butler, D.R. Mining and environmental change in Sierra Leone, West Africa: A remote sensing and hydrogeomorphological study. Environ. Monit. Assess. 2007, 142, 309–318. [Google Scholar] [CrossRef] [PubMed]
- Fernández-Manso, A.; Quintano, C.; Roberts, D. Evaluation of potential of multiple endmember spectral mixture analysis (MESMA) for surface coal mining affected area mapping in different world forest ecosystems. Remote Sens. Environ. 2012, 127, 181–193. [Google Scholar] [CrossRef]
- Areendran, G.; Rao, P.; Raj, K.; Mazumdar, S.; Puri, K. Land use/land cover change dynamics analysis in mining areas of Singrauli district in Madhya Pradesh, India. Trop. Ecol. 2013, 54, 239–250. [Google Scholar]
- Li, J.; Zipper, C.E.; Donovan, P.F.; Wynne, R.H.; Oliphant, A.J. Reconstructing disturbance history for an intensively mined region by time-series analysis of Landsat imagery. Environ. Monit. Assess. 2015, 187, 1–17. [Google Scholar] [CrossRef] [PubMed]
- Koruyan, K.; Deliormanli, A.H.; Karaca, Z.; Momayez, M.; Lu, H.; Yalçin, E. Remote sensing in management of mining land and proximate habitat. J. South. Afr. Inst. Min. Metall. 2012, 112, 667–672. [Google Scholar]
- Sen, S.; Zipper, C.; Wynne, R.; Donovan, P. Identifying revegetated mines as disturbance/recovery trajectories using an Interannual Landsat Chronosequence. Photogramm. Eng. Remote Sens. 2012, 78, 223–235. [Google Scholar] [CrossRef]
- Bhagwat, T.; Hess, A.; Horning, N.; Khaing, T.; Thein, Z.M.; Aung, K.M.; Aung, K.H.; Phyo, P.; Tun, Y.L.; Oo, A.H.; et al. Losing a jewel—Rapid declines in Myanmar’s intact forests from 2002–2014. PLoS ONE 2016. in review. [Google Scholar]
- Smith, R.B. The Heat Budget of the Earth’s Surface Deduced from Space; Yale University Center for Earth Observation: New Haven, CT, USA, 2010. [Google Scholar]
- Liang, S. Narrowband to broadband conversions of land surface albedo I: Algorithms. Remote Sens. Environ. 2001, 76, 213–238. [Google Scholar] [CrossRef]
- U.S. Geological Survey. Earth Resources Observation and Science (EROS) Center. Landsat Section. Available online: https://www.earthexplorer.usgs.gov (accessed on 21 October 2016).
- Zhu, Z.; Woodcock, C.E. Object-based cloud and cloud shadow detection in Landsat imagery. Remote Sens. Environ. 2012, 118, 83–94. [Google Scholar] [CrossRef]
- Zhu, Z.; Wang, S.; Woodcock, C.E. Improvement and expansion of the Fmask algorithm: Cloud, cloud shadow, and snow detection for Landsats 4–7, 8, and Sentinel 2 images. Remote Sens. Environ. 2015, 159, 269–277. [Google Scholar] [CrossRef]
- R Development Core Team. R: A Language and Environment for Statistical Computing; R Foundation for Statistical Computing: Vienna, Austria, 2016. [Google Scholar]
- Connette, G.; Oswald, P.; Songer, M.; Leimgruber, P. Mapping ecological forest types and degradation extent using multi-spectral Landsat imagery. Remote Sens. 2016, 8, 882. [Google Scholar] [CrossRef]
- QGIS Development Team. QGIS Geographic Information System. Available online: http://www.qgis.org/en/site/ (accessed on 1 December 2015).
- Lillesand, T.; Kiefer, R.W.; Chipman, J. Remote Sensing and Image Interpretation; John Wiley & Sons: Hoboken, NJ, USA, 2014. [Google Scholar]
- Millard, K.; Richardson, M. On the importance of training data sample selection in random forest image classification: A case study in peatland ecosystem mapping. Remote Sens. 2015, 7, 8489–8515. [Google Scholar] [CrossRef]
- Google Earth Pro v7.1.7.2602; Google: Myanmar. Available online: https://www.google.com/earth/ (accessed on 21 October 2016).
- Bing Maps; Microsoft: Myanmar. Available online: https://www.bing.com/maps (accessed on 21 October 2016).
- Paredes-Hernández, C.U.; Salinas-Castillo, W.E.; Guevara-Cortina, F.; Xicoténcatl, M. Horizontal positional accuracy of Google Earth’s imagery over rural areas: A study case in Tamaulipas, Mexico. Boletim de Ciências Geodésicas 2013, 19, 588–601. [Google Scholar] [CrossRef]
- Dudka, S.; Adriano, D.C. Environmental impacts of metal ore mining and processing: A review. J. Environ. Qual. 1997, 26, 590–602. [Google Scholar] [CrossRef]
- Malaviya, S.; Munsi, M.; Oinam, G.; Joshi, P.K. Landscape approach for quantifying land use land cover change (1972–2006) and habitat diversity in a mining area in Central India (Bokaro, Jharkhand). Environ. Monit. Assess. 2010, 170, 215–229. [Google Scholar] [CrossRef] [PubMed]
- Soulard, C.E.; Acevedo, W.; Stehman, S.V.; Parker, O.P. Mapping extent and change in surface mines within the United States for 2001 to 2006. Land Degrad. Dev. 2016, 27, 248–257. [Google Scholar] [CrossRef]
- Gardiner, N.J.; Sykes, J.P.; Trench, A.; Robb, L.J. Tin mining in Myanmar: Production and potential. Resour. Policy 2015, 46, 219–233. [Google Scholar] [CrossRef]
- Extractive Industries Transparency Initiative. Myanmar: EITI. Available online: https://eiti.org/Myanmar (accessed on 18 July 2016).
- MIMU Geonode. Available online: http://geonode.themimu.info (accessed on 31 October 2016).


| Feature Indicating a Potential Mining Area | Description |
|---|---|
| Bare ground, particularly irregularly shaped patches | Areas lacking vegetation where the ground has been disturbed. Mining ground disturbance is often unevenly distributed because it follows mineral seams. This is in contrast to construction sites that are pre-planned. |
| Pools of water with unusual or varying colors | Ponds or water retention areas with different shades of blues, greens, or browns can indicate mineral processing. |
| Changes in river color | Sediment plumes or contaminants can cause changes in the river color at and downstream of mining areas. This is often a lightening of the river color due to increased sedimentation. |
| Piles of rock or soil | Storage areas for excavated mineral or earth, including ore, tailings, or gangue material from mineral processing. |
| Ruts or pits in the earth | Areas of excavation or mineral exploration. |
| Road access | In combination with the above features, this can separate a mining area from a natural feature. |
| Industrial buildings, processing facilities, or large equipment | Particularly in remote areas, this can indicate an industrial mining operation. |
| Mining Land Cover | 2002 Land Cover | 2015 Land Cover |
|---|---|---|
| New bare ground in a mining area | Vegetated ° | Bare ground + |
| Existing bare ground in a mining area | Bare ground + | Bare ground + |
| Vegetation at mine sites | Vegetated ° | Vegetated ° |
| State/Region | Mine (High Certainty) | Probable Mine (Medium Certainty) | Possible Mine (Low Certainty) | Total Number of Hectares |
|---|---|---|---|---|
| Ayeyarwady | 25 | 97 | 7 | 129 |
| Bago | 2129 | 641 | 315 | 3085 |
| Chin | 125 | 5 | 12 | 142 |
| Kachin | 20,921 | 2293 | 1182 | 24,396 |
| Kayah 2 | 661 | 2 | - | 663 |
| Kayin | 118 | 29 | - | 147 |
| Magway | 861 | 592 | - | 1453 |
| Mandalay 2 | 6892 | 4427 | 3824 | 15,143 |
| Mon | 507 | 302 | 51 | 860 |
| Naypyitaw | 123 | 98 | 21 | 242 |
| Rakhine | 1 | 1 | 7 | 9 |
| Sagaing | 15,987 | 15,594 | 3677 | 35,258 |
| Shan 2 | 2178 | 1682 | 1791 | 5651 |
| Tanintharyi 2 | 1784 | 446 | 586 | 2816 |
| Yangon | - | 42 | 5 | 47 |
| Total | 52,312 | 26,251 | 11,478 | 90,041 |
| State/Region | New Bare Ground in a Mining Area | Existing Bare Ground in a Mining Area | Vegetation within Mining Area | Cloud Interference over a Mining Area | Total Number of Hectares | Percent of All Mining Areas Identified in Myanmar |
|---|---|---|---|---|---|---|
| Ayeyarwady | 2 | 2 | - | 21 | 25 | <0.1% |
| Bago | 853 | 204 | 975 | 97 | 2129 | 4.1% |
| Chin | 51 | - | 33 | 41 | 125 | 0.2% |
| Kachin | 7515 | 4210 | 4589 | 4607 | 20,921 | 40.0% |
| Kayah | 65 | 29 | 453 | 114 | 661 | 1.3% |
| Kayin | 18 | 1 | 99 | - | 118 | 0.2% |
| Magway | 406 | 153 | 280 | 22 | 861 | 1.6% |
| Mandalay | 976 | 3331 | 1469 | 1116 | 6892 | 13.2% |
| Mon | 254 | 19 | 148 | 86 | 507 | 1.0% |
| Naypyitaw | 80 | 6 | 31 | 6 | 123 | 0.2% |
| Rakhine | 1 | - | - | - | 1 | <0.1% |
| Sagaing | 7462 | 3437 | 3827 | 1261 | 15,987 | 30.6% |
| Shan | 520 | 184 | 625 | 849 | 2178 | 4.2% |
| Tanintharyi | 875 | 244 | 517 | 148 | 1784 | 3.4% |
| Yangon | - | - | - | - | 0 | 0.0% |
| Total | 19,078 | 11,820 | 13,046 | 8368 | 52,312 | 100.0% |
| State/Region | Mine (High Certainty) | Probable Mine (Medium Certainty) | Possible Mine (Low Certainty) |
|---|---|---|---|
| Bago | 81% | 82% | 67% |
| Chin | 100% | - | - |
| Kachin | 64% | 63% | 49% |
| Kayah | 69% | - | - |
| Kayin | 95% | - | - |
| Magway | 73% | 45% | |
| Mandalay | 23% | 19% | 16% |
| Mon | 93% | 91% | - |
| Naypyitaw | 93% | - | - |
| Rakhine | - | - | - |
| Sagaing | 68% | 86% | 68% |
| Shan | 74% | 74% | 93% |
| Tanintharyi | 78% | 73% | 82% |
| Yangon | - | - | - |
| Total | 62% | 72% | 48% |
© 2016 by the authors; licensee MDPI, Basel, Switzerland. This article is an open access article distributed under the terms and conditions of the Creative Commons Attribution (CC-BY) license (http://creativecommons.org/licenses/by/4.0/).
Share and Cite
LaJeunesse Connette, K.J.; Connette, G.; Bernd, A.; Phyo, P.; Aung, K.H.; Tun, Y.L.; Thein, Z.M.; Horning, N.; Leimgruber, P.; Songer, M. Assessment of Mining Extent and Expansion in Myanmar Based on Freely-Available Satellite Imagery. Remote Sens. 2016, 8, 912. https://doi.org/10.3390/rs8110912
LaJeunesse Connette KJ, Connette G, Bernd A, Phyo P, Aung KH, Tun YL, Thein ZM, Horning N, Leimgruber P, Songer M. Assessment of Mining Extent and Expansion in Myanmar Based on Freely-Available Satellite Imagery. Remote Sensing. 2016; 8(11):912. https://doi.org/10.3390/rs8110912
Chicago/Turabian StyleLaJeunesse Connette, Katherine J., Grant Connette, Asja Bernd, Paing Phyo, Kyaw Htet Aung, Ye Lin Tun, Zaw Min Thein, Ned Horning, Peter Leimgruber, and Melissa Songer. 2016. "Assessment of Mining Extent and Expansion in Myanmar Based on Freely-Available Satellite Imagery" Remote Sensing 8, no. 11: 912. https://doi.org/10.3390/rs8110912